Page 1/21
RE: Association of Abnormal PulmonaryVasculature on CT Scan for COVID-19 Infection withDecreased Diffusion Capacity in Follow Up: aretrospective cohort study.Daniel Salerno
Temple University HospitalIfeoma Oriaku ( [email protected] )
Temple University Hospital https://orcid.org/0000-0001-7323-8894Melinda Darnell
Temple University HospitalMaarten Lanclus
FLUIDDA IncJan De Backer
Fluidda IncBen Lavon
Fluidda IncRohit Gupta
Temple University HospitalFredric Jaffe
Temple University HospitalMaria Elena Vega Sanchez
Temple University HospitalVictor Kim
Temple University Hospital
Research Article
Keywords: Covid-19, computed tomography, diffusing capacity, pulmonary vessels
Posted Date: February 22nd, 2021
DOI: https://doi.org/10.21203/rs.3.rs-253280/v1
License: This work is licensed under a Creative Commons Attribution 4.0 International License. Read Full License

Page 2/21

Page 3/21
AbstractBackground: Coronavirus Disease 2019 (COVID-19) is a highly contagious respiratory viral illness causingpneumonia and systemic disease. Abnormalities in pulmonary function after COVID-19 infection havebeen described. The determinants of these abnormalities are unclear. We hypothesized that in�ammatorybiomarkers and CT scan parameters at the time of infection would be associated with abnormal gasexchange at short term follow-up.
Methods: We studied subjects who were hospitalized for COVID-19 pneumonia and thendischarged. Serum in�ammatory biomarkers, CT scan, and clinical characteristics were assessed duringthe hospitalization. CT images were evaluated by Functional Respiratory Imaging with automated tissuesegmentation algorithms of the lungs and pulmonary vasculature. Volumes of the pulmonary vesselsthat were ≤5mm (BV5), 5-10mm (BV5_10), and ≥10mm (BV10) in cross sectional area wereanalyzed. Additionally, the amount of opaci�cation on CT (i.e. ground glass opacities) was quanti�ed ineach patient. Pulmonary function tests were performed 2-3 months after discharge. We divided subjectsinto those with a DLCO <80% predicted (Low DLCO) and those with a DLCO ≥80% predicted (NormalDLCO) based on these pulmonary function tests.
Results: 38 subjects were included in our analysis. 31 out of 38 (81.6%) subjects had a DLCO<80%predicted. Hemoglobin, in�ammatory biomarkers, spirometry and lung volumes were similar betweengroups. CT opaci�cation and BV5 were not different between groups, but both Low and Normal DLCOgroups had lower BV5 measures compared to healthy controls. BV5_10 and BV10 measures were higherin the Low DLCO group compared to the Normal DLCO group. Both BV5_10 and BV10 in the Low DLCOgroup were greater compared to healthy controls. BV5_10 was independently associated with DLCO<80%in multivariable logistic regression (OR 1.29, 95% CI 1.01, 1.64). BV10 negatively correlated with DLCO%predicted (r=-0.343, p=0.035).
Conclusions: Low DLCO is common after COVID-19 infection, and abnormalities in pulmonary vascularvolumes at the time of hospitalization are independently associated with a low DLCO. There was norelationship between in�ammatory biomarkers during hospitalization and DLCO. These �ndings suggestthat pulmonary vascular abnormalities during hospitalization with COVID-19 might have long-lastingeffects on pulmonary function.
IntroductionCoronavirus Disease 2019 (COVID-19) is a highly contagious respiratory viral illness causing pneumonia,abnormal coagulation, and systemic disease. As of February 2021, it is responsible for over 26.5 millioninfections and more than 450,000 deaths in the United States. The disease spectrum is vast, with somepeople having mild illness whereas others develop acute respiratory distress syndrome (ARDS),multisystem organ failure, and death. It is characterized by sometimes severe and life-threateningsystemic in�ammation and immune dysregulation. [1]

Page 4/21
A hallmark feature of COVID-19 infection is dyspnea and hypoxemia. Much of the dyspnea can beexplained by the degree of pneumonia present on imaging, but not uncommonly there is a disconnectbetween the degree of hypoxemia and abnormal lung parenchyma. [2] It has been shown in an autopsyseries that those that died of COVID-19 had widespread thrombosis and microangiopathy of thepulmonary vessels [3] suggesting that pulmonary vascular disease plays an important role in thepathophysiology of hypoxemia in the infected patient. Additionally, an unusually high prevalence ofvenous thromboembolism has been reported in several studies. [4, 5]
Although COVID-19 causes an acute illness, it is now recognized that illness can be prolonged in up to62% of those infected. [6] Abnormalities in pulmonary function after COVID-19 infection have beendescribed, including restrictive impairments and reductions in diffusing capacity of carbon monoxide(DLCO). [7–11] The determinants of these abnormalities are unclear. One study found an associationwith D-dimer measured during acute illness with abnormal DLCO at follow-up. [12] A previous studydemonstrated that abnormalities in pulmonary vascular volumes as measured by automatedsegmentation algorithm were associated with COVID-19 infection. [13, 14] We hypothesized thatin�ammatory biomarkers and CT scan measures of blood vessels at the time of infection would beassociated with abnormal gas exchange at follow-up.
MethodsWe studied subjects who were hospitalized for COVID-19 pneumonia at a single center (Temple UniversityHospital, Philadelphia, Pennsylvania, USA) and then discharged between March to July 2020. Those withpre-existing lung disease (except asthma) or known reduced DLCO prior to COVID-19 infection wereexcluded from our analysis (See Fig. 1 for CONSORT Diagram). Serum in�ammatory biomarkers(including C-reactive protein [CRP], D-dimer, Ferritin, Fibrinogen, Lactose Dehydrogenase [LDH]), CT scan,and clinical characteristics were assessed during the index hospitalization. Serum in�ammatory markerswere assessed daily while in the hospital. For the sake of our analysis, admission hemoglobin and peakvalues of the in�ammatory biomarkers were compared. Pulmonary function tests, including spirometry,lung volumes, DLCO and 6-minute walk tests were performed at 2–3 months after discharge according tothe American Thoracic Society/European Respiratory Society Guidelines. [15] Normal values werecalculated in usual fashion using NHANES III normative values. [16] We divided subjects into those with aDLCO < 80% predicted (Low DLCO) and those with a DLCO ≥ 80% predicted (Normal DLCO) based onthese follow-up pulmonary function tests. This study was approved by the Institutional Review Board atTemple University.
ImagingBecause the patient scans were acquired in the course of clinical care and without a standardizedprotocol, slice thickness varied between 0.625 mm and 3.0 mm. The methods of CT analysis of thepulmonary blood volumes have been previously described. [13] Brie�y, CT images at the time ofhospitalization (hospital day 0 or 1) were evaluated by Functional Respiratory Imaging (FRI; FLUIDDA, NV,

Page 5/21
Belgium) which uses (deep learning trained) automated tissue segmentation algorithms to producequantitative measures of pulmonary tissue. Measures of the pulmonary vascular volume include the totalvascular volume and the vascular volume of the pulmonary vessels grouped using two thresholds,ultimately resulting in three categories: vessels less than 5 mm2 in cross sectional area (BV5), vesselsbigger than 5 mm2 and less than 10 mm2 in cross sectional area (BV5_10), and �nally vessels biggerthan 10 mm2 in cross sectional area (BV10). These volumes are the combined volumes of theintrapulmonary arteries and veins. Additionally, the amount of opaci�cation on CT was quanti�ed using adeep-learning algorithm trained to quantify the total extent of consolidation, ground glass opacity, edema,reticular disease and crazy paving.
StatisticsAll statistical analyses were performed using SPSS v25 (IBM, Armonk, New York, USA). The two DLCOgroups were compared with either unpaired t tests or chi squared tests for continuous or categoricalvariables, respectively. Levene’s test was used to assess equality of variances for the independentvariables of interest between the two groups. Fisher’s exact tests were used for categorical variables ifcounts per group were less than 5. Mann Whitney U tests were conducted on non-normally distributedcontinuous data. Blood volumes were compared between the low DLCO group, normal DLCO group, and apreviously analyzed cohort of 107 healthy controls without COVID-19 infection [13] using one way ANOVAwith post hoc analysis for multiple comparisons using Bonferroni tests. Correlations between pulmonaryvascular volumes and DLCO% predicted were calculated with Pearson’s test. Multivariable logisticregression for DLCO < 80% predicted was performed with vascular volumes (individual vascular volumestested in separate models to reduce collinearity) as the independent variables of interest withdemographics, smoking status, lung volumes and hemoglobin as covariates. A p value of < 0.05 wasconsidered statistically signi�cant.
ResultsBaseline subject characteristics and follow-up pulmonary function tests are presented in Table 1. Therewere 12 subjects from the initial cohort of 99 subjects that had pulmonary function tests prior to Covidinfection, and 8 were excluded due to low DLCO. There were 38 subjects who had pulmonary functiontests during follow-up and CT scans on hospital admission. 31 (81.6%) of the cohort had low DLCO, and7 had normal DLCO. The groups were similar in terms of demographics, body mass index, height,smoking status, and comorbidities. Pulmonary function tests were performed 76.5 ± 35.1 days after the�rst day of hospitalization. Spirometric measures (FEV1, FVC, FEV1/FVC) and lung volumes (TLC) weresimilar between groups. Both DLCO and DLCO adjusted for alveolar volume (DLCO/VA) were lower in theLow DLCO group.

Page 6/21
Table 1Baseline Characteristics and Follow-up PFTs.
Normal DLCO Low DLCO p
n = 7 n = 31
Age (years) 55.1 ± 15.9 59.8 ± 12.4 0.399
Gender (male) 3 (42.9) 16 (51.6) 0.676
Race 0.292
Caucasian 0 (0) 3 (9.7)
African American 2 (28.6) 18 (58.1)
Hispanic 4 (57.1) 8 (25.8)
Other 1 (14.3) 2 (6.4)
Height (inches) 64.3 ± 2.4 66.6 ± 3.9 0.138
BMI (kg/m2) 39.2 ± 9.5 33.9 ± 5.6 0.190
Smoking Status 0.585
Nonsmoker 5 (71.4) 18 (57.6)
Current Smoker 0 (0) 4 (12.9)
Former Smoker 2 (28.6) 9 (29.0)
HTN 4 (57.1) 22 (71.0) 0.656
DM 4 (57.1) 13 (41.9) 0.678
CKD 1 (14.3) 4 (12.9) 1.000
CAD 2 (28.6) 3 (9.7) 0.223
CHF 0 (0) 9 (27.9) 0.164
ESRD 0 (0) 1 (3.2) 1.000
Asthma 0 (0) 5 (16.1) 0.561
Follow Up
Days after Hosp 74.4 ± 41.8 74.9 ± 34.5 0.997
De�nition of Abbreviations: DLCO = diffusing capacity of carbon monoxide; BMI = body mass index;HTN = hypertension; DM = diabetes mellitus; CKD = chronic kidney disease; CAD = coronary arterydisease; CHF = congestive heart failure; ESRD = end stage renal disease; mMRC = modi�ed MedicalResearch Council; 6MWD = 6-minute walk distance; FEV1 = forced expiratory volume in 1 second; FVC = forced vital capacity; TLC = total lung capacity; DLCO/VA = DLCO adjusted for alveolar volume
Page 7/21
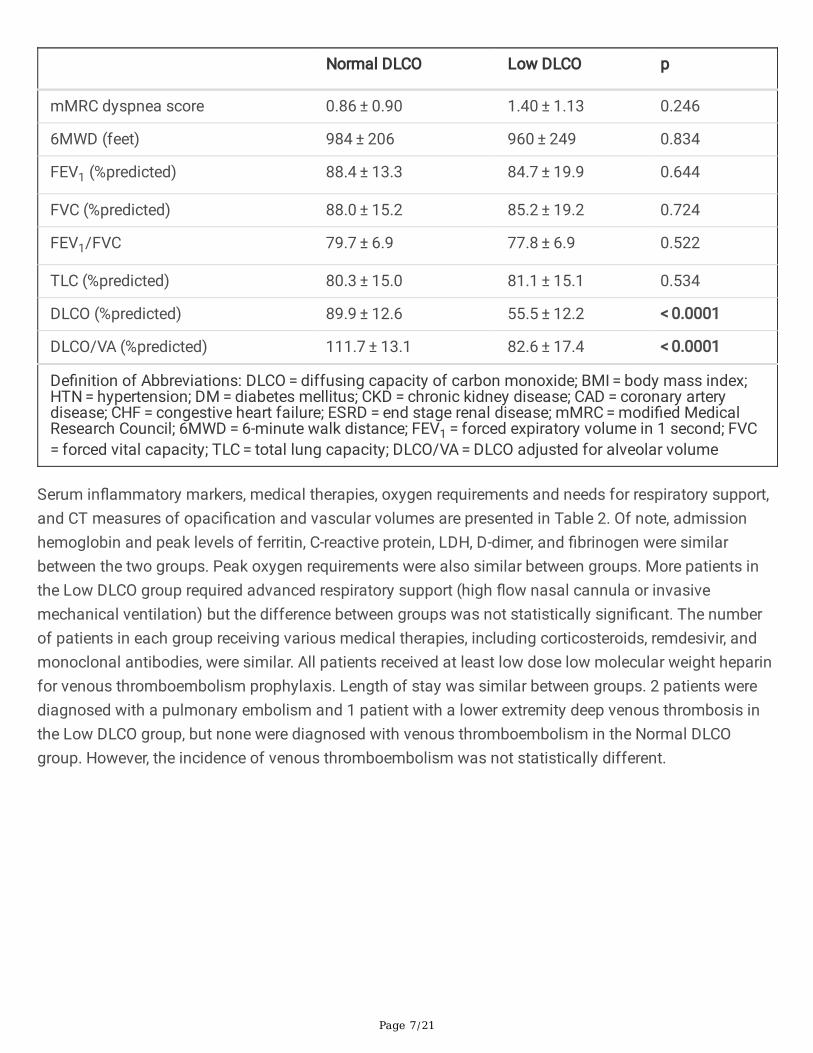
Normal DLCO Low DLCO p
mMRC dyspnea score 0.86 ± 0.90 1.40 ± 1.13 0.246
6MWD (feet) 984 ± 206 960 ± 249 0.834
FEV1 (%predicted) 88.4 ± 13.3 84.7 ± 19.9 0.644
FVC (%predicted) 88.0 ± 15.2 85.2 ± 19.2 0.724
FEV1/FVC 79.7 ± 6.9 77.8 ± 6.9 0.522
TLC (%predicted) 80.3 ± 15.0 81.1 ± 15.1 0.534
DLCO (%predicted) 89.9 ± 12.6 55.5 ± 12.2 < 0.0001
DLCO/VA (%predicted) 111.7 ± 13.1 82.6 ± 17.4 < 0.0001
De�nition of Abbreviations: DLCO = diffusing capacity of carbon monoxide; BMI = body mass index;HTN = hypertension; DM = diabetes mellitus; CKD = chronic kidney disease; CAD = coronary arterydisease; CHF = congestive heart failure; ESRD = end stage renal disease; mMRC = modi�ed MedicalResearch Council; 6MWD = 6-minute walk distance; FEV1 = forced expiratory volume in 1 second; FVC = forced vital capacity; TLC = total lung capacity; DLCO/VA = DLCO adjusted for alveolar volume
Serum in�ammatory markers, medical therapies, oxygen requirements and needs for respiratory support,and CT measures of opaci�cation and vascular volumes are presented in Table 2. Of note, admissionhemoglobin and peak levels of ferritin, C-reactive protein, LDH, D-dimer, and �brinogen were similarbetween the two groups. Peak oxygen requirements were also similar between groups. More patients inthe Low DLCO group required advanced respiratory support (high �ow nasal cannula or invasivemechanical ventilation) but the difference between groups was not statistically signi�cant. The numberof patients in each group receiving various medical therapies, including corticosteroids, remdesivir, andmonoclonal antibodies, were similar. All patients received at least low dose low molecular weight heparinfor venous thromboembolism prophylaxis. Length of stay was similar between groups. 2 patients werediagnosed with a pulmonary embolism and 1 patient with a lower extremity deep venous thrombosis inthe Low DLCO group, but none were diagnosed with venous thromboembolism in the Normal DLCOgroup. However, the incidence of venous thromboembolism was not statistically different.

Page 8/21
Table 2Group Characteristics of Hospitalization.
Normal DLCO Low DLCO p
n = 7 n = 31
Labs
Admission Hgb (g/dL) 13.6 ± 0.99 12.87 ± 1.63 0.292
Peak Ferritin (ng/mL) 247 ± 190 656 ± 751 0.138
Peak CRP (mg/dL) 8.4 ± 6.5 7.1 ± 5.0 0.597
Peak LDH (U/L) 242 ± 58 348 ± 149 0.075
Peak D-dimer (ng/mL) 538 ± 208 4676 ± 10417 0.268
Peak Fibrinogen (mg/dL) 646 ± 173 486 ± 189 0.267
Medical Therapies
Corticosteroids 1 (14.3) 12 (38.7) 0.115
Remdesivir 1 (14.3) 7 (22.6) 0.255
Anakinra 0 (0) 1 (3.2) 0.451
IVIG 0 (0) 1 (3.2) 0.451
Tocilizumab 0 (0) 4 (12.9) 0.327
CT Measures
BV5 (mL) 79.9 ± 39.9 81.0 ± 39.2 0.943
BV5_10 (mL) 42.6 ± 6.9 54.2 ± 13.3 0.005
BV10 (mL) 93.0 ± 33.4 138.1 ± 53.1 0.001
Opaci�cation (mL) 89.8 ± 90.8 221.7 ± 272.3 0.218
Hospital Characteristics
LOS (days) 4.43 ± 1.51 6.26 ± 5.96 0.429
Peak O2 Req (L/min) 0.57 ± 0.98 5.66 ± 12.55 0.433
Room Air 5 (71.4) 17 (54.8)
NC O2 2 (28.6) 8 (25.8)
De�nition of Abbreviations: DLCO = diffusing capacity of carbon monoxide; Hgb = hemoglobin; CRP = C-reactive protein; LDH = lactose dehydrogenase; IVIG = intravenous immunoglobulin; LOS = length ofstay; NC = nasal cannula; HFNC = high �ow nasal cannula; IMV = invasive mechanical ventilation; PE = pulmonary embolism; DVT = deep venous thrombosis

Page 9/21
Normal DLCO Low DLCO p
HFNC O2 0 (0) 4 (12.9) 0.650
1.000
1.000
IMV 0 (0) 2 (6.5)
New PE 0 (0) 2 (6.5)
New DVT 0 (0) 1 (3.2)
De�nition of Abbreviations: DLCO = diffusing capacity of carbon monoxide; Hgb = hemoglobin; CRP = C-reactive protein; LDH = lactose dehydrogenase; IVIG = intravenous immunoglobulin; LOS = length ofstay; NC = nasal cannula; HFNC = high �ow nasal cannula; IMV = invasive mechanical ventilation; PE = pulmonary embolism; DVT = deep venous thrombosis
Figure 2 is an example of pulmonary vessels according to size and shows the striking difference betweena patient with a normal diffusion compared to one with low diffusion. CT slice thickness was notdifferent between groups. The quantity of opaci�cation on CT scan was not different between groups(221.7 ± 272.3 vs. 89.8 ± 90.8 mL in the Low DLCO group and Normal DLCO group, respectively, p = 0.218). BV5 was not different between Low and Normal DLCO groups (81.0 ± 39.2 vs. 79.9 ± 39.9 mL, p = 0.943), but BV5 in both Low and Normal DLCO groups was lower than the healthy control group (137.0 ± 24.9 mL, p < 0.0001 for both Low and Normal DLCO groups, respectively). See Fig. 3. However, BV5_10was greater in the Low DLCO group compared to the Normal DLCO group (54.2 ± 13.3 vs. 42.6 ± 6.9 mL, p = 0.005), and BV10 was also greater in the Low DLCO group (138.1 ± 53.1 vs. 93.0 ± 33.4 mL, p = 0.001).Both BV5_10 and BV10 in the Low DLCO group were greater than the healthy controls (p < 0.0001 forboth) but there was no difference between the Normal DLCO group and healthy controls. See Fig. 4.BV5_10 was independently associated with DLCO < 80% in multivariable logistic regression (OR 1.29, 95%CI 1.01, 1.64, p = 0.041). BV10 tended to have an independent association with DLCO < 80% but it was notstatistically signi�cant (OR 1.06, 95% CI 1.00, 1.13, p = 0.072). However, BV10 had a statisticallysigni�cant negative correlation with DLCO% predicted (r=-0.343, p = 0.035). See Fig. 5.
DiscussionWe analyzed the impact of COVID-19 pneumonia on follow-up pulmonary function tests. We identi�edfactors during hospitalization that were related to abnormalities in lung diffusion capacity at the time offollow-up. The fact that there was no evidence of restrictive lung disease or anemia in our cohortsuggests that the underlying pathophysiological mechanism relates to abnormal pulmonary vascular andthrombotic issues instead of persistence of pulmonary parenchymal abnormalities. Several previouslypublished reports indicate that the majority of ground glass opacities clear in a short period of time afterCOVID 19 pneumonia. [17, 18] A case series of 149 patients [19] showed near complete radiologicalresolution on CT 3 weeks after discharge but there was faster clearing of parenchymal abnormalities inyounger patients.

Page 10/21
Several previous studies of patients that had COVID-19 pneumonia have shown diffusion capacity to bethe most common pulmonary function test abnormality at follow-up. A prospective longitudinal cohortfrom the Netherlands found decreased diffusion to be the most frequent abnormality in 101 patients.[11]Similar �ndings were seen in two retrospective series from China. [7, 12] In a smaller series from Germanywith 33 patients, decreased diffusing capacity was seen in 77% of patients and it was the only signi�cantabnormality on complete pulmonary function tests.[20] Likewise, in 110 patients discharged after COVID-19 pneumonia, decreased diffusion was seen in 47.2% of cases, being more common than obstruction orrestriction.[8] More recently, a systematic review and meta-analysis concluded after COVID-19 pneumoniathe most important of the pulmonary function tests affected was diffusing capacity of carbon monoxide.[21]
Although we did not �nd a difference between groups in D-dimer levels, it has been reported. The relationbetween D-dimer elevation during hospitalization and decreased diffusing capacity in follow-up has beenpreviously described by Zhao et al. [12] in a series with 55 patients. In the multivariable logistic regressionmodel it was found that higher level of D-dimer at admission were associated with follow up DLCO < 80%predicted (p = 0.031, OR 1.066, 95% CI 1.006 to 1.129). Another study from Spain [22] with a larger cohortalso found a relationship between maximum D-dimer levels and lower diffusing capacity in subsequentpulmonary function testing. Our report used peak D-dimer during hospitalization instead of D-dimer atadmission. D-dimer levels during hospitalization have shown to have a relationship with mortality,thromboembolic events and need for invasive mechanical ventilation. [23]
Pulmonary vascular abnormalities in COVID 19 pneumonia have been widely reported. Using CTpulmonary angiography and dual energy CT, a retrospective series of 39 mechanically ventilated patientswith COVID 19 pneumonia [24] found dilated peripheral vessels (vascular tree-in-bud pattern) and arterial�lling defects in the majority of cases. Very similar �ndings were seen in another retrospective study of85 patients [25]; their pulmonary dual energy CT angiography revealed a signi�cant number of pulmonaryischemic areas even in the absence of visible pulmonary arterial thrombosis, raising the possibility ofmicro thrombosis associated with COVID-19 pneumonia.
Other chronic pulmonary conditions have also shown pulmonary vascular remodeling; using CT chest forreconstructions of the pulmonary vasculature in patients with chronic thromboembolic pulmonaryhypertension (CTEPH), compared to healthy controls there was loss of the distal vessels, dilation of theproximal vessels and increased vascular tortuosity. [26] In a study of smokers,[27] loss of the small bloodvessels (< 5 mm2) was found. The magnitude of the changes was correlated to the clinical severity oftheir lung disease.
Regarding the assessment of small pulmonary blood vessels in our cohort, the paper by Lins et al. [13]has already shown that patients with COVID-19 pneumonia compared to healthy individuals seem tohave redistribution in the blood volume with decrease in blood vessels with an area less than 5mm² andan increase in the blood vessels with an area of 5 to 10mm² and more than 10 mm². This has beencommonly interpreted as evidence of elastic pulmonary arterial dilation proximal to areas of increased

Page 11/21
pulmonary vascular resistance downstream; the dilation of vessels more proximal than those smallerthan 5 mm2 leads to an increase in BV5_10 and 10 and a reduction in BV5. This may be suggestive ofpersistent dysregulation of pulmonary vascular tone which could contribute to reduced diffusingcapacity.
Our data show that COVID-19 pneumonia patients with pulmonary vascular abnormalities have anassociated low diffusing capacity in follow-up pulmonary function tests. This has biologic plausibility,considering the profound pathologic changes seen in lungs obtained during autopsy with patients whodied from COVID-19 pneumonia. [3] Changes include severe endothelial injury with disruption of cellmembranes, capillary microthrombi and new vessel growth with widespread angiogenesis. Additionally,in a recent study, [28] 83% of patients with severe COVID-19 pneumonia have evidence of intrapulmonaryright to left shunt, which is more evidence of profound vascular anomalies. Our �ndings support that thepresence of pulmonary vascular remodeling in COVID-19 pneumonia patients can predict future isolatedimpairment in diffusing capacity.
Our study has several limitations. Firstly, our cohort is small and our data were retrospectively collected.Secondly, due to several logistic reasons we did not see all of our patients at the same time afterdischarge in a protocol driven fashion. Ideally, the pulmonary function tests would have been done at thesame time after diagnosis of COVID-19 pneumonia to avoid confounding by the natural history andprogression of COVID-19 related pulmonary disease. Thirdly, the elevation of serum D-dimer levels duringhospital admission could have impacted treatment decisions that might have in�uenced subsequentpulmonary function testing and diffusing capacity. Finally, many of the patients hospitalized at ourinstitution were lost to follow-up for many reasons (unable to contact, discharge to long-term care facilityafter hospitalization, death, etc.). This may have skewed our data towards less sick patients.
Conclusion:In conclusion, our �ndings suggest that COVID-19 pneumonia can result in pulmonary vascularabnormalities that may have long-lasting effects on gas exchange even after resolution of acute illness.This phenomenon may contribute to the pathophysiology of persistent symptoms after COVID-19infection. Further study regarding the in�uence of pulmonary vascular volumes on short and long termCOVID-19 outcomes is warranted.
DeclarationsEthics approval and consent to participate: This study was approved by the Institutional Review Board atTemple University. Protocol Number 26984.
Consent for publication: Not required
Availability of data and materials: All the datasets used and/or analyzed during the current study areavailable from the corresponding author on reasonable request

Page 12/21
Competing Interests: Over the past three years, VK reports personal fees from Gala Therapeutics, theABIM, AstraZeneca, and Boehringer Ingelheim outside the submitted work; ML, JDB, BL have receivedmonies from Fluidda, Inc; IO, MD, RG, FJ, MEVS, DS have no competing interests to declare.
Funding: Image analyses were funded by Fluidda’s COVID19 consortium
Author Contributions: VK, DS conceived and designed the analysis plan, performed the data analysis andcontributed signi�cantly to the writing of the manuscript; IO, MD, FJ, MEVS, RG generated much of thedata and contributed signi�cantly to the writing of the manuscript; ML, JDB, BL conducted the CT scananalysis and contributed signi�cantly to the writing of the manuscript; contributed signi�cantly to thedata analysis and the writing of the manuscript.
Acknowledgements: As above in Author contributions
AbbreviationsANOVA: Analysis of variance
ARDS: Acute respiratory distress syndrome
BV5: Pulmonary blood vessels ≤5mm
BV5_10: Pulmonary blood vessels 5-10mm
BV10: Pulmonary blood vessels ≥10mm
CI: Con�dence Interval
COVID-19: Coronavirus Disease 2019
CT: Computed Tomography
CTEPH: chronic thromboembolic pulmonary hypertension
CRP: C-reactive protein
DLCO: Diffusion capacity of carbon monoxide
FEV1: Forced expiratory volume in 1 second
FRI: Functional Respiratory Imaging
FVC: Forced vital capacity
LDH: Lactate Dehydrogenase

Page 13/21
NHANES: National Health and Nutrition Examination Survey
OR: Odds ratio
R: Pearson product-moment correlation coe�cient
SPSS: Statistical Package for the Social sciences
TLC: Total Lung Capacity
References1. Fajgenbaum DC, June CH. Cytokine Storm. N Engl J Med 2020;383: 2255-73.
2. Dhont S, Derom E, Van Braeckel E, Depuydt P, Lambrecht BN. The pathophysiology of 'happy'hypoxemia in COVID-19. Respir Res 2020;21: 198-5.
3. Ackermann M, Verleden SE, Kuehnel M, Haverich A, Welte T, Laenger F, Vanstapel A, Werlein C, StarkH, Tzankov A, Li WW, Li VW, Mentzer SJ, Jonigk D. Pulmonary Vascular Endothelialitis, Thrombosis,and Angiogenesis in Covid-19. N Engl J Med 2020;383: 120-8.
4. Khan MZ, Jamal Y, Sutton B, Rauf F. Venous thromboembolism in patients with COVID-19 andcorrelation with D-dimers: a single-centre experience. BMJ Open Respir Res 2020;7: e000779.
5. Klok FA, Kruip, M. J. H. A., van der Meer, N. J. M., Arbous MS, Gommers, D. A. M. P. J., Kant KM,Kaptein FHJ, van Paassen J, Stals MAM, Huisman MV, Endeman H. Incidence of thromboticcomplications in critically ill ICU patients with COVID-19. Thromb Res 2020;191: 145-7.
�. Townsend L, Dowds J, O'Brien K, Sheill G, Dyer AH, O'Kelly B, Hynes JP, Mooney A, Dunne J, NiCheallaigh C, O'Farrelly C, Bourke NM, Conlon N, Martin-Loeches I, Bergin C, Nadarajan P, Bannan C.Persistent Poor Health Post-COVID-19 Is Not Associated with Respiratory Complications or InitialDisease Severity. Ann Am Thorac Soc 2021.
7. Huang Y, Tan C, Wu J, Chen M, Wang Z, Luo L, Zhou X, Liu X, Huang X, Yuan S, Chen C, Gao F, HuangJ, Shan H, Liu J. Impact of coronavirus disease 2019 on pulmonary function in early convalescencephase. Respir Res 2020;21: 163-6.
�. Mo X, Jian W, Su Z, Chen M, Peng H, Peng P, Lei C, Chen R, Zhong N, Li S. Abnormal pulmonaryfunction in COVID-19 patients at time of hospital discharge. Eur Respir J 2020;55: 2001217.
9. Fumagalli A, Misuraca C, Bianchi A, Borsa N, Limonta S, Maggiolini S, Bonardi DR, Corsonello A, DiRosa M, Soraci L, Lattanzio F, Colombo D. Pulmonary function in patients surviving to COVID-19pneumonia. Infection 2020: 1-5.
10. Ramani C, Davis EM, Kim JS, Provencio JJ, En�eld KB, Kadl A. Post-ICU COVID-19 Outcomes: A CaseSeries. Chest 2021;159: 215-8.
11. van der Sar-van der Brugge, S., Talman S, Boonman-de Winter L, de Mol M, Hoefman E, van Etten RW,De Backer IC. Pulmonary function and health-related quality of life after COVID-19 pneumonia. RespirMed 2020;176: 106272.

Page 14/21
12. Zhao YM, Shang YM, Song WB, Li QQ, Xie H, Xu QF, Jia JL, Li LM, Mao HL, Zhou XM, Luo H, Gao YF,Xu AG. Follow-up study of the pulmonary function and related physiological characteristics ofCOVID-19 survivors three months after recovery. EClinicalMedicine 2020;25: 100463.
13. Lins M, Vandevenne J, Thillai M, Lavon BR, Lanclus M, Bonte S, Godon R, Kendall I, De Backer J, DeBacker W. Assessment of Small Pulmonary Blood Vessels in COVID-19 Patients Using HRCT. AcadRadiol 2020;27: 1449-55.
14. Thillai M, Patvardhan C, Swietlik EM, McLellan T, De Backer J, Lanclus M, De Backer W, Ruggiero A.Functional respiratory imaging identi�es redistribution of pulmonary blood �ow in patients withCOVID-19. Thorax 2020.
15. Pellegrino R, Viegi G, Brusasco V, Crapo RO, Burgos F, Casaburi R, Coates A, van der Grinten, C. P.,Gustafsson P, Hankinson J, Jensen R, Johnson DC, MacIntyre N, McKay R, Miller MR, Navajas D,Pedersen OF, Wanger J. Interpretative strategies for lung function tests. Eur Respir J 2005;26: 948-68.
1�. Hankinson JL, Odencrantz JR, Fedan KB. Spirometric reference values from a sample of the generalU.S. population. Am J Respir Crit Care Med 1999;159: 179-87.
17. Liu C, Ye L, Xia R, Zheng X, Yuan C, Wang Z, Lin R, Shi D, Gao Y, Yao J, Sun Q, Wang X, Jin M. ChestComputed Tomography and Clinical Follow-Up of Discharged Patients with COVID-19 in WenzhouCity, Zhejiang, China. Ann Am Thorac Soc 2020;17: 1231-7.
1�. Huang L, Han R, Ai T, Yu P, Kang H, Tao Q, Xia L. Serial Quantitative Chest CT Assessment of COVID-19: Deep-Learning Approach. Radiology.Cardiothoracic Imaging 2020;2: e200075.
19. Liu D, Zhang W, Pan F, Li L, Yang L, Zheng D, Wang J, Liang B. The pulmonary sequalae indischarged patients with COVID-19: a short-term observational study. Respir Res 2020;21: 125-1.
20. Daher A, Balfanz P, Cornelissen C, Müller A, Bergs I, Marx N, Müller-Wieland D, Hartmann B, Dreher M,Müller T. Follow up of patients with severe coronavirus disease 2019 (COVID-19): Pulmonary andextrapulmonary disease sequelae. Respir Med 2020;174: 106197.
21. Torres-Castro R, Vasconcello-Castillo L, Alsina-Restoy X, Solis-Navarro L, Burgos F, Puppo H, Vilaró J.Respiratory function in patients post-infection by COVID-19: a systematic review and meta-analysis.Pulmonology 2020.
22. Méndez R, Latorre A, González-Jiménez P, Feced L, Bouzas L, Yépez K, Ferrando A, Zaldívar-OlmedaE, Reyes S, Menéndez R. Reduced Diffusion Capacity in COVID-19 Survivors. Ann Am Thorac Soc2021.
23. Naymagon L, Zubizarreta N, Feld J, van Gerwen M, Alsen M, Thibaud S, Kessler A, Venugopal S,Makki I, Qin Q, Dharmapuri S, Jun T, Bhalla S, Berwick S, Christian K, Mascarenhas J, Dembitzer F,Moshier E, Tremblay D. Admission D-dimer levels, D-dimer trends, and outcomes in COVID-19.Thromb Res 2020;196: 99-105.
24. Patel BV, Arachchillage DJ, Ridge CA, Bianchi P, Doyle JF, Gar�eld B, Ledot S, Morgan C, PassarielloM, Price S, Singh S, Thakuria L, Tren�eld S, Trimlett R, Weaver C, Wort SJ, Xu T, Padley SPG, DevarajA, Desai SR. Pulmonary Angiopathy in Severe COVID-19: Physiologic, Imaging, and HematologicObservations. Am J Respir Crit Care Med 2020;202: 690-9.

Page 15/21
25. Grillet F, Busse-Coté A, Calame P, Behr J, Delabrousse E, Aubry S. COVID-19 pneumonia:microvascular disease revealed on pulmonary dual-energy computed tomography angiography.Quant Imaging Med Surg 2020;10: 1852-62.
2�. Rahaghi FN, Ross JC, Agarwal M, González G, Come CE, Diaz AA, Vegas-Sánchez-Ferrero G,Hunsaker A, San José Estépar R, Waxman AB, Washko GR. Pulmonary vascular morphology as animaging biomarker in chronic thromboembolic pulmonary hypertension. Pulm Circ 2016;6: 70-81.
27. Estépar RS, Kinney GL, Black-Shinn JL, Bowler RP, Kindlmann GL, Ross JC, Kikinis R, Han MK, ComeCE, Diaz AA, Cho MH, Hersh CP, Schroeder JD, Reilly JJ, Lynch DA, Crapo JD, Wells JM, Drans�eld MT,Hokanson JE, Washko GR, COPDGene Study. Computed tomographic measures of pulmonaryvascular morphology in smokers and their clinical implications. Am J Respir Crit Care Med 2013;188:231-9.
2�. Reynolds AS, Lee AG, Renz J, DeSantis K, Liang J, Powell CA, Ventetuolo CE, Poor HD. PulmonaryVascular Dilatation Detected by Automated Transcranial Doppler in COVID-19 Pneumonia. Am JRespir Crit Care Med 2020;202: 1037-9.
TablesTable 1. Baseline Characteristics and Follow-up PFTs.

Page 16/21
Normal DLCO Low DLCO p n=7 n=31 Age (years) 55.1±15.9 59.8±12.4 0.399Gender (male) 3 (42.9) 16 (51.6) 0.676Race 0.292 Caucasian 0 (0) 3 (9.7) African American 2 (28.6) 18 (58.1) Hispanic 4 (57.1) 8 (25.8) Other 1 (14.3) 2 (6.4)Height (inches) 64.3±2.4 66.6±3.9 0.138BMI (kg/m2) 39.2±9.5 33.9±5.6 0.190Smoking Status 0.585 Nonsmoker 5 (71.4) 18 (57.6) Current Smoker 0 (0) 4 (12.9) Former Smoker 2 (28.6) 9 (29.0)HTN 4 (57.1) 22 (71.0) 0.656DM 4 (57.1) 13 (41.9) 0.678CKD 1 (14.3) 4 (12.9) 1.000CAD 2 (28.6) 3 (9.7) 0.223CHF 0 (0) 9 (27.9) 0.164ESRD 0 (0) 1 (3.2) 1.000Asthma 0 (0) 5 (16.1) 0.561 Follow Up Days after Hosp 74.4±41.8 74.9±34.5 0.997mMRC dyspnea score 0.86±0.90 1.40±1.13 0.2466MWD (feet) 984±206 960±249 0.834FEV1 (%predicted) 88.4±13.3 84.7±19.9 0.644FVC (%predicted) 88.0±15.2 85.2±19.2 0.724FEV1/FVC 79.7±6.9 77.8±6.9 0.522TLC (%predicted) 80.3±15.0 81.1±15.1 0.534DLCO (%predicted) 89.9±12.6 55.5±12.2 <0.0001DLCO/VA (%predicted) 111.7±13.1 82.6±17.4 <0.0001
Definition of Abbreviations: DLCO = diffusing capacity of carbon monoxide; BMI = body massindex; HTN = hypertension; DM = diabetes mellitus; CKD = chronic kidney disease; CAD =coronary artery disease; CHF = congestive heart failure; ESRD = end stage renal disease;mMRC = modified Medical Research Council; 6MWD = 6-minute walk distance; FEV1 = forcedexpiratory volume in 1 second; FVC = forced vital capacity; TLC = total lung capacity; DLCO/VA= DLCO adjusted for alveolar volume
Table 2. Group Characteristics of Hospitalization.

Page 17/21
Normal DLCO Low DLCO p n=7 n=31 Labs Admission Hgb (g/dL) 13.6±0.99 12.87±1.63 0.292Peak Ferritin (ng/mL) 247±190 656±751 0.138Peak CRP (mg/dL) 8.4±6.5 7.1±5.0 0.597Peak LDH (U/L) 242±58 348±149 0.075Peak D-dimer (ng/mL) 538±208 4676±10417 0.268Peak Fibrinogen (mg/dL) 646±173 486±189 0.267 Medical Therapies Corticosteroids 1 (14.3) 12 (38.7) 0.115Remdesivir 1 (14.3) 7 (22.6) 0.255Anakinra 0 (0) 1 (3.2) 0.451IVIG 0 (0) 1 (3.2) 0.451Tocilizumab 0 (0) 4 (12.9) 0.327 CT Measures BV5 (mL) 79.9±39.9 81.0±39.2 0.943BV5_10 (mL) 42.6±6.9 54.2±13.3 0.005BV10 (mL) 93.0±33.4 138.1±53.1 0.001Opacification (mL) 89.8±90.8 221.7±272.3 0.218 Hospital Characteristics LOS (days) 4.43±1.51 6.26±5.96 0.429Peak O2 Req (L/min) 0.57±0.98 5.66±12.55 0.433 Room Air 5 (71.4) 17 (54.8) NC O2 2 (28.6) 8 (25.8) HFNC O2 0 (0) 4 (12.9) 0.650
1.0001.000
IMV 0 (0) 2 (6.5)New PE 0 (0) 2 (6.5)New DVT 0 (0) 1 (3.2)
Definition of Abbreviations: DLCO = diffusing capacity of carbon monoxide; Hgb = hemoglobin;CRP = C-reactive protein; LDH = lactose dehydrogenase; IVIG = intravenous immunoglobulin;LOS = length of stay; NC = nasal cannula; HFNC = high flow nasal cannula; IMV = invasivemechanical ventilation; PE = pulmonary embolism; DVT = deep venous thrombosis
Figures

Page 18/21
Figure 1
CONSORT Diagram.

Page 19/21
Figure 2
Pulmonary vascular volumes of 2 COVID-19 patients on hospital admission. The patient in Panel A had aDLCO of 117% predicted at follow-up. The patient in Panel B had a DLCO of 32% predicted at follow-up.Blood vessels are colored according to their size. Red denotes the small vessels (5 mm), yellow the mid-size vessels (5-10 mm), and blue the larger vessels (>10 mm).

Page 20/21
Figure 3
Pulmonary vascular volumes of pulmonary vessels <5mm2. HC = Healthy Controls.

Page 21/21
Figure 4
Pulmonary vascular volumes by DLCO groups. A) BV5_10 and B) BV10. HC = Healthy Controls.
Figure 5
Correlation between BV10 and DLCO.
Recommended