This article was downloaded by: [University of New Mexico]On: 28 November 2014, At: 11:10Publisher: Taylor & FrancisInforma Ltd Registered in England and Wales Registered Number: 1072954 Registered office: MortimerHouse, 37-41 Mortimer Street, London W1T 3JH, UK
Journal of the Illuminating Engineering SocietyPublication details, including instructions for authors and subscription information:http://www.tandfonline.com/loi/uzie20
Daylighting System Design and Evaluation of theMuseum of Contemporary Art in ChicagoMojtaba Navvaba
a University of Michigan, Ann Arbor, MIPublished online: 19 Sep 2013.
To cite this article: Mojtaba Navvab (1998) Daylighting System Design and Evaluation of the Museum of Contemporary Artin Chicago, Journal of the Illuminating Engineering Society, 27:2, 160-173, DOI: 10.1080/00994480.1998.10748243
To link to this article: http://dx.doi.org/10.1080/00994480.1998.10748243
PLEASE SCROLL DOWN FOR ARTICLE
Taylor & Francis makes every effort to ensure the accuracy of all the information (the “Content”) containedin the publications on our platform. However, Taylor & Francis, our agents, and our licensors make norepresentations or warranties whatsoever as to the accuracy, completeness, or suitability for any purpose ofthe Content. Any opinions and views expressed in this publication are the opinions and views of the authors,and are not the views of or endorsed by Taylor & Francis. The accuracy of the Content should not be reliedupon and should be independently verified with primary sources of information. Taylor and Francis shallnot be liable for any losses, actions, claims, proceedings, demands, costs, expenses, damages, and otherliabilities whatsoever or howsoever caused arising directly or indirectly in connection with, in relation to orarising out of the use of the Content.
This article may be used for research, teaching, and private study purposes. Any substantial or systematicreproduction, redistribution, reselling, loan, sub-licensing, systematic supply, or distribution in anyform to anyone is expressly forbidden. Terms & Conditions of access and use can be found at http://www.tandfonline.com/page/terms-and-conditions
160
Daylighting System Design and Evaluation of the Museum of Contemporary Art in Chicago Mojtaba Navvab
Artwork composed of organic materials will undergo change as a result of the absorption of light and its related energy. Displaying such art thus results in its deterioration or destruction." The responsibility of the designer or architect is to provide a balance or control to limit the intensity, duration.and total exposure in terms of illuminance mat art work receives in order to minimize damage. Major electrical light sources (i.e., incandescent, fluorescent, HID, and HPS) have been adapted for use in windowless galleries as a safe approach. However, many architects believe that art objects should be presented and viewed under the same lighting conditions in which they were created. Historically, museums of the past two centuries have used natural light in various ways as a source. Architects today are interested in natural light for its energy conservation benefits as well as the opportunities it presents for varied light qualities and color-rendering effects.5-8 Windowless galleries are still in demand among museum curators, but daylighted museum design has impacted to a greater extent the evolving trend in museum design. The design principles of day-lighted museums have been developed on a trial-and-error basis. Daylighting design resolutions today are based on earlier as well as on newly discovered principles.
Effect of daylight on artwork Daylight can be more harmful to light-sensitive mate
rials than electric light sources, but this is true only in extreme cases. In most cases, with the application of current knowledge and information available on how to minimize damage, daylight can be safely used for lighting art exhibits.14 There are three major effects which must be considered by daylighting designers and utilized at the beginning of the design process. These factors are as follows: (1) the amount of light and its intensity; (2) the duration of the exposure; and (3) the spectral characteristics of the daylight. The following sections describe the effects of these factors and their impact on designs providing daylight in museums.
Effect of daylight intensity Most galleries or exhibit areas have skylights or ceilings
with translucent materials, but problems with reflected glare have led to their replacement with a combination of skylights with lightwells or a clerestory roof system.56 The combined use of different aperture sizes and control Author's affiliation: University of Michigan, Ann Arbor, MI
Summer 1998 JOURNAL of the Illuminating Engineering Society
systems has provided designers with a variety of choices for the integration of daylighting and electric lighting. The intensity of light is measured in lux. A minimum amount of illuminance is required for safety reasons and a maximum is established to prevent such latent effects as deterioration. These levels are based on laboratory tests and experimental measurements. The use of shading controls and filtered glass provides a means of minimizing the effects of the intensity of daylight and the heat and humidity associated with it. The most common design elements that provide daylight to exhibit areas are the operable louver and the UV filtered glazing system.
Currently recommended illuminance values for lighting design in museums are as follows: (1) display of non-sensitive materials for the performance of visual tasks of high contrast or large artwork with an illuminance range of 20, 30, and 50 lx (2, 3, and 5 fc); (2) display of sensitive materials (textiles, water-colors, tapestries, prints and drawings, manuscripts, miniature, painting in distemper, wallpapers, gouache, dyed leather). Lobbies, general gallery areas, corridors, and working spaces where visual tasks are only occasionally performed with an illuminance range of 10, 11, and 20 lx (1, 1.5, and 2 fc); (3) working spaces within laboratories and restoration or conservation areas for the performance of visual tasks of medium contrast or of small size artwork with an illuminance range of 100, 75, and 50 lx (10, 7.5, and 5 fc). The accessible lighting levels for ambient lighting (50-300 lx or 5-30 fc), text panels (100-300 lx or 10-30 fc), controls (100 lx or 10 fc), directional signage (200-300 lx or 20-30 fc), specimens and objects (100-300 lx or 10-30 fc), ramps and stairs (100-300 lx or 10-30 fc), and visitor pathways (100-300 lx or 10-30 fc).5
Effect of daylight duration Providing an average of 50 lx (5 fc) within gallery
spaces by means of daylighting design is a relatively simple task; the challenge for the designer is in organizing a workable control system. It was found that an exposure of
Table 1—The relative spectral object responsitivity and the threshold radiant exposure. Material Water Painting News Paper Silk
USA-NIST (formerly known i
(a) 90.0
36316 0.133*10'
2139 uNBS) Formula
(b) 0.015 0.035 0.047
0.02556
Hs.dm 144
6 53 —
DE*ab 718 30
263 —
Dow
nloa
ded
by [
Uni
vers
ity o
f N
ew M
exic
o] a
t 11:
10 2
8 N
ovem
ber
2014
161
Table 2—Average glare index (scale of 20). Jan Feb Mar Apr May
Horizontal 1.9 2.6 3.7 5.7 7.1 Vertical 1.3 1.9 3.1 5.1 6.6
Jun 9.6 9.2
Jul 10.5 10
Aug 8
7.5
Sep 6.8 6.1
Oct 3.9 3.2
Nov 2.6 2
Dec 1.9 1.4
Annual 5.8 5.2
short duration to intense light affects artwork as much as low light intensity levels would over an extended period of time. For this reason some displays are regularly moved from place to place. The close collaboration of the day-lighting and lighting designers with the engineers and architects can do much to alleviate this problem. Other factors such as an advantageous building site and orientation, suitable manual and automatic shading controls, and a well-designed lighting system make possible a lessening of the duration of exhibits' exposure to daylight during critical times of direct sun exposure.4-6 The damage caused by light is the product of illuminance and time, total exposure limits in terms of illuminance/hours per year should be kept to an absolute minimum. The CIE limit for objects with highly susceptible display materials (such as paper, silk, and antique fibers) is 120k-lx-hours per year (12k-fc-hours per year) while the limit for moderately susceptible display materials (such as cotton, textiles, wool, and wood-finishes) is 180k-lx-hours per year (18k-fc-hours per year). These guidelines were calculated based on 8 hours of exhibit time 30 days a year with an average exposure between 50 and 75 lx (5 and 7.5 fc) respectively. Total light per day = lux x hours of light. Example: 2000 lx x 12 hours = 24000 lx per day (2.4k-fc-hours per day). It should be noted for all cases that wavelengths shorter than 400 nm should be shut out by the use of filters such as the UF-3 acrylic sheet.
Effect of daylight spectrum The use of skylights with the glazing system
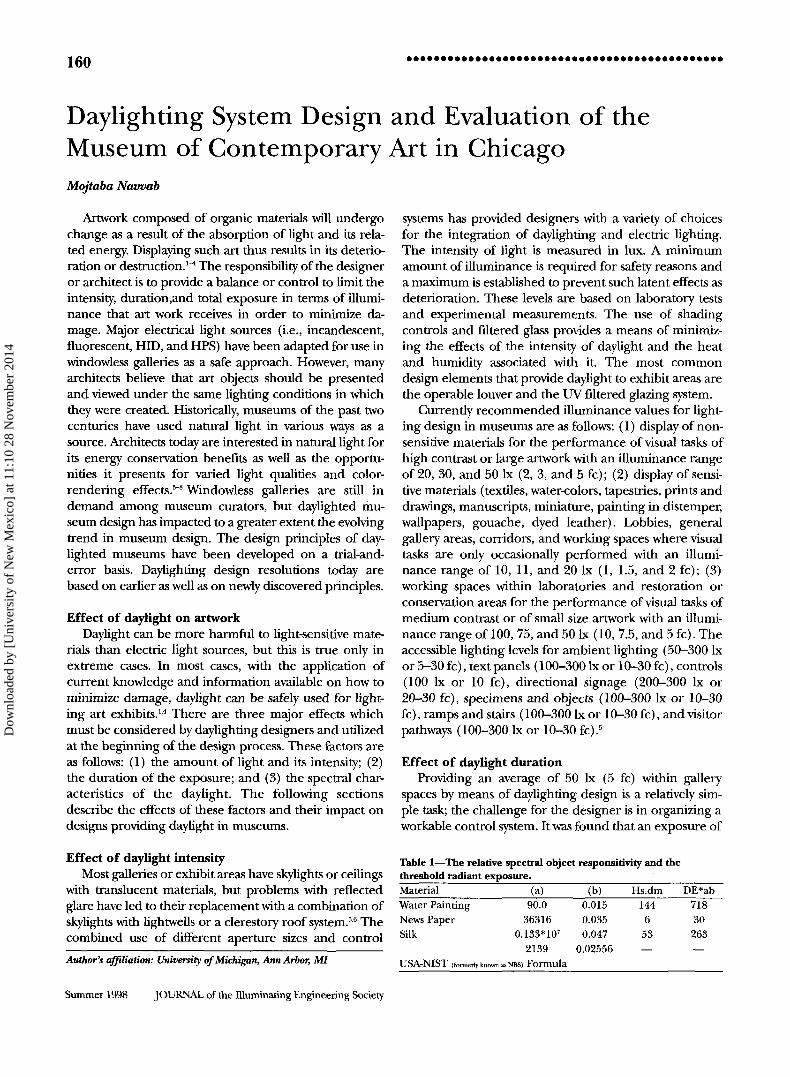
in addition to an automatic shading and lighting system allows control of the intensity and duration of light but does not prevent the artworks' damaging exposure to ultraviolet and infrared wavelengths on either side of the visible spectrum without the use of appropriate filters.1,2,5 The high ultraviolet waves of optical radiation may alter the molecular structure of many organic base materials and fade, burn, or brittle paper and textiles. Infrared wavelengths (long wave) heat and dehydrate various dyes and fibers. The first step to the elimination of these problems is to block direct sunlight from all of the galleries. Electric lamps must also be placed so as not to expose artwork to damaging artificial light. Methods of calculation of relative spectral object responsivity are presented by many researchers in references 1-5 to the determination of the color change. The threshold
effective radiant exposure (the exposure that causes the color change) must be known in order to predict the damaging
condition to the art materials for a defined irradiation level at given illuminance level conditions.1"4 This indicator shows that noticeable color change will occur as long as the illuminance (E) and the duration (t) of the illumination are above the recommended levels of 120-180K lux-hours (12-18Kfc-hours). This concept has been applied in all calculations. Calculations of relative spectral object responsivity are determined by estimating the color change.1 The use of these functions are described by the following formulas:
LHAZ = 2 ̂ O O - M O O ) 1 ^ 1 - ^ ' LxLxAX<=l/w*t1' (1)
Where LHAZ = constant for different materials, a = constant for normalized A. = 300nm as S(\) = 300(nm) = 1. The S dm, rel of any material must be known to calculate the Edm or the Hdm. Radiant Exposure is defined as He = Ee*t where Ee is the irradiance (Illuminance Levels) and the t is the time. Equation 2 is based on laboratory testing and aging of materials under light sources by Krockmann and other researchers. The variables in Table 1 are the results of the fitted equations to the measured data at their laboratory. Further research is underway to produce other coefficients of Effective Radiant Exposure for materials other than silk, papers, etc. Two quantities of effective radiant are most important in determining the damaging of material (e.g., color change and yellowing shown
a> u
en
w o
rrj U u
-H
i—i
5 0 0 400 450 Lambda/n .
Figure 1—Relative spectral exposure for different materials.
5 5 0 6 0 0
.1X1.
JOURNAL of the Illuminating Engineering Society Summer 1998
Dow
nloa
ded
by [
Uni
vers
ity o
f N
ew M
exic
o] a
t 11:
10 2
8 N
ovem
ber
2014
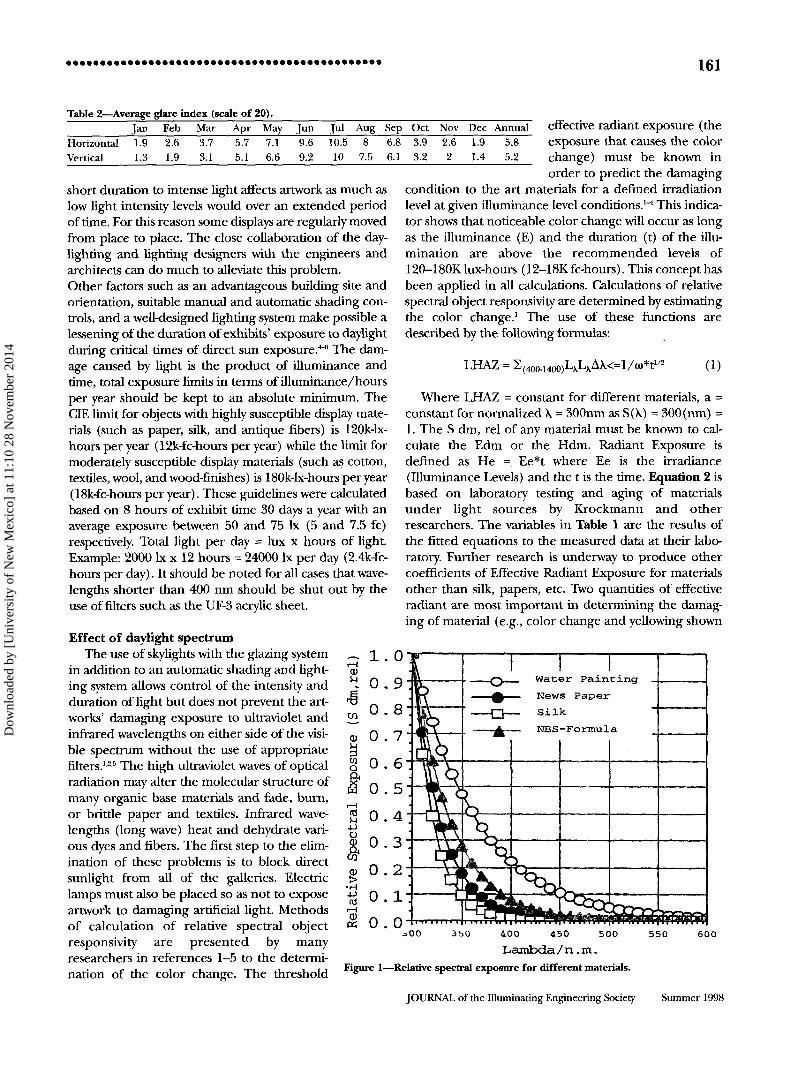
Figure 2— Schematic view of the second floor galleries and the MCA east entry to gallery spaces.
by the Index "dm"). One is the Effective Irradiant (Edm) and the other is Effective Radiant Exposure (Hdm). See Equation 2 and 3 below.
Edm = / EA.S(k) dm,rel,dk (2)
where EeX is the Spectral Irradiance and S(\)dm,rel is the Relative Spectral Object Responsivity.
The Effective Radiant Exposure Hdm is determine by
Hdm = jEdm.dt (3) t
where t is the duration of Irradiance. Table 1 shows the constants (a) and (b) for the relative spectral object responsitivity (S) and the threshold radiant exposure Hs.dm,re for three samples of materials.
To predict the damaging materials for defined irradiation (Illuminance levels) conditions; threshold effective radiant exposure Hs.dm1 for the DE*ab4 from Table 1 must be known, Hs,dm, is the effective exposure that causes a defined amount of color change.1"5 A noticeable color change will occur as long as the illuminance (E) and the duration (t) of the illumination are limited to
H e = Ee.t < C Where C can be found by
C-KnH; dmfSkVK.d/SSK.(k)dm.rel.dK 0 0
(4)
Where K,„ 683 Im/W Maximum Value of the Luminous Efficacy, SX. = Relative Spectral Power Distribution of the radiation used for lighting and V\ spectral luminous efficacy at the eye.
The following recommendations are essential for the illumination of light-sensitive materials when spectral damage (color change) must be prevented.
1. Maintain a constant and low acceptable level of illuminance.
2. Maintain a short duration of illumination (e.g. no illumination during off-hours).
3. Use cut-off filter glazing materials at the wavelength of400nm.
Figure 1 shows the results of Equation 1 using the variables or the coefficients within Table 1 as an input for different materials exposed to visible light.
The following guidelines are recommended by IESNA RP-30-96, Museum and Art Gallery Lighting: A Recommended Practice, to control the damage and to achieve satisfactory viewing conditions with minimum irradiance:5
• A light source of appropriate correlated color temperature (CCT) and excellent color rendering, (see Table 2)
• Restriction of ultraviolet (UV) and infrared (IR) non-visible radiant energy.
• A filter used with every light source. • Adaptation by viewers to the restricted brightness of
the display, particularly in the vicinity of highly susceptible materials.
• Illuminances restricted to levels just sufficient for satisfactory artifact appearance that do not exceed the recommended levels of Table 3.
• Restriction of annual display hours where it is deemed advisable or where it is necessary to comply with the recommended limits on exposure.
• Illuminances during non-viewing hours are to be the minimum necessary for security.
Summer 1998 JOURNAL of the Illuminating Engineering Society
Dow
nloa
ded
by [
Uni
vers
ity o
f N
ew M
exic
o] a
t 11:
10 2
8 N
ovem
ber
2014
163
Table 3—Monthly average daylight illuminance (be) (louvers at automated settings) Jan Feb Mar Apr May Jun Jul Aug Sep Oct Nov
Horizontal 50.6 59.7 72.7 102 125.6 201.5 238 139 125 90.3 65.1 Vertical 39.5 46.4 55.8 78.4 92.5 136.2 162 107 101 72.3 51.2
Dec 48.9 37.6
Annual 117.2 86.5
Color Rendering Index (CRI) and correlated color temperature (CCT)
The color rendering index (CRI) of the lamp and its correlated color temperature (CCT) will affect the color appearance of artifacts. The CRI of a light source indicates the degree of color shift objects undergo when illuminated by the light source as compared with the color of those same objects illuminated by a reference source of comparable color temperature. Typically, the higher the CRI, the better the light source for maintaining "true" color (although this is not always the case). Therefore, lamps with CRI values of 80 or greater should be used.5
The CCT of the light source will determine whether the display takes on a "cool" or a "warm" appearance expressed in Kelvin (K). Higher Kelvin values are "cool" or more blue; lower Kelvin temperatures are "warm" or more red. Noontime daylight is cool and has a CCT of about 5000K; triphosphor fluorescent lamps exhibit CCTs from 2800K to 6500K; tungsten-halogen lamps have CCT around 3000K; and an incandescent lamp is warm and has a CCT of about 2800K.5
Recommended total exposure limits in terms of illuminance hours per year to limit light damage to susceptible museum and art gallery artifacts*
All UV radiation (below 400 nm) should be eliminated. Highly susceptible displayed materials: textiles, cot
ton, natural fibers, furs, silk, writing inks, paper documents, lace, fugitive dyes, watercolors, wool, some minerals. Maximum Illuminance (50 lx) and/or (Lx-hours/yr) =50,000 (Note: Approximately (50 lx) x (8 hours per day) x (125 days per year).) Different levels (higher or lower) and/or different periods of display (4 hours for 250 days) may be appropriate, depending upon material.5
Moderately susceptible displayed materials: textiles with stable dyes, oil paintings, wood finishes, leather, some plastics. Maximum Illuminance (200 lx) and/or (lux-hours/yr) =480,000 Note: Approximately (200 lx) x (8 hours per day) x (300 days per year). Lower levels may be appropriate, depending upon material.5
Least susceptible displayed materials: metal, stone, glass, ceramic, most minerals. (Dependent upon exhibition situation). Neither criteria stated above (lux and lux-hours/yr) should be exceeded.5,720,2124,25
Results and Discussion Since its opening in the summer of 1996, over 200,000
people (100,000 in the first four months) have visited the
MCA at Chicago. In contrast to the museum's old building, it took a whole year to count 100,000 visitors. The $46 mil
lion project was designed by Josef Paul Kleihues, a German architect. The team involved the associate Architect J. Epstein and Sons, International, Inc. and engineers from Ove Arup and Partners. They had to collaborate in order to achieve the goals which were to design and construct a new museum building with die city of Chicago as the client.
It is a massive, classically proportioned building in an urban canyon setting. The base is made of Indiana limestone, the elevation is made of square and rectangular aluminum panels, cast to create a texture of small pyramids. The building is wiuhin a 2 acre, 219 ft by 416 ft rectangular site. The building is five stories, designed as a reinforced concrete structure on a 28 ft grid, with a lightweight concrete roof on metal decking spanning on to steel joists and beams. Walking through the museum from the east side of the building, one can see through its axis to the Water Tower and Michigan Avenue on the west side. Within this transparent envelope the exhibition galleries themselves are self-contained and visually and acoustically isolated by two layers of enclosure.10
The galleries are connected by a common three-story lobby through a grand staircase which takes visitors up one flight to the lobby, where an axis divides the building from east to west. A top lighted, four-story atrium lies at the building's core. The staircase, an interpretation of the Propyleia of the Acropolis, is one of the most notable features of the museum's interior. Visitors can see that in its exterior Kleihues adopted a rigorous grid plan for
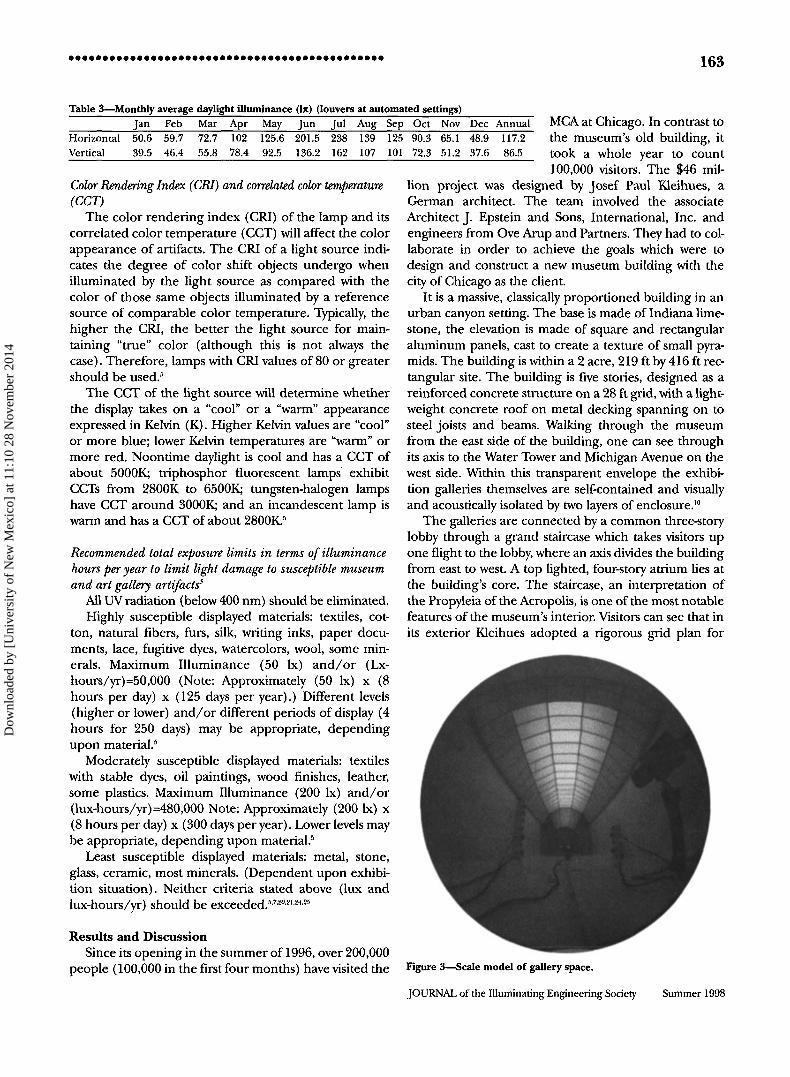
Figure 3—Scale model of gallery space.
JOURNAL of the Illuminating Engineering Society Summer 1998
Dow
nloa
ded
by [
Uni
vers
ity o
f N
ew M
exic
o] a
t 11:
10 2
8 N
ovem
ber
2014
164
both the museum building and the sculpture court, each measuring 184 ft2. The ground floor houses a 100-seat performance and conference space, a 15,000-volume art library and a 300-seat theater. The museum also contains two 9000 ft2 galleries for temporary exhibitions, providing flexible space for exhibitions. The artwork in the gallery required an environmentally controlled space. See Figure 2 for the schematic drawing of die large gallaries in plan and perspective.
Pre-Construction Studies and Experimentation—The evaluations of MCA's daylighting systems during the design stage were made using a scale model. The daylight distribution and illuminance levels in various parts of die gallery space were determined. The simulation results are based on the information provided by the architects' office, architectural drawings and scale model (1 inch = 1 ft), and the surface reflectance which was white lambertian.
The daylighting performance was tested under a sky simulator. The simulator reproduced a variety of sky and sun conditions in a controlled and repeatable manner.15
The model was placed on a rotating platform at horizon level within the simulator. The sun's path during the course of any day was reproduced by combining platform rotations and vertical movements of the sun on its motorized tracking system. Small light sensors (photodi-odes) inside die model measured light levels at a number of positions. Each sensor was connected to a PC-based data acquisition system, allowing light levels to be logged in a few seconds. A small video camera connected to a scanning system depicted the luminance distribution within the model. Figures 3 and 4 show the scale
Table 4—Percent daylight illuminance above 300 Ix or 30 fc.set. Jan Feb Mar Apr May Jun Jul Aug
Horizontal 68.2 72 72 77.4 83.4 87.5 90.4 88.3 Vertical 54.2 62.7 64.9 72.7 81.1 83 88.5 84.1
Sep 92.3 87.2
Oct 85.7 79.5
Nov 75.8 63.3
Dec 66
52.4
Annual 80.9 74.3
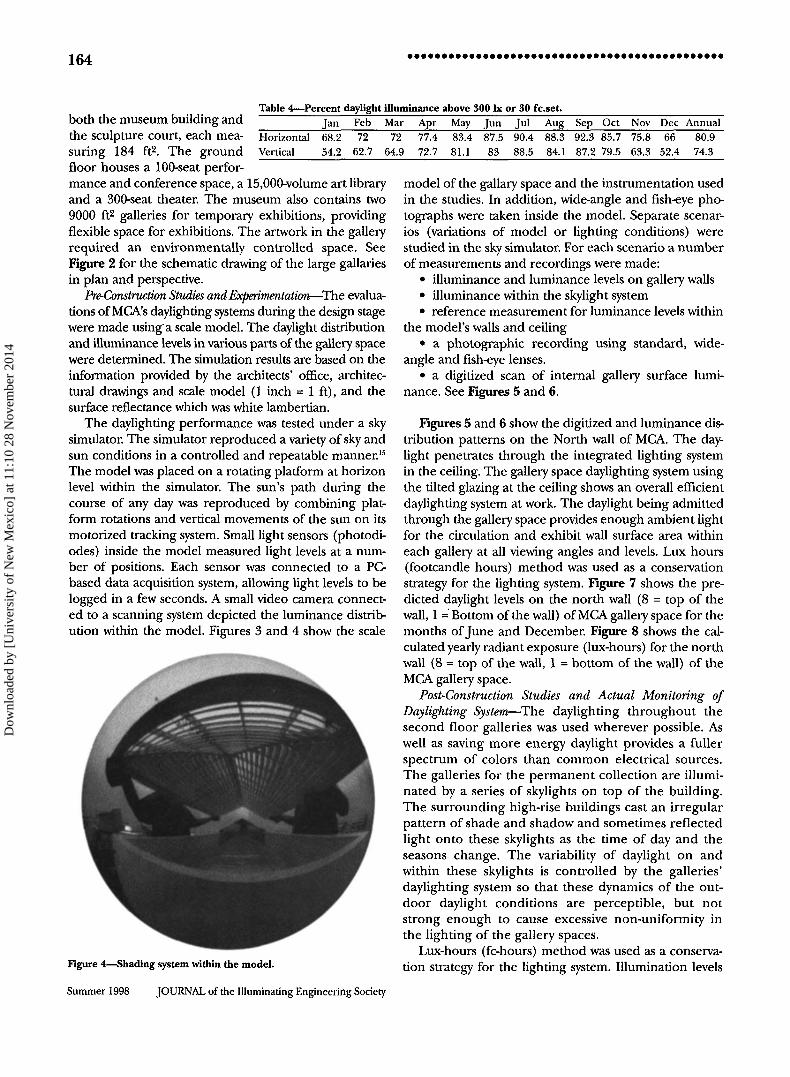
Figure 4—Shading system within the model.
model of the gallary space and the instrumentation used in the studies. In addition, wide-angle and fish-eye photographs were taken inside the model. Separate scenarios (variations of model or lighting conditions) were studied in the sky simulator. For each scenario a number of measurements and recordings were made:
• illuminance and luminance levels on gallery walls • illuminance widiin the skylight system • reference measurement for luminance levels within
die model's walls and ceiling • a photographic recording using standard, wide-
angle and fish-eye lenses. • a digitized scan of internal gallery surface lumi
nance. See Figures 5 and 6.
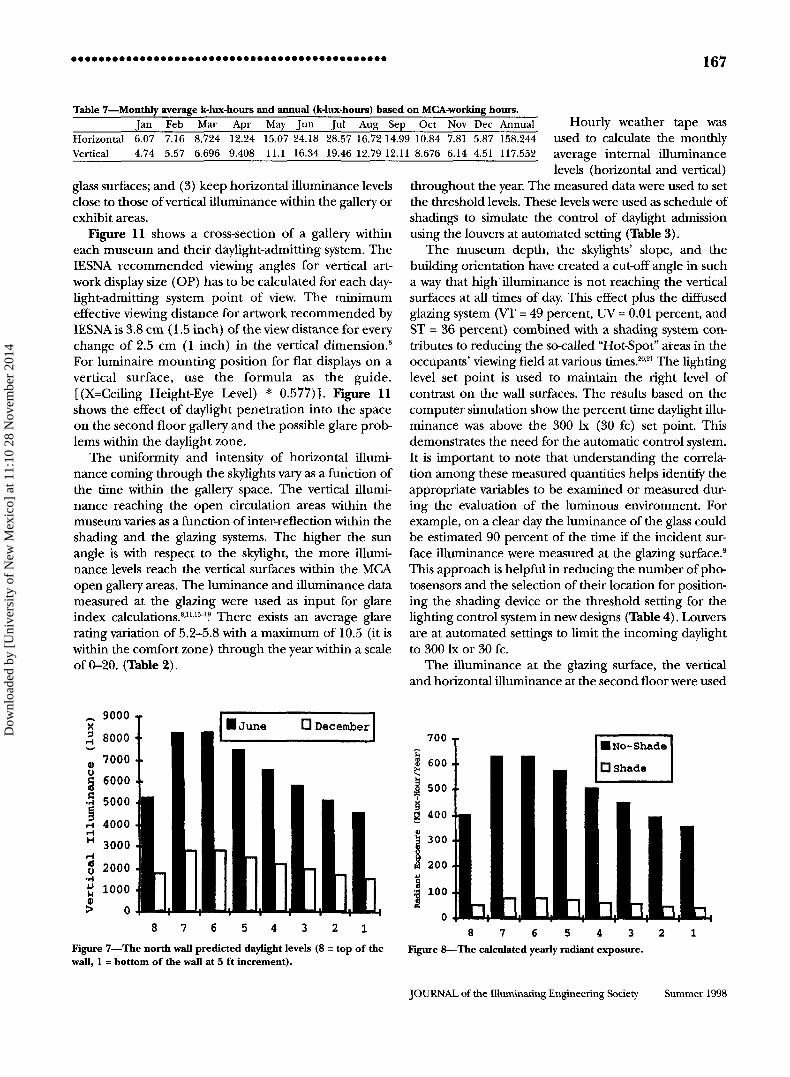
Figures 5 and 6 show the digitized and luminance distribution patterns on the North wall of MCA. The daylight penetrates through the integrated lighting system in die ceiling. The gallery space daylighting system using the tilted glazing at the ceiling shows an overall efficient daylighting system at work. The daylight being admitted through the gallery space provides enough ambient light for the circulation and exhibit wall surface area within each gallery at all viewing angles and levels. Lux hours (footcandle hours) method was used as a conservation strategy for the lighting system. Figure 7 shows the predicted daylight levels on the north wall (8 = top of the wall, 1 = Bottom of the wall) of MCA gallery space for the months of June and December. Figure 8 shows the calculated yearly radiant exposure (lux-hours) for die north wall (8 = top of the wall, 1 = bottom of the wall) of the MCA gallery space.
Post-Construction Studies and Actual Monitoring of Daylighting System—The daylighting throughout the second floor galleries was used wherever possible. As well as saving more energy daylight provides a fuller spectrum of colors than common electrical sources. The galleries for the permanent collection are illuminated by a series of skylights on top of the building. The surrounding high-rise buildings cast an irregular pattern of shade and shadow and sometimes reflected light onto these skylights as the time of day and the seasons change. The variability of daylight on and within these skylights is controlled by the galleries' daylighting system so that these dynamics of the outdoor daylight conditions are perceptible, but not strong enough to cause excessive non-uniformity in the lighting of the gallery spaces.
Lux-hours (fc-hours) method was used as a conservation strategy for the lighting system. Illumination levels
Summer 1998 JOURNAL of the Illuminating Engineering Society
Dow
nloa
ded
by [
Uni
vers
ity o
f N
ew M
exic
o] a
t 11:
10 2
8 N
ovem
ber
2014
165
within the daylighting system (between the gallery ceiling and the louver system below the skylight glazing system on die roof) are constandy monitored and target annual illumination exposures set for each type of artwork for a given collection within the gallery space. Damaging radiation in the UV part of the spectrum is removed from the incident daylight by UV filtering laminate within the external skylight glazing. Similar measurements to scale model photometry studies and recordings were made after the completion of the building:
• a Quick Time Virtual Reality scan of internal surfaces within the gallery.1117,21
• luminance levels of the internal surface of gallery luminous ceiling.
• CCT variation of the internal surface of gallery luminous ceiling.
• Horizontal and vertical illuminance on the internal walls of the gallery.
The admission of heat and light through the window/skylight is determined primarily by the intensity of solar radiation falling on die glazing system and by the solar optical properties transmittance, reflectance, and
and luminance characteristics of the surfaces of the material (glass and the complex support structure system in this case) are also important since they determine die disposition of the radiant (solar) energy that is absorbed by the glass. The diree properties listed above are optical in nature; the term "solar optical" is applied to die values of tiiese properties within the spectral range of the solar radiation. The illuminance and luminance measurements were made at the window and the gallery wall surface from the viewer's eye position. Outdoor reference measurements were compared to indoor data conditions in order to determine die dynamic ranges of daylight. The horizontal and vertical illuminance data were also collected to compute the glare at the eye position of the observer.812-14
The Solar-Optical property measurements under real sky conditions and computer simulation studies provided die database in order to evaluate the performance of die glazing system for die museum. Measured data proved diat high illuminance levels would not reach artwork and indirect or filtered sunlight are within die recommended ranges of light spectra. The dynamics of daylight fulfilled the color appreciation potential of die artworks. The vari-
absorptance of the glazing material. The illuminance ation of the CCT was measured at die glazing system and
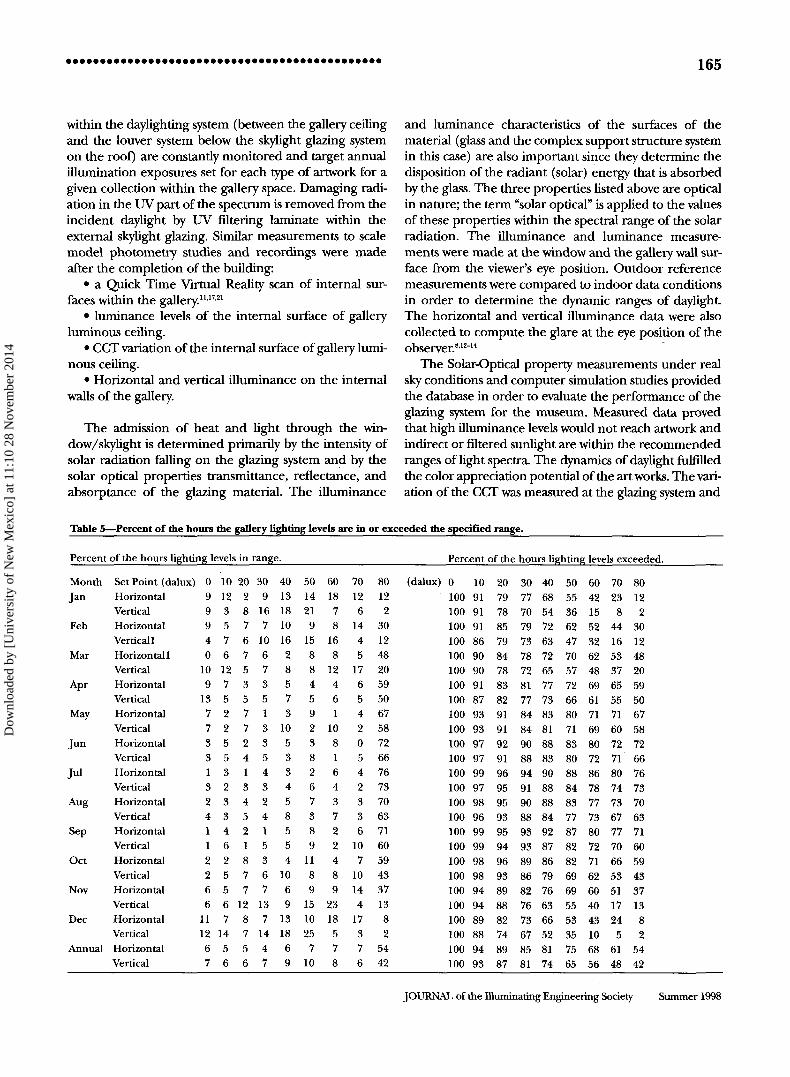
Table 5—Percent of the hours the gallery lighting levels are in or exceeded the specified range.
Percent of the hours 1
Month Jan
Feb
Mar
Apr
May
Jun
J«l
Aug
Sep
Oct
Nov
Dec
Annual
lighting levels
Set Point (dalux) 0 Horizontal Vertical Horizontal Verticall Horizontall Vertical Horizontal Vertical Horizontal Vertical Horizontal Vertical Horizontal Vertical Horizontal Vertical Horizontal Vertical Horizontal Vertical Horizontal Vertical Horizontal Vertical Horizontal Vertical
9 9 9 4 0
10 9
13 7 7 3 3 1 3 2 4 1 1 2 2 6 6
11 12 6 7
10 12 3 5 7 6 12 7 5 2 2 5 5 3 2 3 3 4 6 2 5 5 6 7
14 5 6
in rangi
20 2 8 7 6 7 5 3 5 7 7 2 4 1 3 4 5 2 1 8 7 7
12 8 7 5 6
30 9
16 7
10 6 7 3 5 1 3 3 5 4 3 2 4 1 5 3 6 7
13 7
14 4 7
E.
40 13 18 10 16 2 8 5 7 3
10 5 3 3 4 5 8 5 5 4
10 6 9
13 18 6 9
50 14 21 9
15 8 8 4 5 9 2 3 8 2 6 7 3 8 9
11 8 9
15 10 25
7 10
60 18 7 8
16 8
12 4 6 1
10 8 1 6 4 3 7 2 2 4 8 9
23 18 5 7 8
70 12 6
14 4 5
17 6 5 4 2 0 5 4 2 3 3 6
10 7
10 14 4
17 3 7 6
80 12 2
30 12 48 20 59 50 67 58 72 66 76 73 70 63 71 60 59 43 37 13 8 2
54 42
Percent of the hours lighting levels exceeded.
(dalux) 0 100 100 100 100 100 100 100 100 100 100 100 100 100 100 100 100 100 100 100 100 100 100 100 100 100 100
10 91 91 91 86 90 90 91 87 93 93 97 97 99 97 98 96 99 99 98 98 94 94 89 88 94 93
20 79 78 85 79 84 78 83 82 91 91 92 91 96 95 95 93 95 94 96 93 89 88 82 74 89 87
30 77 70 79 73 78 72 81 77 84 84 90 88 94 91 90 88 93 93 89 86 82 76 73 67 85 81
40 68 54 72 63 72 65 77 73 83 81 88 83 90 88 88 84 92 87 86 79 76 63 66 52 81 74
50 55 36 62 47 70 57 72 66 80 71 83 80 88 84 83 77 87 82 82 69 69 55 53 35 75 65
60 42 15 52 32 62 48 69 61 71 69 80 72 86 78 77 73 80 72 71 62 60 40 43 10 68 56
70 23
8 44 16 53 37 65 55 71 60 72 71 80 74 73 67 77 70 66 53 51 17 24
5 61 48
80 12 2
30 12 48 20 59 50 67 58 72 66 76 73 70 63 71 60 59 43 37 13 8 2
54 42
JOURNAL of the Illuminating Engineering Society Summer 1998
Dow
nloa
ded
by [
Uni
vers
ity o
f N
ew M
exic
o] a
t 11:
10 2
8 N
ovem
ber
2014
166
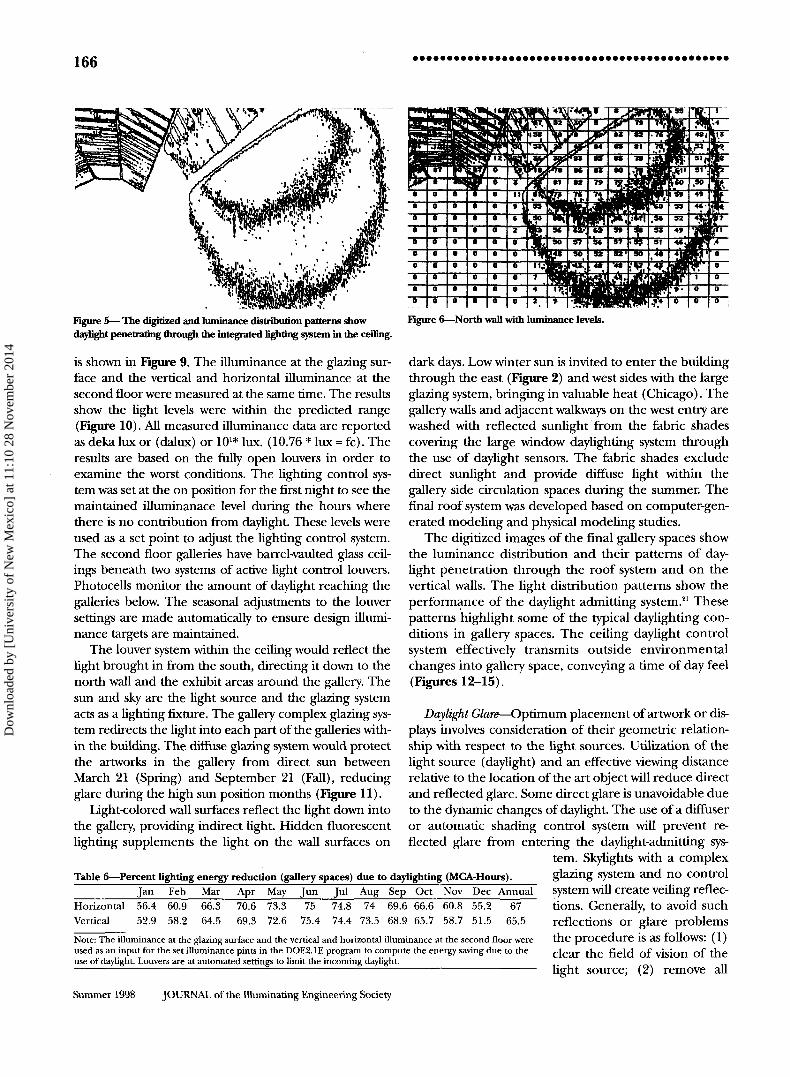
Figure 5— The digitized and luminance distribution patterns show daylight penetrating through the integrated lighting system in the ceiling.
Summer 1998 JOURNAL of the Illuminating Engineering Society
Figure 6—North wall with luminance levels.
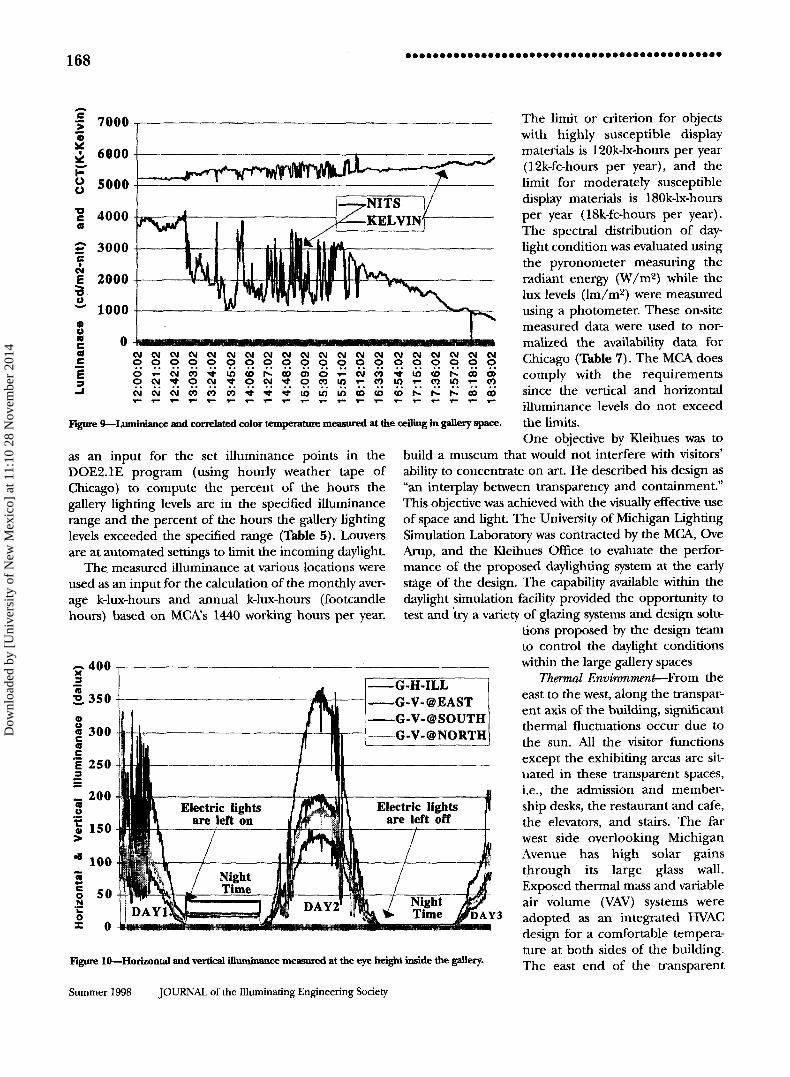
is shown in Figure 9. The illuminance at the glazing surface and the vertical and horizontal illuminance at the second floor were measured at the same time. The results show the light levels were within the predicted range (Figure 10). All measured illuminance data are reported as deka lux or (dalux) or 101* lux. (10.76 * lux = fc). The results are based on the fully open louvers in order to examine the worst conditions. The lighting control system was set at the on position for the first night to see the maintained illuminanace level during the hours where there is no contribution from daylight. These levels were used as a set point to adjust the lighting control system. The second floor galleries have barrel-vaulted glass ceilings beneath two systems of active light control louvers. Photocells monitor the amount of daylight reaching the galleries below. The seasonal adjustments to the louver settings are made automatically to ensure design illuminance targets are maintained.
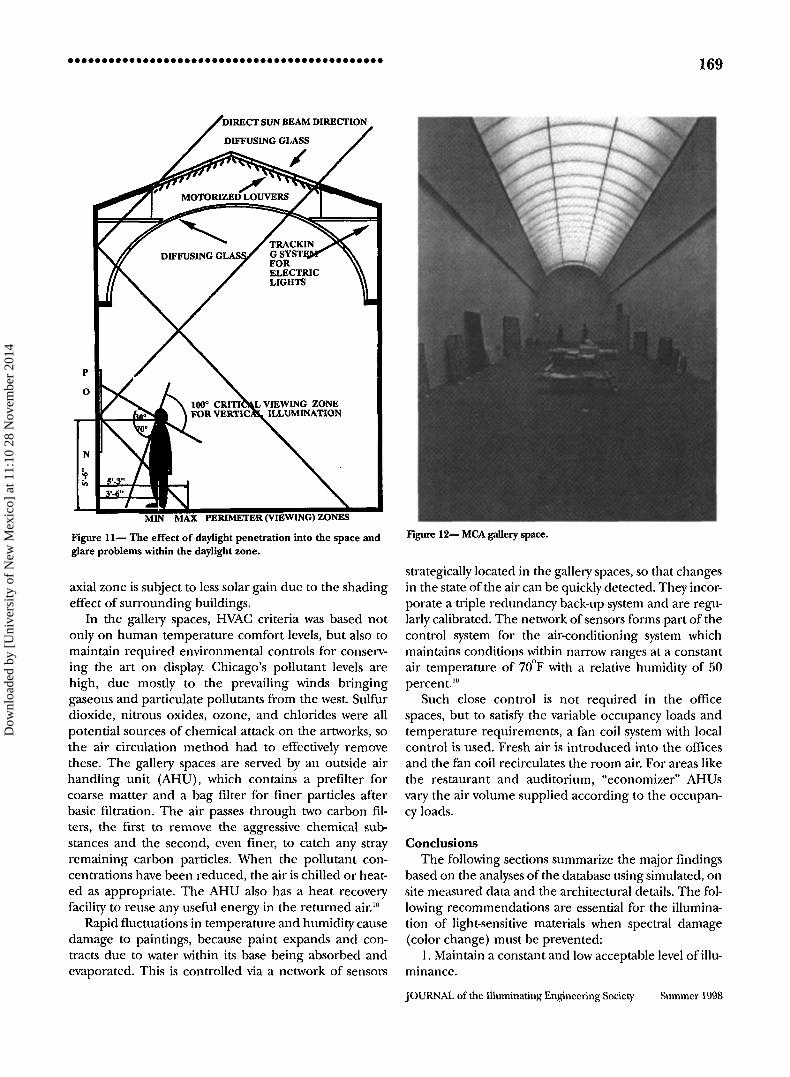
The louver system within the ceiling would reflect the light brought in from the south, directing it down to the north wall and the exhibit areas around the gallery. The sun and sky are the light source and the glazing system acts as a lighting fixture. The gallery complex glazing system redirects the light into each part of the galleries within the building. The diffuse glazing system would protect the artworks in the gallery from direct sun between March 21 (Spring) and September 21 (Fall), reducing glare during the high sun position months (Figure 11).
Light-colored wall surfaces reflect the light down into the gallery, providing indirect light. Hidden fluorescent lighting supplements the light on the wall surfaces on
Table 6—Percent lighting energy reduction (gallery spaces) due to daylighting (MCA-Hours). Jan Feb Mar Apr May Jun Jul Aug Sep Oct Nov Dec Annual
Horizontal Vertical
56.4 60.9 52.9 58.2
66.3 64.5
70.6 73.3 69.3 72.6
75 75.4
Note: The illuminance at the glazing surface and the vertical and horizontal illuminance at the second floor were used as an input for the set illuminance pints in the DOE2.1E program to compute the energy saving due to the use of daylight. Louvers are at automated settings to limit the incoming daylight.
dark days. Low winter sun is invited to enter the building through the east (Figure 2) and west sides with the large glazing system, bringing in valuable heat (Chicago). The gallery walls and adjacent walkways on the west entry are washed with reflected sunlight from the fabric shades covering the large window daylighting system through the use of daylight sensors. The fabric shades exclude direct sunlight and provide diffuse light within the gallery side circulation spaces during the summer. The final roof system was developed based on computer-generated modeling and physical modeling studies.
The digitized images of the final gallery spaces show the luminance distribution and their patterns of daylight penetration through the roof system and on the vertical walls. The light distribution patterns show the performance of the daylight admitting system.21 These patterns highlight some of the typical daylighting conditions in gallery spaces. The ceiling daylight control system effectively transmits outside environmental changes into gallery space, conveying a time of day feel (Figures 12-15).
Daylight Glare—Optimum placement of artwork or displays involves consideration of their geometric relationship with respect to the light sources. Utilization of the light source (daylight) and an effective viewing distance relative to the location of the art object will reduce direct and reflected glare. Some direct glare is unavoidable due to the dynamic changes of daylight. The use of a diffuser or automatic shading control system will prevent reflected glare from entering the daylight-admitting sys
tem. Skylights with a complex glazing system and no control system will create veiling reflections. Generally, to avoid such reflections or glare problems the procedure is as follows: (1) clear the field of vision of the light source; (2) remove all
74.8 74 69.6 66.6 60.8 55.2 74.4 73.5 68.9 65.7 58.7 51.5
67 65.5
Dow
nloa
ded
by [
Uni
vers
ity o
f N
ew M
exic
o] a
t 11:
10 2
8 N
ovem
ber
2014
167
Table 7—Monthly average k-lux-hours and annual (k-lux-hours) based on MCA-working hours. Jan Feb Mar Apr May Jun Jul Aug Sep Oct Nov Dec Annual
Horizontal 6.07 7.16 8.724 12.24 15.07 24.18 28.57 16.72 14.99 10.84 7.81 5.87 158.244 Vertical 4.74 5.57 6.696 9.408 11.1 16.34 19.46 12.79 12.11 8.676 6.14 4.51 117.552
glass surfaces; and (3) keep horizontal illuminance levels close to those of vertical illuminance within the gallery or exhibit areas.
Figure 11 shows a cross-section of a gallery within each museum and their daylight-admitting system. The IESNA recommended viewing angles for vertical artwork display size (OP) has to be calculated for each daylight-admitting system point of view. The minimum effective viewing distance for artwork recommended by IESNA is 3.8 cm (1.5 inch) of the view distance for every change of 2.5 cm (1 inch) in the vertical dimension.5
For luminaire mounting position for flat displays on a vertical surface, use the formula as the guide. [(X=Ceiling Height-Eye Level) * 0.577)]. Figure 11 shows the effect of daylight penetration into the space on the second floor gallery and the possible glare problems within the daylight zone.
The uniformity and intensity of horizontal illuminance coming through the skylights vary as a function of the time within the gallery space. The vertical illuminance reaching the open circulation areas within the museum varies as a function of inter-reflection within the shading and the glazing systems. The higher the sun angle is with respect to the skylight, the more illuminance levels reach the vertical surfaces within the MCA open gallery areas. The luminance and illuminance data measured at the glazing were used as input for glare index calculations.81115"1? There exists an average glare rating variation of 5.2-5.8 with a maximum of 10.5 (it is within the comfort zone) through the year within a scale of 0-20. (Table 2).
Hourly weather tape was used to calculate the monthly average internal illuminance levels (horizontal and vertical)
throughout the year. The measured data were used to set the threshold levels. These levels were used as schedule of shadings to simulate the control of daylight admission using the louvers at automated setting (Table 3).
The museum depth, the skylights' slope, and the building orientation have created a cut-off angle in such a way that high illuminance is not reaching the vertical surfaces at all times of day. This effect plus the diffused glazing system (VT = 49 percent, UV = 0.01 percent, and ST = 36 percent) combined with a shading system contributes to reducing the so-called "Hot-Spot" areas in the occupants' viewing field at various times.2021 The lighting level set point is used to maintain the right level of contrast on the wall surfaces. The results based on the computer simulation show the percent time daylight illuminance was above the 300 lx (30 fc) set point. This demonstrates the need for the automatic control system. It is important to note that understanding the correlation among these measured quantities helps identify the appropriate variables to be examined or measured during the evaluation of the luminous environment. For example, on a clear day the luminance of the glass could be estimated 90 percent of the time if the incident surface illuminance were measured at the glazing surface.8
This approach is helpful in reducing the number of photosensors and the selection of their location for positioning the shading device or the threshold setting for the lighting control system in new designs (Table 4). Louvers are at automated settings to limit the incoming daylight to 300 lx or 30 fc.
The illuminance at the glazing surface, the vertical and horizontal illuminance at the second floor were used
I June Q December
Figure 7—The north wall predicted daylight levels (8 = top of the wall, 1 = bottom of the wall at 5 ft increment).
■ No-Shade
D S h a d e
Figure 8—The calculated yearly radiant exposure.
JOURNAL of the Illuminating Engineering Society Summer 1998
Dow
nloa
ded
by [
Uni
vers
ity o
f N
ew M
exic
o] a
t 11:
10 2
8 N
ovem
ber
2014
168
1 u u •a c (0
7000
6000
5000
4000
£ 3000 c t
E 2000 •a & 1000 o « c « e E 3
^ ^ ^ ^ ^
CM O O O <M
CM O
eg CM
CM o CM CM
CM O CO O CO
CM o •* CM CO
CM O
CO
CM O CO o ■ *
CM O
CM t
CM O CO <sr
CM O
O IO
CM O O CO w
CM O
U) If)
CM O CM CO
CM O co CO CO
CM O •<* CO
CM O in
K
CM O CO co f>-
CM o in i^
CM o CO CO
CM O
co co
Figure 9—Luminiance and correlated color temperature measured at the ceiling in gallery space
as an input for the set illuminance points in the DOE2.1E program (using hourly weather tape of Chicago) to compute the percent of the hours the gallery lighting levels are in the specified illuminance range and the percent of the hours the gallery lighting levels exceeded the specified range (Table 5). Louvers are at automated settings to limit the incoming daylight.
The measured illuminance at various locations were used as an input for die calculation of the monthly average k-lux-hours and annual k-lux-hours (footcandle hours) based on MCA's 1440 working hours per year.
G-H-ILL G-V-@EAST G-V-@SOUTH G-V-@NORTH
Figure 10—Horizontal and vertical illuminance measured at the eye height inside the gallery.
The limit or criterion for objects with highly susceptible display materials is 120k-lx-hours per year (12k-fc-hours per year), and the limit for moderately susceptible display materials is 180k-lx-hours per year (18k-fc-hours per year). The spectral distribution of daylight condition was evaluated using the pyronometer measuring the radiant energy (W/m2) while the lux levels (lm/m2) were measured using a photometer. These on-site measured data were used to normalized the availability data for Chicago (Table 7). The MCA does comply with the requirements since the vertical and horizontal illuminance levels do not exceed die limits. One objective by Kleihues was to
build a museum that would not interfere with visitors' ability to concentrate on art. He described his design as "an interplay between transparency and containment." This objective was achieved widi the visually effective use of space and light. The University of Michigan Lighting Simulation Laboratory was contracted by die MCA, Ove Arup, and the Kleihues Office to evaluate the performance of die proposed daylighting system at the early stage of the design. The capability available within the daylight simulation facility provided the opportunity to test and try a variety of glazing systems and design solu
tions proposed by the design team to control the daylight conditions widiin die large gallery spaces
Thermal Environment—From the east to the west, along the transparent axis of the building, significant thermal fluctuations occur due to die sun. All die visitor functions except the exhibiting areas are situated in tiiese transparent spaces, i.e., die admission and membership desks, the restaurant and cafe, the elevators, and stairs. The far west side overlooking Michigan Avenue has high solar gains through its large glass wall. Exposed diermal mass and variable air volume (VAV) systems were adopted as an integrated HVAC design for a comfortable temperature at both sides of the building. The east end of die transparent
DAY3
Summer 1998 JOURNAL of the Illuminating Engineering Society
Dow
nloa
ded
by [
Uni
vers
ity o
f N
ew M
exic
o] a
t 11:
10 2
8 N
ovem
ber
2014
169
MIN MAX PERIMETER (VIEWING) ZONES
Figure 11— The effect of daylight penetration into the space and glare problems within the daylight zone.
axial zone is subject to less solar gain due to the shading effect of surrounding buildings.
In the gallery spaces, HVAC criteria was based not only on human temperature comfort levels, but also to maintain required environmental controls for conserving the art on display. Chicago's pollutant levels are high, due mosdy to the prevailing winds bringing gaseous and particulate pollutants from the west. Sulfur dioxide, nitrous oxides, ozone, and chlorides were all potential sources of chemical attack on the artworks, so the air circulation method had to effectively remove these. The gallery spaces are served by an outside air handling unit (AHU), which contains a prefilter for coarse matter and a bag filter for finer particles after basic filtration. The air passes through two carbon filters, the first to remove the aggressive chemical substances and the second, even finer, to catch any stray remaining carbon particles. When the pollutant concentrations have been reduced, the air is chilled or heated as appropriate. The AHU also has a heat recovery facility to reuse any useful energy in the returned air.10
Rapid fluctuations in temperature and humidity cause damage to paintings, because paint expands and contracts due to water within its base being absorbed and evaporated. This is controlled via a network of sensors
Figure 12— MCA gallery space.
strategically located in the gallery spaces, so that changes in the state of the air can be quickly detected. They incorporate a triple redundancy back-up system and are regularly calibrated. The network of sensors forms part of the control system for the air-conditioning system which maintains conditions within narrow ranges at a constant air temperature of 70 F with a relative humidity of 50 percent.10
Such close control is not required in the office spaces, but to satisfy the variable occupancy loads and temperature requirements, a fan coil system with local control is used. Fresh air is introduced into the offices and the fan coil recirculates the room air. For areas like the restaurant and auditorium, "economizer" AHUs vary the air volume supplied according to the occupancy loads.
Conclusions The following sections summarize the major findings
based on the analyses of the database using simulated, on site measured data and the architectural details. The following recommendations are essential for the illumination of light-sensitive materials when spectral damage (color change) must be prevented:
1. Maintain a constant and low acceptable level of illuminance.
JOURNAL of the Illuminating Engineering Society Summer 1998
Dow
nloa
ded
by [
Uni
vers
ity o
f N
ew M
exic
o] a
t 11:
10 2
8 N
ovem
ber
2014
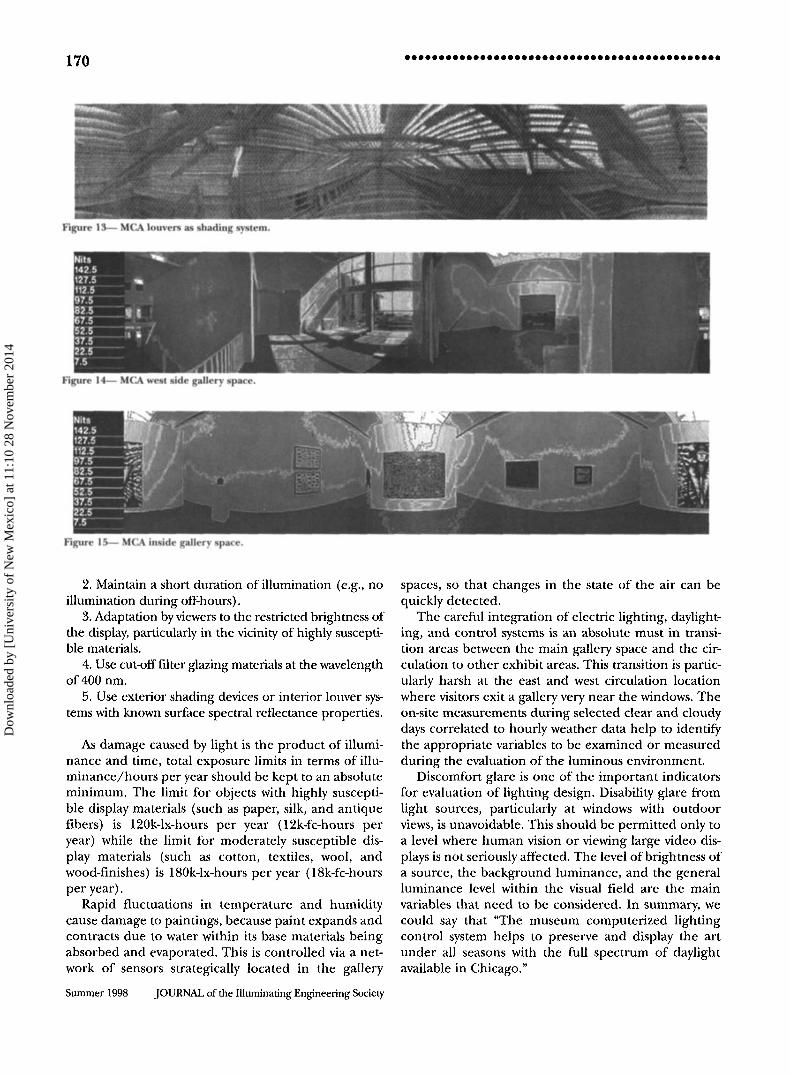
Figure 13— MCA louvers as shading system.
*% i«H 5*SS»«»
Figure 14— MCA west side gallery space.
Figure 15— MCA inside gallery space.
2. Maintain a short duration of illumination (e.g., no illumination during off-hours).
3. Adaptation by viewers to the restricted brightness of the display, particularly in the vicinity of highly susceptible materials.
4. Use cut-off filter glazing materials at the wavelength of400nm.
5. Use exterior shading devices or interior louver systems with known surface spectral reflectance properties.
As damage caused by light is the product of illuminance and time, total exposure limits in terms of illuminance/hours per year should be kept to an absolute minimum. The limit for objects with highly susceptible display materials (such as paper, silk, and antique fibers) is 120k-lx-hours per year (12k-fc-hours per year) while the limit for moderately susceptible display materials (such as cotton, textiles, wool, and wood-finishes) is 180k-lx-hours per year (18k-fc-hours per year).
Rapid fluctuations in temperature and humidity cause damage to paintings, because paint expands and contracts due to water within its base materials being absorbed and evaporated. This is controlled via a network of sensors strategically located in the gallery
spaces, so that changes in the state of the air can be quickly detected.
The careful integration of electric lighting, daylight-ing, and control systems is an absolute must in transition areas between the main gallery space and the circulation to other exhibit areas. This transition is particularly harsh at the east and west circulation location where visitors exit a gallery very near the windows. The on-site measurements during selected clear and cloudy days correlated to hourly weather data help to identify the appropriate variables to be examined or measured during the evaluation of the luminous environment.
Discomfort glare is one of the important indicators for evaluation of lighting design. Disability glare from light sources, particularly at windows with outdoor views, is unavoidable. This should be permitted only to a level where human vision or viewing large video displays is not seriously affected. The level of brightness of a source, the background luminance, and the general luminance level within the visual field are the main variables that need to be considered. In summary, we could say that "The museum computerized lighting control system helps to preserve and display the art under all seasons with the full spectrum of daylight available in Chicago."
Summer 1998 JOURNAL of the Illuminating Engineering Society
Dow
nloa
ded
by [
Uni
vers
ity o
f N
ew M
exic
o] a
t 11:
10 2
8 N
ovem
ber
2014
171
References 1. Hilbert, G.S. and Krochmann, J. 1986. Color
change of exhibition goods by optical radiation. Second International Daylighting Conference, Long Beach, CA.
2. Preservation of the Declaration of the Independence and the Constitution of the United States. 1951. NBS Circular 505, Washington, DC.
3. Illuminating Engineering Society. 1970. Lighting of Art Galleries and Museums. IES Technical Report No. 14. London.
4. Feller, R.L. 1962. The Deteriorating effect of light on museum objects. Museum News Technical Supplement. National Gallery of Art Research Project, Mellon Institute, (no. 3).
5. 1996. Museum and Art Gallery Lighting: A recommended Practice. IESNA RP-30-96. New York: IESNA.
6. Fisher, T. 1984. Shedding some light on art. Progressive Architecture. 105-111.
7. Nawab, M. 1996. Never mind the bollards ... here's the rock and roll hall of fame. LD+A 25 (no. 3):24-30.
8. Nawab, M., Altland, G. 1997. Application of the CIE, Glare index for Daylighting Evaluation. J of the JES
27 (no. 2):115-128. 9. Nawab, M. 1993. Art museum: a daylighting dilem
ma. LD+A 23 (no. 5):48-56. 10. Martin, N., Sedgwick, A. 1996. Museum of
Contemporary Art (MCA) in Chicago. The ARUPJournal (no. 3).
11. Nawab, M. 1996. Scale model photometry techniques under simulated sky conditions. J of the IES25 (no. 2):160-172.
12. Love, J., Nawab, M. 1994. Application of (V/H Ratio) a new daylight performance indicator. / of the IES 23 (no. 2):50-61.
13. Nawab, M., Prayhoonang, C. 1995. Application of die new standards for the evaluation of daylight and solar availabilitymeasurements./o/^ZE524 (no. 2):113-130.
14. Nawab, M., Siminovitch, M., and Love J. 1997. Variability of daylight in luminous environment." J of the ZES26(no. 2):101-114.
15. Nawab, M. and Uetani, Y 1993. Cloud cover measurements using color video images. Lux Europa Proceedings, vol. 1
16. Henderson, S.T. 1970. Daylight and its Spectrum. New York: American Elsevier Publishing Company Inc., 101-105, 180-183.
17. Nawab, M. 1998. New Technology for Designing Daylighting Systems for Art Museums. Architectural Record (no. 2): 210-211.
18. Florentine, FA. 1988. Separate but equal: Manufacturers urged to standardize track and track fixtures. Lighting Dimensions 11 (no. 7): 122-123.
19. Florentine, FA. 1988. Bag of tricks: museum designer draws on stage LD experience to solve new
design problems. Lighting Dimensions 12(no. 3):112-113. 20. Michalski, S. 1987. Damage to museum objects by
visible radiation (light) and ultraviolet radiation (UV). Proceedings of Conference on Lighting in Museums: 3-16. Bristol University, UK.
21. Howie, F. M. 1992. The Care and Conservation of Geological Material. 1st Edition. London: Butterworths Heineman, 11-24.
Discussion The Museum of Contemporary Art project exempli
fies the complexity of daylighting application in art museums.
The author makes reference to two sets of criteria for limiting light exposure of sensitive materials. One set, which is more restrictive (e.g., an annual limit of 50,000 lux-hours for the most sensitive materials), is consistent with values specified in the IESNA Lighting Handbook. The odier set allows an exposure of 120,000 lux-hours per year for the same category of materials. The latter is used in judging the daylighting system to be satisfactory (although estimates given in the paper show it to be exceeded on horizontal surfaces). Could the author explain the basis for selecting the latter set of criteria over the former?
Louvers are shown in Figure 13. What is the range of control of daylight admission? Can these be used to completely exclude daylight? It is noted that lux-hour recording is used to ensure that limiting exposures are respected. Is this achieved by removing the works when the limit is approached or by adjusting the admission of light to the galleries?
The calculations of light exposures are based on the working hours at die MCA. Figure 10 (horizontal and vertical illuminances measured at eye height inside a gallery) appears to show that daylight is present as long as daylight is available outdoors. Is the louver system used to regulate exposures when the museum is closed to die public?
Figure 10 shows illuminances exceeding 1000 lx (100 decalux) on vertical surfaces. Table 5 also shows that light levels on the vertical exceeded 300 lx more than 67 percent of the time. However, the criteria for sensitive materials limit the maximum daylight illuminance to about 50 lx. Could die author explain?
The fact that measurements of visible and total radiation from die sky and sun (real or simulated) are typically made with instruments tiiat integrate radiation at various wavelengdis presents some difficulties. IESNA lux-hour criteria are also specified in lux. Yet, Figure 1 shows diat selected light-sensitive materials are especially affected by light at wavelengdis below 550 nm (aldiough die MCA skylight glazing was specified to exclude wavelengths below 400 nm). Color-corrected photocells are
JOURNAL of the Illuminating Engineering Society Summer 1998
Dow
nloa
ded
by [
Uni
vers
ity o
f N
ew M
exic
o] a
t 11:
10 2
8 N
ovem
ber
2014
172
weighted to be substantially less sensitive to wavelengths near 400 mm than those near 550 nm. Yet, CIE standard spectra for daylight in the IESNA Handbook show that it is heavily weighted in wavelengths below 500 nm. The relationship between the spectral distribution of the artificial sky and sun used in the design studies and the spectral distribution of light from the real sky and sun are not discussed. It is likely that the daylight availability data for Chicago were also derived from radiation data using a luminous efficacy function, which would not reflect the time-varying spectral distribution of daylight. How were allowances made for these differences between the spectral characteristics of the sources, the spectral responses of the measurement systems, and the spectral sensitivities of the artifacts?
James A. Love University of Calgary
Author's response
To James A. Love The two sets of criteria for limiting light exposure of
sensitive materials to irradiance levels or their equivalent (50K-lx-hours and the 120K-lx hours) are based on the IESNA and CIE publications.135 As it has been stated in Museum and Art Gallery Lighting: A recommended Practice: IESNA RP-30-96, "There are no standards giving acceptable irradiance levels, nor are there meters for checking such levels. Protection depends on the vigilance of the museum staff."
The range of control of daylight admission using the louvers is automated and it varies from 4 inches of opening within the slate or the blades to completely closed. This option is used to ensure that limiting exposures are respected.
Yes, schedule of the museum is incorporated within the lighting control system. The system has an override capability to regulate exposures when the museum is closed to the public.
The results in this paper are based on the fully open louvers in order to examine the worst conditions during our postoccupancy testing. The calculated lux-hours were based on the MCA schedule of 1440 hours per year simulated control of daylight admission using the louvers. The 300 lx was a selected criterion by the museum staff and the 50 lx is based on the IESNA recommendations.
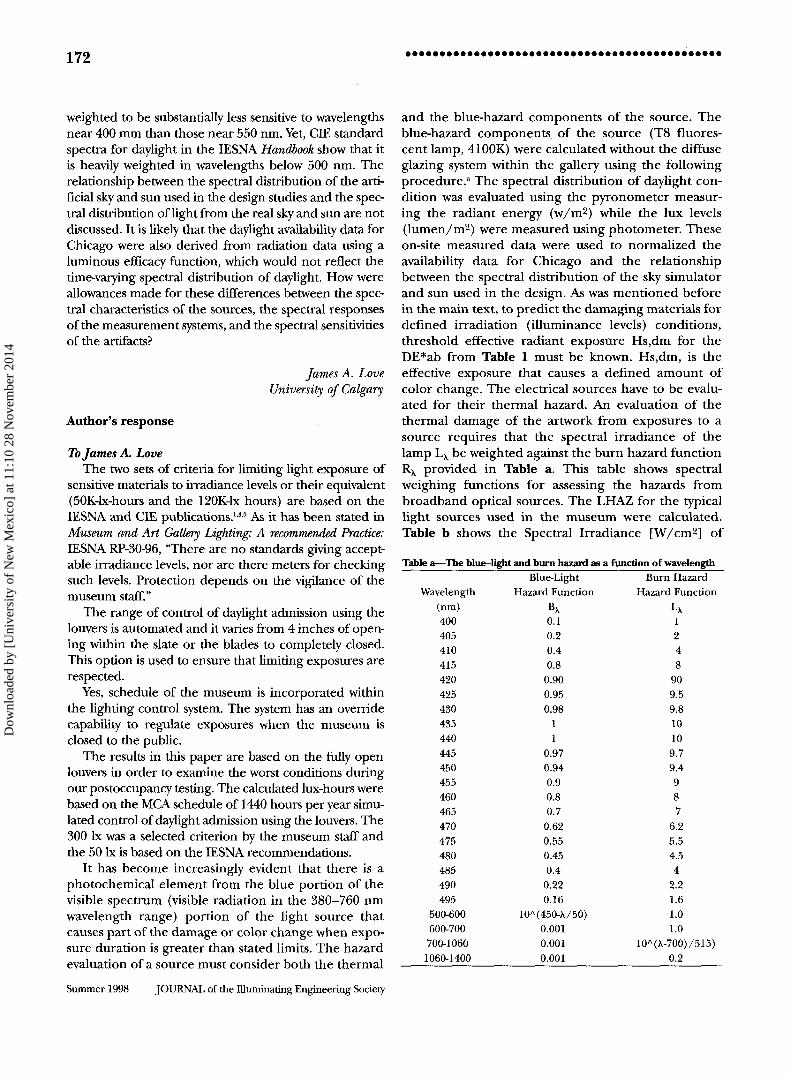
It has become increasingly evident that there is a photochemical element from the blue portion of the visible spectrum (visible radiation in the 380-760 nm wavelength range) portion of the light source that causes part of the damage or color change when exposure duration is greater than stated limits. The hazard evaluation of a source must consider both the thermal
and the blue-hazard components of the source. The blue-hazard components of the source (T8 fluorescent lamp, 4100K) were calculated without the diffuse glazing system within the gallery using the following procedure.* The spectral distribution of daylight condition was evaluated using the pyronometer measuring the radiant energy (w/m2) while the lux levels (lumen/m2) were measured using photometer. These on-site measured data were used to normalized the availability data for Chicago and the relationship between the spectral distribution of the sky simulator and sun used in the design. As was mentioned before in the main text, to predict the damaging materials for defined irradiation (illuminance levels) conditions, threshold effective radiant exposure Hs,dm for the DE*ab from Table 1 must be known. Hs,dm, is the effective exposure that causes a defined amount of color change. The electrical sources have to be evaluated for their thermal hazard. An evaluation of the thermal damage of the artwork from exposures to a source requires that the spectral irradiance of the lamp L^ be weighted against the burn hazard function R^ provided in Table a. This table shows spectral weighing functions for assessing the hazards from broadband optical sources. The LHAZ for the typical light sources used in the museum were calculated. Table b shows the Spectral Irradiance [W/cm2] of
Table a—The blue-light and burn hazard as a {unction of wavelength
Wavelength (nm) 400 405 410 415 420 425 430 435 440 445 450 455 460 465 470 475 480 485 490 495
500-600 600-700 700-1060 1060-1400
Blue-Light Hazard Function
% 0.1 0.2 0.4 0.8
0.90 0.95 0.98
1 1
0.97 0.94 0.9 0.8 0.7
0.62 0.55 0.45 0.4
0.22 0.16
10A(450-\/50) 0.001 0.001 0.001
Burn HE Hazard Fu
Lx 1 2 4 8
90 9.5 9.8 10 10 9.7 9.4 9 8 7
6.2 5.5 4.5 4
2.2 1.6 1.0 1.0
IOA(\-7OO; 0.2
Summer 1998 JOURNAL of the Illuminating Engineering Society
Dow
nloa
ded
by [
Uni
vers
ity o
f N
ew M
exic
o] a
t 11:
10 2
8 N
ovem
ber
2014
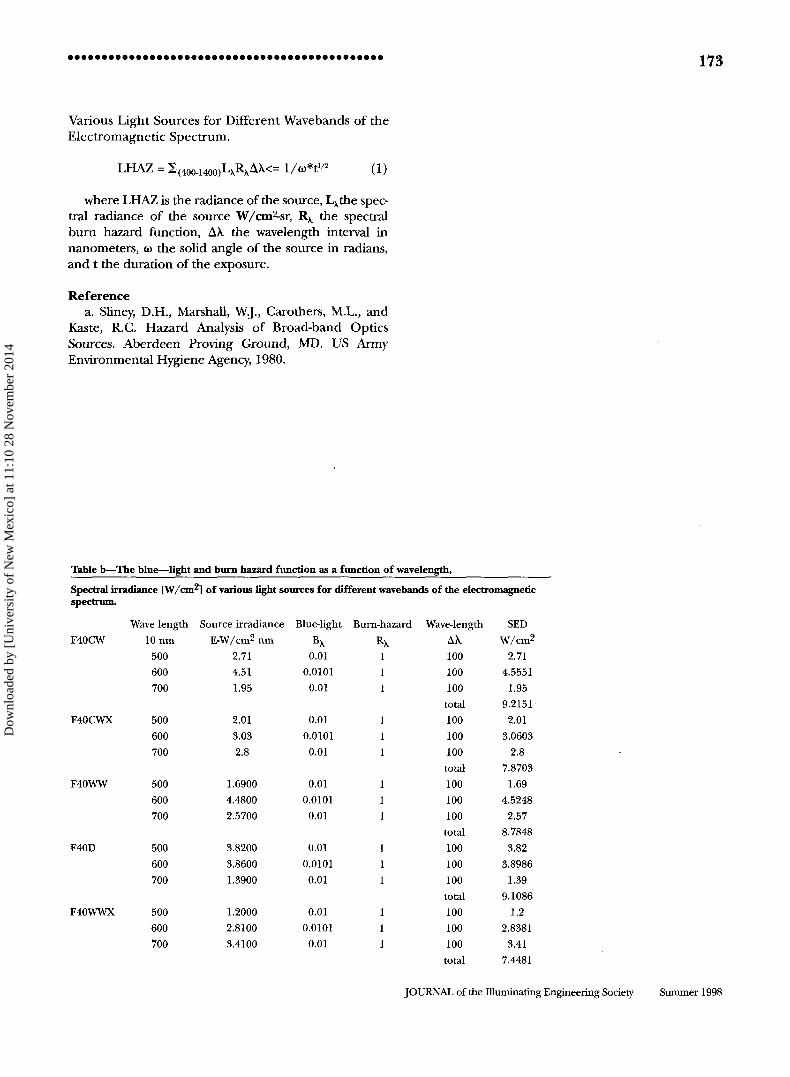
Various Light Sources for Different Wavebands of the Electromagnetic Spectrum.
LHAZ - X(400_1400)LXRXAA.<- l/w*t1/2 (1)
where LHAZ is the radiance of the source, L^the spectral radiance of the source W/cm^sr, R^ the spectral burn hazard function, AX the wavelength interval in nanometers, to the solid angle of the source in radians, and t the duration of the exposure.
Reference a. Sliney, D.H., Marshall, W.J., Carothers, M.L., and
Kaste, R.C. Hazard Analysis of Broad-band Optics Sources. Aberdeen Proving Ground, MD. US Army Environmental Hygiene Agency, 1980.
Table b—The blue—light
Spectral irradiance [W/cm spectrum.
F40CW
F40CWX
F40WW
F40D
F40WWX
Wave length 10 nm
500 600 700
500 600 700
500 600 700
500 600 700
500 600 700
and burn hazard function as a function of wavelength,
2] of various light sources for different wavebands of the electromagnetic
Source irradiance E-W/cm2 nm
2.71 4.51 1.95
2.01 3.03 2.8
1.6900 4.4800 2.5700
3.8200 3.8600 1.3900
1.2000 2.8100 3.4100
Blue-light
% 0.01
0.0101 0.01
0.01 0.0101
0.01
0.01 0.0101
0.01
0.01 0.0101
0.01
0.01 0.0101
0.01
Burn-hazard
Rx Wave-length
AX 100 100 100
total 100 100 100 total 100 100 100
total 100 100 100 total 100 100 100
total
SED W/cm2
2.71 4.5551
1.95 9.2151
2.01 3.0603
2.8 7.8703
1.69 4.5248
2.57 8.7848
3.82 3.8986
1.39 9.1086
1.2 2.8381
3.41 7.4481
JOURNAL of the Illuminating Engineering Society
Dow
nloa
ded
by [
Uni
vers
ity o
f N
ew M
exic
o] a
t 11:
10 2
8 N
ovem
ber
2014
Recommended