Data Visualizations: Drawing Actionable
Insights from Science and Technology Data
Katy Börner
Victor H. Yngve Professor of Information Science
Director, Cyberinfrastructure for Network Science Center
School of Informatics and Computing and Indiana University Network Science Institute
Indiana University, USA
European Food Safety Authority (EFSA)
Scientific Conference: Shaping the Future of Food Safety, Together
Milan, Italy
October 14-16, 2015
Olivier H. Beauchesne, 2011. Map of Scientific Collaborations from 2005-2009.
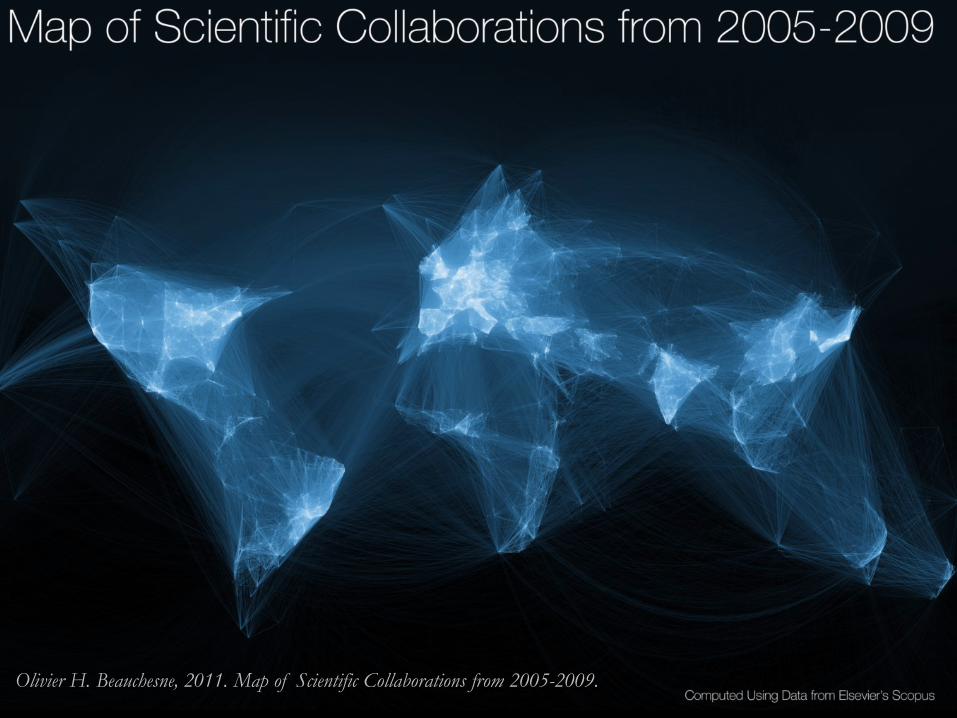
Olivier H. Beauchesne, 2011. Map of Scientific Collaborations from 2005-2009.
Analyzing and Visualizing Science and Technology Trends and Developments
3
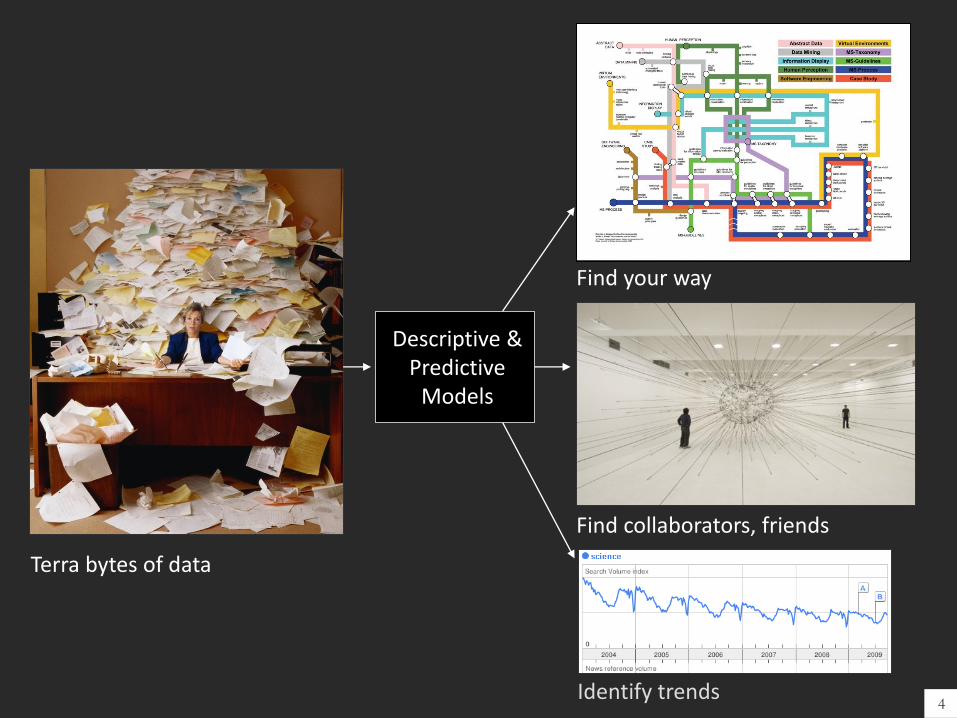
Find your way
Find collaborators, friends
Identify trends
Terra bytes of data
Descriptive & Predictive
Models
4
5
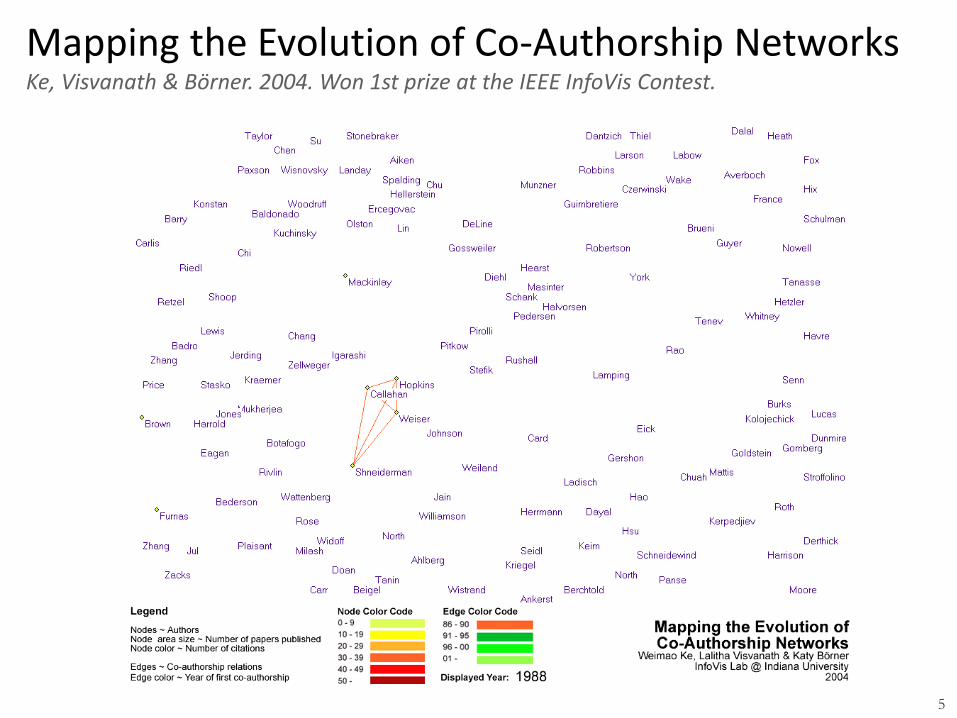
Mapping the Evolution of Co-Authorship Networks Ke, Visvanath & Börner. 2004. Won 1st prize at the IEEE InfoVis Contest.
6
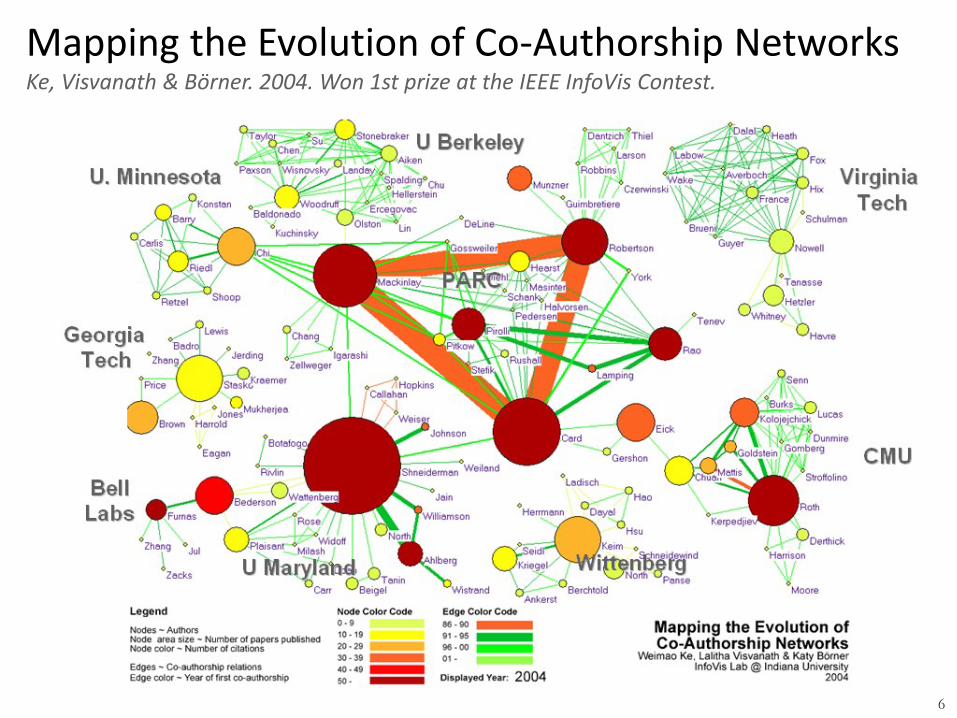
Mapping the Evolution of Co-Authorship Networks Ke, Visvanath & Börner. 2004. Won 1st prize at the IEEE InfoVis Contest.
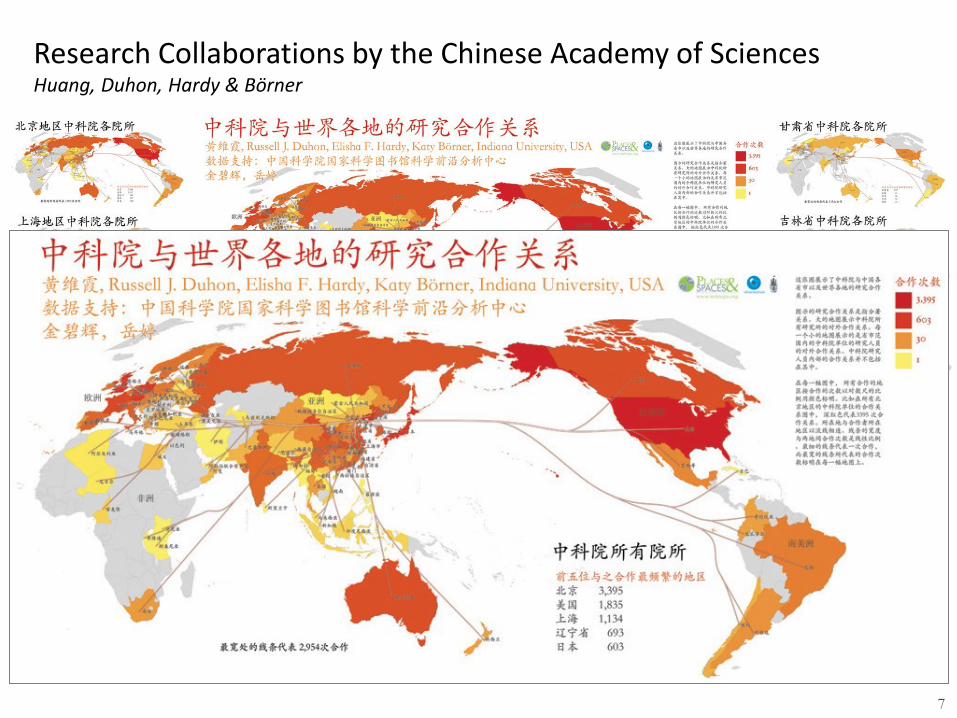
Research Collaborations by the Chinese Academy of Sciences Huang, Duhon, Hardy & Börner
7
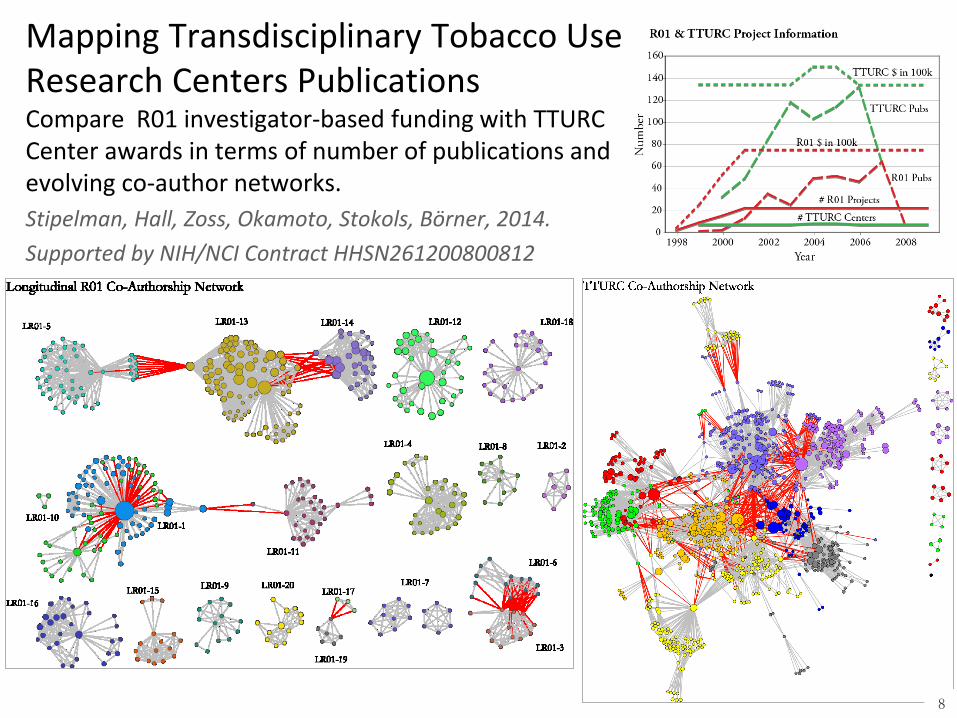
Compare R01 investigator-based funding with TTURC Center awards in terms of number of publications and evolving co-author networks.
Stipelman, Hall, Zoss, Okamoto, Stokols, Börner, 2014.
Supported by NIH/NCI Contract HHSN261200800812
Mapping Transdisciplinary Tobacco Use Research Centers Publications
8
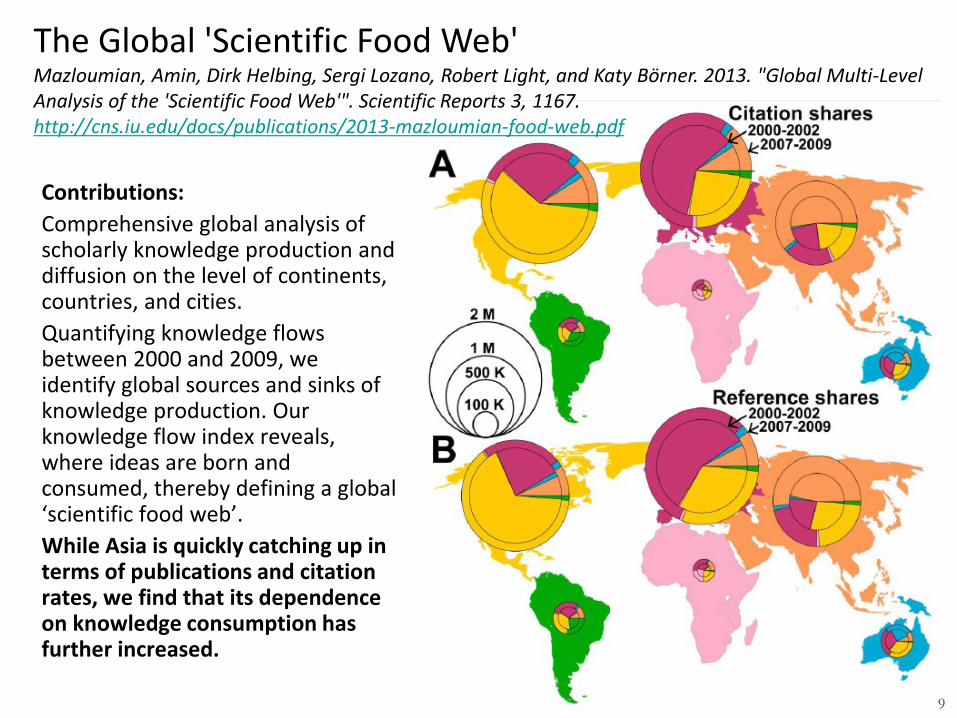
The Global 'Scientific Food Web' Mazloumian, Amin, Dirk Helbing, Sergi Lozano, Robert Light, and Katy Börner. 2013. "Global Multi-Level Analysis of the 'Scientific Food Web'". Scientific Reports 3, 1167. http://cns.iu.edu/docs/publications/2013-mazloumian-food-web.pdf
Contributions:
Comprehensive global analysis of scholarly knowledge production and diffusion on the level of continents, countries, and cities.
Quantifying knowledge flows between 2000 and 2009, we identify global sources and sinks of knowledge production. Our knowledge flow index reveals, where ideas are born and consumed, thereby defining a global ‘scientific food web’.
While Asia is quickly catching up in terms of publications and citation rates, we find that its dependence on knowledge consumption has further increased.
9
10
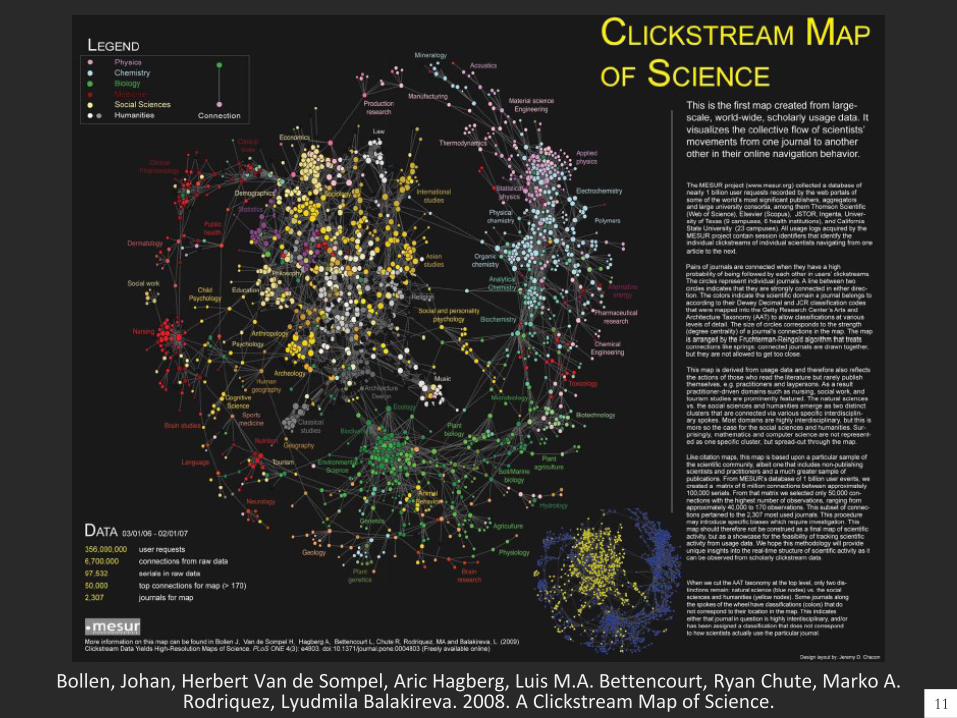
Bollen, Johan, Herbert Van de Sompel, Aric Hagberg, Luis M.A. Bettencourt, Ryan Chute, Marko A. Rodriquez, Lyudmila Balakireva. 2008. A Clickstream Map of Science. 11
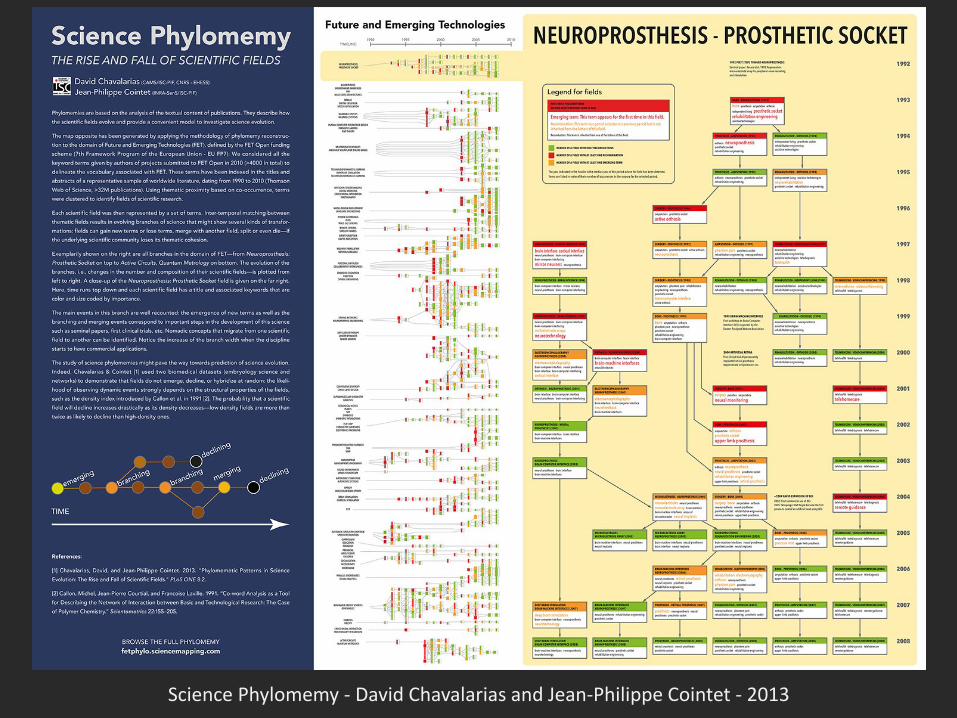
Science Phylomemy - David Chavalarias and Jean-Philippe Cointet - 2013
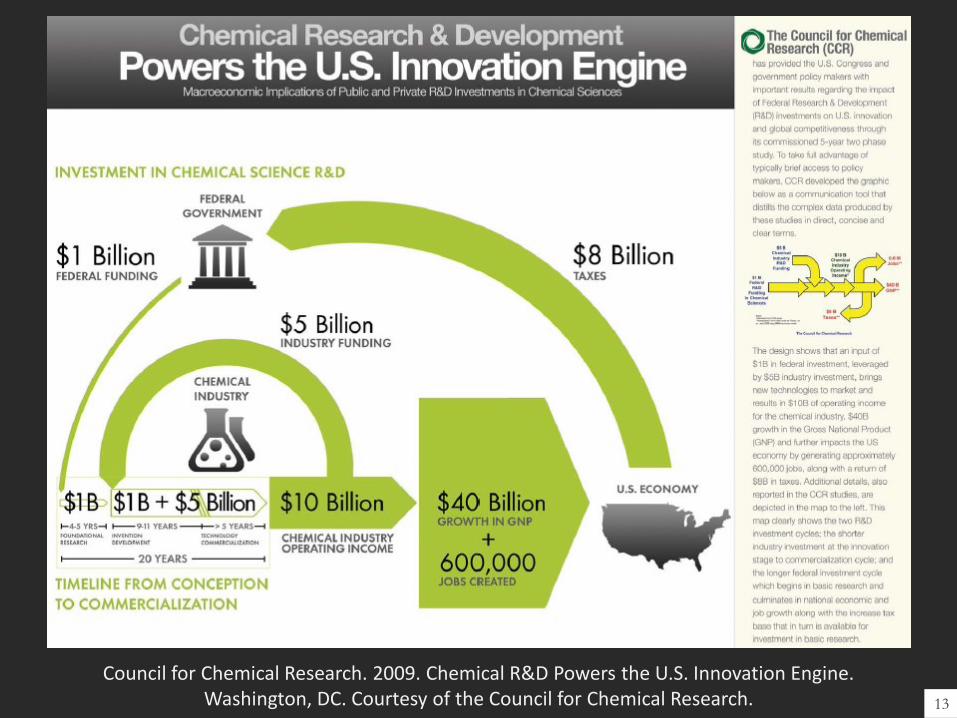
Council for Chemical Research. 2009. Chemical R&D Powers the U.S. Innovation Engine. Washington, DC. Courtesy of the Council for Chemical Research. 13
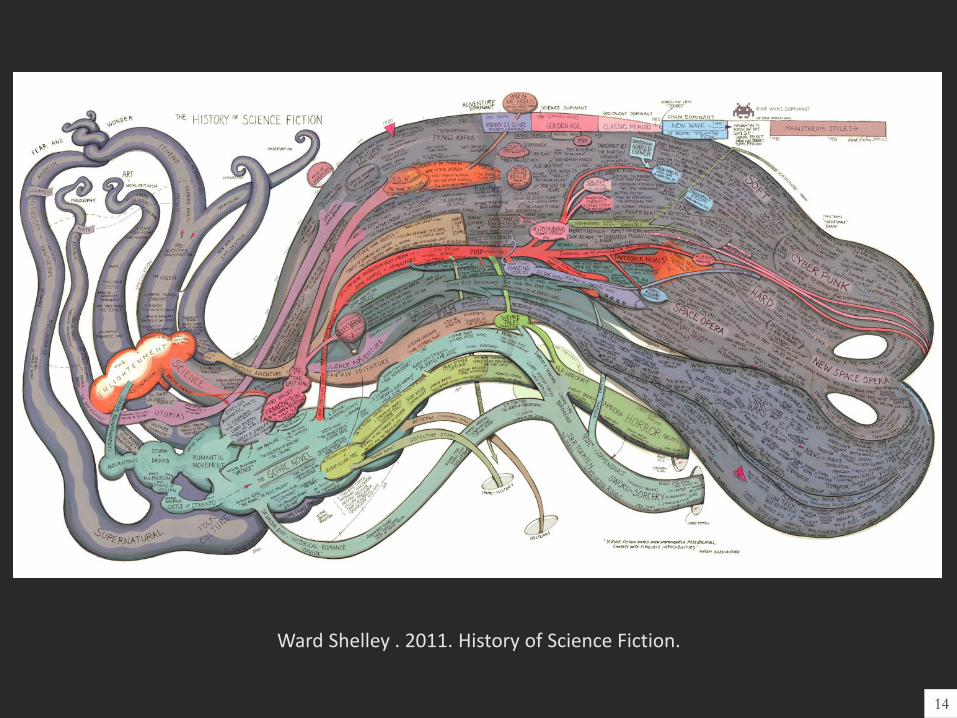
Ward Shelley . 2011. History of Science Fiction.
14
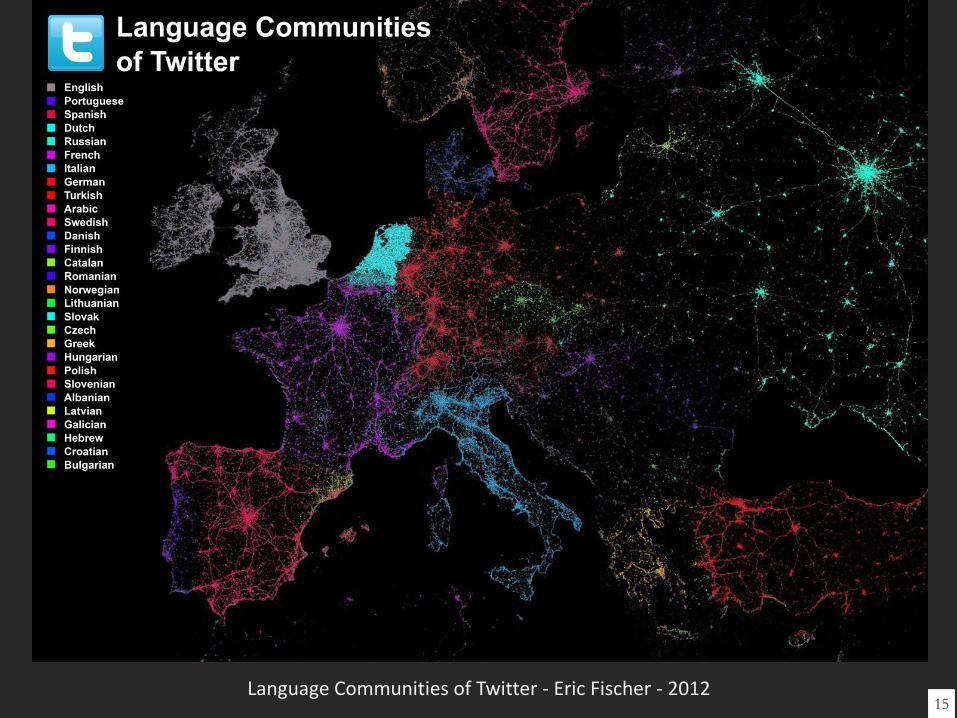
Language Communities of Twitter - Eric Fischer - 2012 15
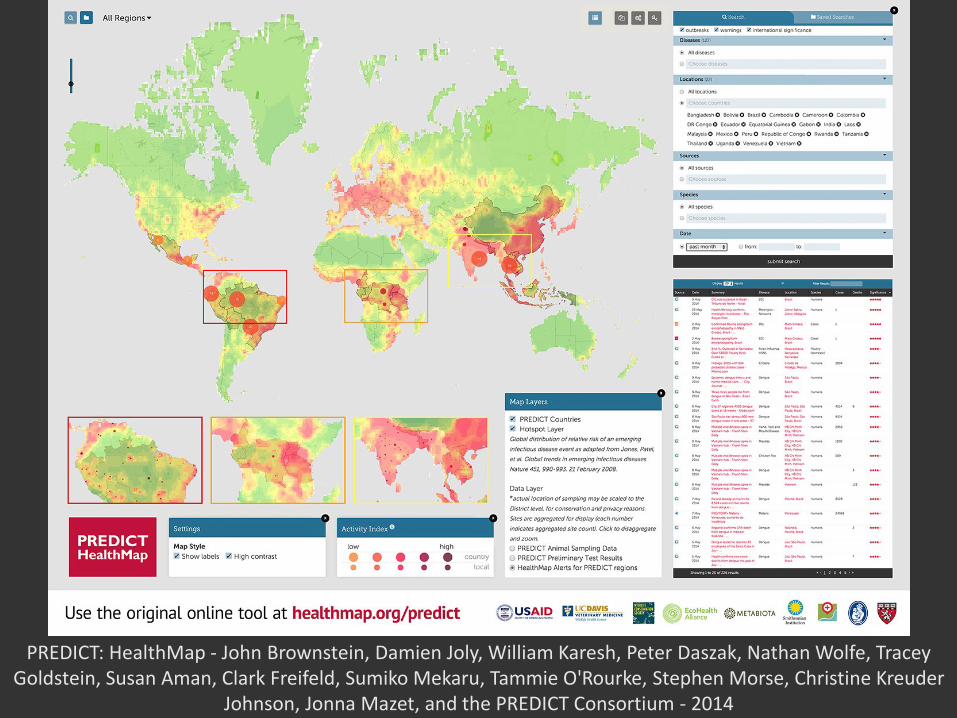
PREDICT: HealthMap - John Brownstein, Damien Joly, William Karesh, Peter Daszak, Nathan Wolfe, Tracey Goldstein, Susan Aman, Clark Freifeld, Sumiko Mekaru, Tammie O'Rourke, Stephen Morse, Christine Kreuder
Johnson, Jonna Mazet, and the PREDICT Consortium - 2014
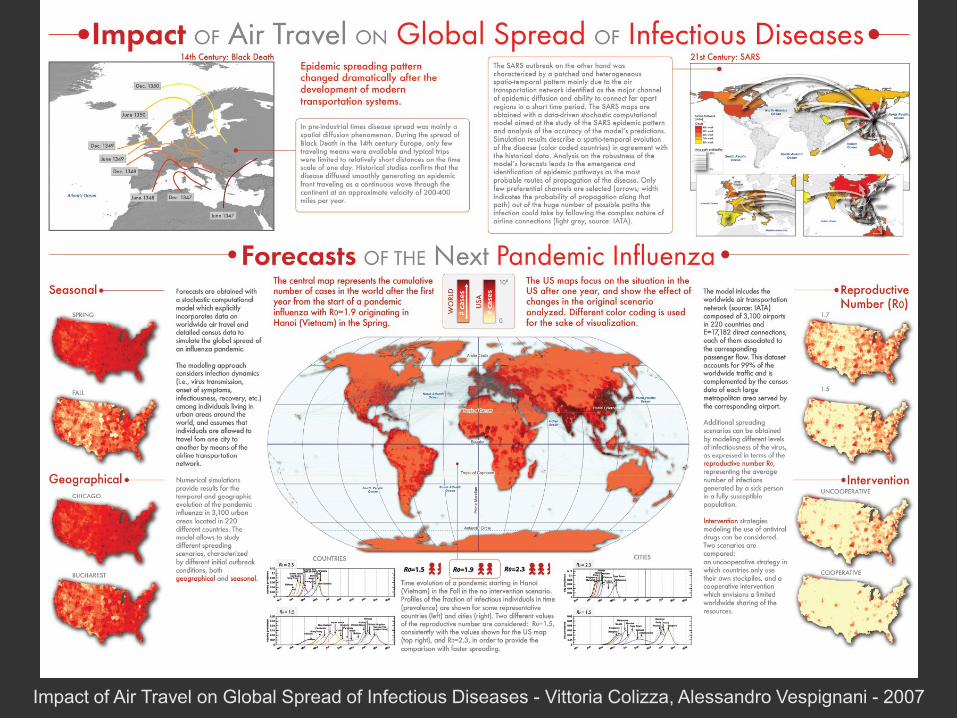
Impact of Air Travel on Global Spread of Infectious Diseases - Vittoria Colizza, Alessandro Vespignani - 2007
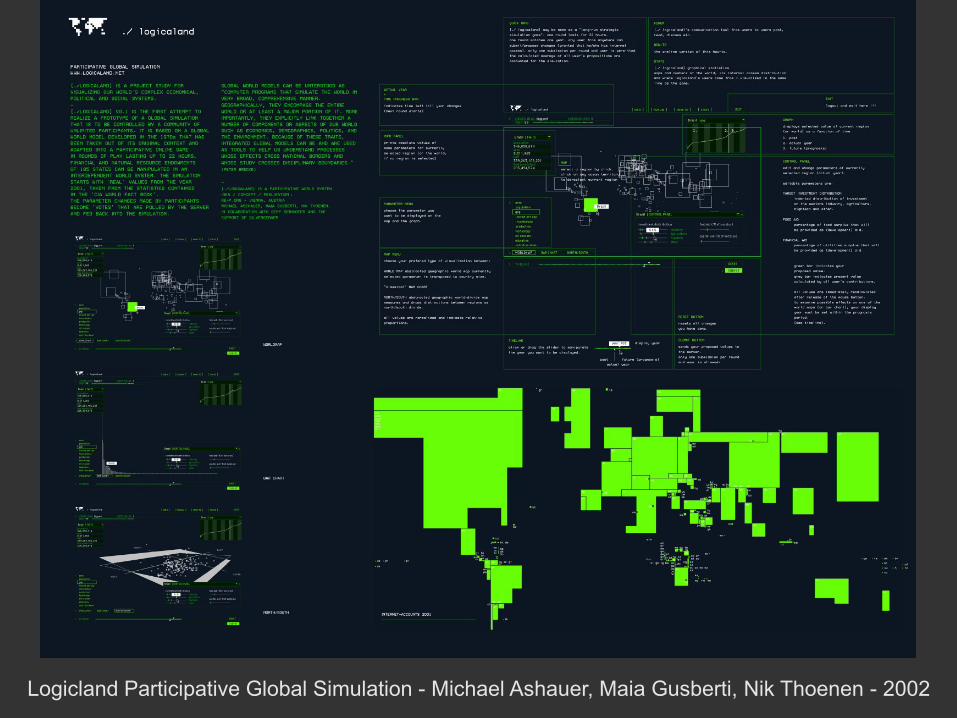
Logicland Participative Global Simulation - Michael Ashauer, Maia Gusberti, Nik Thoenen - 2002
Visualization Frameworks
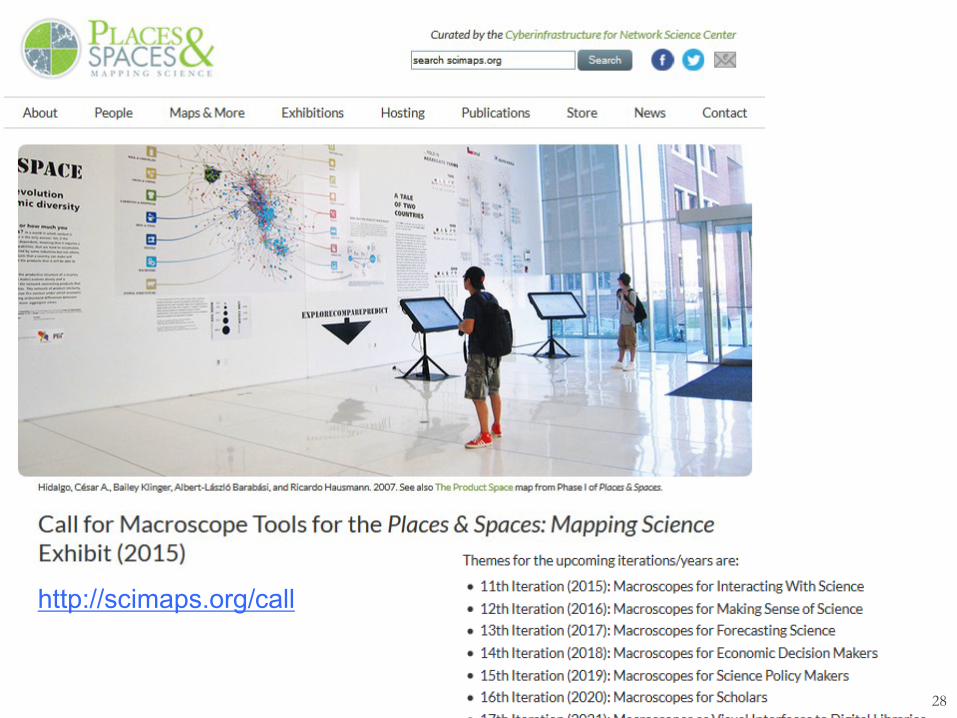
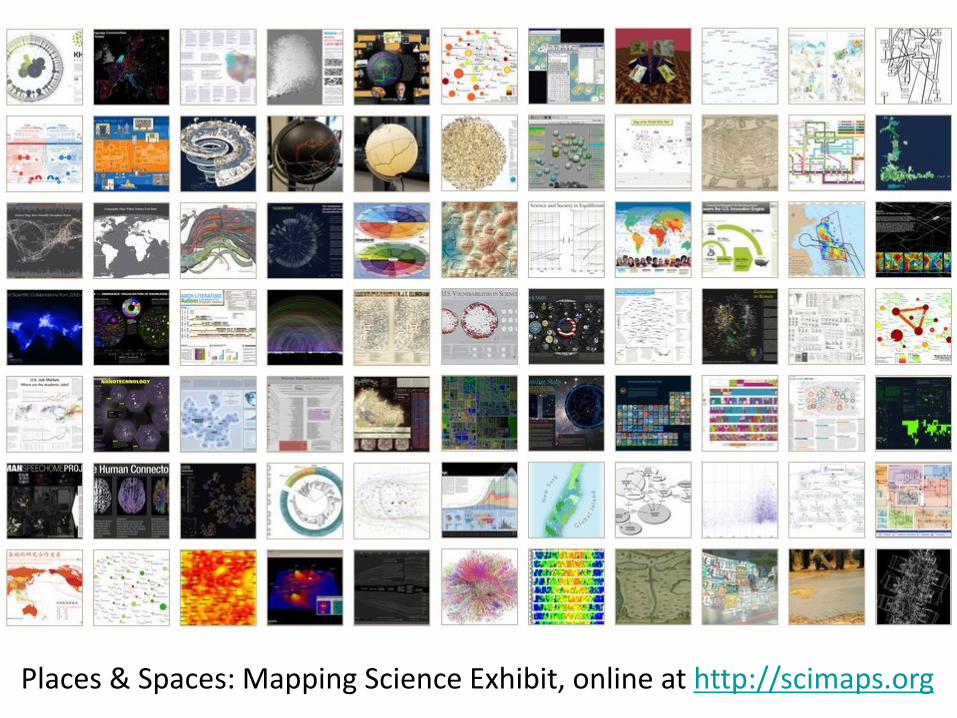
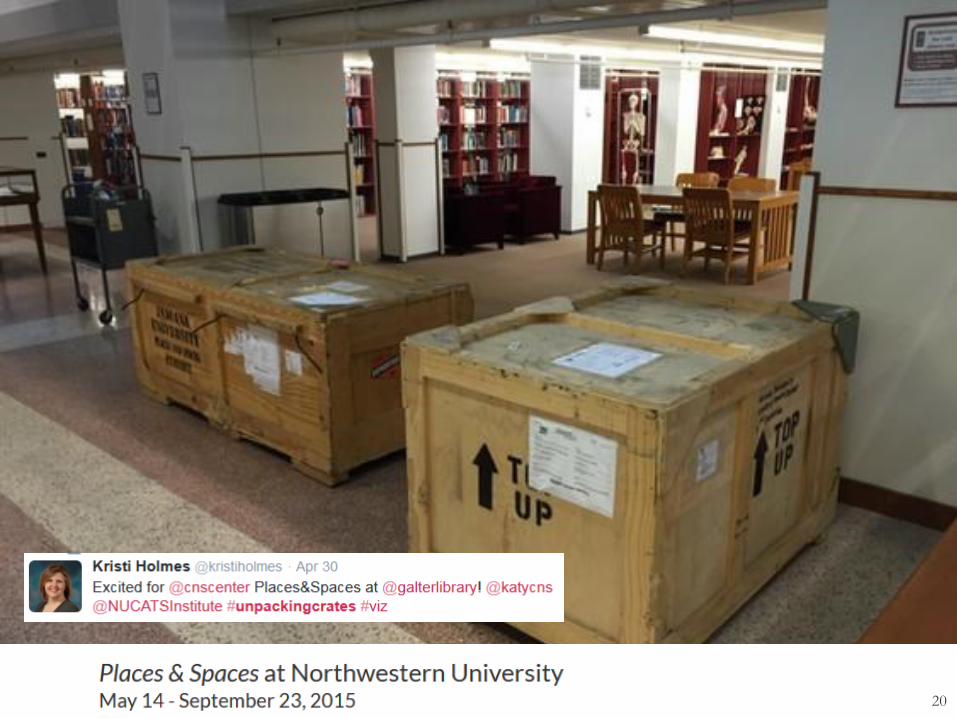
Places & Spaces: Mapping Science Exhibit, online at http://scimaps.org
20
21
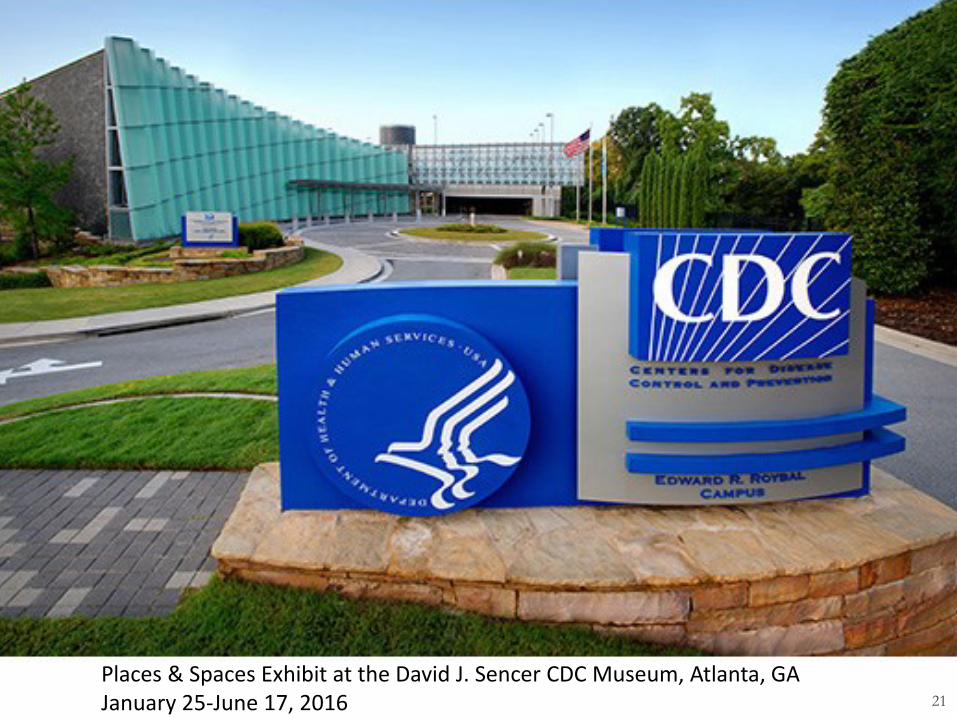
Places & Spaces Exhibit at the David J. Sencer CDC Museum, Atlanta, GA January 25-June 17, 2016
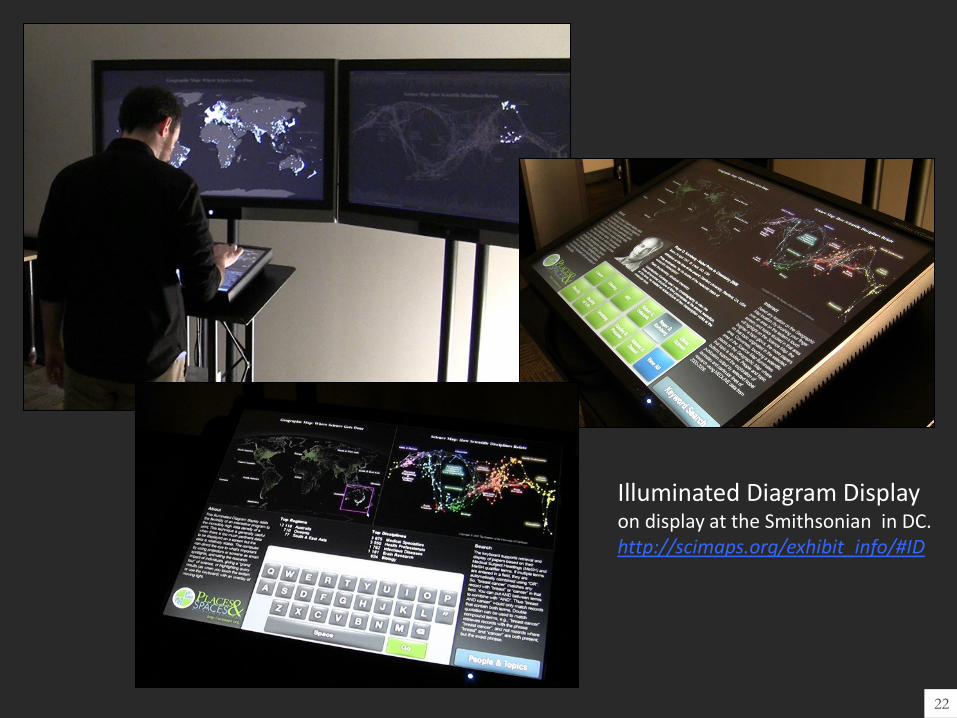
Illuminated Diagram Display on display at the Smithsonian in DC. http://scimaps.org/exhibit_info/#ID
22
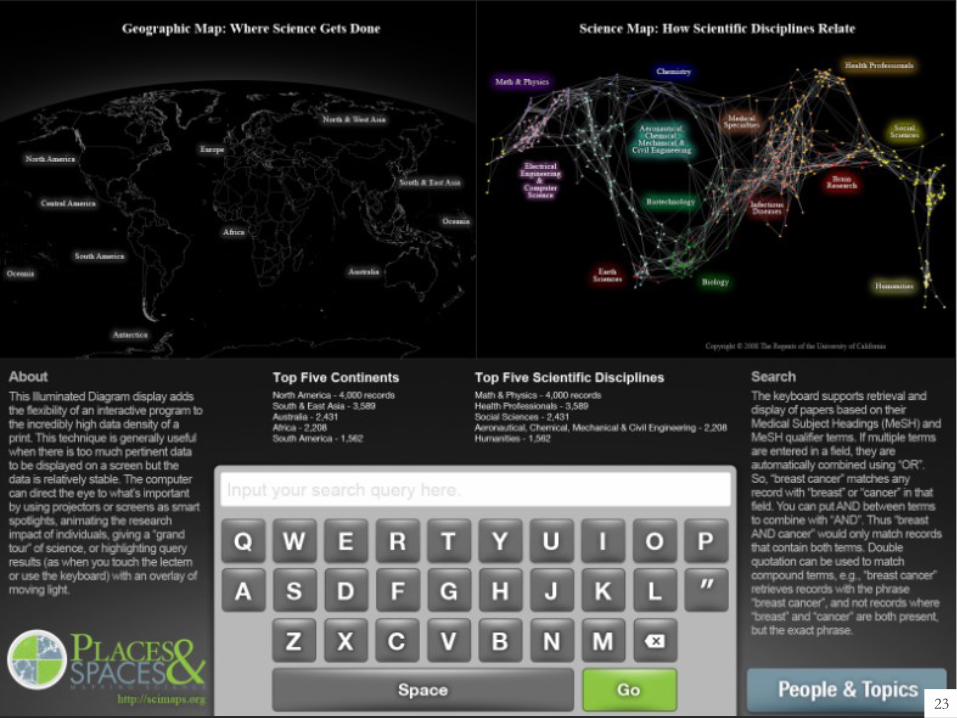
23
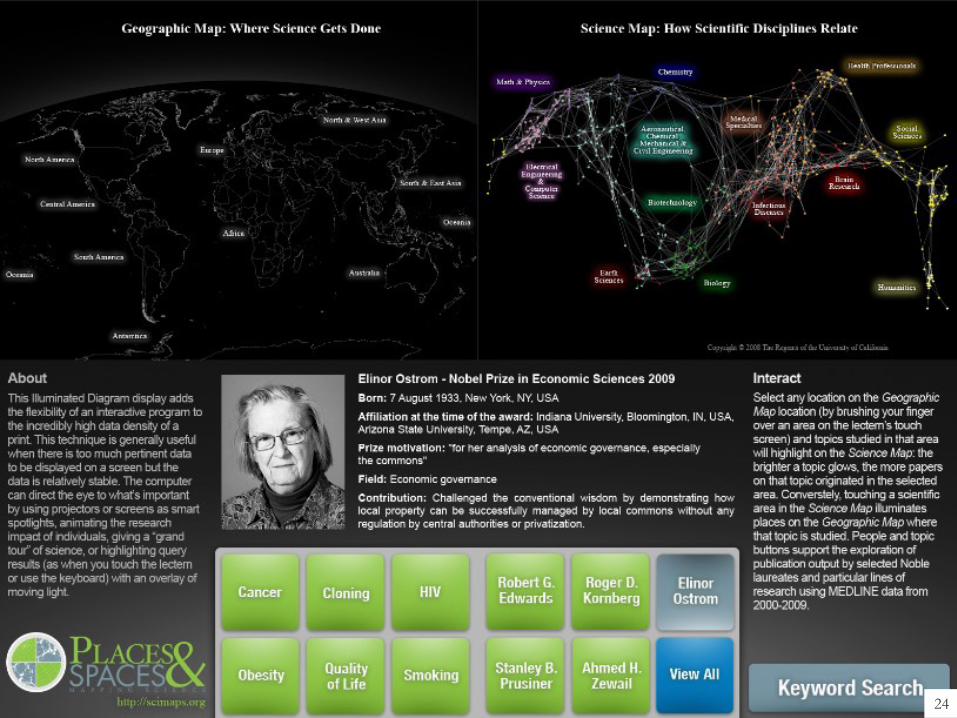
24
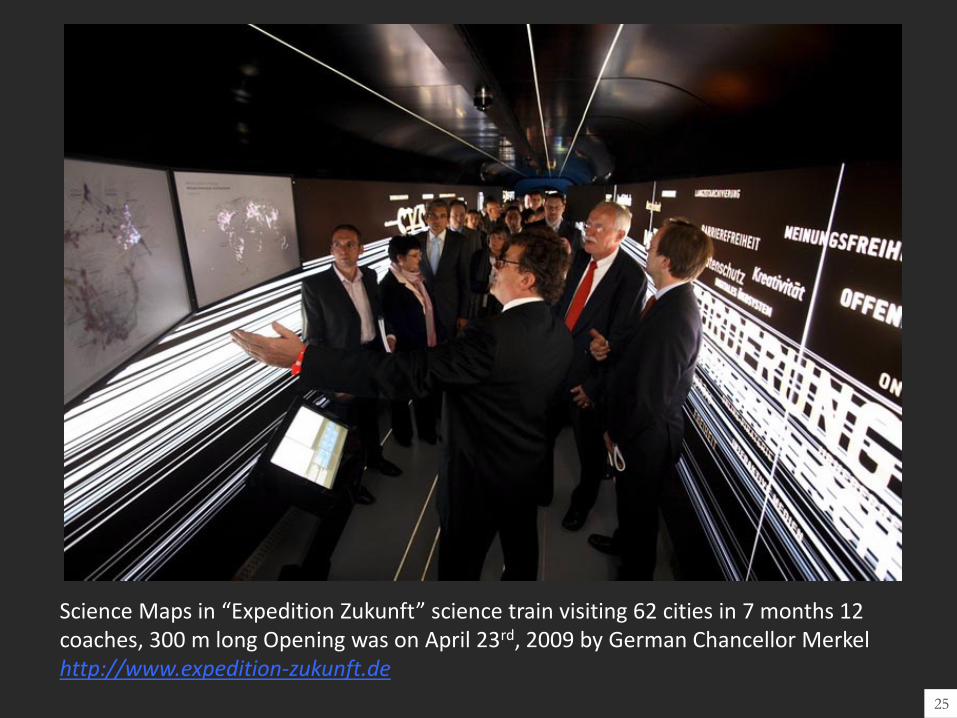
Science Maps in “Expedition Zukunft” science train visiting 62 cities in 7 months 12 coaches, 300 m long Opening was on April 23rd, 2009 by German Chancellor Merkel http://www.expedition-zukunft.de
25
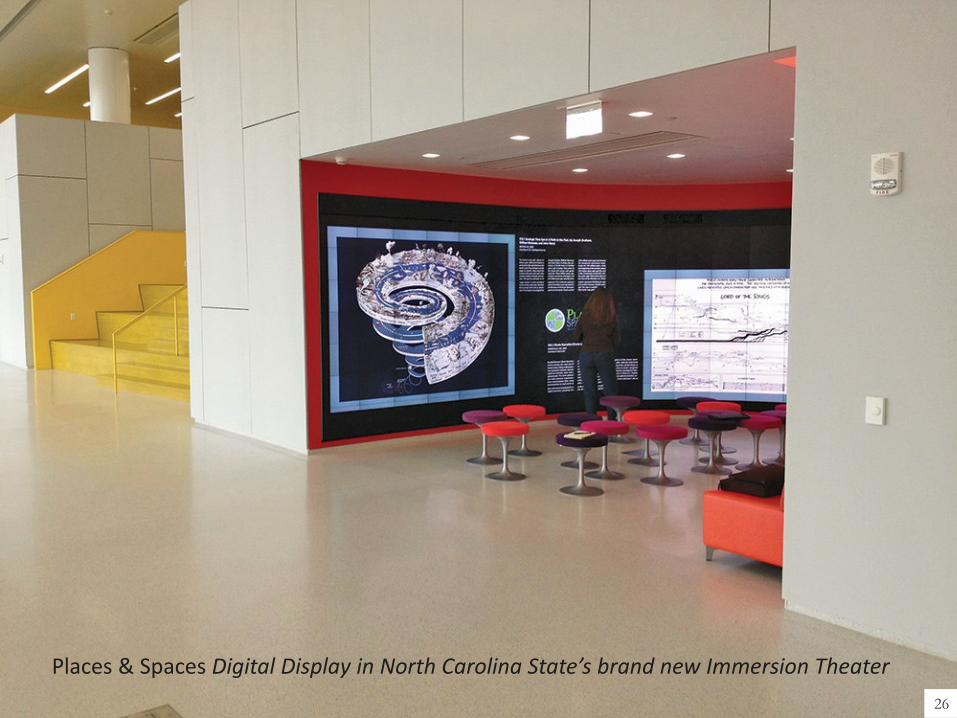
Places & Spaces Digital Display in North Carolina State’s brand new Immersion Theater
26
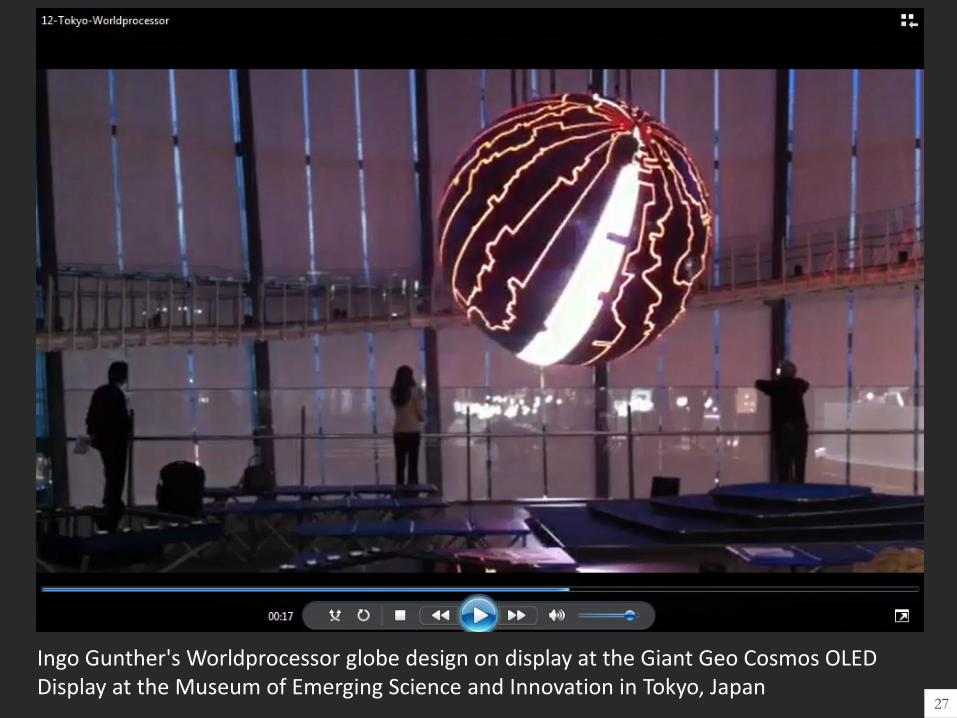
Ingo Gunther's Worldprocessor globe design on display at the Giant Geo Cosmos OLED Display at the Museum of Emerging Science and Innovation in Tokyo, Japan
27
Information Visualization Framework &
IVMOOC
30
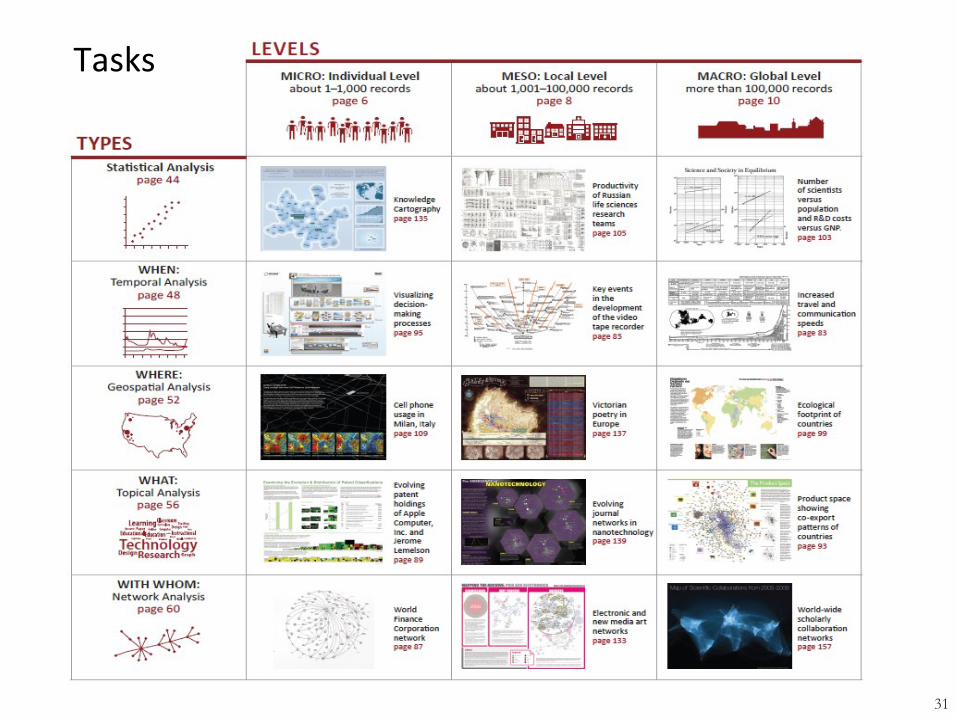
Tasks
31
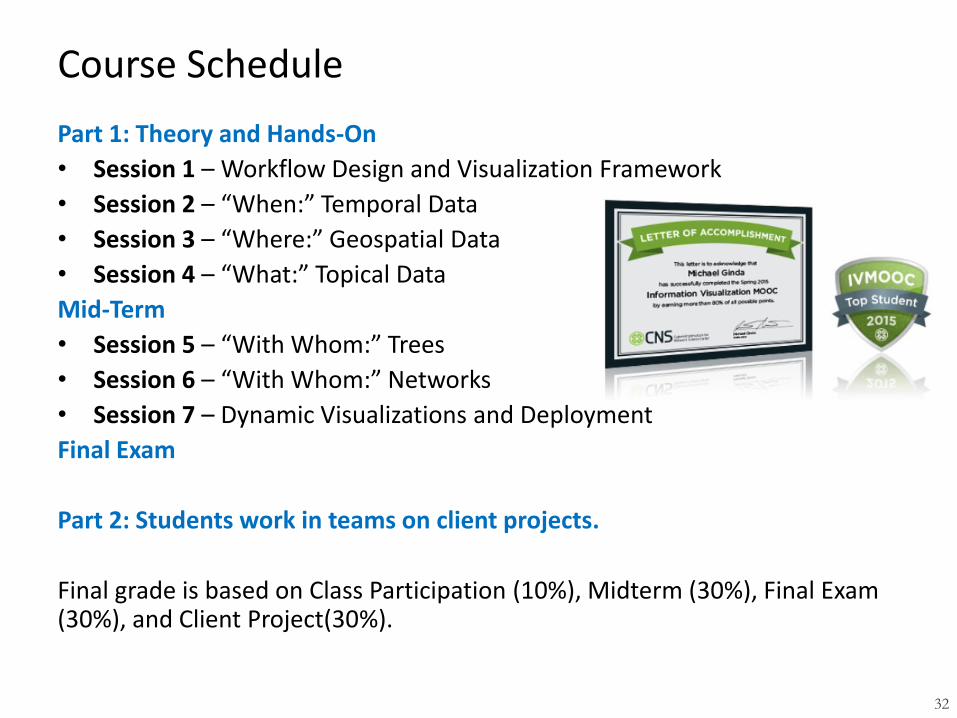
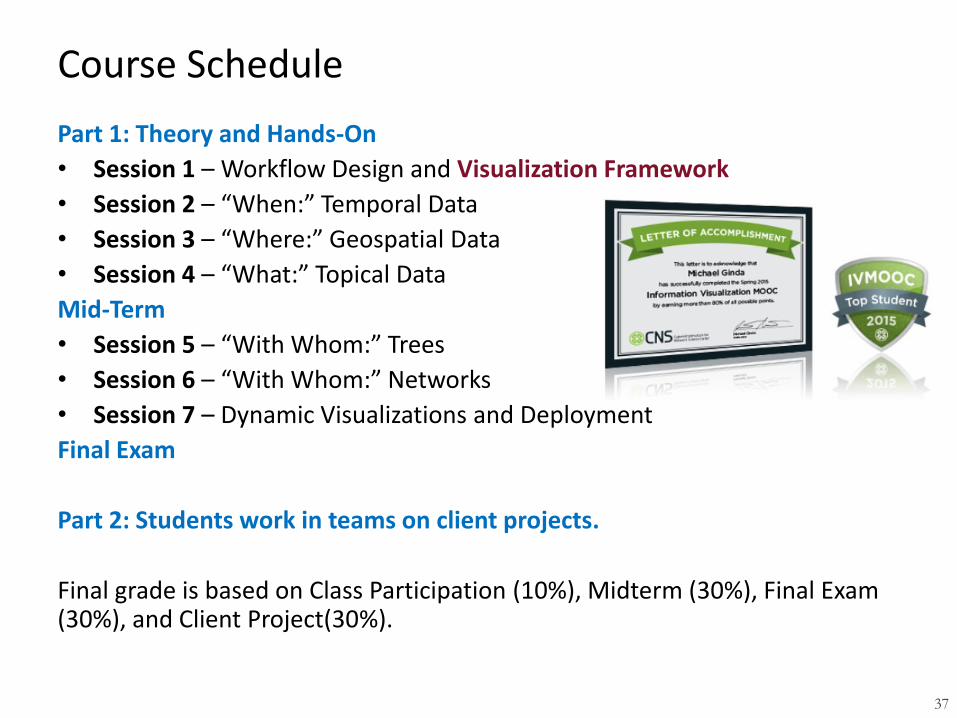
Course Schedule
Part 1: Theory and Hands-On
• Session 1 – Workflow Design and Visualization Framework
• Session 2 – “When:” Temporal Data
• Session 3 – “Where:” Geospatial Data
• Session 4 – “What:” Topical Data
Mid-Term
• Session 5 – “With Whom:” Trees
• Session 6 – “With Whom:” Networks
• Session 7 – Dynamic Visualizations and Deployment
Final Exam
Part 2: Students work in teams on client projects.
Final grade is based on Class Participation (10%), Midterm (30%), Final Exam (30%), and Client Project(30%).
32
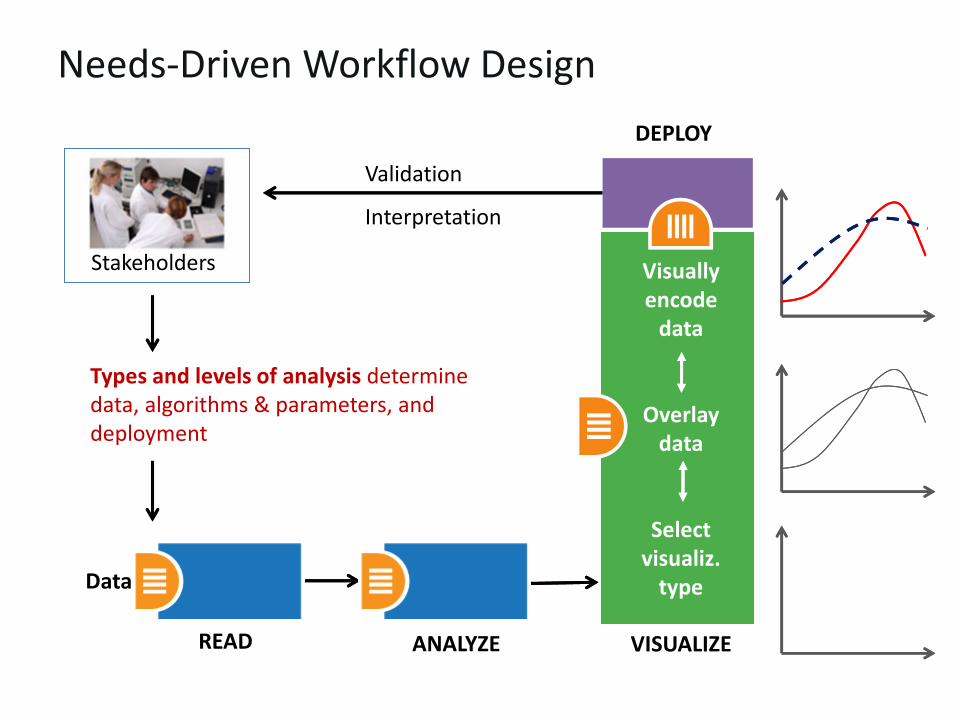
Needs-Driven Workflow Design
Stakeholders
Data
READ ANALYZE VISUALIZE
DEPLOY
Validation
Interpretation
Visually encode
data
Overlay data
Select visualiz.
type
Types and levels of analysis determine data, algorithms & parameters, and deployment
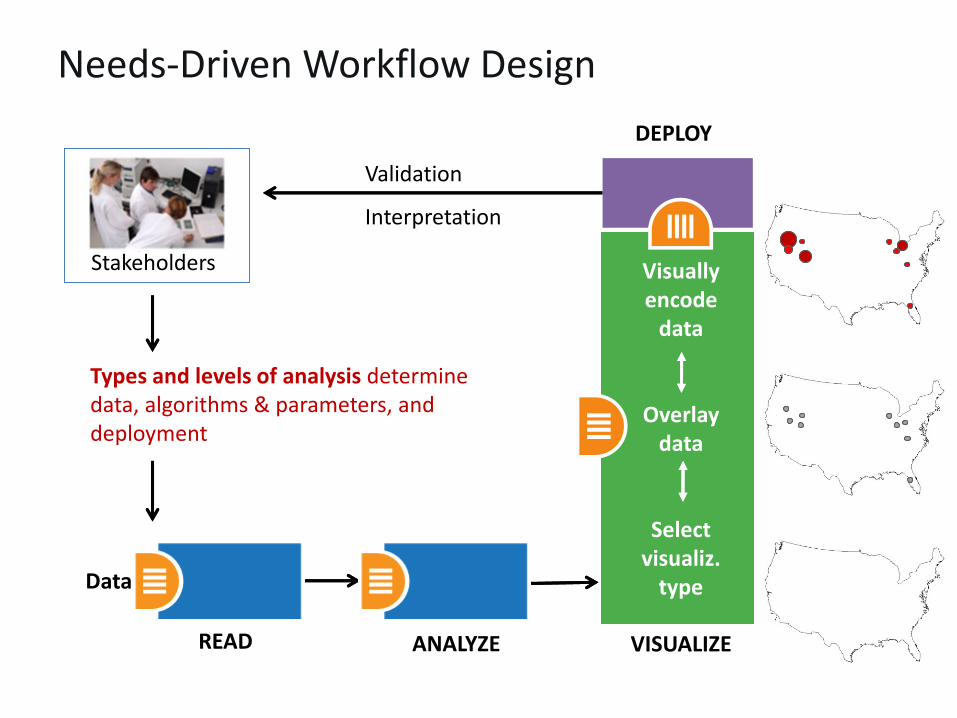
Needs-Driven Workflow Design
Stakeholders
Data
READ ANALYZE VISUALIZE
DEPLOY
Validation
Interpretation
Visually encode
data
Overlay data
Select visualiz.
type
Types and levels of analysis determine data, algorithms & parameters, and deployment
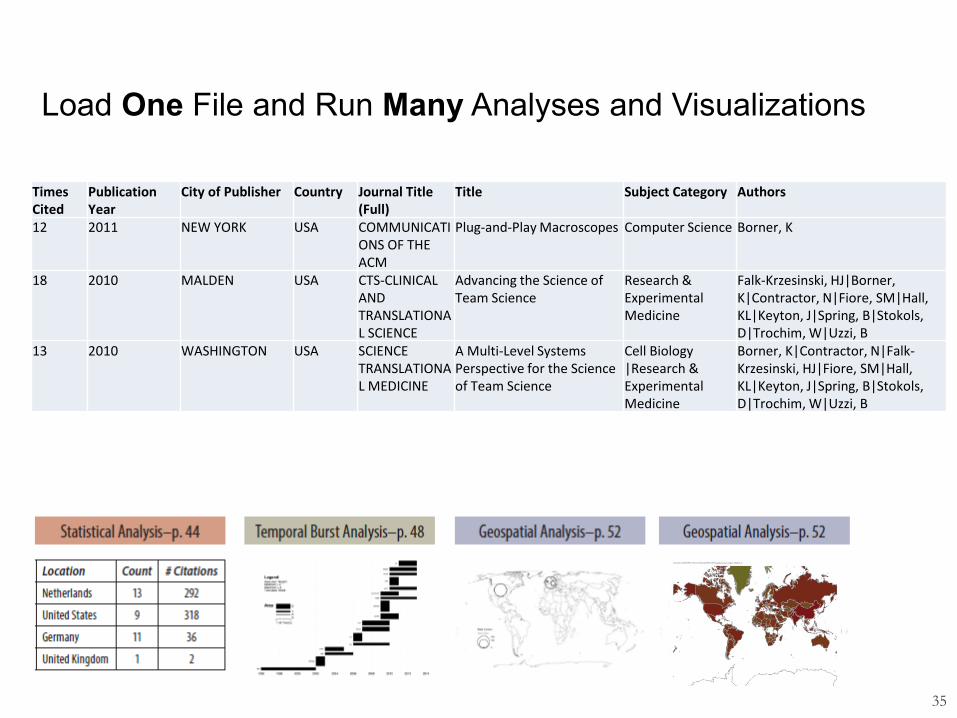
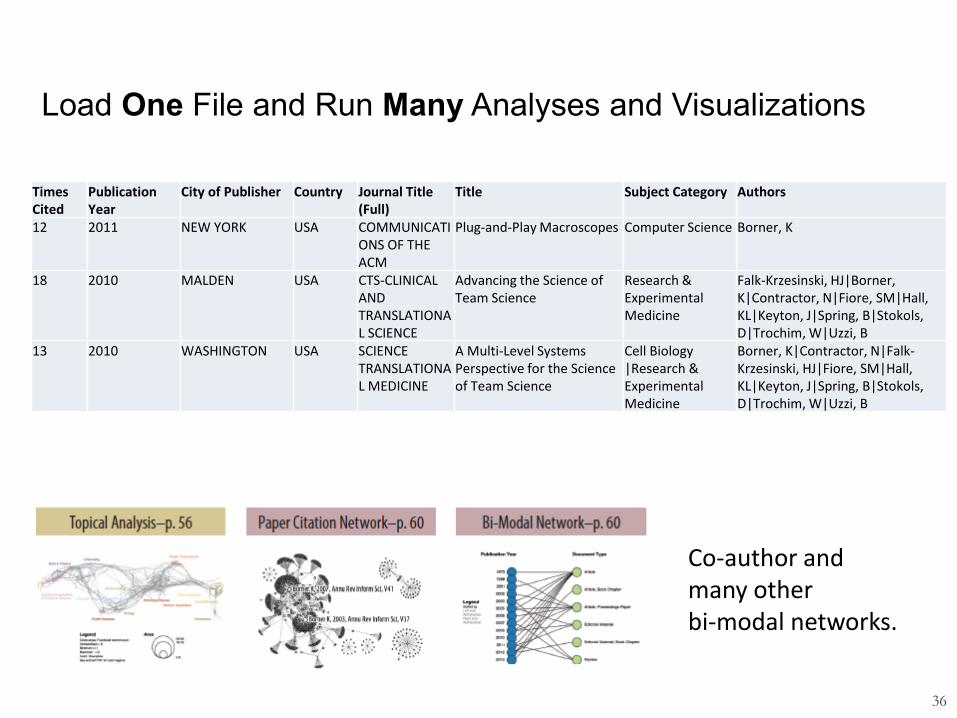
Load One File and Run Many Analyses and Visualizations
35
Times Cited
Publication Year
City of Publisher Country Journal Title (Full)
Title Subject Category Authors
12 2011 NEW YORK USA COMMUNICATIONS OF THE ACM
Plug-and-Play Macroscopes Computer Science Borner, K
18 2010 MALDEN USA CTS-CLINICAL AND TRANSLATIONAL SCIENCE
Advancing the Science of Team Science
Research & Experimental Medicine
Falk-Krzesinski, HJ|Borner, K|Contractor, N|Fiore, SM|Hall, KL|Keyton, J|Spring, B|Stokols, D|Trochim, W|Uzzi, B
13 2010 WASHINGTON USA SCIENCE TRANSLATIONAL MEDICINE
A Multi-Level Systems Perspective for the Science of Team Science
Cell Biology |Research & Experimental Medicine
Borner, K|Contractor, N|Falk-Krzesinski, HJ|Fiore, SM|Hall, KL|Keyton, J|Spring, B|Stokols, D|Trochim, W|Uzzi, B
Load One File and Run Many Analyses and Visualizations
36
Times Cited
Publication Year
City of Publisher Country Journal Title (Full)
Title Subject Category Authors
12 2011 NEW YORK USA COMMUNICATIONS OF THE ACM
Plug-and-Play Macroscopes Computer Science Borner, K
18 2010 MALDEN USA CTS-CLINICAL AND TRANSLATIONAL SCIENCE
Advancing the Science of Team Science
Research & Experimental Medicine
Falk-Krzesinski, HJ|Borner, K|Contractor, N|Fiore, SM|Hall, KL|Keyton, J|Spring, B|Stokols, D|Trochim, W|Uzzi, B
13 2010 WASHINGTON USA SCIENCE TRANSLATIONAL MEDICINE
A Multi-Level Systems Perspective for the Science of Team Science
Cell Biology |Research & Experimental Medicine
Borner, K|Contractor, N|Falk-Krzesinski, HJ|Fiore, SM|Hall, KL|Keyton, J|Spring, B|Stokols, D|Trochim, W|Uzzi, B
Co-author and many other bi-modal networks.
Course Schedule
Part 1: Theory and Hands-On
• Session 1 – Workflow Design and Visualization Framework
• Session 2 – “When:” Temporal Data
• Session 3 – “Where:” Geospatial Data
• Session 4 – “What:” Topical Data
Mid-Term
• Session 5 – “With Whom:” Trees
• Session 6 – “With Whom:” Networks
• Session 7 – Dynamic Visualizations and Deployment
Final Exam
Part 2: Students work in teams on client projects.
Final grade is based on Class Participation (10%), Midterm (30%), Final Exam (30%), and Client Project(30%).
37
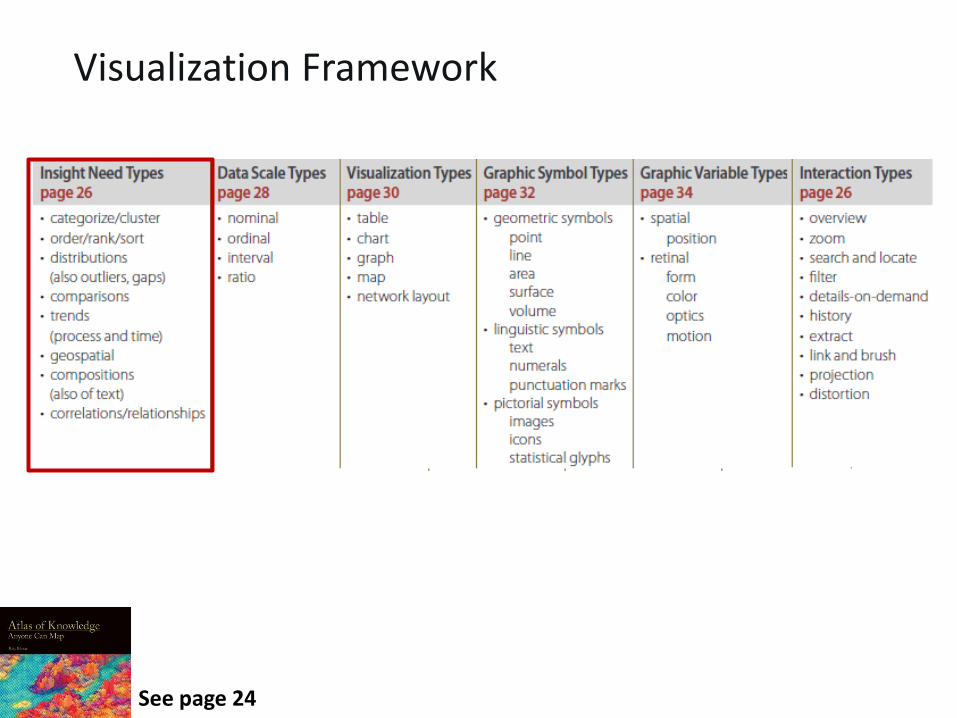
See page 24
Visualization Framework
39
Visualization Framework
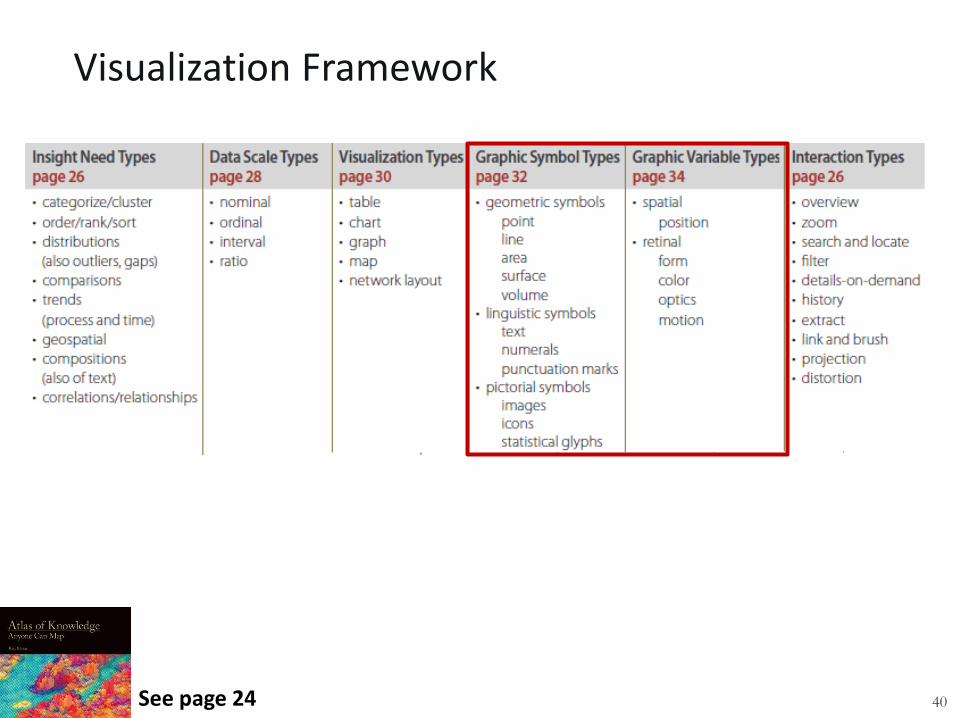
40 See page 24
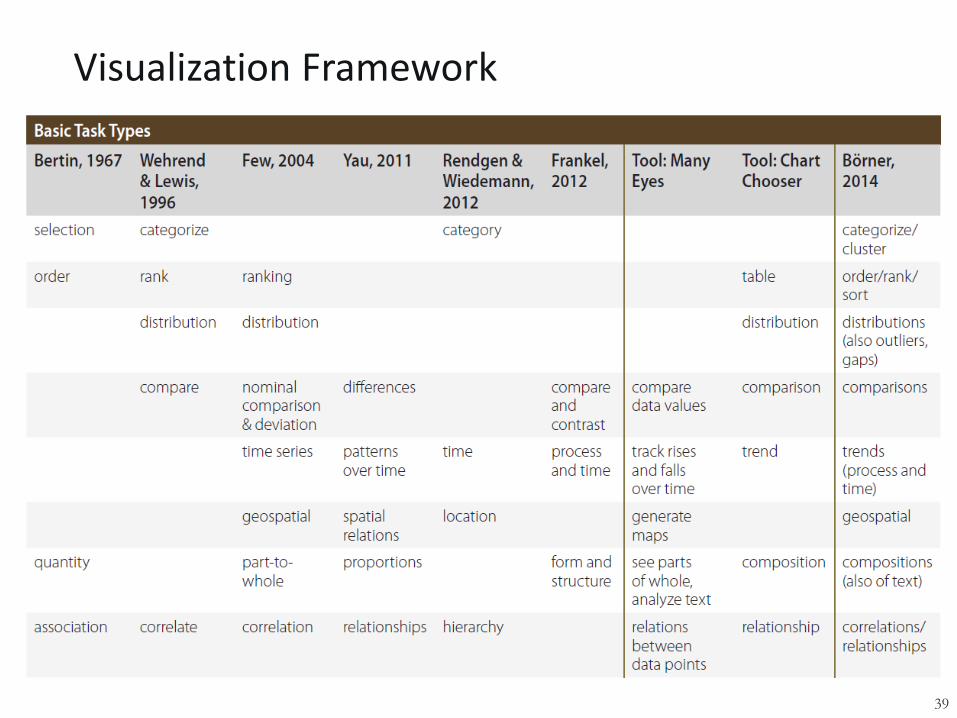
Visualization Framework
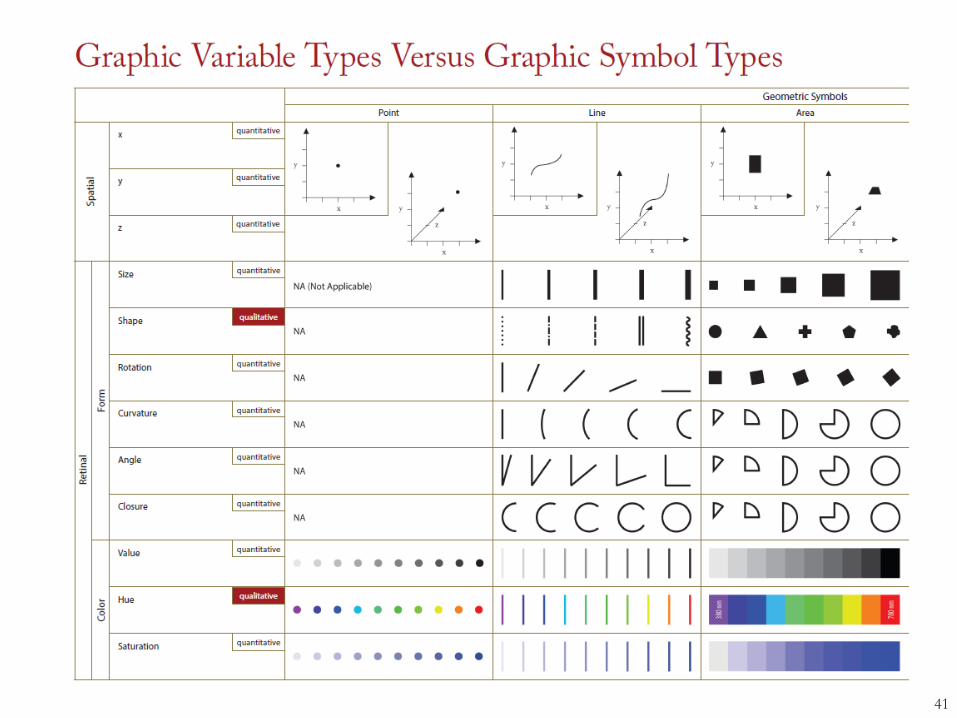
41
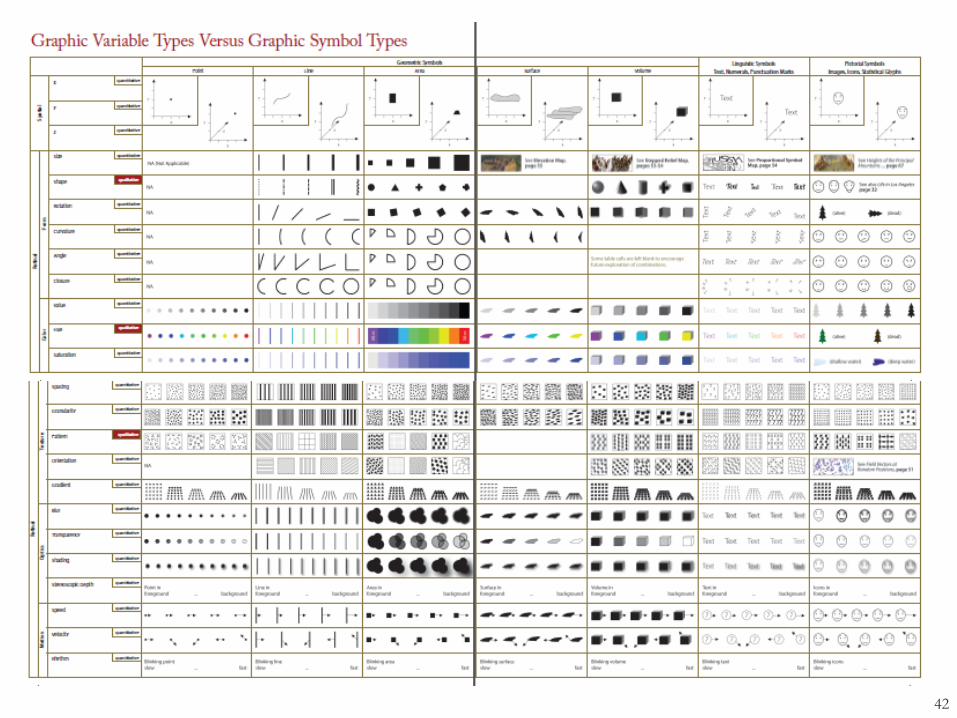
42
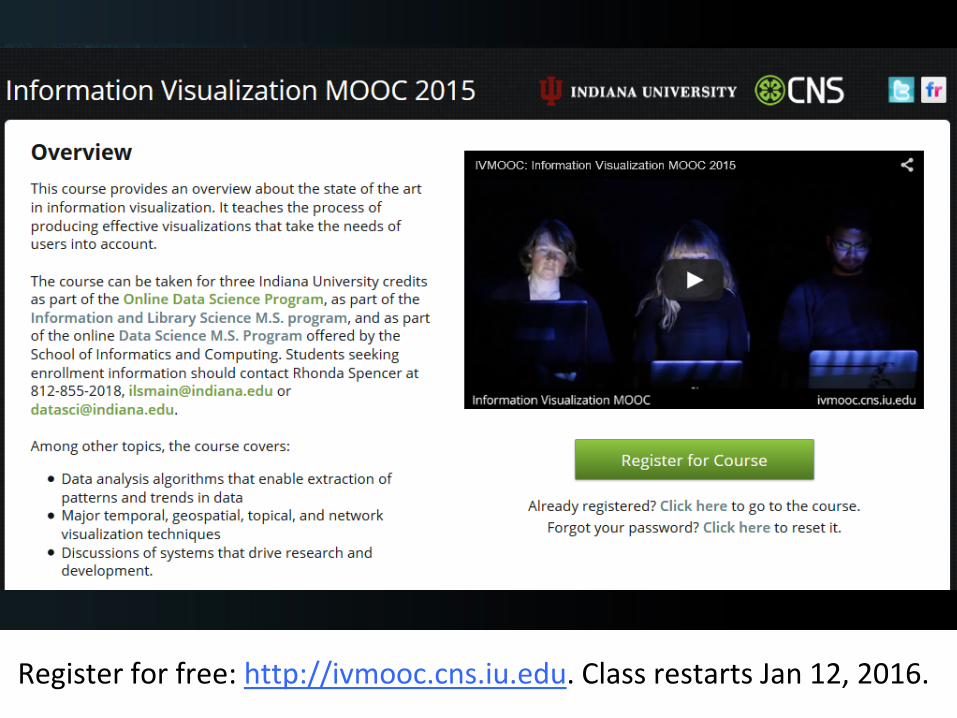
Register for free: http://ivmooc.cns.iu.edu. Class restarts Jan 12, 2016.
References
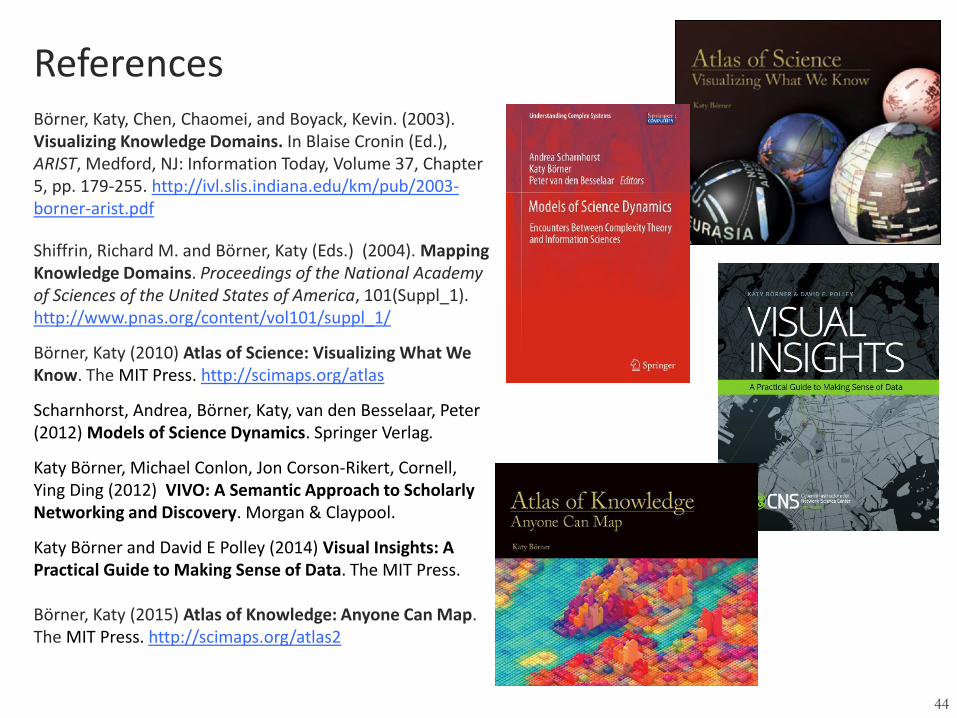
Börner, Katy, Chen, Chaomei, and Boyack, Kevin. (2003). Visualizing Knowledge Domains. In Blaise Cronin (Ed.), ARIST, Medford, NJ: Information Today, Volume 37, Chapter 5, pp. 179-255. http://ivl.slis.indiana.edu/km/pub/2003-borner-arist.pdf
Shiffrin, Richard M. and Börner, Katy (Eds.) (2004). Mapping Knowledge Domains. Proceedings of the National Academy of Sciences of the United States of America, 101(Suppl_1). http://www.pnas.org/content/vol101/suppl_1/
Börner, Katy (2010) Atlas of Science: Visualizing What We Know. The MIT Press. http://scimaps.org/atlas
Scharnhorst, Andrea, Börner, Katy, van den Besselaar, Peter (2012) Models of Science Dynamics. Springer Verlag.
Katy Börner, Michael Conlon, Jon Corson-Rikert, Cornell, Ying Ding (2012) VIVO: A Semantic Approach to Scholarly Networking and Discovery. Morgan & Claypool.
Katy Börner and David E Polley (2014) Visual Insights: A Practical Guide to Making Sense of Data. The MIT Press. Börner, Katy (2015) Atlas of Knowledge: Anyone Can Map. The MIT Press. http://scimaps.org/atlas2
44
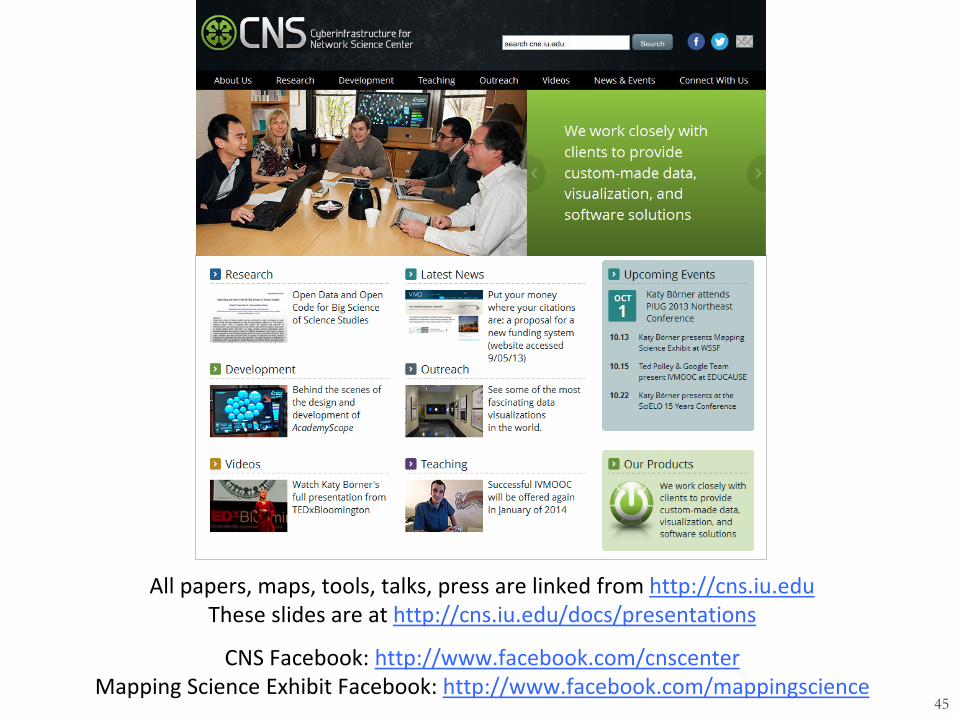
All papers, maps, tools, talks, press are linked from http://cns.iu.edu These slides are at http://cns.iu.edu/docs/presentations
CNS Facebook: http://www.facebook.com/cnscenter Mapping Science Exhibit Facebook: http://www.facebook.com/mappingscience
45
Recommended