Western Oregon University
Wheaton College (MA)
Whitworth University
Widener University
Wilkes University
Williams College
Worcester Polytechnic Institute
Worcester State College
Wright State University
Xavier University
Yeshiva University
Youngstown State University
Data and Sustainability: How the Right Data Creates Success
2
Introduction and Agenda
Webinar Host:
Heather FinneganThe Challenges of a Sustainability Professional
Case Studies
Using GHG Inventory Data to make the case for change
Communicating STARS results to stakeholders
Creating an actionable Sustainability Plan
Questions/Discussion
Agenda:

Feel Free to Start a Dialogue with Our Presenters
Enter questions in the box at any time. We want to hear from you!
Enter questions
here at any
point during the
webinar
Presentation slides
and webinar
recording will be
sent to each
attendee following
today’s session
3
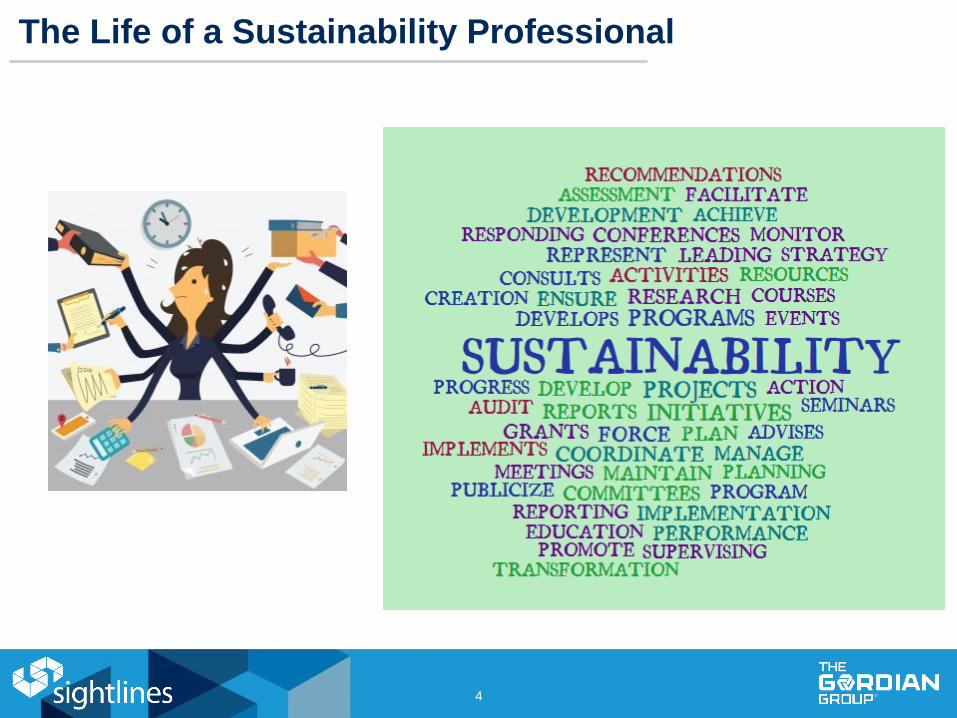
The Life of a Sustainability Professional
4
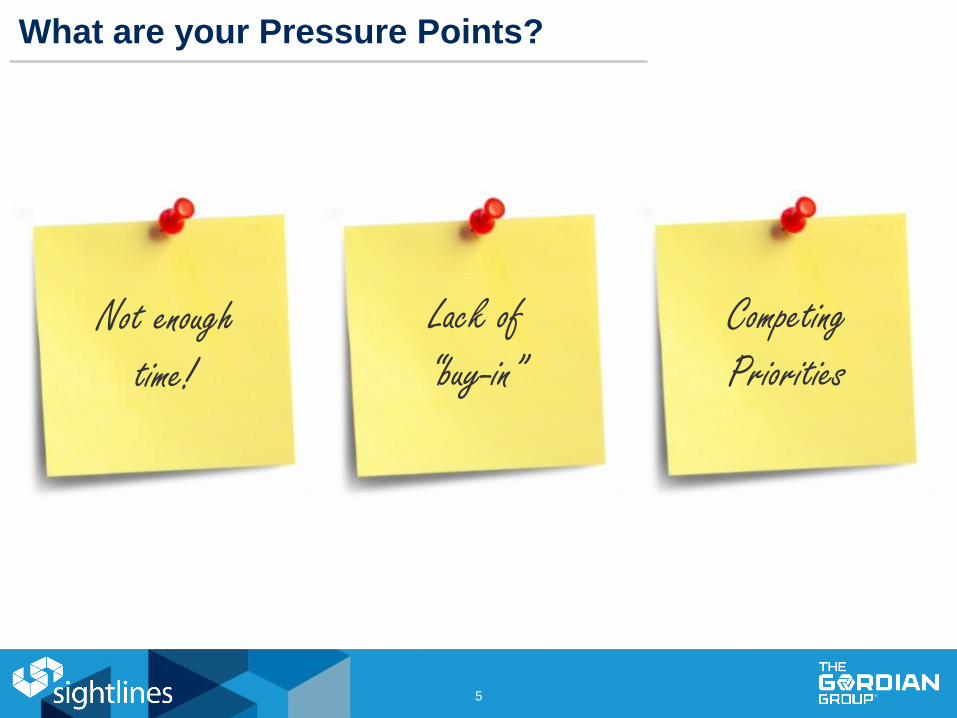
What are your Pressure Points?
5
Not enough time!
Lack of “buy-in”
Competing Priorities
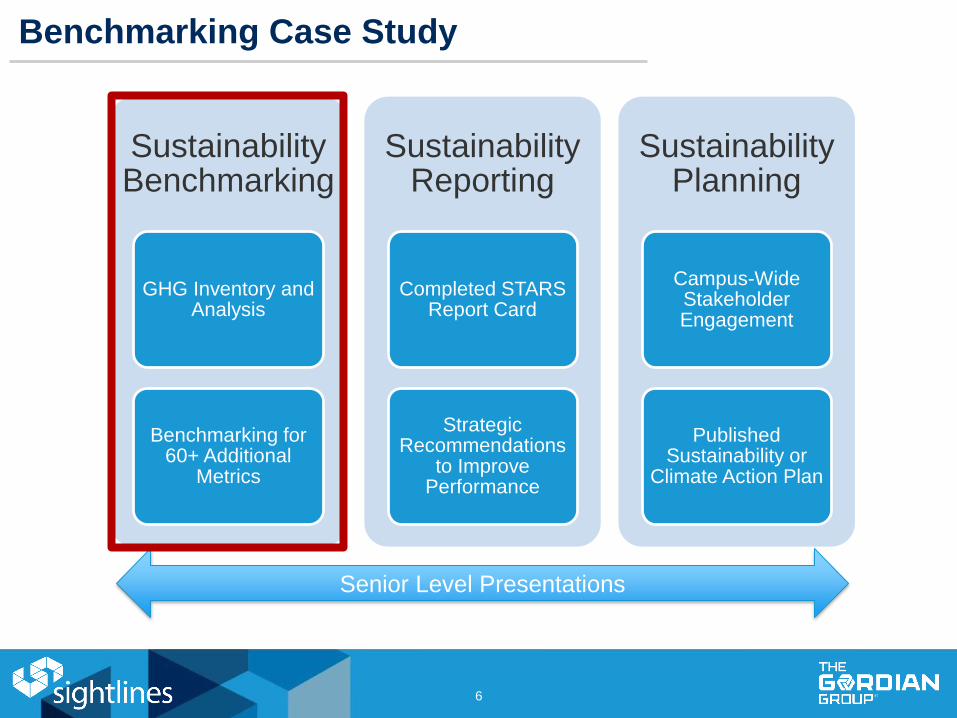
Benchmarking Case Study
Sustainability Benchmarking
GHG Inventory and Analysis
Benchmarking for 60+ Additional
Metrics
Sustainability Reporting
Completed STARS Report Card
Strategic Recommendations
to Improve Performance
Sustainability Planning
Campus-Wide Stakeholder Engagement
Published Sustainability or
Climate Action Plan
6
Senior Level Presentations
7
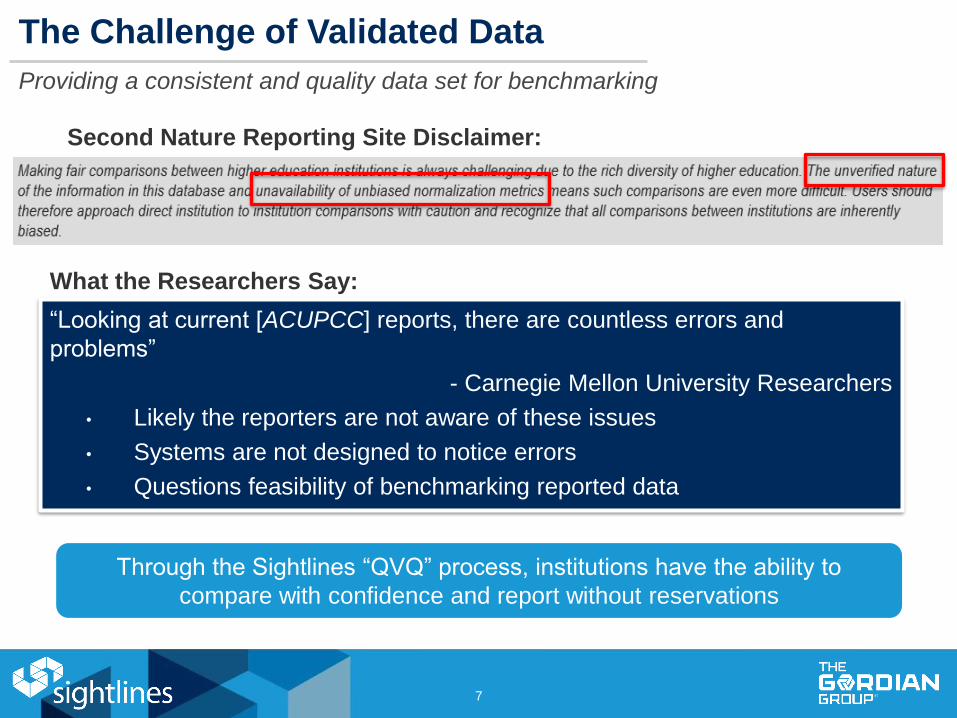
The Challenge of Validated Data
Providing a consistent and quality data set for benchmarking
“Looking at current [ACUPCC] reports, there are countless errors and
problems”
- Carnegie Mellon University Researchers
• Likely the reporters are not aware of these issues
• Systems are not designed to notice errors
• Questions feasibility of benchmarking reported data
Second Nature Reporting Site Disclaimer:
What the Researchers Say:
Through the Sightlines “QVQ” process, institutions have the ability to
compare with confidence and report without reservations
8
-100%
-90%
-80%
-70%
-60%
-50%
-40%
-30%
-20%
-10%
0%
0
5,000
10,000
15,000
20,000
25,000
30,000
35,000
40,000
45,000
50,000
Pe
rce
nt
Ch
an
ge f
rom
Bas
eli
ne
MT
CD
E
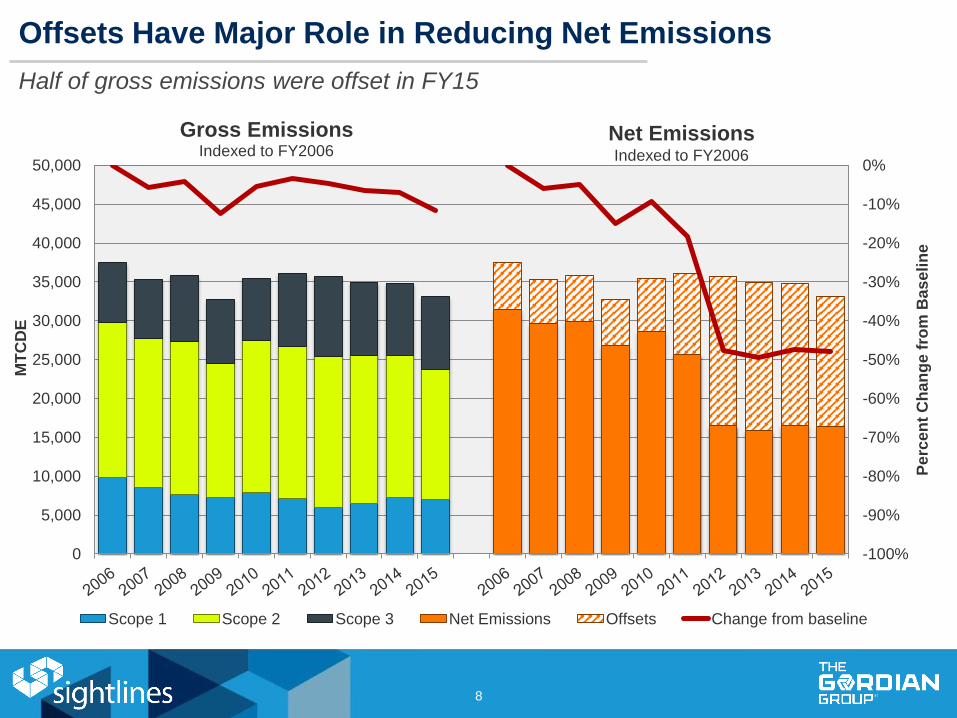
Gross EmissionsIndexed to FY2006
Scope 1 Scope 2 Scope 3 Net Emissions Offsets Change from baseline
Half of gross emissions were offset in FY15
Offsets Have Major Role in Reducing Net Emissions
Net EmissionsIndexed to FY2006
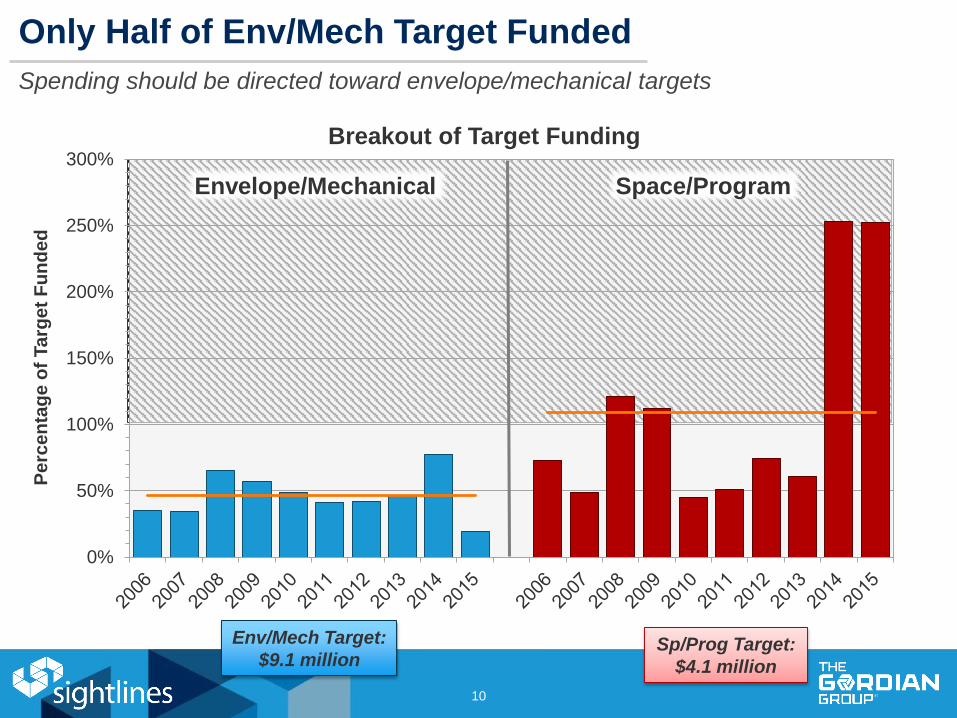
Only Half of Env/Mech Target Funded
Spending should be directed toward envelope/mechanical targets
10
0%
50%
100%
150%
200%
250%
300%
Pe
rce
nta
ge
of
Ta
rge
t F
un
de
d
Breakout of Target Funding
Env/Mech Target:
$9.1 millionSp/Prog Target:
$4.1 million
Envelope/Mechanical Space/Program
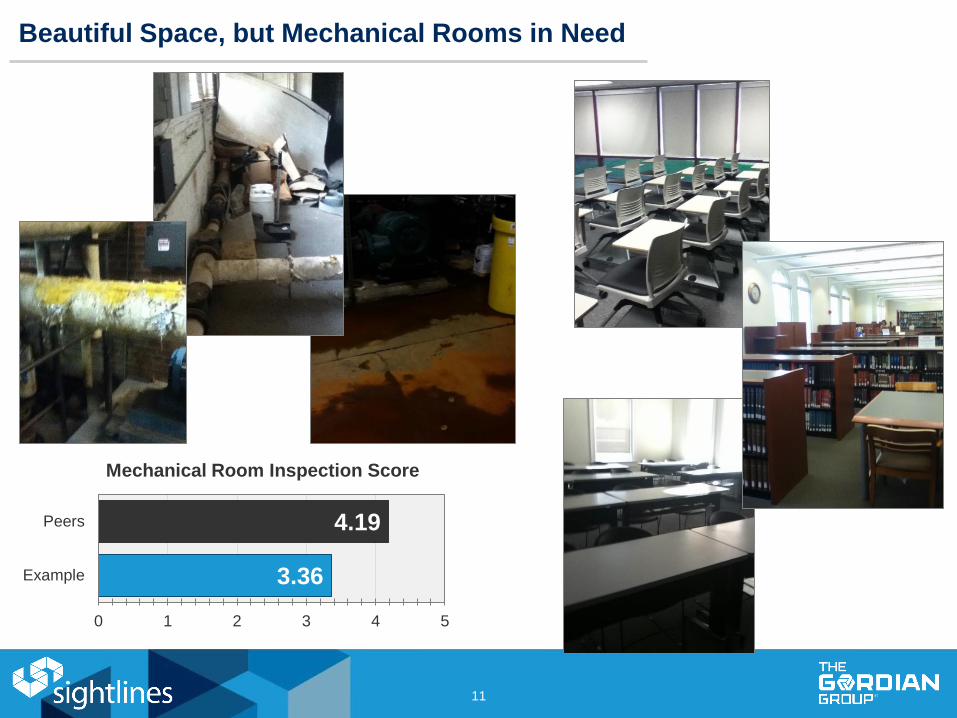
Beautiful Space, but Mechanical Rooms in Need
11
3.36
4.19
0 1 2 3 4 5
Example
Peers
Mechanical Room Inspection Score
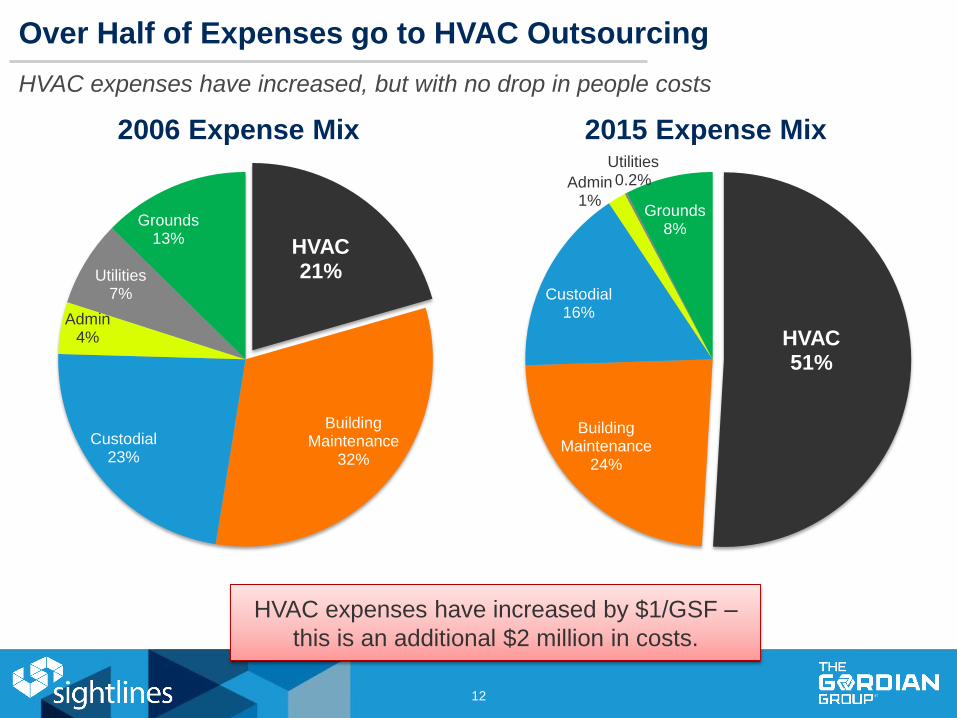
Over Half of Expenses go to HVAC Outsourcing
12
HVAC51%
Building Maintenance
24%
Custodial16%
Admin1%
Utilities0.2%
Grounds8%
2015 Expense Mix
HVAC expenses have increased by $1/GSF –
this is an additional $2 million in costs.
HVAC21%
Building Maintenance
32%
Custodial23%
Admin4%
Utilities7%
Grounds13%
2006 Expense Mix
HVAC expenses have increased, but with no drop in people costs
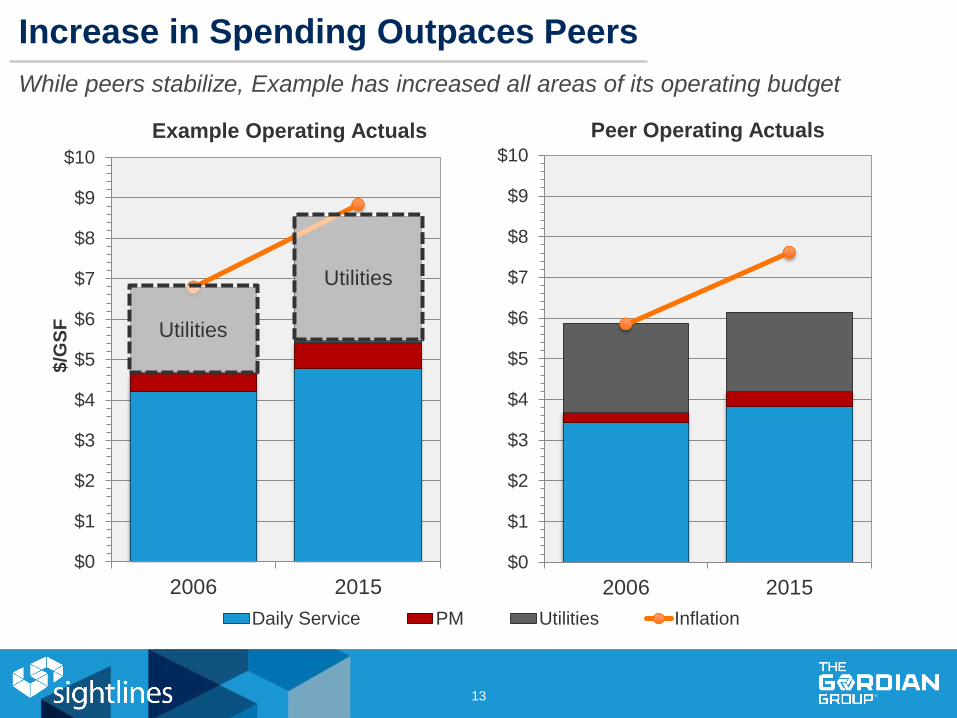
Increase in Spending Outpaces Peers
13
$0
$1
$2
$3
$4
$5
$6
$7
$8
$9
$10
2006 2015
$/G
SF
Example Operating Actuals
Daily Service PM Utilities Inflation
Utilities
$0
$1
$2
$3
$4
$5
$6
$7
$8
$9
$10
2006 2015
Peer Operating Actuals
Utilities
While peers stabilize, Example has increased all areas of its operating budget
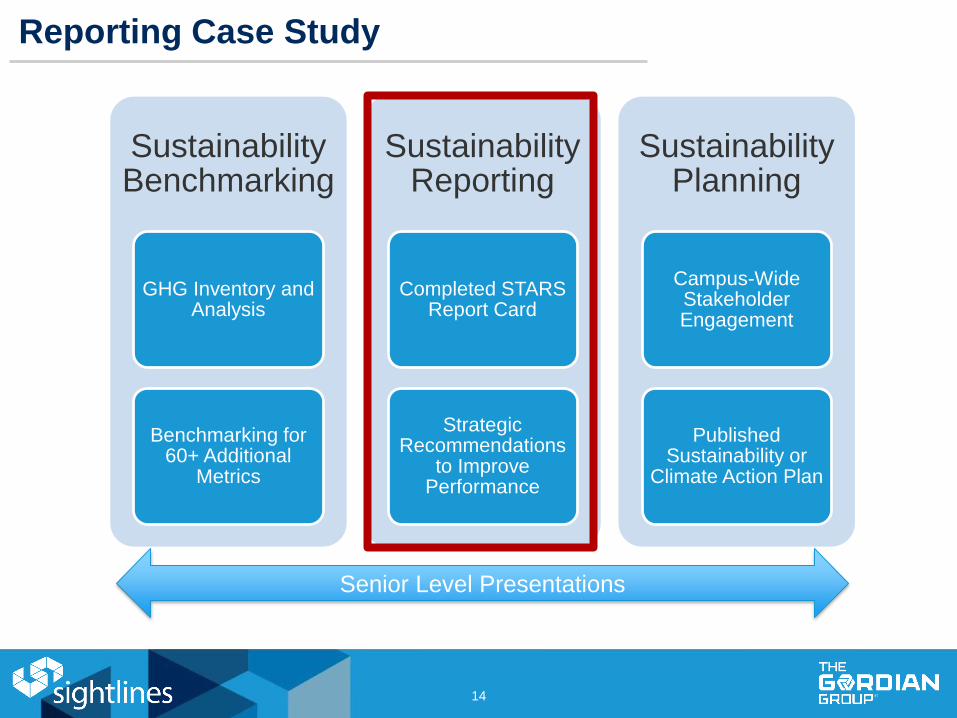
Reporting Case Study
Sustainability Benchmarking
GHG Inventory and Analysis
Benchmarking for 60+ Additional
Metrics
Sustainability Reporting
Completed STARS Report Card
Strategic Recommendations
to Improve Performance
Sustainability Planning
Campus-Wide Stakeholder Engagement
Published Sustainability or
Climate Action Plan
14
Senior Level Presentations
15
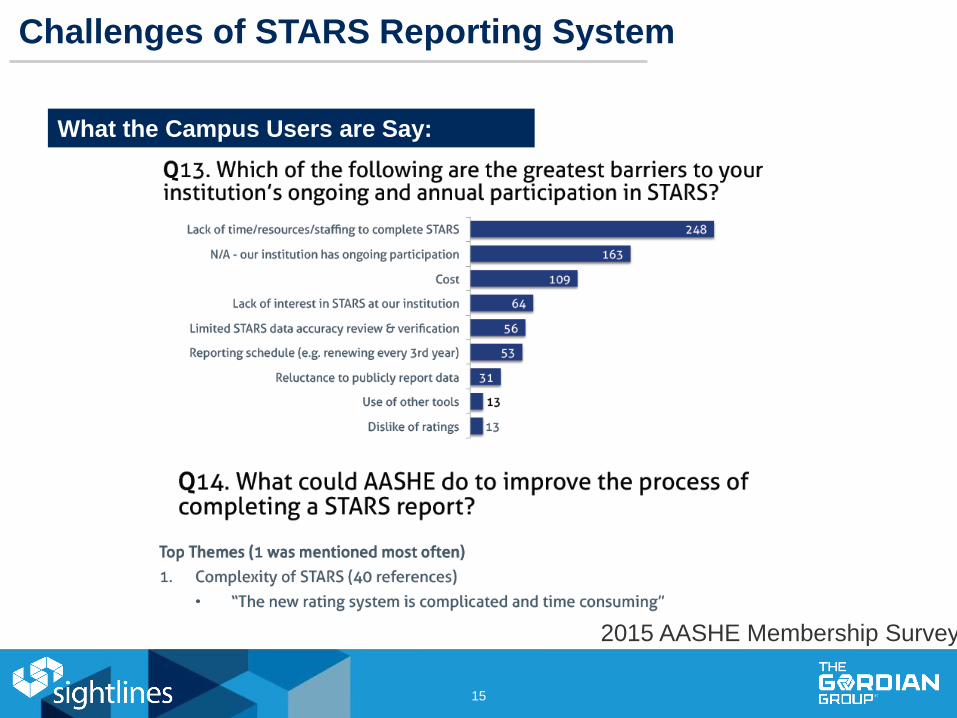
Challenges of STARS Reporting System
What the Campus Users are Say:
2015 AASHE Membership Survey
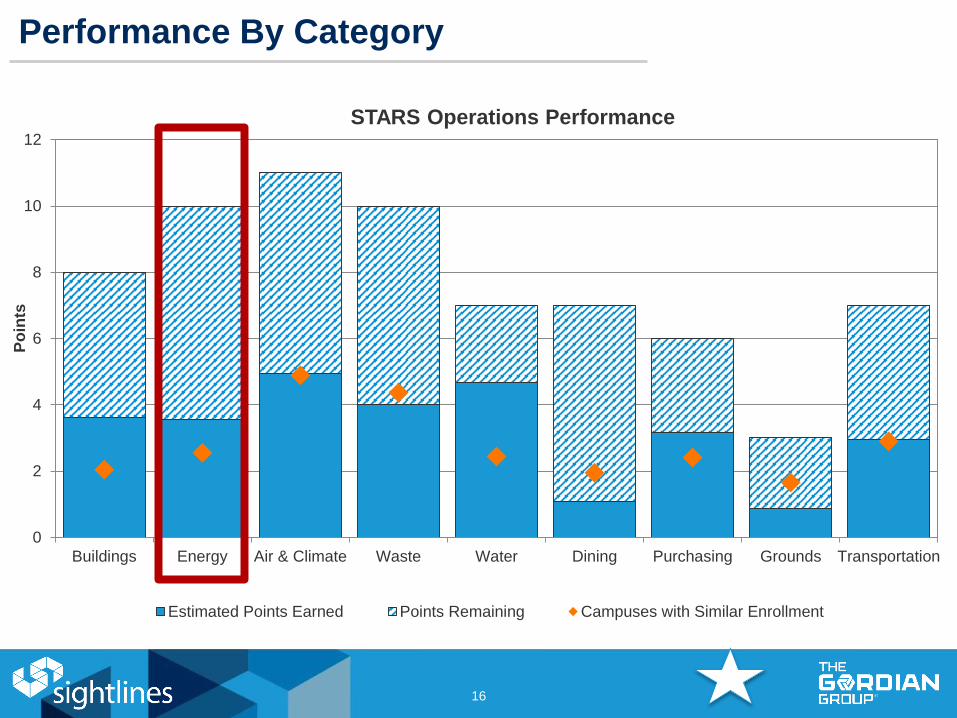
0
2
4
6
8
10
12
Buildings Energy Air & Climate Waste Water Dining Purchasing Grounds Transportation
Po
ints
STARS Operations Performance
Estimated Points Earned Points Remaining Campuses with Similar Enrollment
Performance By Category
16
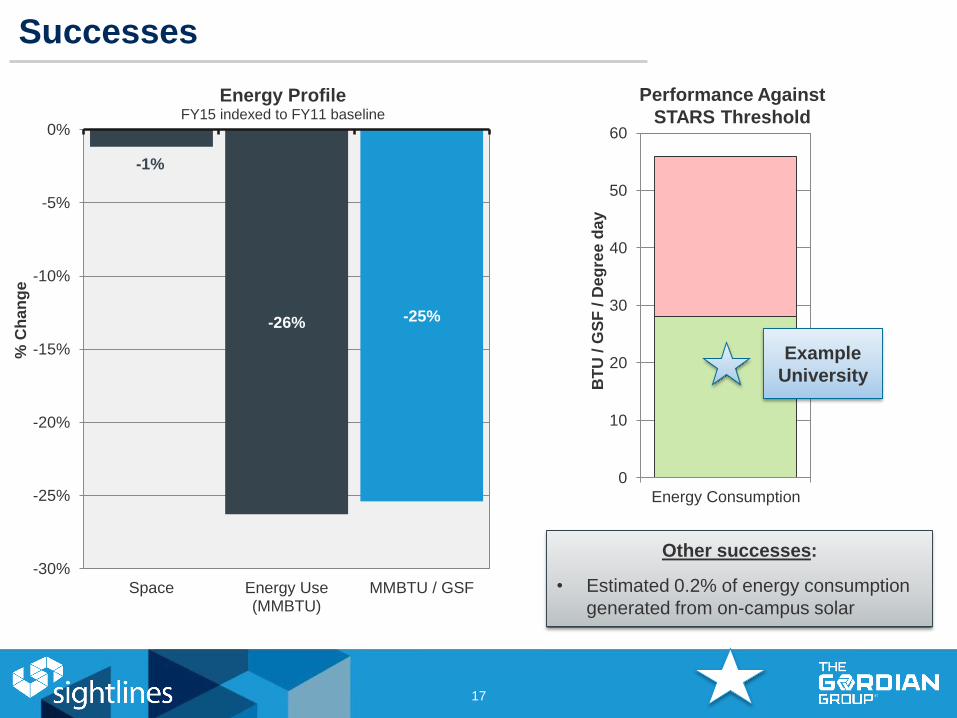
Successes
-1%
-26% -25%
-30%
-25%
-20%
-15%
-10%
-5%
0%
Space Energy Use(MMBTU)
MMBTU / GSF
% C
ha
ng
e
Energy ProfileFY15 indexed to FY11 baseline
Other successes:
• Estimated 0.2% of energy consumption
generated from on-campus solar
17
0
10
20
30
40
50
60
Energy Consumption
BT
U / G
SF
/ D
eg
ree
da
y
Example
University
Performance Against
STARS Threshold
0
10
20
30
40
50
60
70
Example (2.1)
Po
ints
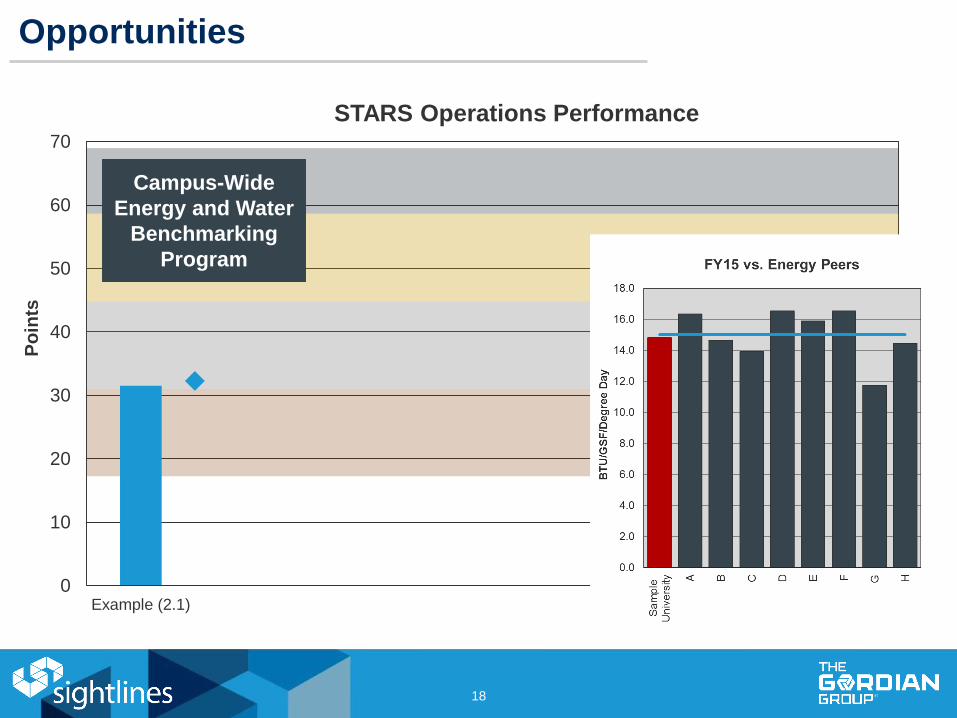
STARS Operations Performance
Opportunities
18
Campus-Wide
Energy and Water
Benchmarking
Program
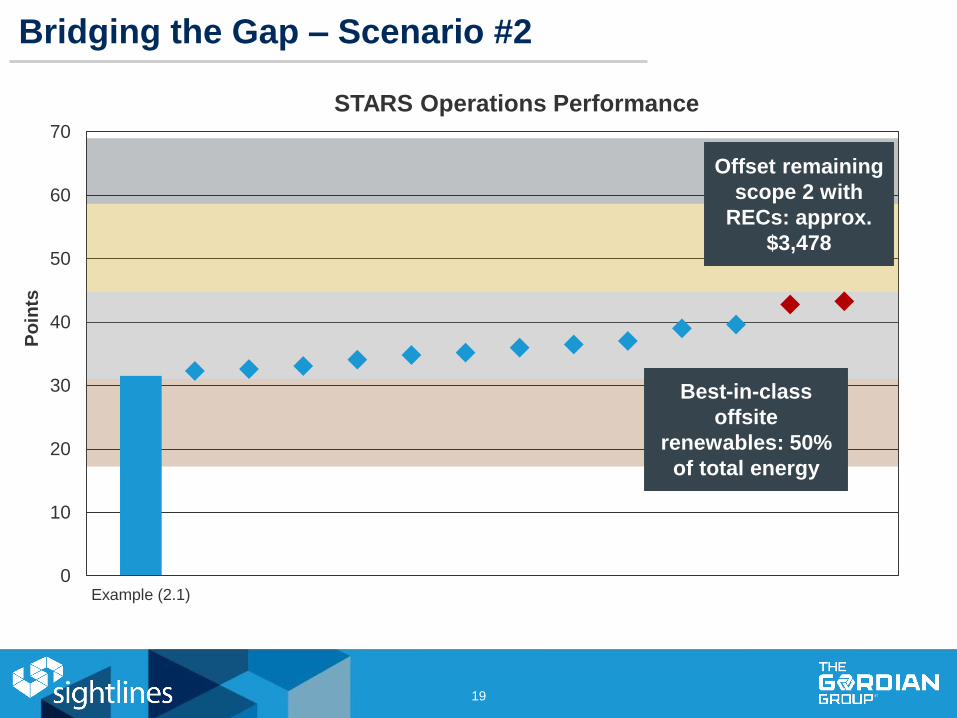
Bridging the Gap – Scenario #2
19
0
10
20
30
40
50
60
70
Example (2.1)
Po
ints
STARS Operations Performance
Best-in-class
offsite
renewables: 50%
of total energy
Offset remaining
scope 2 with
RECs: approx.
$3,478
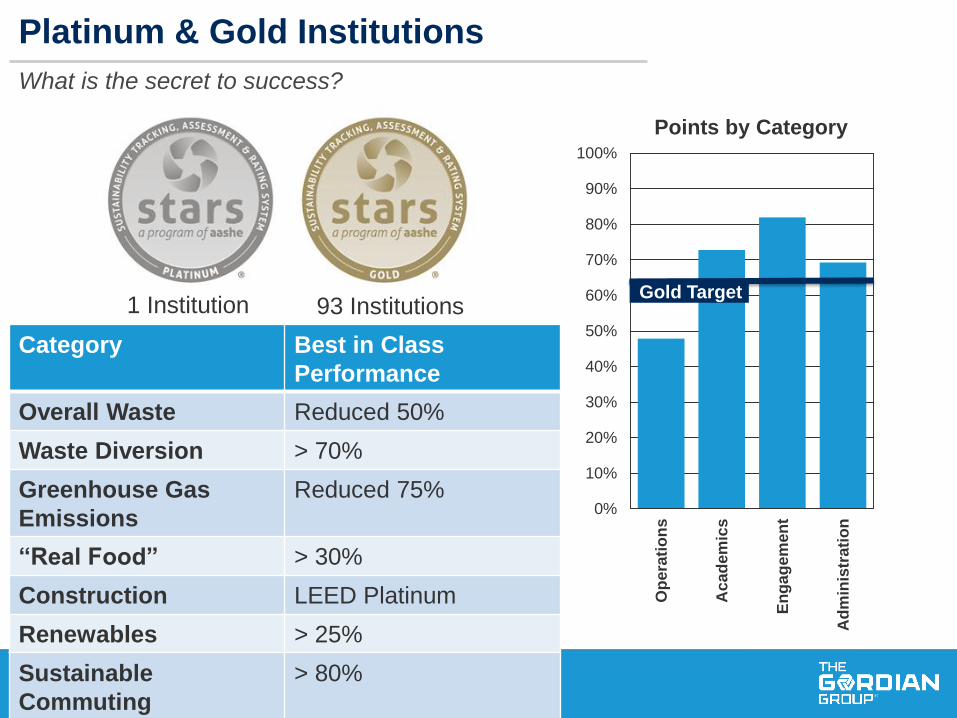
Platinum & Gold Institutions
What is the secret to success?
20
Category Best in Class
Performance
Overall Waste Reduced 50%
Waste Diversion > 70%
Greenhouse Gas
Emissions
Reduced 75%
“Real Food” > 30%
Construction LEED Platinum
Renewables > 25%
Sustainable
Commuting
> 80%
1 Institution 93 Institutions
0%
10%
20%
30%
40%
50%
60%
70%
80%
90%
100%
Op
era
tio
ns
Acad
em
ics
En
ga
gem
en
t
Ad
min
istr
ati
on
Points by Category
Gold Target
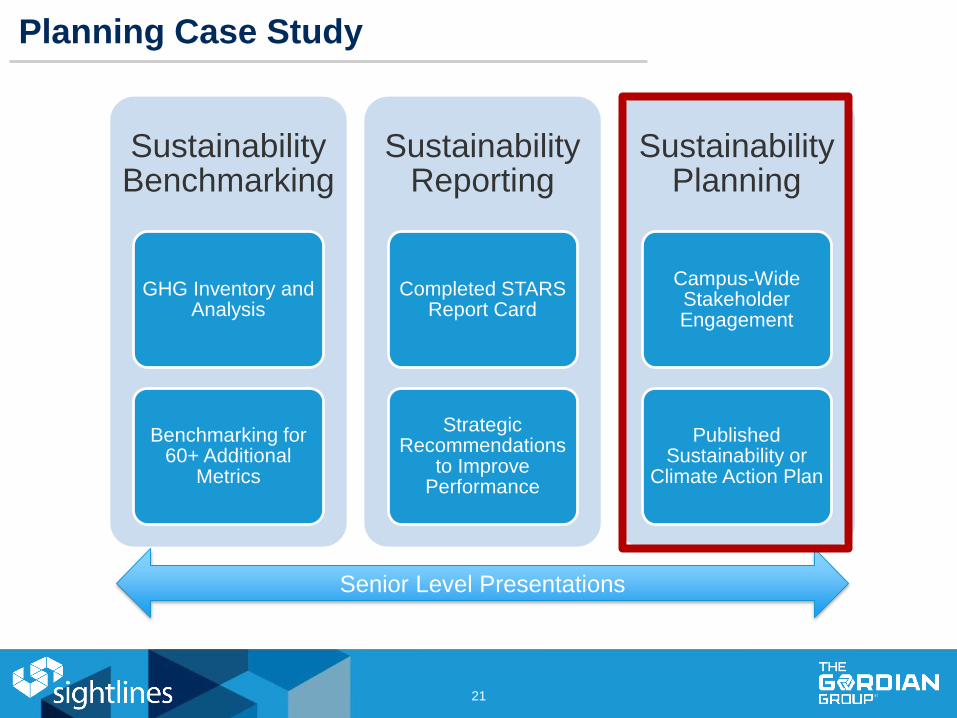
Planning Case Study
Sustainability Benchmarking
GHG Inventory and Analysis
Benchmarking for 60+ Additional
Metrics
Sustainability Reporting
Completed STARS Report Card
Strategic Recommendations
to Improve Performance
Sustainability Planning
Campus-Wide Stakeholder Engagement
Published Sustainability or
Climate Action Plan
21
Senior Level Presentations
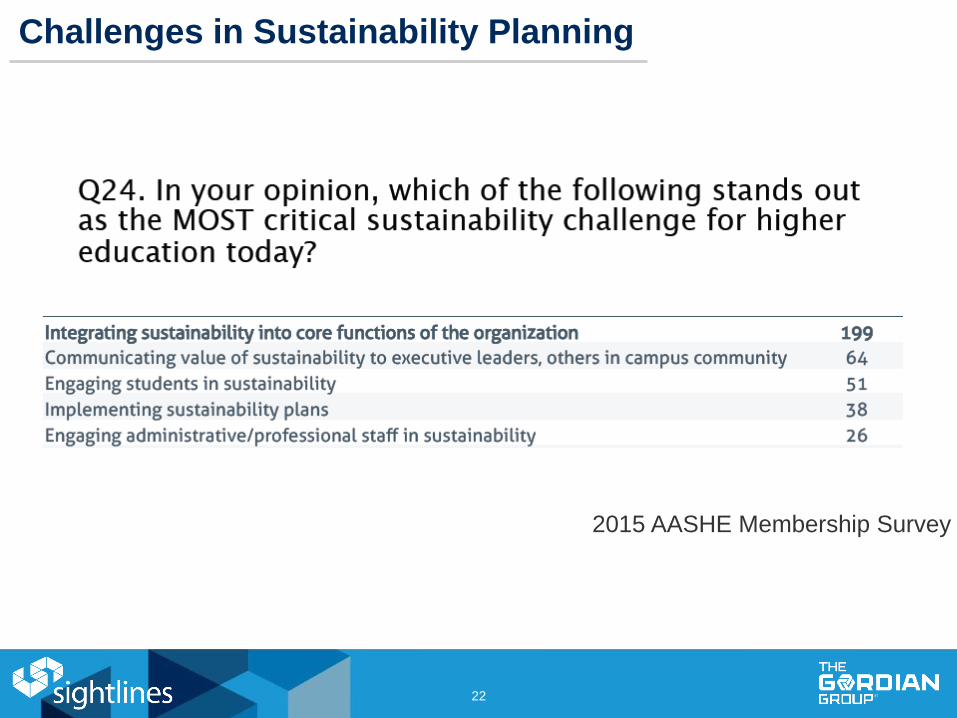
Challenges in Sustainability Planning
22
2015 AASHE Membership Survey
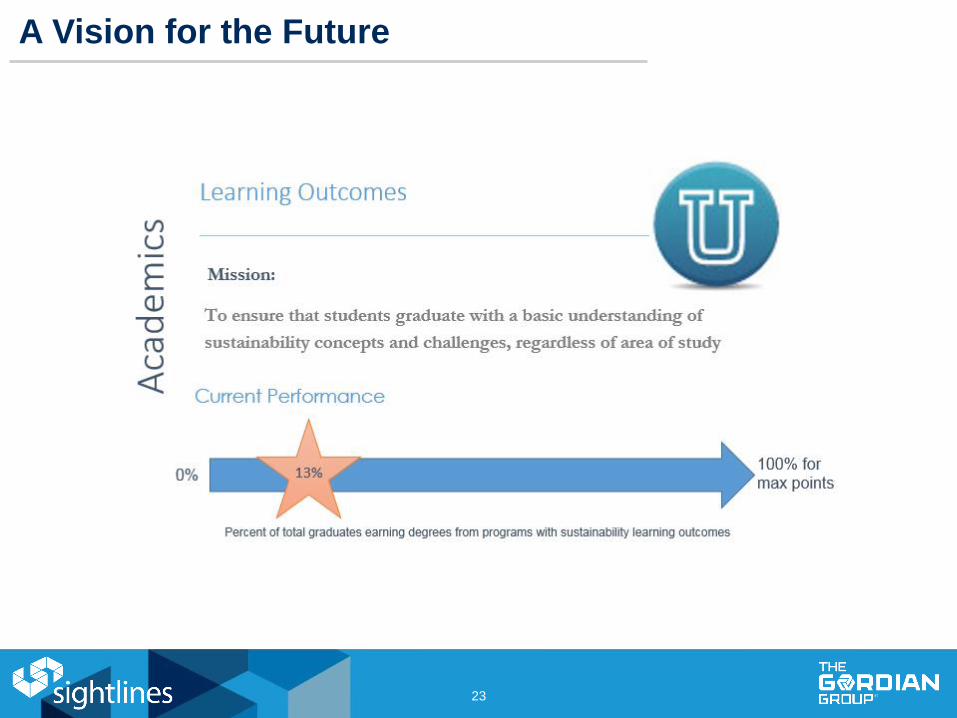
A Vision for the Future
23
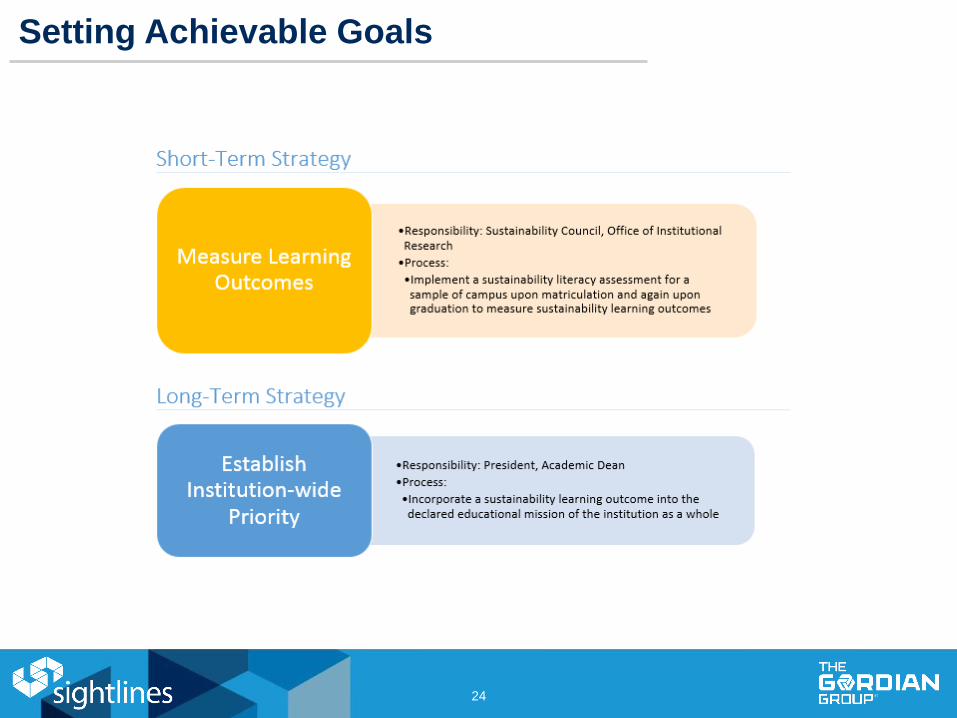
Setting Achievable Goals
24
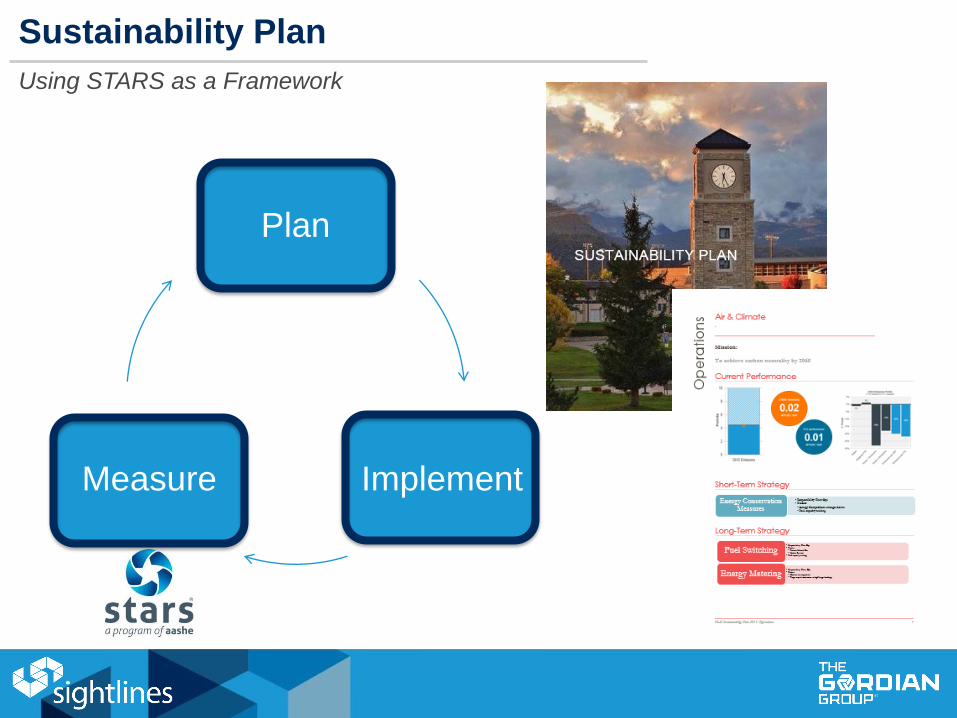
Sustainability Plan
Using STARS as a Framework
Plan
ImplementMeasure

Questions?
26
Recommended