OutlineMotivation
Available DataPoints of interest
Data ModelingResults
Work in Progress: Self-Organizing Maps
Data Mining on Agriculture Data using Neural
Networks
Georg Ruß, Rudolf Kruse, Martin Schneider, Peter Wagner
July 16th, 2008
Georg Ruß, Rudolf Kruse, Martin Schneider, Peter Wagner Data Mining on Agriculture Data using Neural Networks
OutlineMotivation
Available DataPoints of interest
Data ModelingResults
Work in Progress: Self-Organizing Maps
Outline
Motivation
Available DataData DetailsData Overview
Points of interest
Data Modeling
Results
Work in Progress: Self-Organizing Maps
Georg Ruß, Rudolf Kruse, Martin Schneider, Peter Wagner Data Mining on Agriculture Data using Neural Networks
OutlineMotivation
Available DataPoints of interest
Data ModelingResults
Work in Progress: Self-Organizing Maps
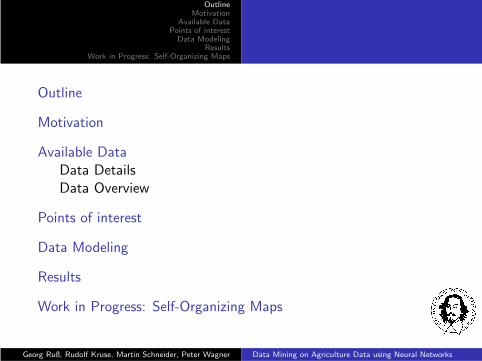
Motivation: Precision Farming
small−scale precision treatmentuniform treatment
field
Figure: Precision Farming: from uniform field to small-scale areaGeorg Ruß, Rudolf Kruse, Martin Schneider, Peter Wagner Data Mining on Agriculture Data using Neural Networks
OutlineMotivation
Available DataPoints of interest
Data ModelingResults
Work in Progress: Self-Organizing Maps
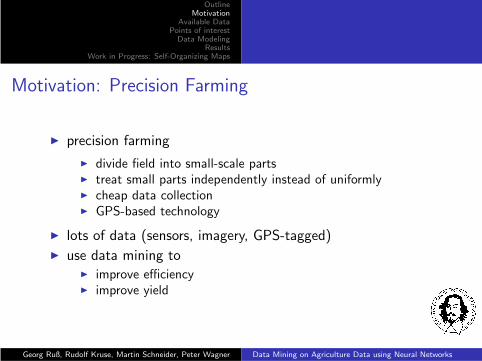
Motivation: Precision Farming
◮ precision farming
◮ divide field into small-scale parts◮ treat small parts independently instead of uniformly◮ cheap data collection◮ GPS-based technology
◮ lots of data (sensors, imagery, GPS-tagged)
◮ use data mining to◮ improve efficiency◮ improve yield
Georg Ruß, Rudolf Kruse, Martin Schneider, Peter Wagner Data Mining on Agriculture Data using Neural Networks
OutlineMotivation
Available DataPoints of interest
Data ModelingResults
Work in Progress: Self-Organizing Maps
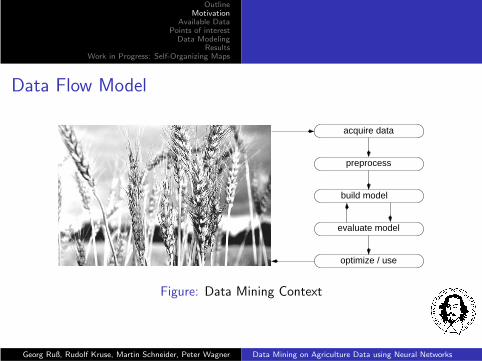
Data Flow Model
acquire data
preprocess
build model
evaluate model
optimize / use
Figure: Data Mining Context
Georg Ruß, Rudolf Kruse, Martin Schneider, Peter Wagner Data Mining on Agriculture Data using Neural Networks
OutlineMotivation
Available DataPoints of interest
Data ModelingResults
Work in Progress: Self-Organizing Maps
Data DetailsData Overview
Nitrogen Fertilizer
◮ easy to measure when manuring
◮ three points into the growing season where nitrogen fertilizeris applied
◮ three attributes: N1, N2, N3
Georg Ruß, Rudolf Kruse, Martin Schneider, Peter Wagner Data Mining on Agriculture Data using Neural Networks
OutlineMotivation
Available DataPoints of interest
Data ModelingResults
Work in Progress: Self-Organizing Maps
Data DetailsData Overview
Vegetation Measuring
◮ Red Edge Inflection Point
◮ first derivative value along the red edge region
◮ aerial photography or tractor-mounted sensor
◮ larger value means more vegetation
◮ measured before N2 and N3
◮ two attributes: REIP32, REIP49
Georg Ruß, Rudolf Kruse, Martin Schneider, Peter Wagner Data Mining on Agriculture Data using Neural Networks
OutlineMotivation
Available DataPoints of interest
Data ModelingResults
Work in Progress: Self-Organizing Maps
Data DetailsData Overview
Electric Conductivity
◮ measure apparent conductivity of soil down to 1.5m
◮ uses commercial sensors
◮ one attribute: EM38
Georg Ruß, Rudolf Kruse, Martin Schneider, Peter Wagner Data Mining on Agriculture Data using Neural Networks
OutlineMotivation
Available DataPoints of interest
Data ModelingResults
Work in Progress: Self-Organizing Maps
Data DetailsData Overview
Yield
◮ measure yield when harvesting
◮ data from 2003 (previous year) and 2004 (current year)
◮ two attributes: Yield03, Yield04
Georg Ruß, Rudolf Kruse, Martin Schneider, Peter Wagner Data Mining on Agriculture Data using Neural Networks
OutlineMotivation
Available DataPoints of interest
Data ModelingResults
Work in Progress: Self-Organizing Maps
Data DetailsData Overview
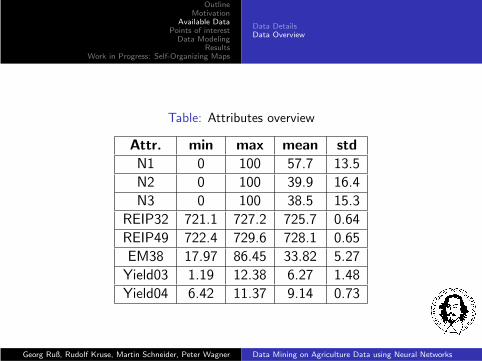
Table: Attributes overview
Attr. min max mean std
N1 0 100 57.7 13.5
N2 0 100 39.9 16.4
N3 0 100 38.5 15.3
REIP32 721.1 727.2 725.7 0.64
REIP49 722.4 729.6 728.1 0.65
EM38 17.97 86.45 33.82 5.27
Yield03 1.19 12.38 6.27 1.48
Yield04 6.42 11.37 9.14 0.73
Georg Ruß, Rudolf Kruse, Martin Schneider, Peter Wagner Data Mining on Agriculture Data using Neural Networks
OutlineMotivation
Available DataPoints of interest
Data ModelingResults
Work in Progress: Self-Organizing Maps
Data DetailsData Overview
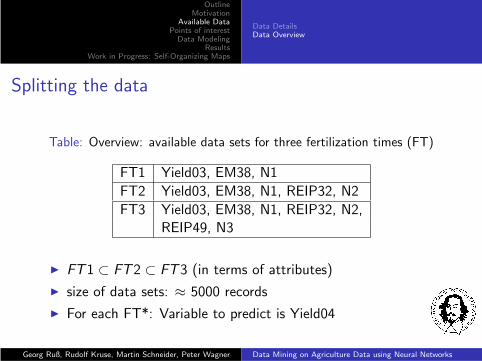
Splitting the data
Table: Overview: available data sets for three fertilization times (FT)
FT1 Yield03, EM38, N1
FT2 Yield03, EM38, N1, REIP32, N2
FT3 Yield03, EM38, N1, REIP32, N2,REIP49, N3
◮ FT1 ⊂ FT2 ⊂ FT3 (in terms of attributes)
◮ size of data sets: ≈ 5000 records
◮ For each FT*: Variable to predict is Yield04
Georg Ruß, Rudolf Kruse, Martin Schneider, Peter Wagner Data Mining on Agriculture Data using Neural Networks
OutlineMotivation
Available DataPoints of interest
Data ModelingResults
Work in Progress: Self-Organizing Maps
Research Questions
◮ How much does fertilization influence current-year yield?
◮ Is there a correlation between data attributes that influencesyield?
◮ How well can modeling techniques predict Yield2004?
◮ Can we model the data with a multi-layer-perceptron?(reproducing earlier results)
◮ What would be the optimal MLP’s topology (number ofneurons per layer)?
Georg Ruß, Rudolf Kruse, Martin Schneider, Peter Wagner Data Mining on Agriculture Data using Neural Networks
OutlineMotivation
Available DataPoints of interest
Data ModelingResults
Work in Progress: Self-Organizing Maps
Data Modeling: Multi-Layer Perceptron
◮ Feedforward artificial neural network
◮ Maps a set of input data onto output data
◮ Mapping can be learned
◮ Here: predict current year’s yield from current data
Georg Ruß, Rudolf Kruse, Martin Schneider, Peter Wagner Data Mining on Agriculture Data using Neural Networks
OutlineMotivation
Available DataPoints of interest
Data ModelingResults
Work in Progress: Self-Organizing Maps
Data Modeling: Multi-Layer Perceptron
◮ Use different-size multi-layer-perceptrons for modeling
◮ Try to determine optimal layer size (number of hidden layers:2)
◮ Compare MLPs for different data sets
◮ Use cross-validation and mean squared error for performancemeasuring
Georg Ruß, Rudolf Kruse, Martin Schneider, Peter Wagner Data Mining on Agriculture Data using Neural Networks
OutlineMotivation
Available DataPoints of interest
Data ModelingResults
Work in Progress: Self-Organizing Maps
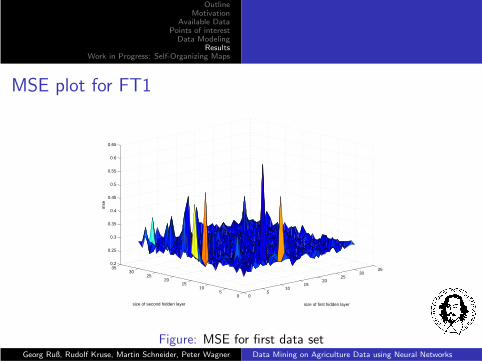
MSE plot for FT1
05
1015
2025
3035
05
1015
2025
30350.2
0.25
0.3
0.35
0.4
0.45
0.5
0.55
0.6
0.65
size of first hidden layersize of second hidden layer
mse
Figure: MSE for first data setGeorg Ruß, Rudolf Kruse, Martin Schneider, Peter Wagner Data Mining on Agriculture Data using Neural Networks
OutlineMotivation
Available DataPoints of interest
Data ModelingResults
Work in Progress: Self-Organizing Maps
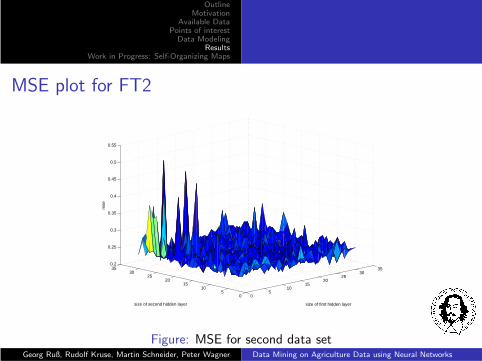
MSE plot for FT2
05
1015
2025
3035
05
1015
2025
30350.2
0.25
0.3
0.35
0.4
0.45
0.5
0.55
size of first hidden layersize of second hidden layer
mse
Figure: MSE for second data setGeorg Ruß, Rudolf Kruse, Martin Schneider, Peter Wagner Data Mining on Agriculture Data using Neural Networks
OutlineMotivation
Available DataPoints of interest
Data ModelingResults
Work in Progress: Self-Organizing Maps
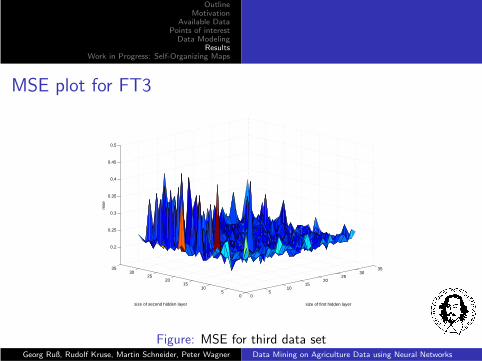
MSE plot for FT3
05
1015
2025
3035
05
1015
2025
3035
0.2
0.25
0.3
0.35
0.4
0.45
0.5
size of first hidden layersize of second hidden layer
mse
Figure: MSE for third data setGeorg Ruß, Rudolf Kruse, Martin Schneider, Peter Wagner Data Mining on Agriculture Data using Neural Networks
OutlineMotivation
Available DataPoints of interest
Data ModelingResults
Work in Progress: Self-Organizing Maps
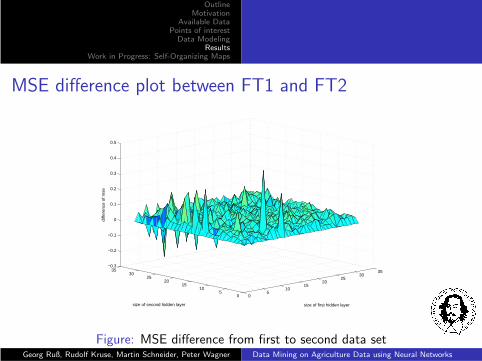
MSE difference plot between FT1 and FT2
05
1015
2025
3035
05
1015
2025
3035
−0.3
−0.2
−0.1
0
0.1
0.2
0.3
0.4
0.5
size of first hidden layersize of second hidden layer
diffe
renc
e of
mse
Figure: MSE difference from first to second data setGeorg Ruß, Rudolf Kruse, Martin Schneider, Peter Wagner Data Mining on Agriculture Data using Neural Networks
OutlineMotivation
Available DataPoints of interest
Data ModelingResults
Work in Progress: Self-Organizing Maps
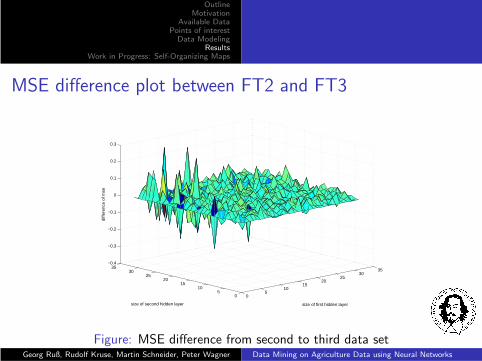
MSE difference plot between FT2 and FT3
05
1015
2025
3035
05
1015
2025
3035
−0.4
−0.3
−0.2
−0.1
0
0.1
0.2
0.3
size of first hidden layersize of second hidden layer
diffe
renc
e of
mse
Figure: MSE difference from second to third data setGeorg Ruß, Rudolf Kruse, Martin Schneider, Peter Wagner Data Mining on Agriculture Data using Neural Networks
OutlineMotivation
Available DataPoints of interest
Data ModelingResults
Work in Progress: Self-Organizing Maps
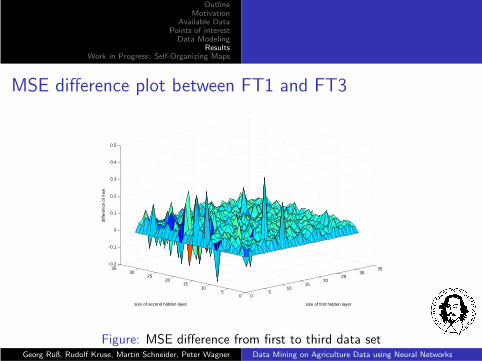
MSE difference plot between FT1 and FT3
05
1015
2025
3035
05
1015
2025
3035
−0.2
−0.1
0
0.1
0.2
0.3
0.4
0.5
size of first hidden layersize of second hidden layer
diffe
renc
e of
mse
Figure: MSE difference from first to third data setGeorg Ruß, Rudolf Kruse, Martin Schneider, Peter Wagner Data Mining on Agriculture Data using Neural Networks
OutlineMotivation
Available DataPoints of interest
Data ModelingResults
Work in Progress: Self-Organizing Maps
Summary MLP
◮ data can be modeled well with an MLP◮ low overall error◮ prediction accuracy of between 0.45 and 0.55 t
haat an average
yield of 9.14 tha
◮ prediction gets better with more data◮ expected behaviour◮ shown by difference plots
Georg Ruß, Rudolf Kruse, Martin Schneider, Peter Wagner Data Mining on Agriculture Data using Neural Networks
OutlineMotivation
Available DataPoints of interest
Data ModelingResults
Work in Progress: Self-Organizing Maps
Using the MLP predictor
◮ use MLP predictor to optimize fertilization
◮ get new data and try to understand MLP’s predictions
◮ ⇒ that’s what’s next
Georg Ruß, Rudolf Kruse, Martin Schneider, Peter Wagner Data Mining on Agriculture Data using Neural Networks
OutlineMotivation
Available DataPoints of interest
Data ModelingResults
Work in Progress: Self-Organizing Maps
Data Modeling: Self-Organizing Maps
◮ Unsupervised artificial neural network
◮ Maps high-dimensional data onto two-dimensional plane
◮ Preserves neighborhood relations
◮ Here:◮ recognition of correlations◮ understanding of data◮ visualization of data
Georg Ruß, Rudolf Kruse, Martin Schneider, Peter Wagner Data Mining on Agriculture Data using Neural Networks
OutlineMotivation
Available DataPoints of interest
Data ModelingResults
Work in Progress: Self-Organizing Maps
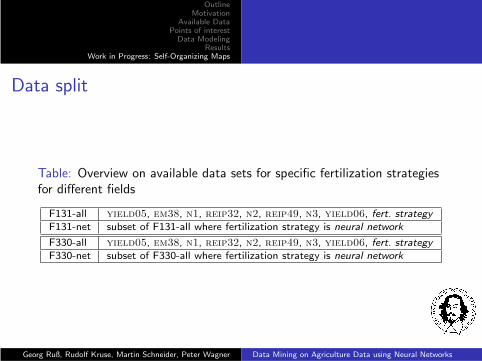
Data split
Table: Overview on available data sets for specific fertilization strategiesfor different fields
F131-all yield05, em38, n1, reip32, n2, reip49, n3, yield06, fert. strategy
F131-net subset of F131-all where fertilization strategy is neural network
F330-all yield05, em38, n1, reip32, n2, reip49, n3, yield06, fert. strategy
F330-net subset of F330-all where fertilization strategy is neural network
Georg Ruß, Rudolf Kruse, Martin Schneider, Peter Wagner Data Mining on Agriculture Data using Neural Networks
OutlineMotivation
Available DataPoints of interest
Data ModelingResults
Work in Progress: Self-Organizing Maps
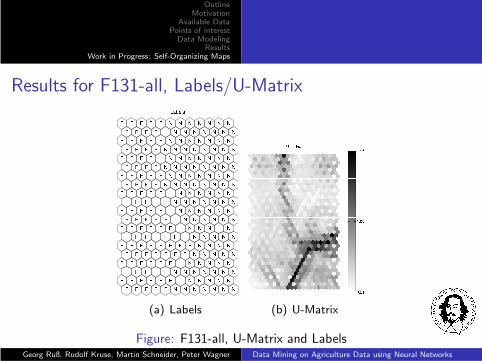
Results for F131-all, Labels/U-Matrix
(a) Labels (b) U-Matrix
Figure: F131-all, U-Matrix and LabelsGeorg Ruß, Rudolf Kruse, Martin Schneider, Peter Wagner Data Mining on Agriculture Data using Neural Networks
OutlineMotivation
Available DataPoints of interest
Data ModelingResults
Work in Progress: Self-Organizing Maps
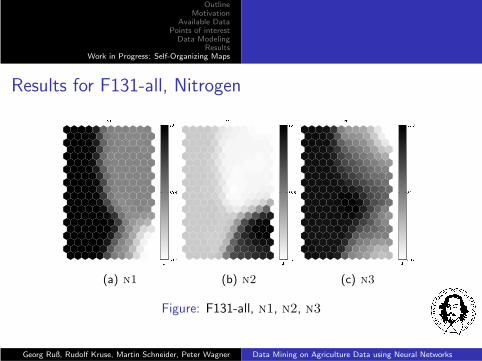
Results for F131-all, Nitrogen
(a) n1 (b) n2 (c) n3
Figure: F131-all, n1, n2, n3
Georg Ruß, Rudolf Kruse, Martin Schneider, Peter Wagner Data Mining on Agriculture Data using Neural Networks
OutlineMotivation
Available DataPoints of interest
Data ModelingResults
Work in Progress: Self-Organizing Maps
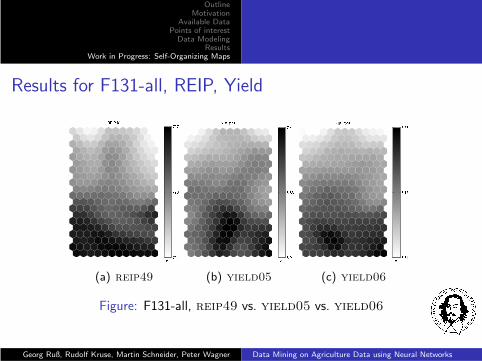
Results for F131-all, REIP, Yield
(a) reip49 (b) yield05 (c) yield06
Figure: F131-all, reip49 vs. yield05 vs. yield06
Georg Ruß, Rudolf Kruse, Martin Schneider, Peter Wagner Data Mining on Agriculture Data using Neural Networks
OutlineMotivation
Available DataPoints of interest
Data ModelingResults
Work in Progress: Self-Organizing Maps
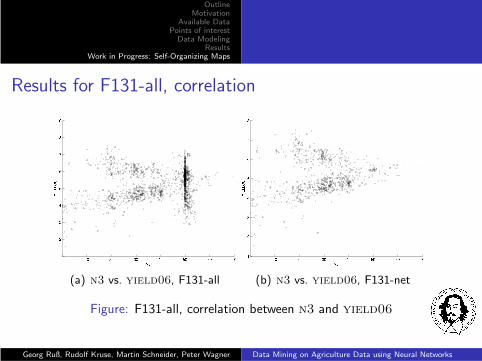
Results for F131-all, correlation
(a) n3 vs. yield06, F131-all (b) n3 vs. yield06, F131-net
Figure: F131-all, correlation between n3 and yield06
Georg Ruß, Rudolf Kruse, Martin Schneider, Peter Wagner Data Mining on Agriculture Data using Neural Networks
OutlineMotivation
Available DataPoints of interest
Data ModelingResults
Work in Progress: Self-Organizing Maps
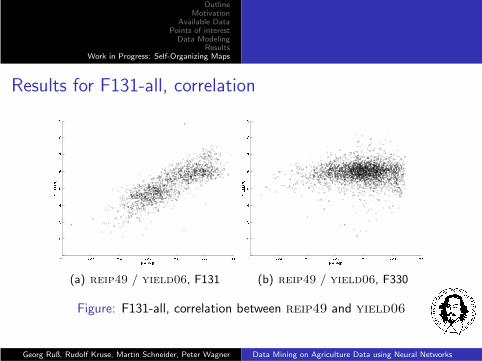
Results for F131-all, correlation
(a) reip49 / yield06, F131 (b) reip49 / yield06, F330
Figure: F131-all, correlation between reip49 and yield06
Georg Ruß, Rudolf Kruse, Martin Schneider, Peter Wagner Data Mining on Agriculture Data using Neural Networks
OutlineMotivation
Available DataPoints of interest
Data ModelingResults
Work in Progress: Self-Organizing Maps
Summary SOM
◮ very good tool for visualizing the data
◮ helps finding correlations easily without correlation plots
◮ helps finding attributes that can be used for predicting yield
Georg Ruß, Rudolf Kruse, Martin Schneider, Peter Wagner Data Mining on Agriculture Data using Neural Networks
OutlineMotivation
Available DataPoints of interest
Data ModelingResults
Work in Progress: Self-Organizing Maps
Further Work
◮ evaluate further modeling techniques
◮ compare techniques on further (already available) data sets
◮ generate optimized decision rules for, e.g. usage of fertilizer orpesticides
Georg Ruß, Rudolf Kruse, Martin Schneider, Peter Wagner Data Mining on Agriculture Data using Neural Networks
OutlineMotivation
Available DataPoints of interest
Data ModelingResults
Work in Progress: Self-Organizing Maps
Questions / Discussion
◮ Questions?
Georg Ruß, Rudolf Kruse, Martin Schneider, Peter Wagner Data Mining on Agriculture Data using Neural Networks
Recommended