05.04.2004 | Slide 1
Data Generation on Water Abstractionand Water Use
UNSD Tables W2-W4A
Michael NagyFederal Environment Agency
Wien
Training Workshop onEnvironment Statistics
Damascus, 5 April 2004

05.04.2004 | Slide 2
Contents of the presentation
l Who is Michael Nagy?l UNSD Questionnaire‘s tables W2-W4A
l Tablesl Water Schemesl Terminology
l Austrian examplesl Conclusion

05.04.2004 | Slide 3
Who is Michael Nagy?
l Since 1998 working for the Austrian Umweltbundesamt(Federal Environment Agency)
l Fields of work related to this Workshop:l Austrian UWWTP database + related data politicsl Preparation of national water data for international statistics
(Eurostat)l Drafting of national reports for reporting under the UWWT-
Directive (91/271/EEC)l Consultant of EC (DG ENV) for implementation of UWWT-
Directivel Project manager in PHARE project for waste water statistics

05.04.2004 | Slide 4
Country comparison
AUSTRIASYRIACountry
1,495?UWWTPs
~ 157 km² (0.2 %)12,130 km² (6.6 %)Irrigated land
~ 145 l~ 159 lAv. daily watercons. / person
~ 1170 mm~ 225 mm(Damascus)
Av. precipitation
No sea193 kmCoast
~ 125 / km²~ 85 / km²Population dens.
8.0 mio.15.7 mio.Population
83,858 km²185,180 km²Area

05.04.2004 | Slide 5
UNSD
Water Tables
05.04.2004 | Slide 6
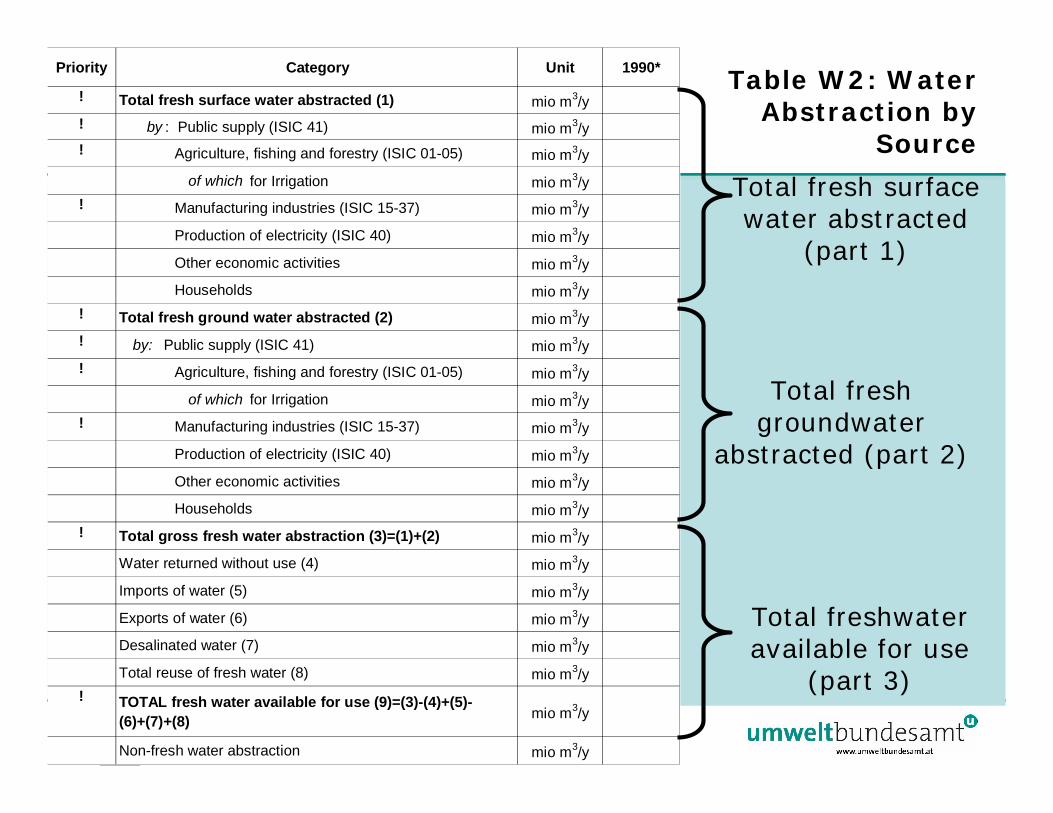
Table W2: WaterAbstraction by
Source
Priority Category Unit 1990*
! Total fresh surface water abstracted (1) mio m3/y! by : Public supply (ISIC 41) mio m3/y! Agriculture, fishing and forestry (ISIC 01-05) mio m3/y
of which for Irrigation mio m3/y! Manufacturing industries (ISIC 15-37) mio m3/y
Production of electricity (ISIC 40) mio m3/y
Other economic activities mio m3/y
Households mio m3/y! Total fresh ground water abstracted (2) mio m3/y! by: Public supply (ISIC 41) mio m3/y! Agriculture, fishing and forestry (ISIC 01-05) mio m3/y
of which for Irrigation mio m3/y! Manufacturing industries (ISIC 15-37) mio m3/y
Production of electricity (ISIC 40) mio m3/y
Other economic activities mio m3/y
Households mio m3/y! Total gross fresh water abstraction (3)=(1)+(2) mio m3/y
Water returned without use (4) mio m3/y
Imports of water (5) mio m3/y
Exports of water (6) mio m3/y
Desalinated water (7) mio m3/y
Total reuse of fresh water (8) mio m3/y! TOTAL fresh water available for use (9)=(3)-(4)+(5)-
(6)+(7)+(8) mio m3/y
Non-fresh water abstraction mio m3/y
Total fresh surfacewater abstracted
(part 1)
Total freshgroundwater
abstracted (part 2)
Total freshwateravailable for use
(part 3)

05.04.2004 | Slide 7
Category
Total fresh ground water abstracted (2)
by: Public supply (ISIC 41)
Agriculture, fishing and forestry (ISIC 01-05)
of which for Irrigation
Manufacturing industries (ISIC 15-37)
Production of electricity (ISIC 40)
Other economic activities
Households
Part 2Category
Total fresh surface water abstracted (1)
by : Public supply (ISIC 41)
Agriculture, fishing and forestry (ISIC 01-05)
of which for Irrigation
Manufacturing industries (ISIC 15-37)
Production of electricity (ISIC 40)
Other economic activities
Households
Part 1
Sea
Fresh Groundwater
Table W2: Water Abstraction by Source –Water Scheme
Public supply
Agri., fish., for.
Manif. Industr.
Electricity
Other activities
Households
Fresh Surf. WaterTABLE W1

05.04.2004 | Slide 8
Table W2: Water Abstraction by Source –Water Scheme
Sea
Fresh Groundwater
Fresh Surf. Water
Total grossfreshwaterabstraction
Total fresh wateravailable for use
Return
Imports
Desalinated
Exports
Non-fresh water
Reuse of freshwater
Category
Total gross fresh water abstraction (3)=(1)+(2)
Water returned without use (4)
Imports of water (5)
Exports of water (6)
Desalinated water (7)
Total reuse of fresh water (8)
TOTAL fresh water available for use (9)=(3)-(4)+(5)-(6)+(7)+(8)
Non-fresh water abstraction
Part 3
Fresh Surf. Water

05.04.2004 | Slide 9
Table W2: Water Abstraction by Source –Definitions, Clarifications
l Fresh surface waters:l Includes bank-filtration
l Fresh ground water:l Includes springs
l Water returned without use:l Discharges into fresh waters without use
l Primarily during mining and construction activities
l Discharges into the sea are excluded
l Not identical with water losses during transport
l Imports and exports:l Do not include bottled water

05.04.2004 | Slide 10
Table W3: Water Use by Supply Categoryand Activities
Priority Category Unit
! Total public water supply (ISIC 41) (1) mio m3/y
of which used by:All economic actitivites mio m3/y
Agriculture, forestry, fishing (ISIC 01-05) mio m3/y
of which for irrigation mio m3/y
Manufacturing industries (ISIC 15-37) mio m3/y
Production and distribution of electricity (ISIC 40) mio m3/y
Other economic activities mio m3/y
Households mio m3/y
Self-supply (2) mio m3/y
Other supply (3) mio m3/y
Total water supply (4) = (1)+(2)+(3) mio m3/y
Water losses during transport mio m3/y
! Population connected to public water supply %

05.04.2004 | Slide 11
Table W3: Water Use by Supply Categoryand Activities
Priority Category Unit
! Total public water supply (ISIC 41) (1) mio m3/y
of which used by:All economic actitivites mio m3/y
Agriculture, forestry, fishing (ISIC 01-05) mio m3/y
of which for irrigation mio m3/y
Manufacturing industries (ISIC 15-37) mio m3/y
Production and distribution of electricity (ISIC 40) mio m3/y
Other economic activities mio m3/y
Households mio m3/y
Self-supply (2) mio m3/y
Other supply (3) mio m3/y
Total water supply (4) = (1)+(2)+(3) mio m3/y
Water losses during transport mio m3/y
! Population connected to public water supply %
Table W3 WATER USE
Priority Category Unit
! Total gross fresh water abstraction (3)=(1)+(2) mio m3/y
Water returned without use (4) mio m3/y
Imports of water (5) mio m3/y
Exports of water (6) mio m3/y
Desalinated water (7) mio m3/y
Total reuse of fresh water (8) mio m3/y! TOTAL fresh water available for use (9)=(3)-(4)+(5)-
(6)+(7)+(8) mio m3/y
Non-fresh water abstraction mio m3/y
Table W2 - ABSTRACTION
Total water supply
Water lossesduring transport
Total freshwater available for use (W2)
- Water losses during transport (W3)
Total water supply (W3)
05.04.2004 | Slide 12
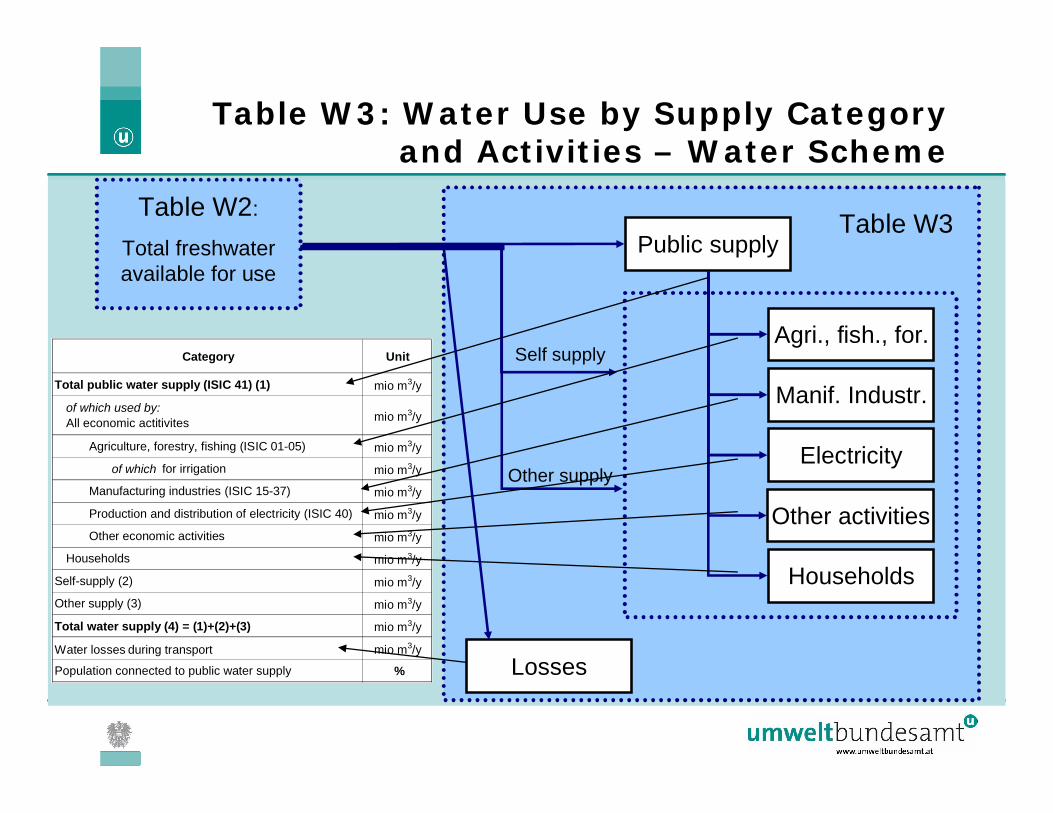
Table W3: Water Use by Supply Categoryand Activities – Water Scheme
Public supply
Agri., fish., for.
Manif. Industr.
Electricity
Other activities
Households
Table W2:
Total freshwateravailable for use
Losses
Self supply
Other supply
Category Unit
Total public water supply (ISIC 41) (1) mio m3/y
of which used by:All economic actitivites mio m3/y
Agriculture, forestry, fishing (ISIC 01-05) mio m3/y
of which for irrigation mio m3/y
Manufacturing industries (ISIC 15-37) mio m3/y
Production and distribution of electricity (ISIC 40) mio m3/y
Other economic activities mio m3/y
Households mio m3/y
Self-supply (2) mio m3/y
Other supply (3) mio m3/y
Total water supply (4) = (1)+(2)+(3) mio m3/y
Water losses during transport mio m3/y
Population connected to public water supply %
Table W3

05.04.2004 | Slide 13
Table W3: Water Use by Supply Categoryand Activities – Water Scheme
Public supply
Agri., fish., for.
Manif. Industr.
Electricity
Other activities
Households
Table W2:
Total freshwateravailable for use
Losses
Self supply
Other supply
Category Unit
Total public water supply (ISIC 41) (1) mio m3/y
of which used by:All economic actitivites mio m3/y
Agriculture, forestry, fishing (ISIC 01-05) mio m3/y
of which for irrigation mio m3/y
Manufacturing industries (ISIC 15-37) mio m3/y
Production and distribution of electricity (ISIC 40) mio m3/y
Other economic activities mio m3/y
Households mio m3/y
Self-supply (2) mio m3/y
Other supply (3) mio m3/y
Total water supply (4) = (1)+(2)+(3) mio m3/y
Water losses during transport mio m3/y
Population connected to public water supply %
Table W3

05.04.2004 | Slide 14
Table W3: Water Use by Supply Categoryand Activities – Definitions, Clarifications
l Total public water supply:l Includes desalted sea waterl Excludes system operation for agricultural purposesl Excludes deliveries of public water supply to another
l Self supply:l Includes water drawn from village wells
l Other supply:l e.g. supplies from commercial and industrial
establishmentsl e.g. reusable water
05.04.2004 | Slide 15
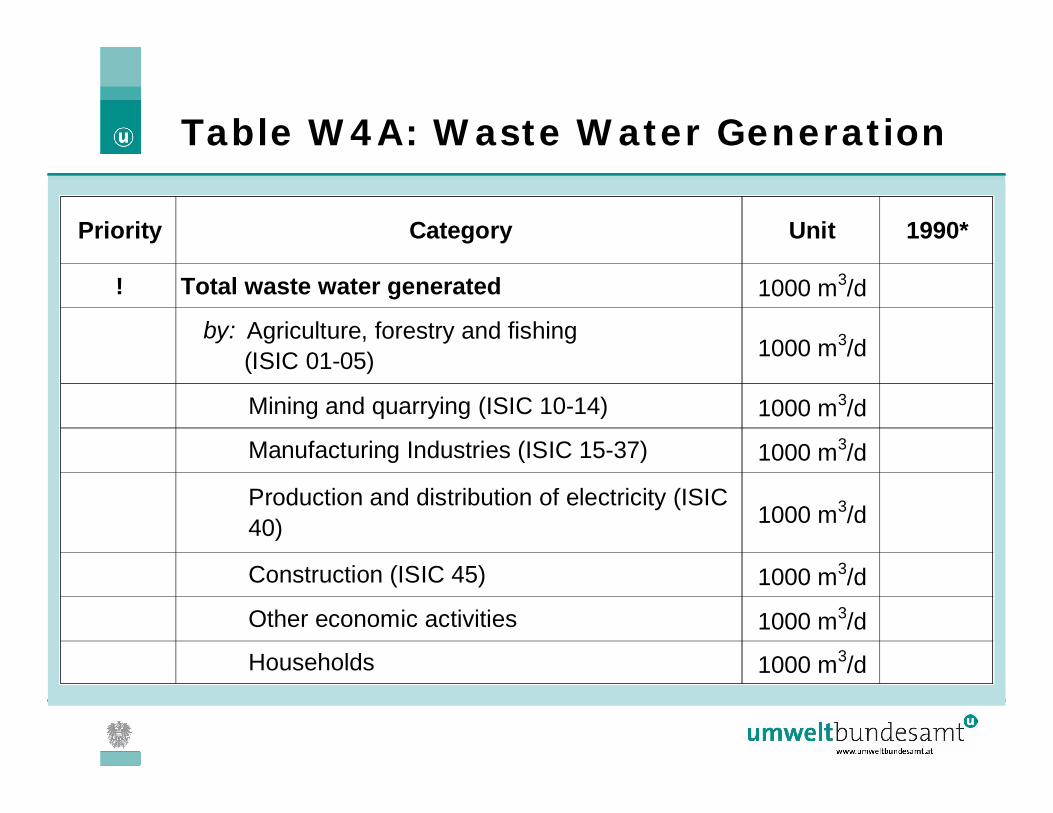
Table W4A: Waste Water Generation
Priority Category Unit 1990*
! Total waste water generated 1000 m3/d
by: Agriculture, forestry and fishing (ISIC 01-05) 1000 m3/d
Mining and quarrying (ISIC 10-14) 1000 m3/d
Manufacturing Industries (ISIC 15-37) 1000 m3/d
Production and distribution of electricity (ISIC40) 1000 m3/d
Construction (ISIC 45) 1000 m3/d
Other economic activities 1000 m3/d
Households 1000 m3/d

05.04.2004 | Slide 16
Table W4A: Waste Water Generation –Definitions, Clarifications
l Total waste water generated:
l No further immediate value
l quality
l quantity
l time of occurence
l Cooling water is included
l Not identical with water returned without use (W2)

05.04.2004 | Slide 17
AUSTRIAN EXAMPLES
05.04.2004 | Slide 18
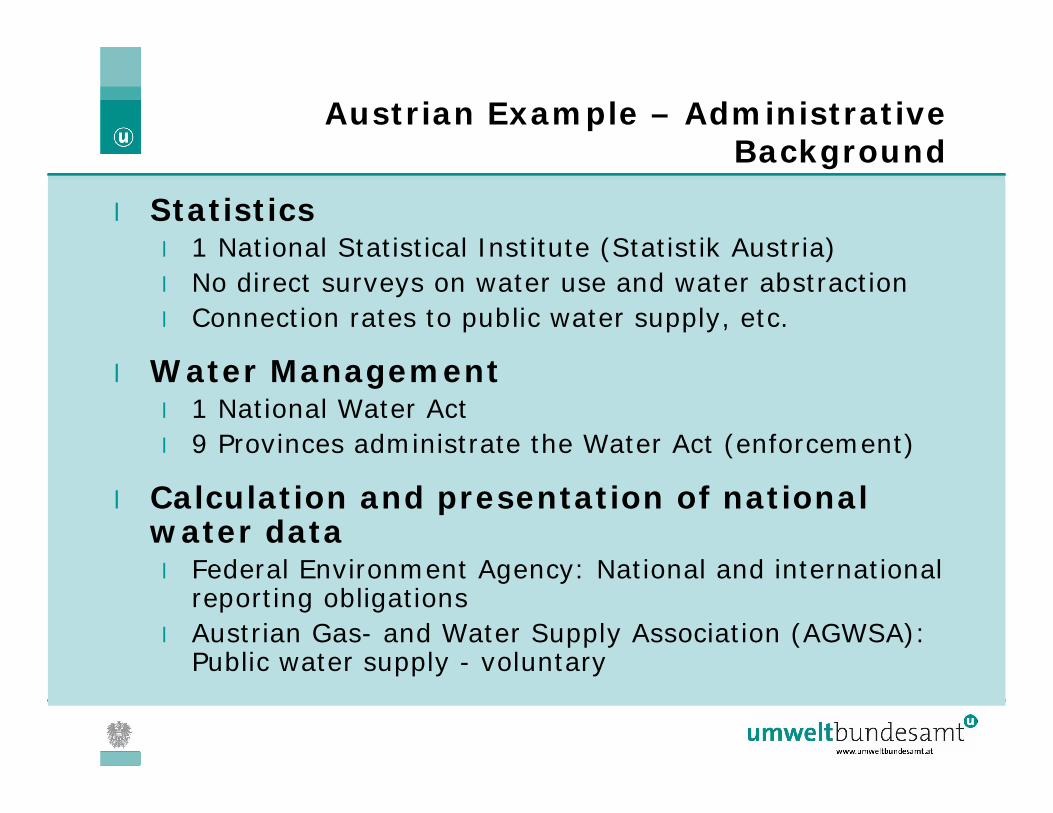
Austrian Example – AdministrativeBackground
l Statisticsl 1 National Statistical Institute (Statistik Austria)l No direct surveys on water use and water abstractionl Connection rates to public water supply, etc.
l Water Managementl 1 National Water Actl 9 Provinces administrate the Water Act (enforcement)
l Calculation and presentation of nationalwater datal Federal Environment Agency: National and international
reporting obligationsl Austrian Gas- and Water Supply Association (AGWSA):
Public water supply - voluntary

05.04.2004 | Slide 19
Austrian Example – Key players for datamanagement
l Statistik Austria – Focal Point for ESTAT, National Surveys(connection rate to PWS, Agrarian Statistics, Material InputSurvey, Energy Statistics...)
l Ministry of Agriculture, Forestry, Environment andWater Management – Water Act, Hydrographic Information
l 9 Provincial authorities – Enforcement and regional datacollection
l Federal Environment Agency – National data collection
l Austrian Gas- and Water Supply Association (AGWSA) –Public water supply
05.04.2004 | Slide 20
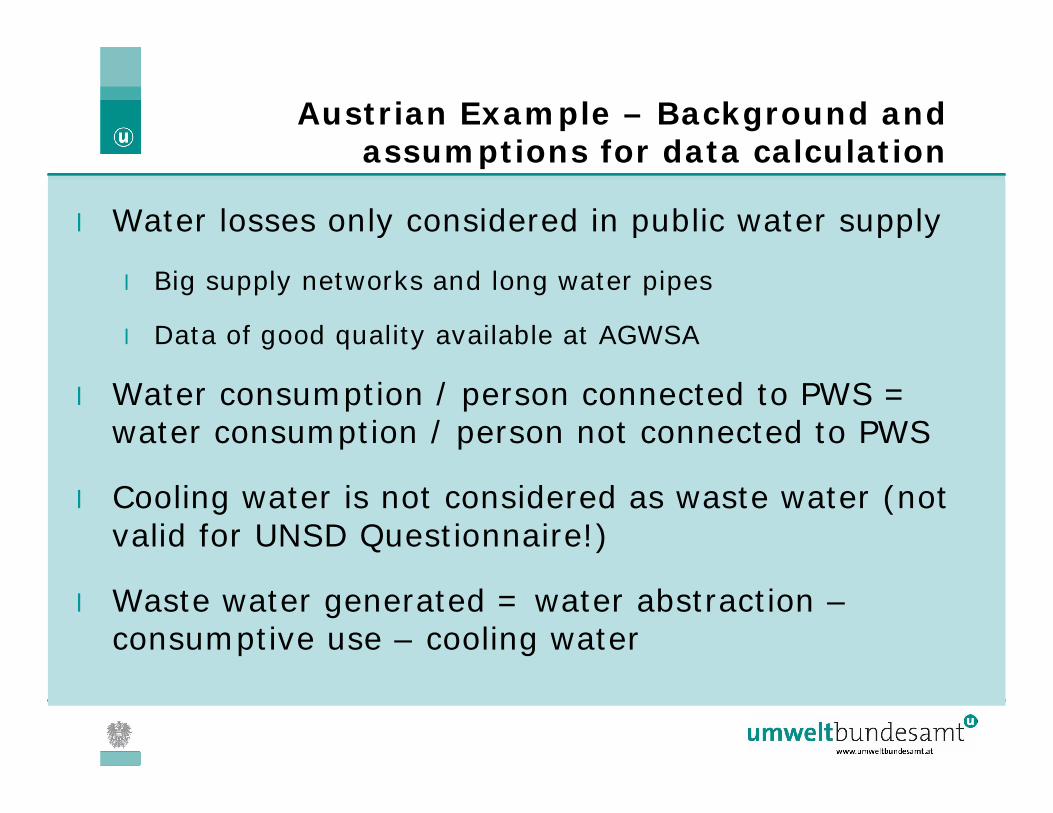
Austrian Example – Background andassumptions for data calculation
l Water losses only considered in public water supply
l Big supply networks and long water pipes
l Data of good quality available at AGWSA
l Water consumption / person connected to PWS =water consumption / person not connected to PWS
l Cooling water is not considered as waste water (notvalid for UNSD Questionnaire!)
l Waste water generated = water abstraction –consumptive use – cooling water

05.04.2004 | Slide 21
Austrian Example – Priorisation of availabledata
l 1. Metering of water abstraction / supplyl Accuracy
l Data flow to national institutions
l 2. Calculated with use factorsl Derivation of factors
l Calibration of factors
l 3. Estimation / calculation based on enforcement datal Permitted uses
l Surveillance monitoring (is the permitted use exceeded?)

05.04.2004 | Slide 22
Austrian Example – Data availability /Sector (situation 1999)
l PUBLIC WATER SUPPLY (ISIC 41):l Annual reports based on metered volumes (AGWSA statistics)l ~ 65 % of population covered by reports
l DOMESTIC SECTOR:l Population connected to PWS 1981 and 1991 (Statistik Austria)
l MANUFACTURING INDUSTRY:l Annual data from survey until 1994 based on measurements and
“plausible estimations” (Statistik Austria)l Cooling water included
l PRODUCTION OF ELECTRICITY (ISIC 40):l Cooling water is not measuredl Information about produced electricity available from national
reports
l IRRIGATION:l Data on irrigated area 1994 and 1999 (Statistik Austria)l Crop-specific irrigation volumes (studies, Farmers Assoc.)
05.04.2004 | Slide 23
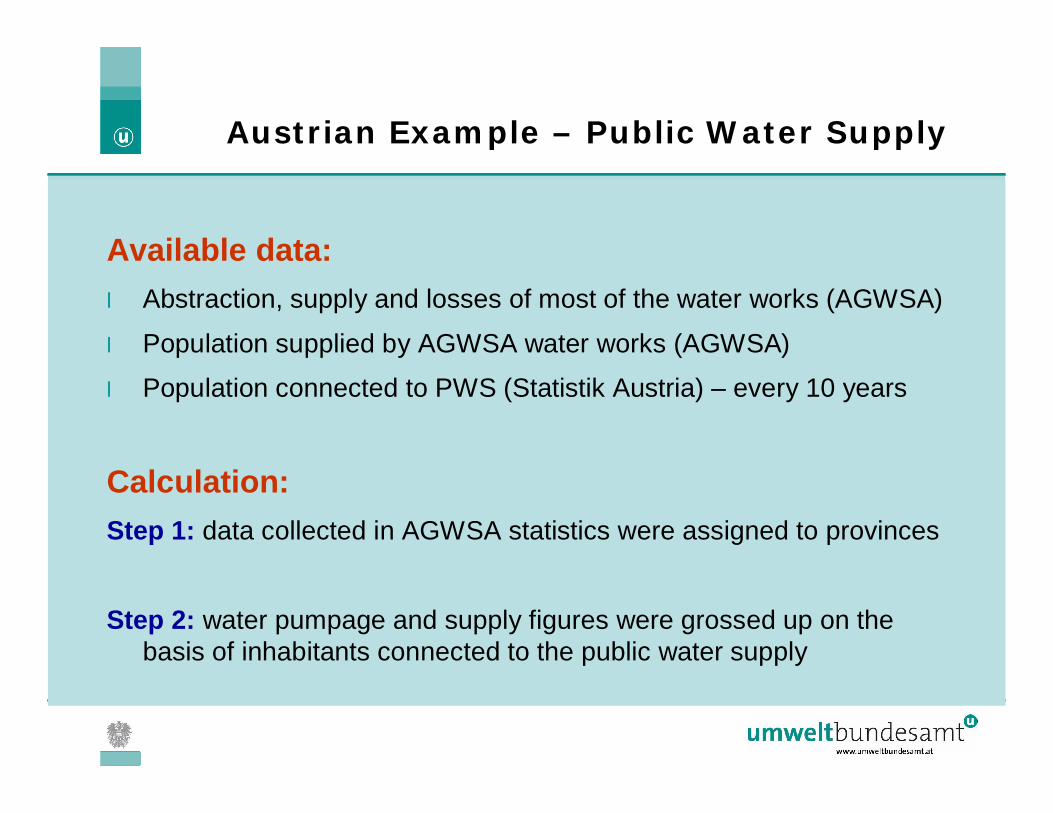
Austrian Example – Public Water Supply
Available data:l Abstraction, supply and losses of most of the water works (AGWSA)
l Population supplied by AGWSA water works (AGWSA)
l Population connected to PWS (Statistik Austria) every 10 years
Calculation:Step 1: data collected in AGWSA statistics were assigned to provinces
Step 2: water pumpage and supply figures were grossed up on thebasis of inhabitants connected to the public water supply

05.04.2004 | Slide 24
Austrian Example – Public Water Supply
Province of Upper Austria 1996STATISTIK AUSTRIA data
AGWSA data
a) Inhabitants: 1.381 mio.b) Population connected to PWS: 74.4 % ≈ 1,027 mio. people
c) Pumpage by AGWSA water works: ~ 50 mio. m³d) Population supplied by AGWSA water works : 689,180 ≈ 67.1% of populationconnected to PWS
Final calculation: ³..%.
³.)) mmio574
167mmio50
dc ==

05.04.2004 | Slide 25
Austrian Example – Self Supply ofHouseholds
l Assumptions:l Water consumption / person connected to PWS = water
consumption / person not connected to PWSl No losses during transport (à abstraction = use)
l Data sources:l Statistik Austria: Total population and population connected to PWSl AGWSA: Average annual water consumption / person
l Calculation:l (Total population – population connected to PWS) x average water
consumption

05.04.2004 | Slide 26
Austrian Example – Industrial Water Use
2%
3%
3% 4%
12%
36%Plant A
Plant B
Plant CPlant D
Plant E
Plant F
6 industrial plants cover60 % of water use

05.04.2004 | Slide 27
Austrian Example – Industrial Water Use
l Individual information about dominating usersfrom annual questionnaires
l + grossed up representative samples of „typicalusers / sector“ (Industry Statistics)
l Probably full survey every 6 years in the future

05.04.2004 | Slide 28
Austrian Example – Irrigation
l Metered datal only from water cooperatives availablel available only on regional level
l Irrigated area from Agrarian Statisticsl Climatic informationl Crop specific irrigation volumes
l Studiesl Regional Farmers Associations
Available data

05.04.2004 | Slide 29
Austrian Example – Irrigation
Objectives of the calculationè Taking into account regional and system-specific differences
è Taking into account actual climatic conditions
Calculation - mixed approachStep 1: Collection of metered data
Step 2: Assessment of climatic conditions for each year and region
Step 3: Calculation of region-specific irrigation value/ha by usingnational data (irrigated area, crop- and climate specific volumes)
Step 4: Final calculation:
valueirrigationspecificregionarearemainingvolumesmetered ×+∑ )(
Calculation

05.04.2004 | Slide 30
Austrian Example – Cooling Water in CaloricPower Plants
è Electricity produced by caloric power plants for eachregion and year (Energy Statistics of Statistik Austria)
è Estimated or measured use of cooling water of a fewplants
Available data
Calculation(Average m³/GWh) x produced electricity

05.04.2004 | Slide 31
Austrian Example – Total National Supply
44%
35%
17%2%
2%
Production of electricityIndustryPublic water supplyDomestic sectorAgriculture

05.04.2004 | Slide 32
Austria – Long Term Average Water Balance

05.04.2004 | Slide 33
Conclusion
l Economic needs (e.g. acounting of actually usedwater of water cooperatives)
l Material input statistics
l Enforcement (surveillance monitoring of theauthority, self-monitoring of the operator)
l ...
Data on water uses is often a by-product

05.04.2004 | Slide 34
Conclusion
l Authorities
l National Statistical Institutes
l Professional associations or cooperatives
l Environment Agencies
l Universities
l ...
Usually there are many national partnersinvolved

05.04.2004 | Slide 35
Conclusion
l Agreed terminology (glossary, water flowschemes)
l Defined data flows (law, bilateral contracts etc.)
l Duplicable calculation methodologies
l ...
Consistency of data requires

05.04.2004 | Slide 36
Thank you very much for yourattention!
Michael Nagy
Recommended


![Eden and Esk abstraction licensing strategy · Reference number/code [Sector Code] Eden and Esk abstraction licensing strategy A licensing strategy to manage water resources sustainably](https://img.pdfslide.us/doc/110x75/5f68ce3d497d8b507b46b7ce/eden-and-esk-abstraction-licensing-strategy-reference-numbercode-sector-code.jpg)