Data for Helioseismology Testing: Large-Scale Stein-
Nordlund Simulations
Dali GeorgobianiMichigan State University
Presenting the results of
Bob Stein (MSU) & Åke Nordlund (Denmark)with
David Benson (MSU)Stanford, August 6, 2007
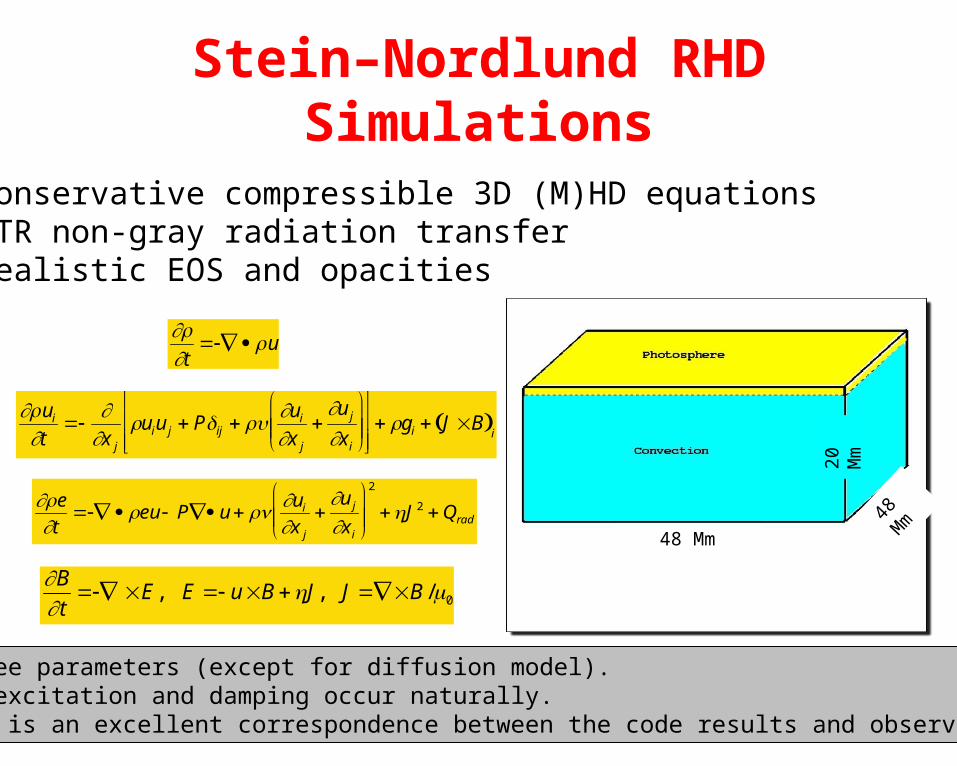
Stein–Nordlund RHD Simulations
• Conservative compressible 3D (M)HD equations• LTR non-gray radiation transfer• Realistic EOS and opacities
No free parameters (except for diffusion model). Wave excitation and damping occur naturally. There is an excellent correspondence between the code results and observations.
t
u
uit
x j
uiu j Pij uix j
u jx i
gi JB i
et
eu P u uix j
u jx i
2
J 2 Qrad
Bt
E, E uB J, J B /0
48 Mm
48
Mm
20
Mm
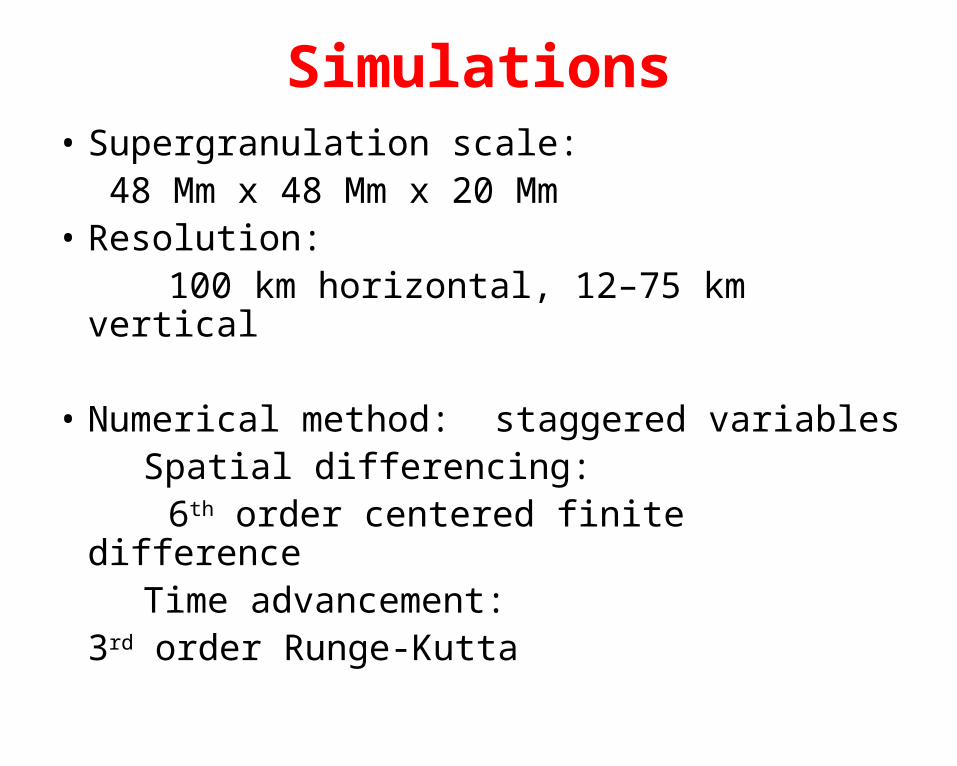
Simulations• Supergranulation scale:
48 Mm x 48 Mm x 20 Mm• Resolution: 100 km horizontal, 12–75 km vertical
• Numerical method: staggered variables Spatial differencing: 6th order centered finite difference Time advancement:
3rd order Runge-Kutta
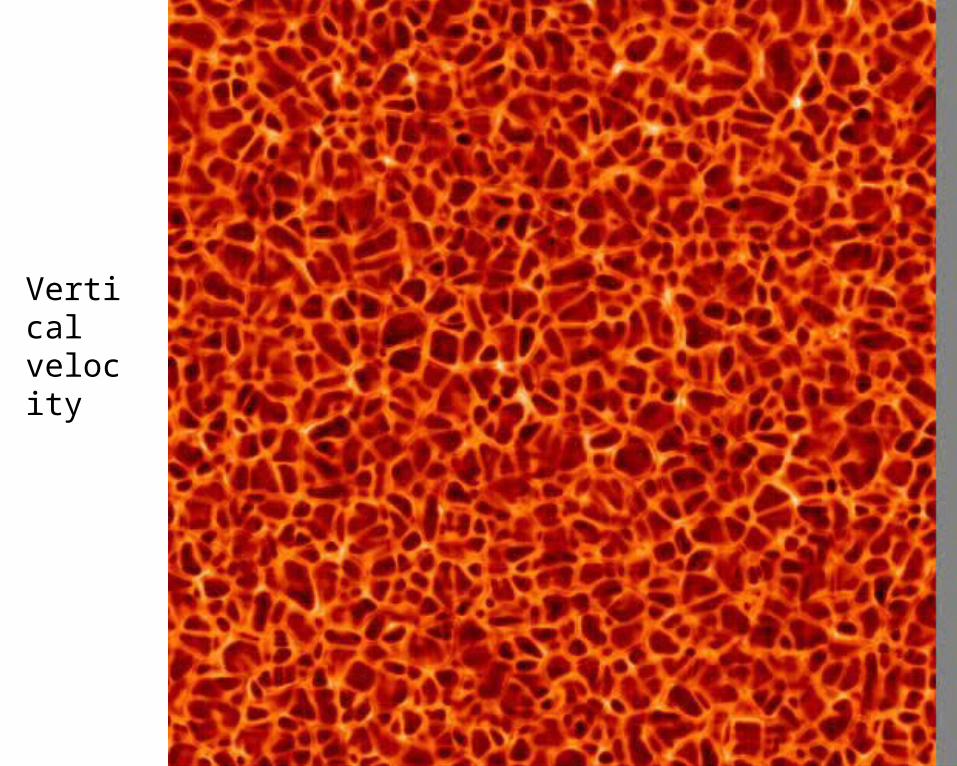
Verticalvelocity
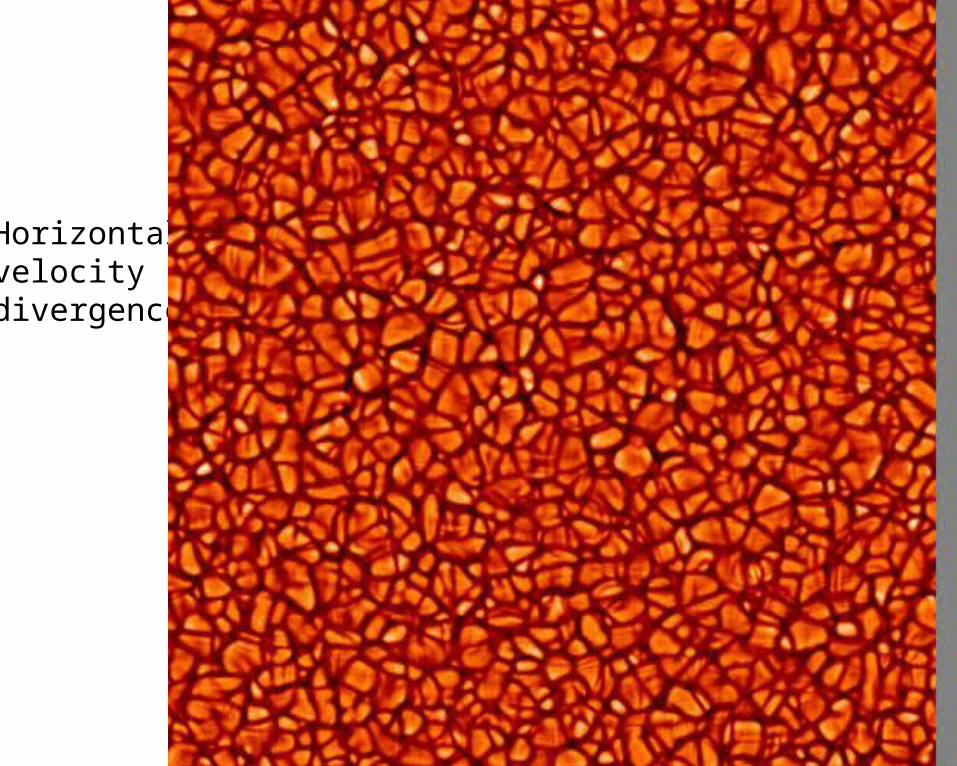
Horizontalvelocity divergence
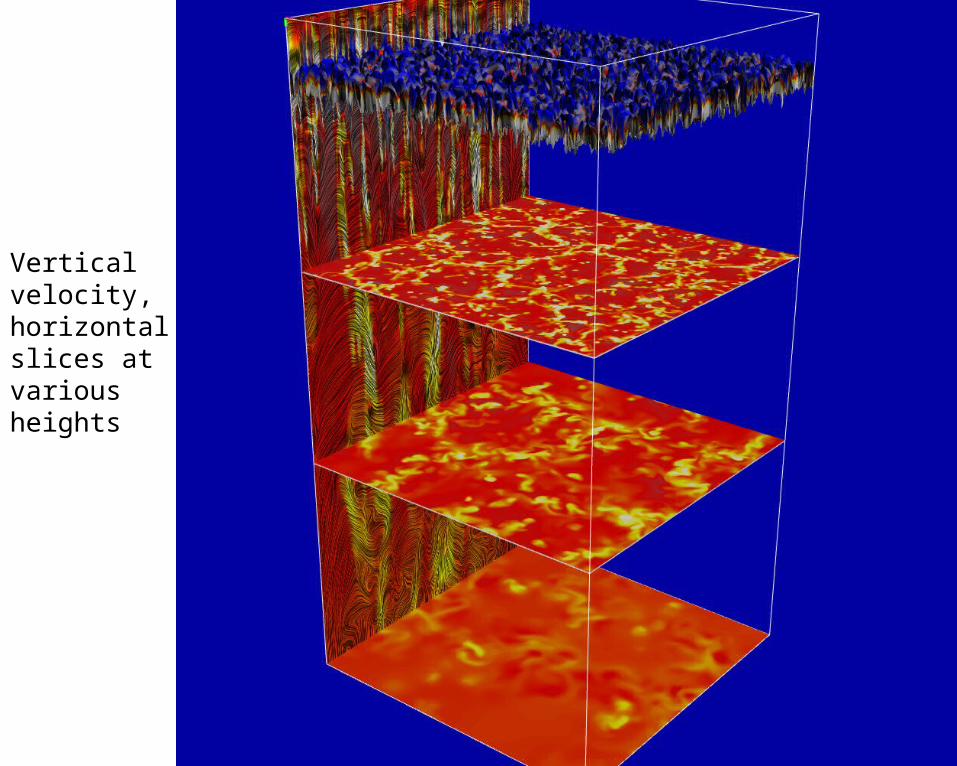
Verticalvelocity,horizontalslices at various heights
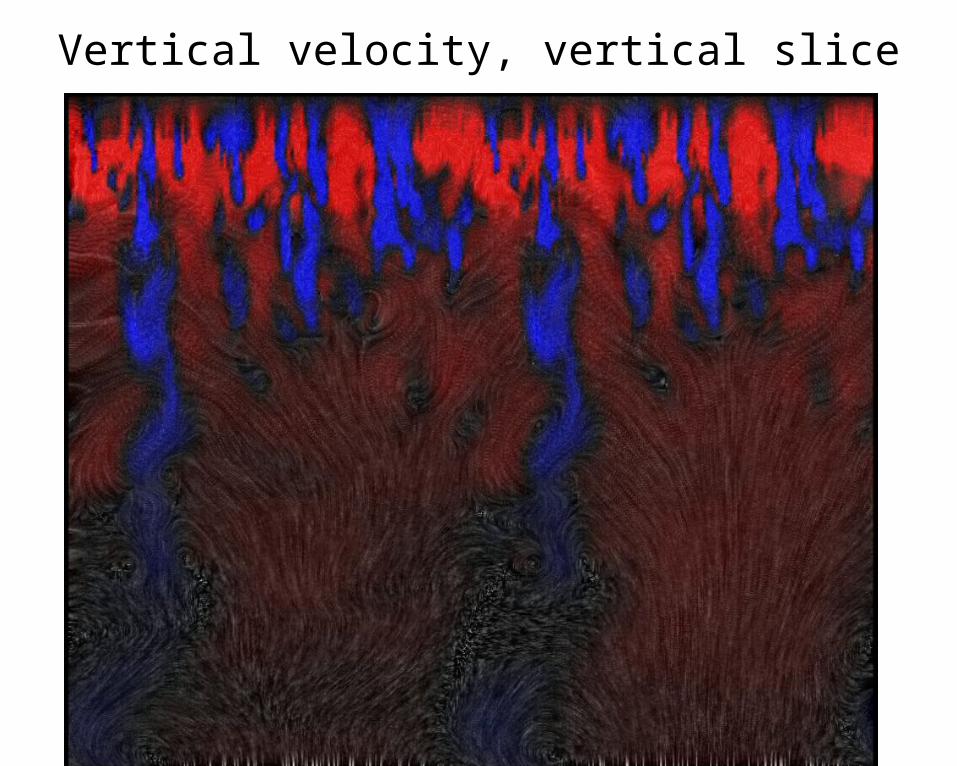
Vertical velocity, vertical slice
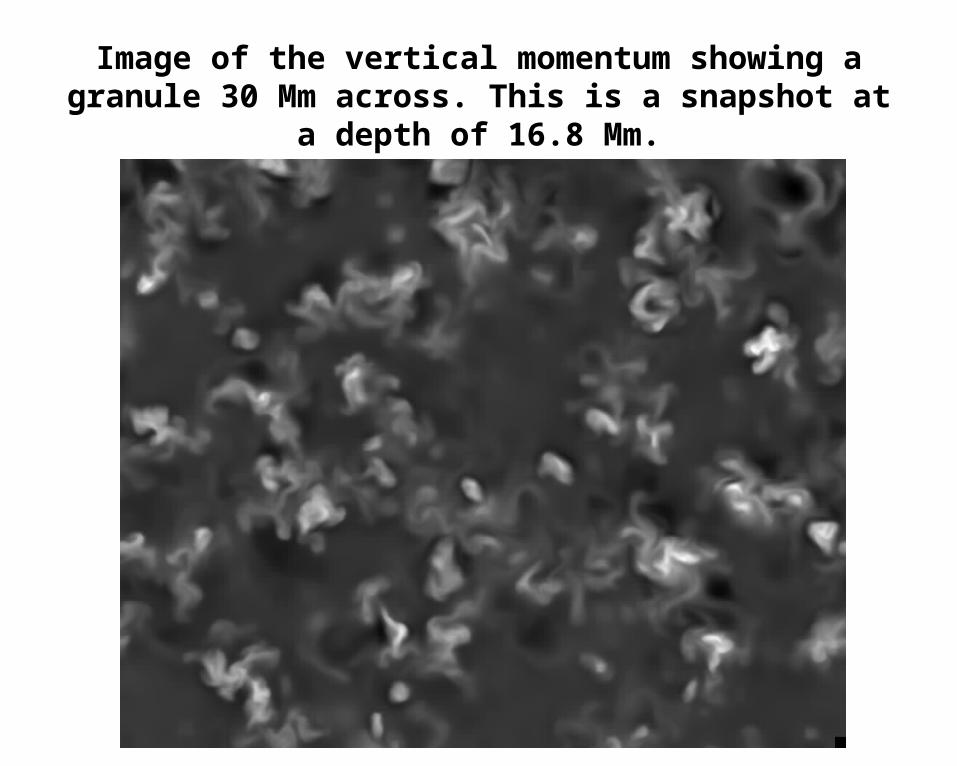
Image of the vertical momentum showing a granule 30 Mm across. This is a snapshot at a depth of 16.8 Mm.
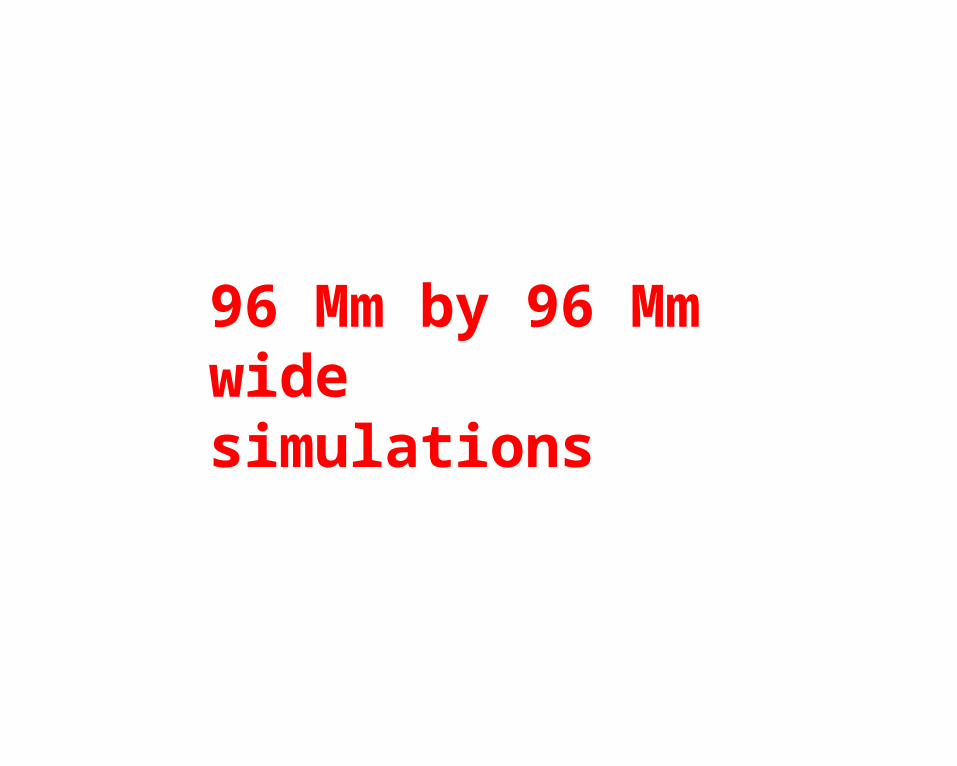
96 Mm by 96 Mm wide simulations
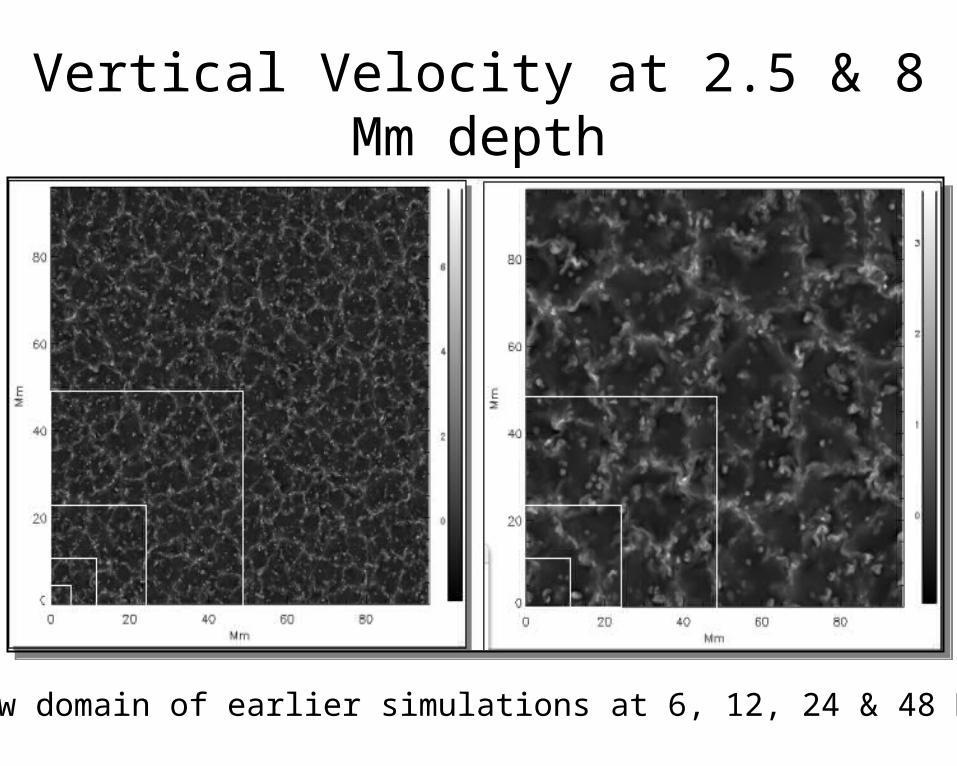
Vertical Velocity at 2.5 & 8 Mm depth
Boxes show domain of earlier simulations at 6, 12, 24 & 48 Mm widths.
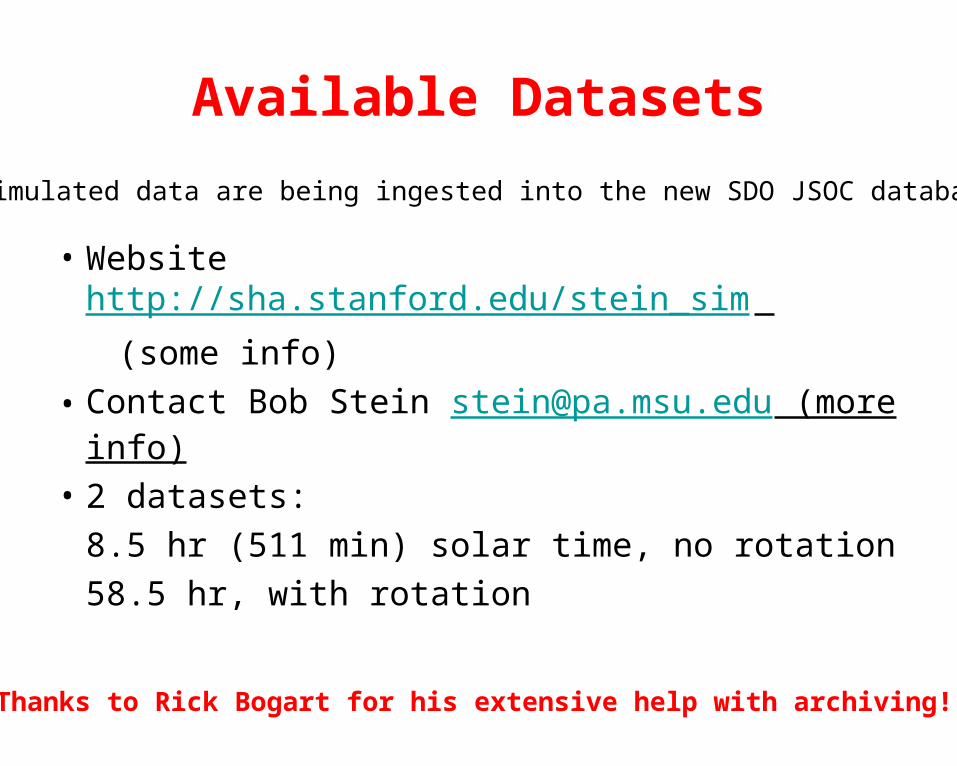
Available Datasets
• Website http://sha.stanford.edu/stein_sim
(some info)
• Contact Bob Stein [email protected] (more info)
• 2 datasets:
8.5 hr (511 min) solar time, no rotation
58.5 hr, with rotation
Simulated data are being ingested into the new SDO JSOC database
Thanks to Rick Bogart for his extensive help with archiving!
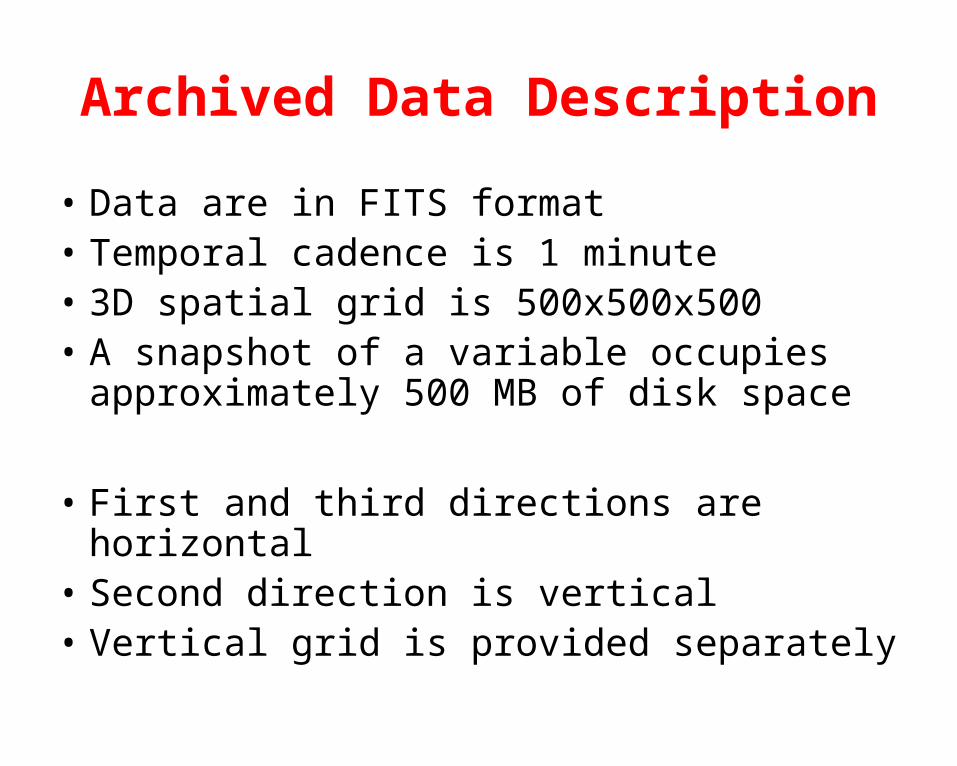
Archived Data Description
• Data are in FITS format• Temporal cadence is 1 minute• 3D spatial grid is 500x500x500• A snapshot of a variable occupies
approximately 500 MB of disk space
• First and third directions are horizontal• Second direction is vertical• Vertical grid is provided separately
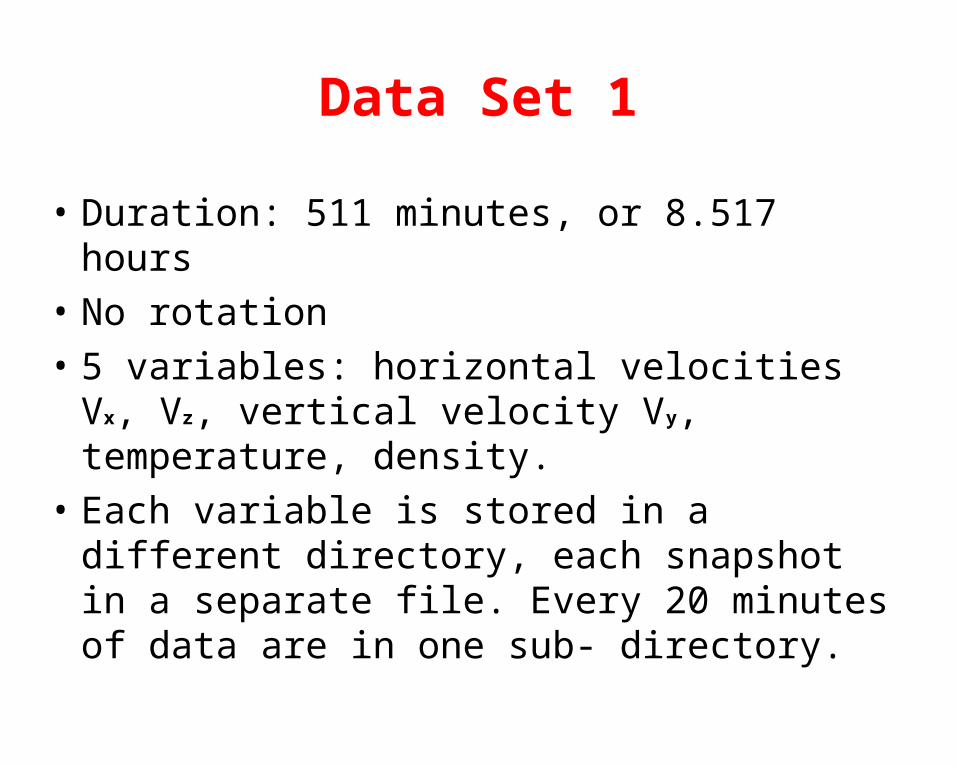
Data Set 1
• Duration: 511 minutes, or 8.517 hours
• No rotation
• 5 variables: horizontal velocities Vx, Vz, vertical velocity Vy, temperature, density.
• Each variable is stored in a different directory, each snapshot in a separate file. Every 20 minutes of data are in one sub- directory.
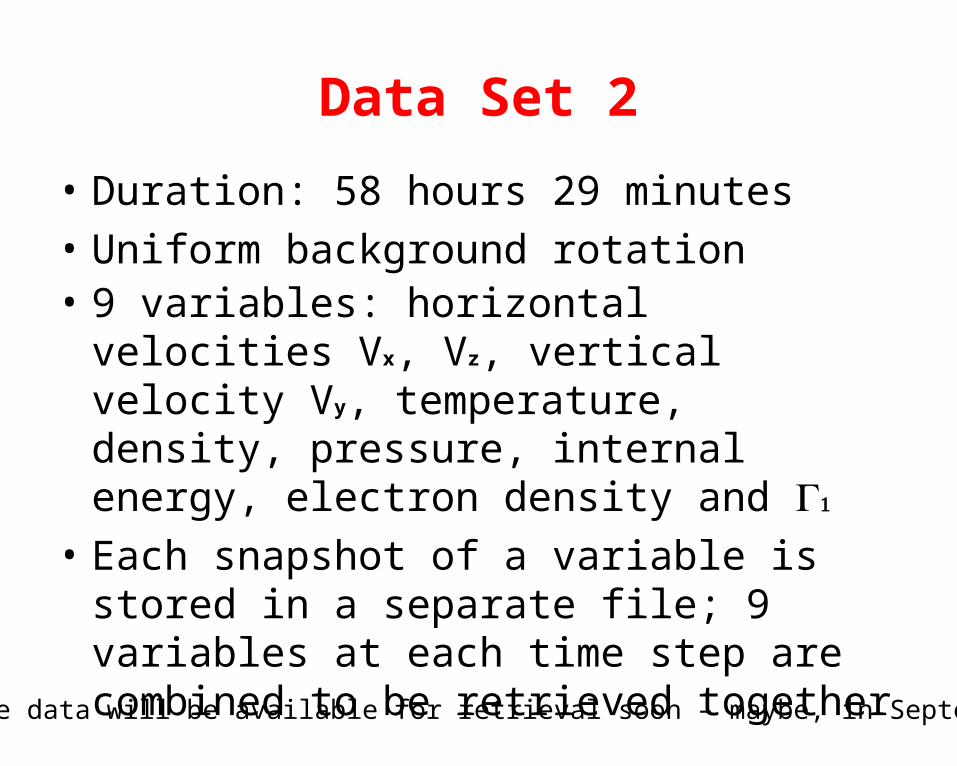
Data Set 2
• Duration: 58 hours 29 minutes
• Uniform background rotation• 9 variables: horizontal velocities Vx, Vz,
vertical velocity Vy, temperature, density, pressure, internal energy, electron density and
• Each snapshot of a variable is stored in a separate file; 9 variables at each time step are combined to be retrieved together
(The data will be available for retrieval soon – maybe, in September)
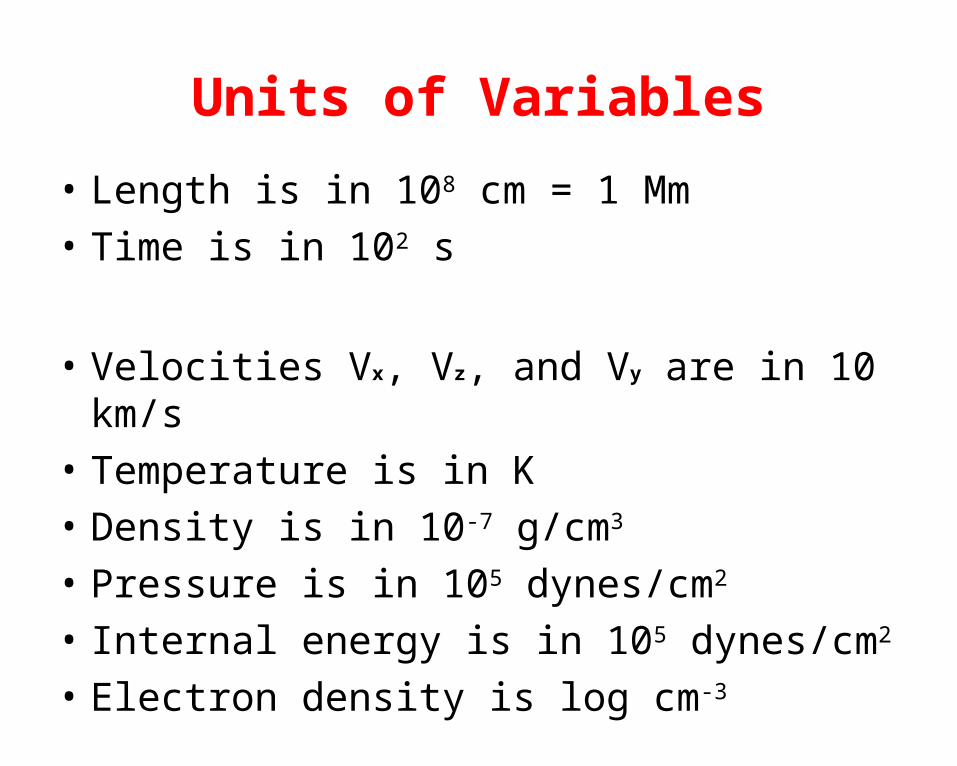
Units of Variables
• Length is in 108 cm = 1 Mm
• Time is in 102 s
• Velocities Vx, Vz, and Vy are in 10 km/s
• Temperature is in K
• Density is in 10-7 g/cm3
• Pressure is in 105 dynes/cm2
• Internal energy is in 105 dynes/cm2
• Electron density is log cm-3
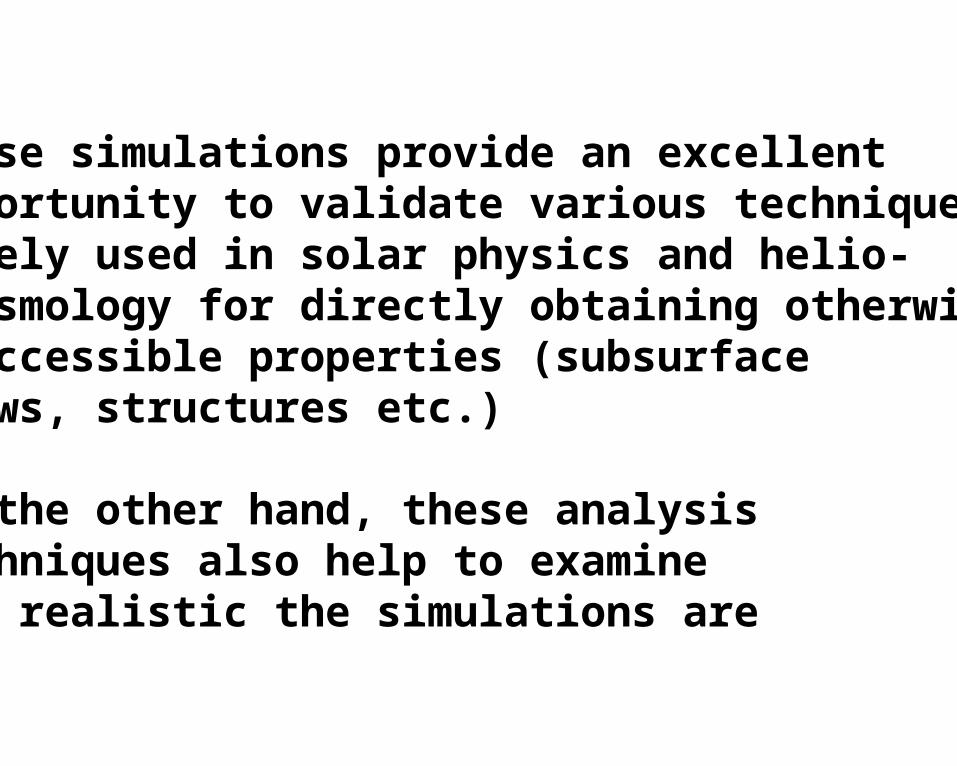
These simulations provide an excellentopportunity to validate various techniques, widely used in solar physics and helio-seismology for directly obtaining otherwise inaccessible properties (subsurfaceflows, structures etc.)
On the other hand, these analysis techniques also help to examinehow realistic the simulations are
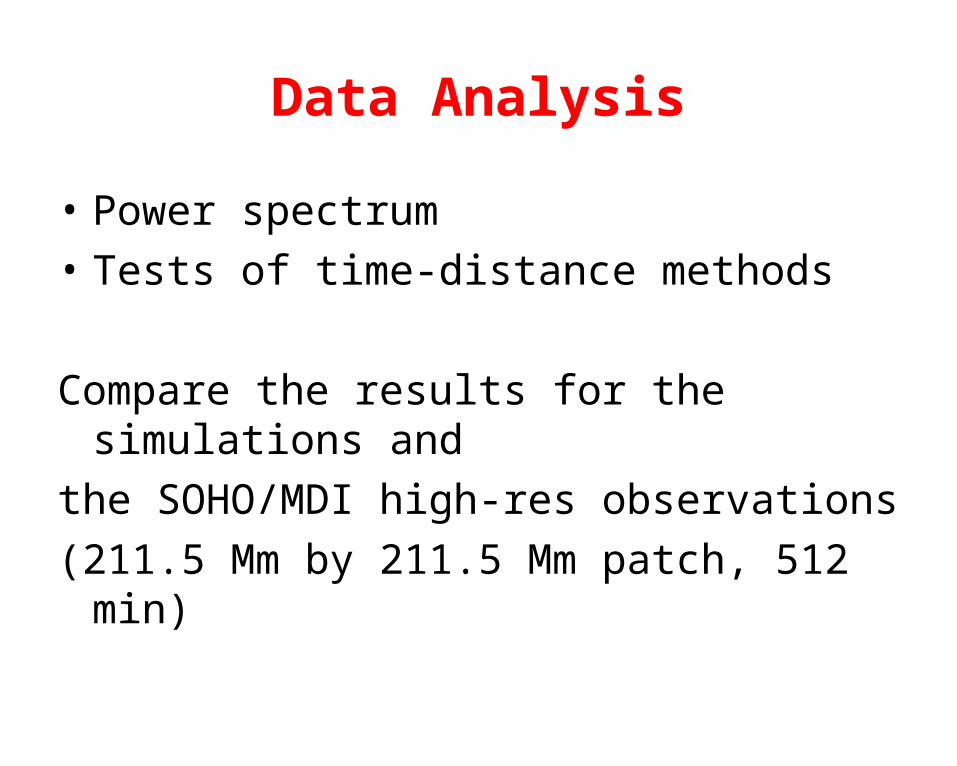
Data Analysis
• Power spectrum
• Tests of time-distance methods
Compare the results for the simulations and
the SOHO/MDI high-res observations
(211.5 Mm by 211.5 Mm patch, 512 min)
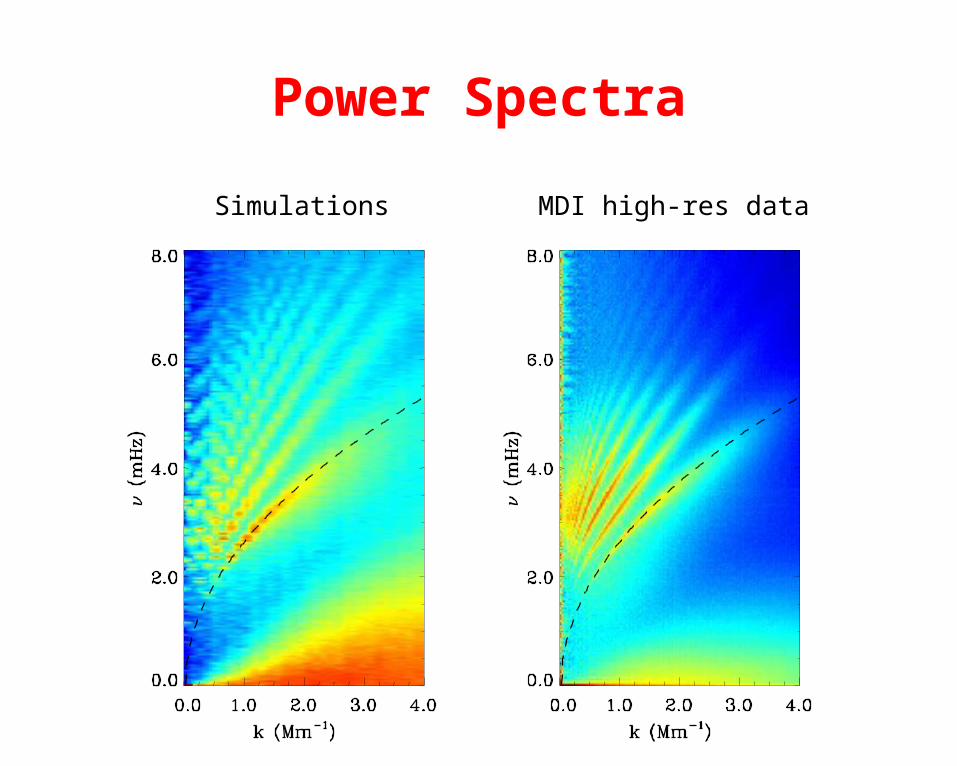
Power Spectra
Simulations MDI high-res data
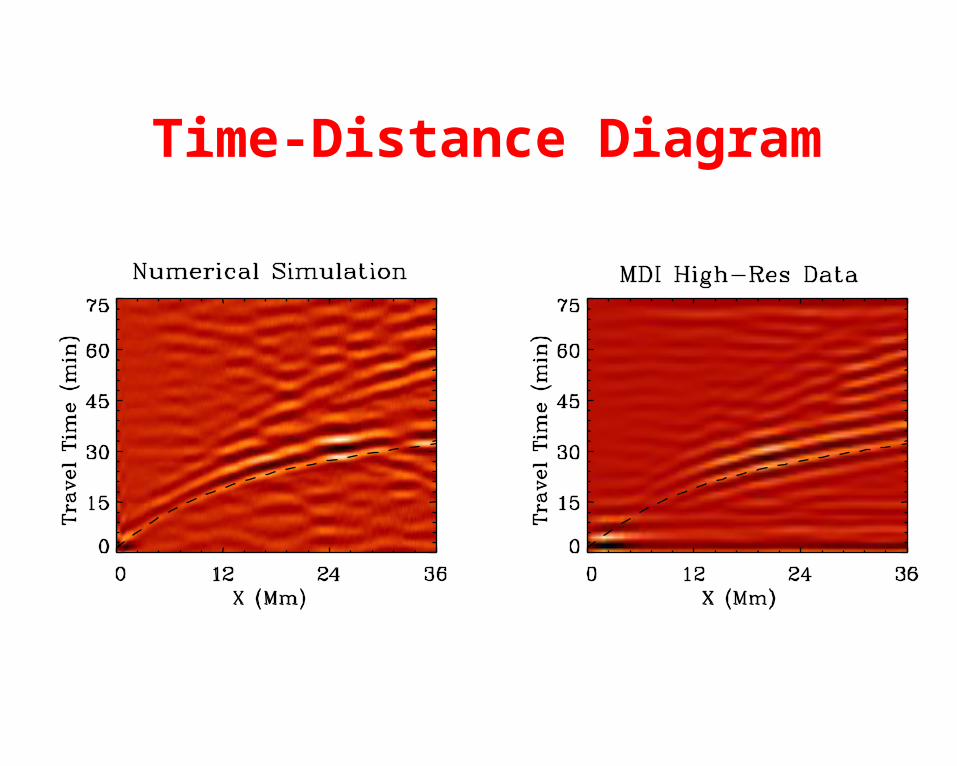
Time-Distance Diagram
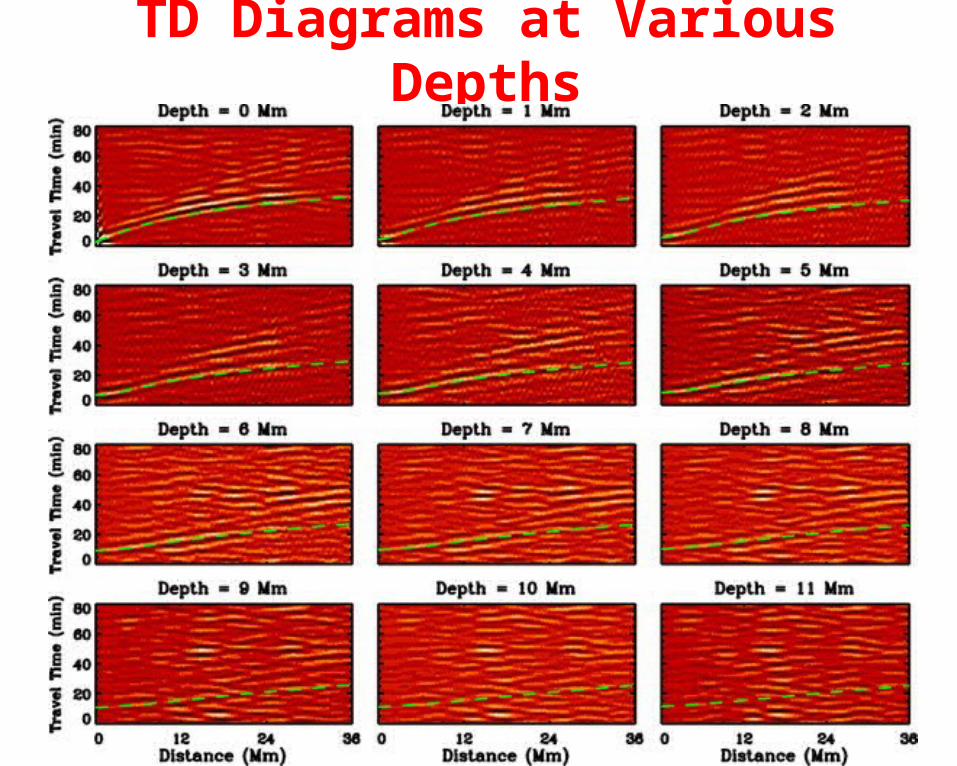
TD Diagrams at Various Depths
Exploring Simulated Surface Structures
• Spatial filtering
• Spectral analysis
• f-mode time-distance analysis
• Local correlation tracking
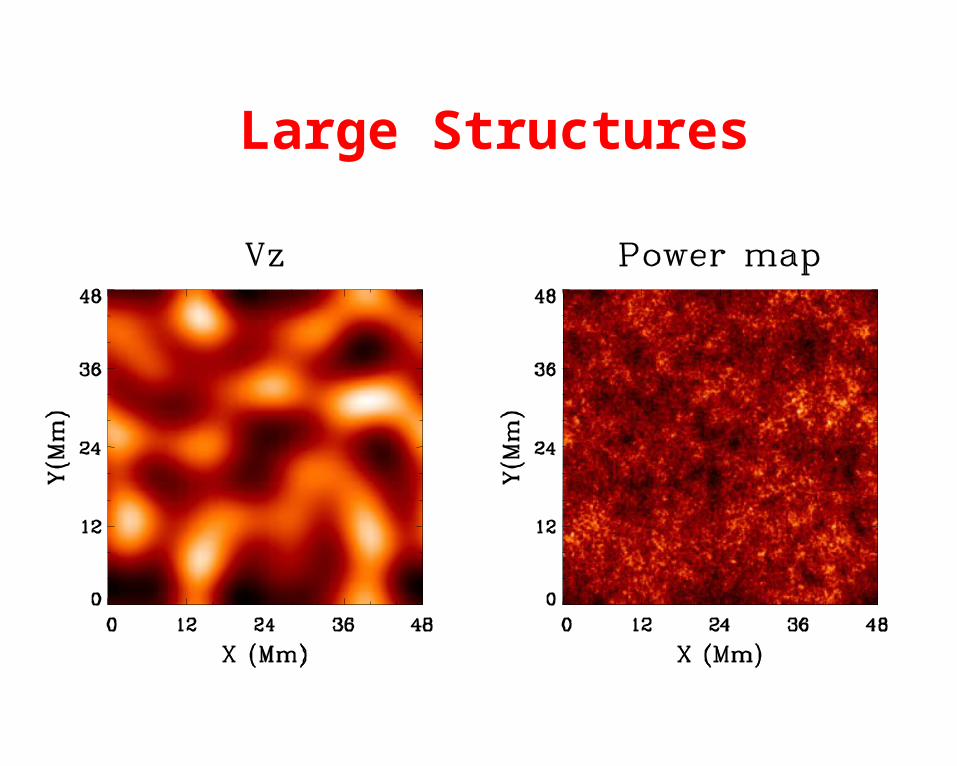
Large Structures
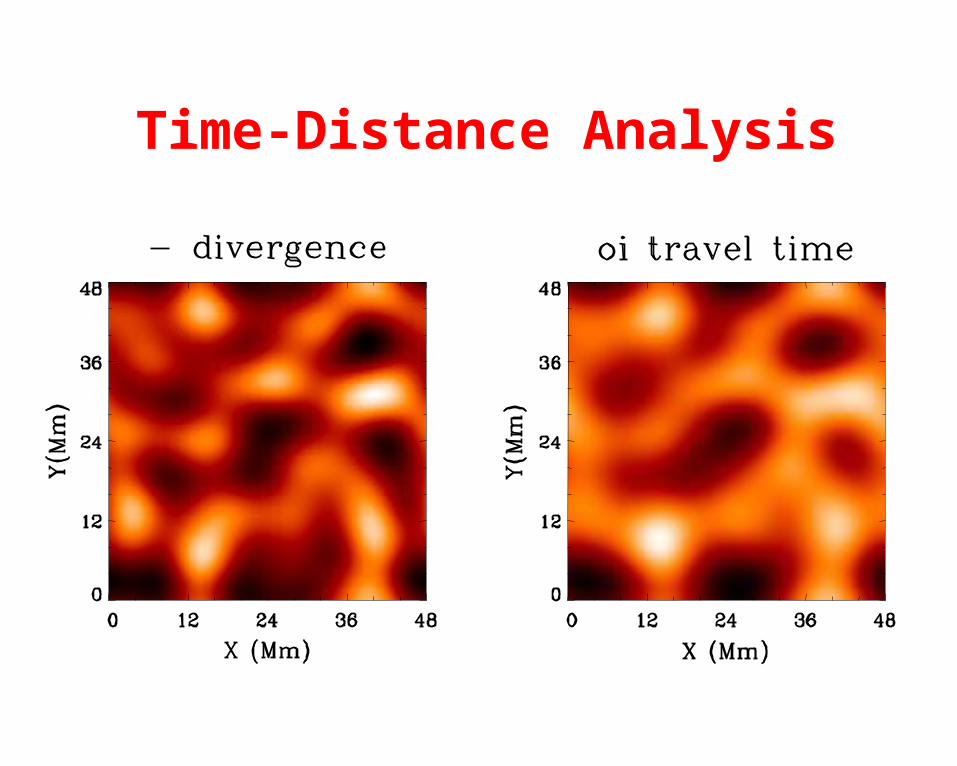
Time-Distance Analysis
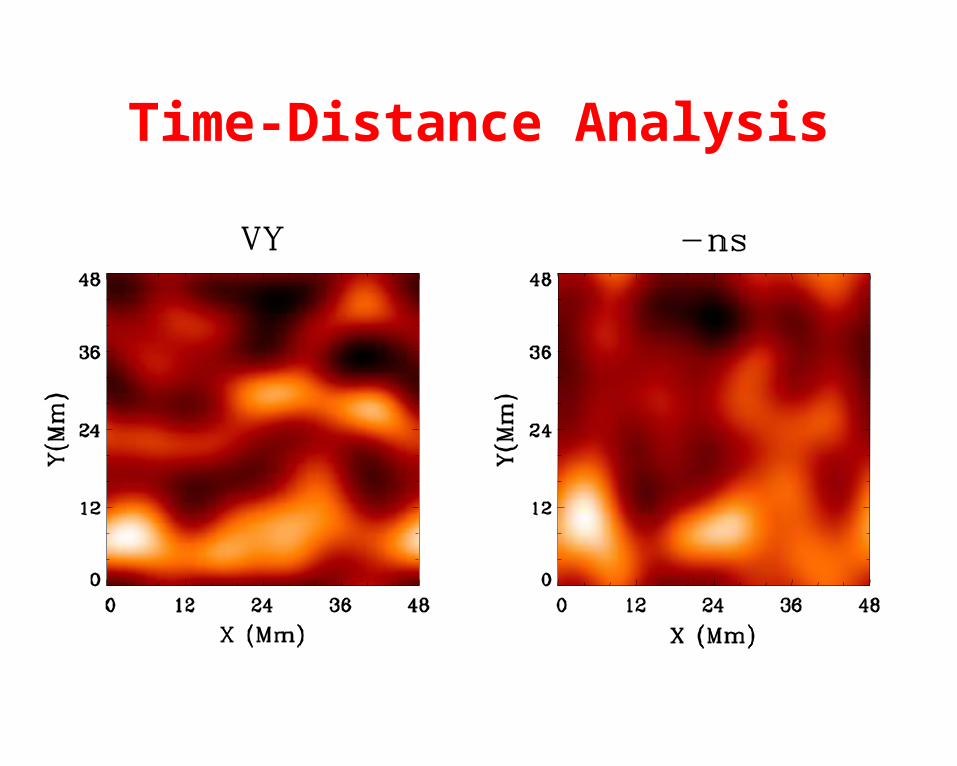
Time-Distance Analysis
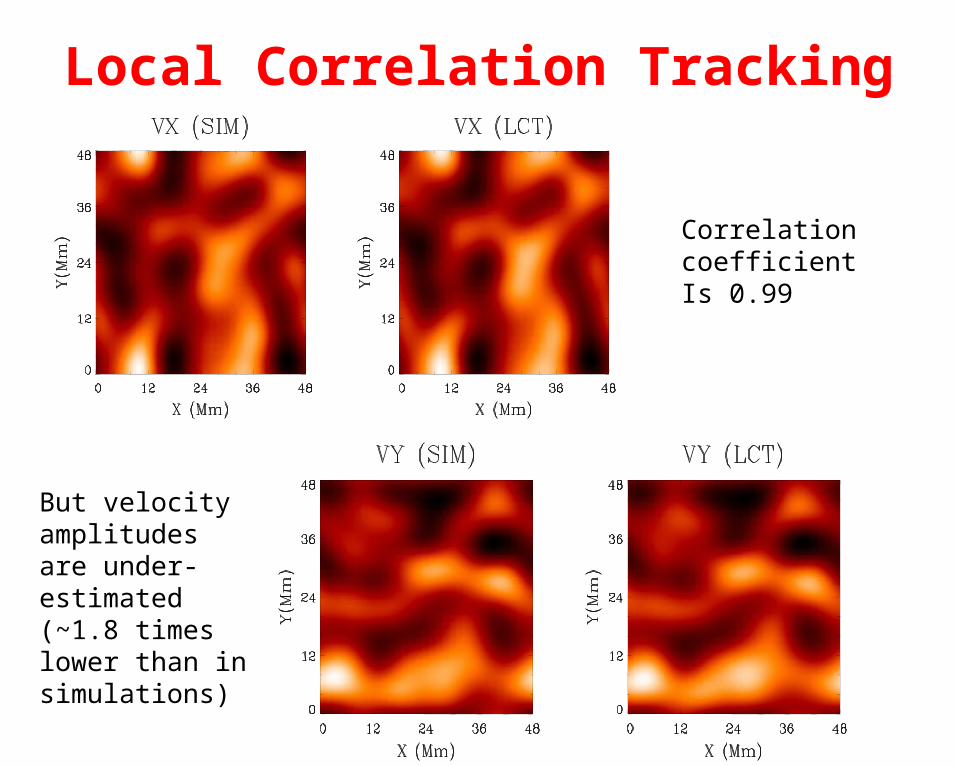
Local Correlation Tracking
CorrelationcoefficientIs 0.99
But velocityamplitudes are under-estimated(~1.8 timeslower than in simulations)
These and other results of the simulated data analysis were published in
Georgobiani, D.; Zhao, J.; Kosovichev, A.; Benson, D.; Stein, R.; Nordlund, A."Local Helioseismology and Correlation Tracking Analysis of Surface Structures in Realistic Simulations of Solar Convection"Astrophysical Journal 2007, Vol. 657, p.1157
Zhao, J.; Georgobiani, D.; Kosovichev, A.; Benson, D.; Stein, R.; Nordlund, A."Validation of Time-Distance Helioseismology by Use of Realistic Simulations of Solar Convection"Astrophysical Journal 2007, Vol. 659, p.848
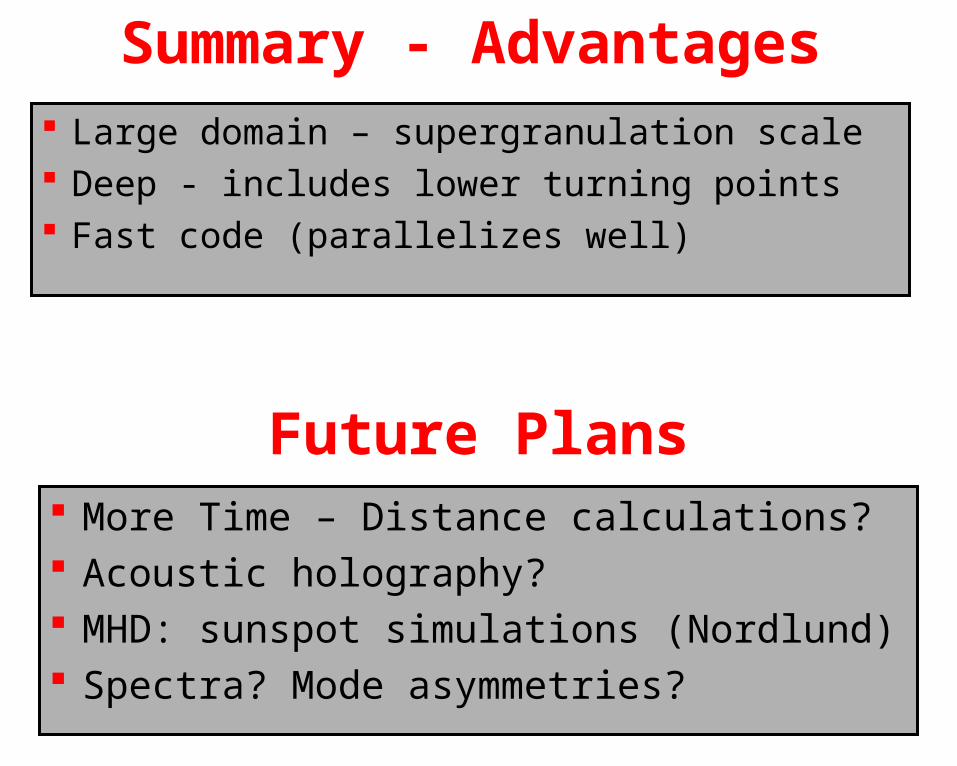
Summary - Advantages
More Time – Distance calculations? Acoustic holography? MHD: sunspot simulations (Nordlund) Spectra? Mode asymmetries?
Future Plans
Large domain – supergranulation scale Deep - includes lower turning points Fast code (parallelizes well)
Recommended