Data Center Data Center FindingsFindings
South Dakota State UniversityDemography Conference
May 2013
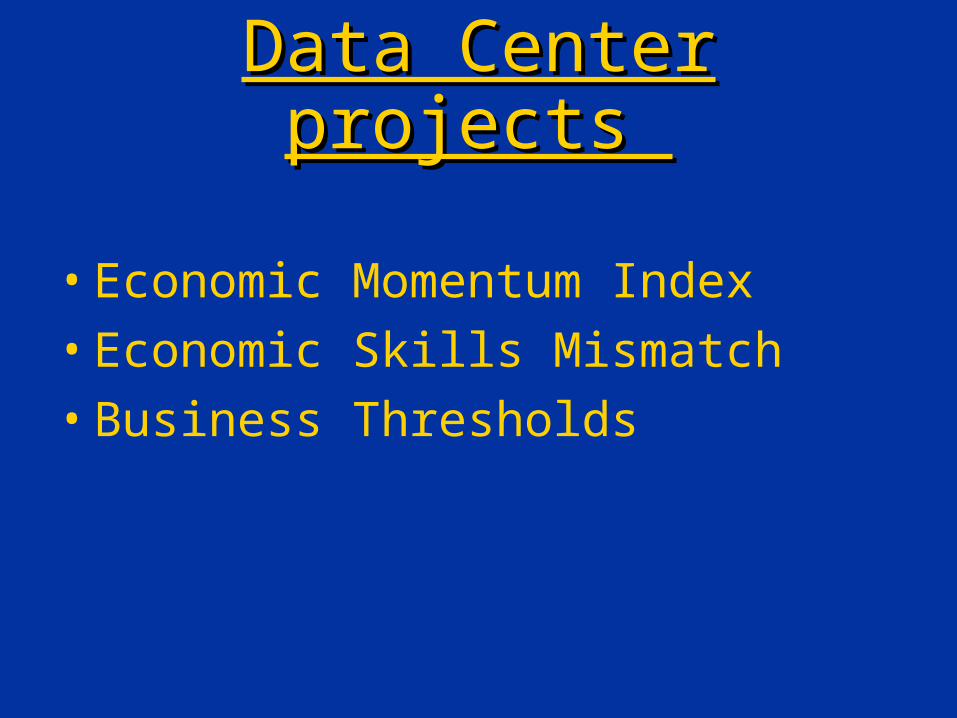
Data Center projects Data Center projects
• Economic Momentum Index• Economic Skills Mismatch• Business Thresholds
Economic Momentum Economic Momentum IndexIndex
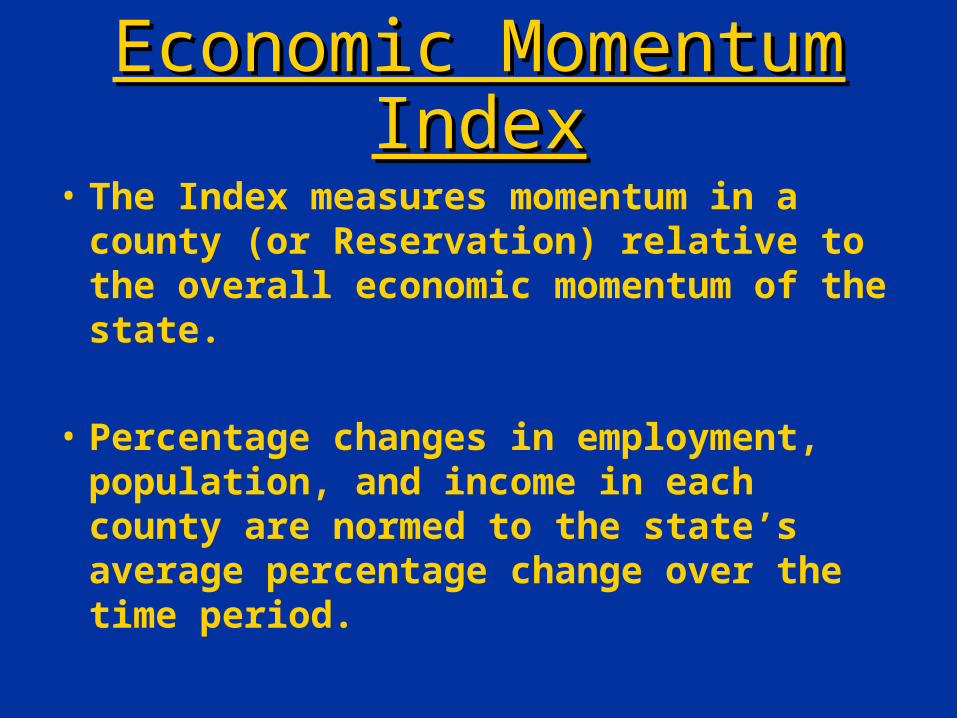
• The Index measures momentum in a county (or Reservation) relative to the overall economic momentum of the state.
• Percentage changes in employment, population, and income in each county are normed to the state’s average percentage change over the time period.
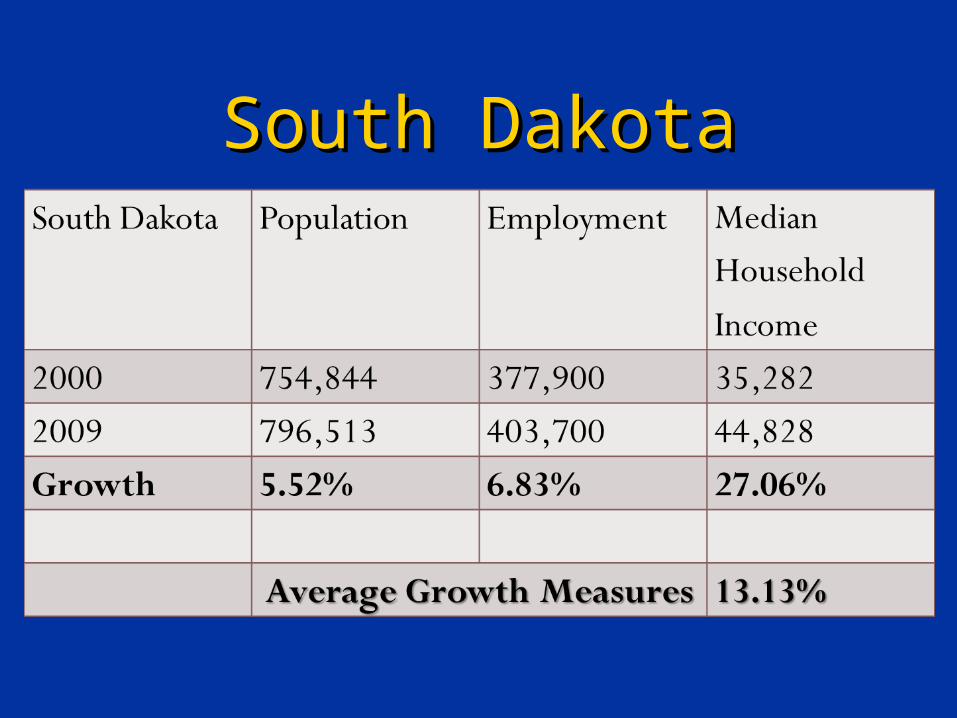
South DakotaSouth Dakota

Cheyenne River Cheyenne River ReservationReservation
(Dewey/Ziebach Counties)(Dewey/Ziebach Counties)2000 2005-2009
Total Population- 8,475
Employment – 2070
Median Household Income- 22,094
Total Population- 8,572Employment – 2490Median Household Income- 33,415
GrowthTotal Population 1.14%Employment 20.29%Median Household Income 51.24%
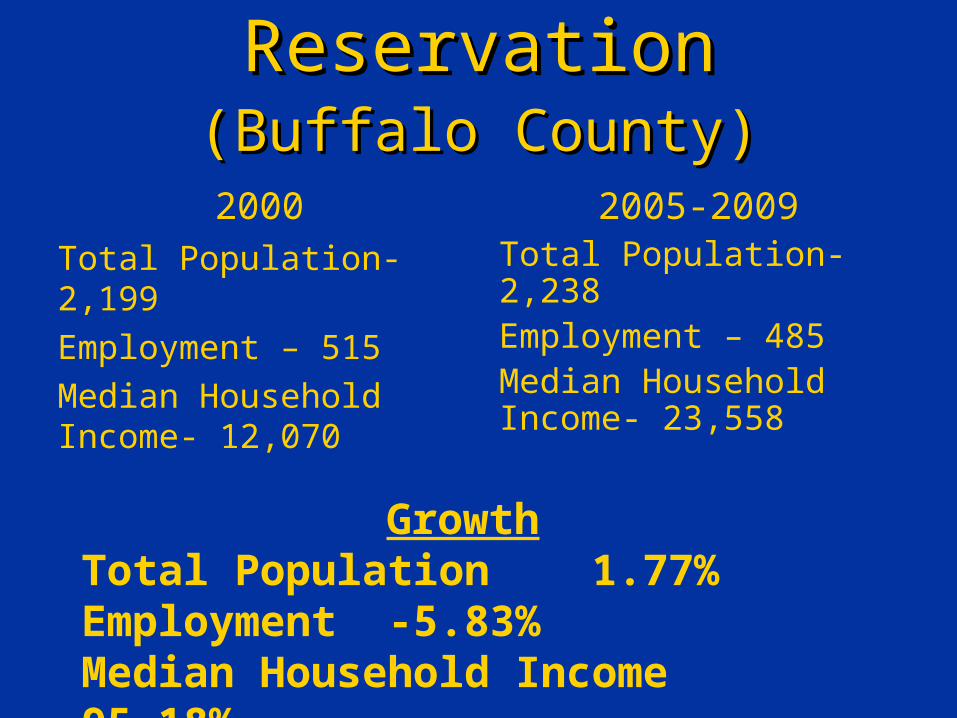
Crow Creek Crow Creek ReservationReservation
(Buffalo County)(Buffalo County)2000 2005-2009
Total Population- 2,199Employment – 515Median Household Income- 12,070
Total Population- 2,238Employment – 485Median Household Income- 23,558
GrowthTotal Population 1.77%Employment -5.83%Median Household Income 95.18%
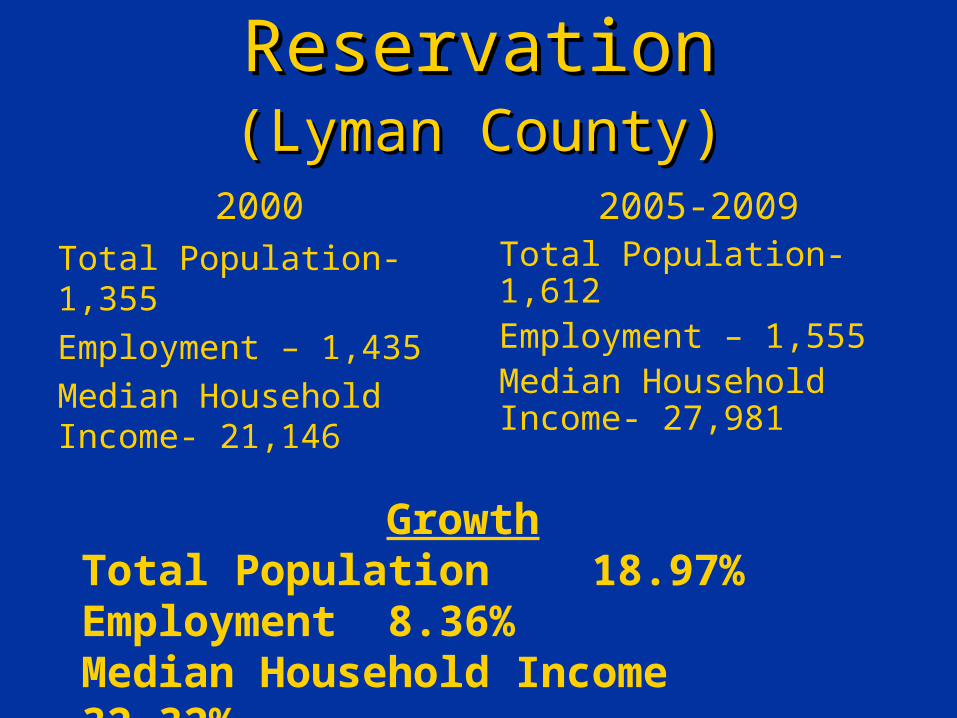
Lower Brule Lower Brule ReservationReservation
(Lyman County)(Lyman County)2000 2005-2009
Total Population- 1,355
Employment – 1,435
Median Household Income- 21,146
Total Population- 1,612Employment – 1,555Median Household Income- 27,981
GrowthTotal Population 18.97%Employment 8.36%Median Household Income 32.32%
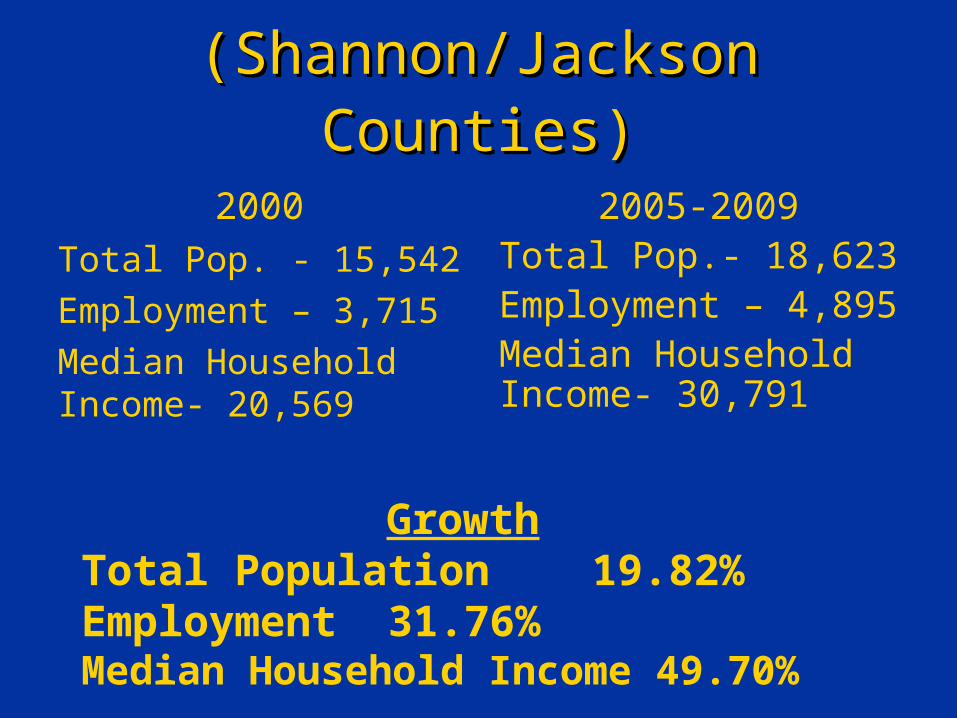
Pine Ridge Pine Ridge ReservationReservation
(Shannon/Jackson Counties)(Shannon/Jackson Counties)2000 2005-2009
Total Pop. - 15,542Employment – 3,715Median Household Income- 20,569
Total Pop.- 18,623Employment – 4,895Median Household Income- 30,791
GrowthTotal Population 19.82%Employment 31.76%Median Household Income 49.70%
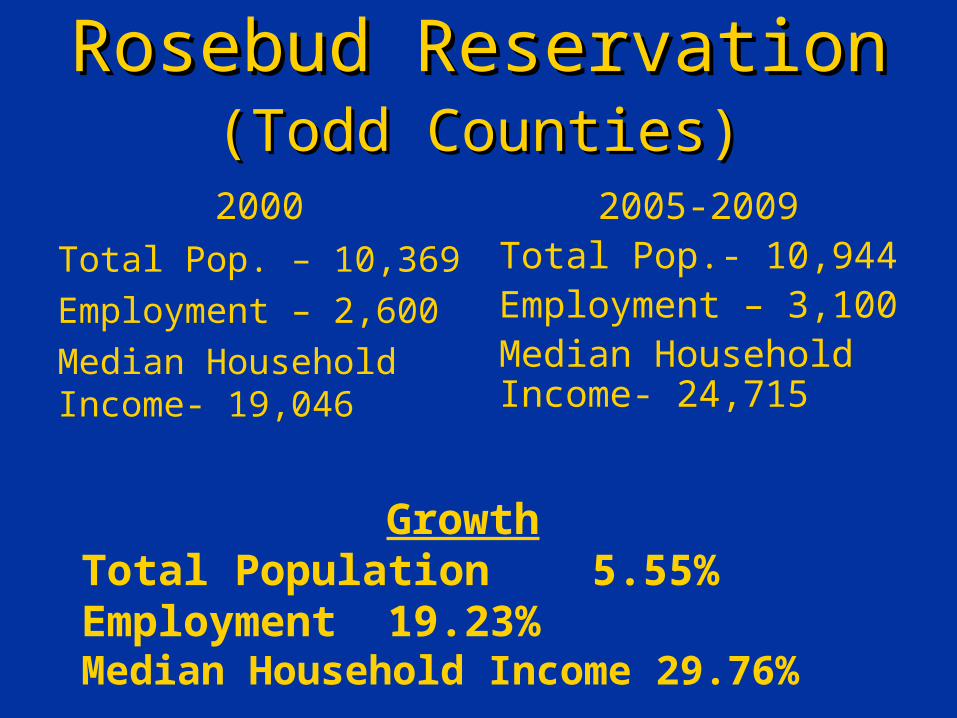
Rosebud ReservationRosebud Reservation(Todd Counties)(Todd Counties)
2000 2005-2009
Total Pop. – 10,369Employment – 2,600Median Household Income- 19,046
Total Pop.- 10,944Employment – 3,100Median Household Income- 24,715
GrowthTotal Population 5.55%Employment 19.23%Median Household Income 29.76%
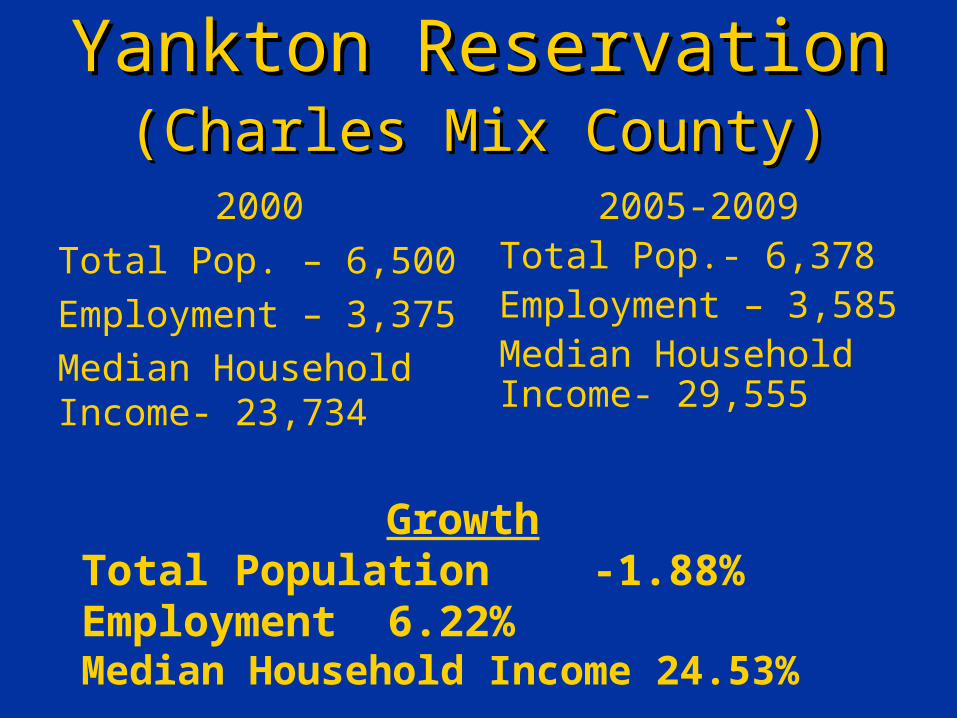
Yankton ReservationYankton Reservation(Charles Mix County)(Charles Mix County)
2000 2005-2009
Total Pop. – 6,500Employment – 3,375Median Household Income- 23,734
Total Pop.- 6,378Employment – 3,585Median Household Income- 29,555
GrowthTotal Population -1.88%Employment 6.22%Median Household Income 24.53%
The Economic Skills The Economic Skills MismatchMismatch
• The gap between the qualifications an individuals possess and skills needed by the labor market
Poor skills does not indicate poor education
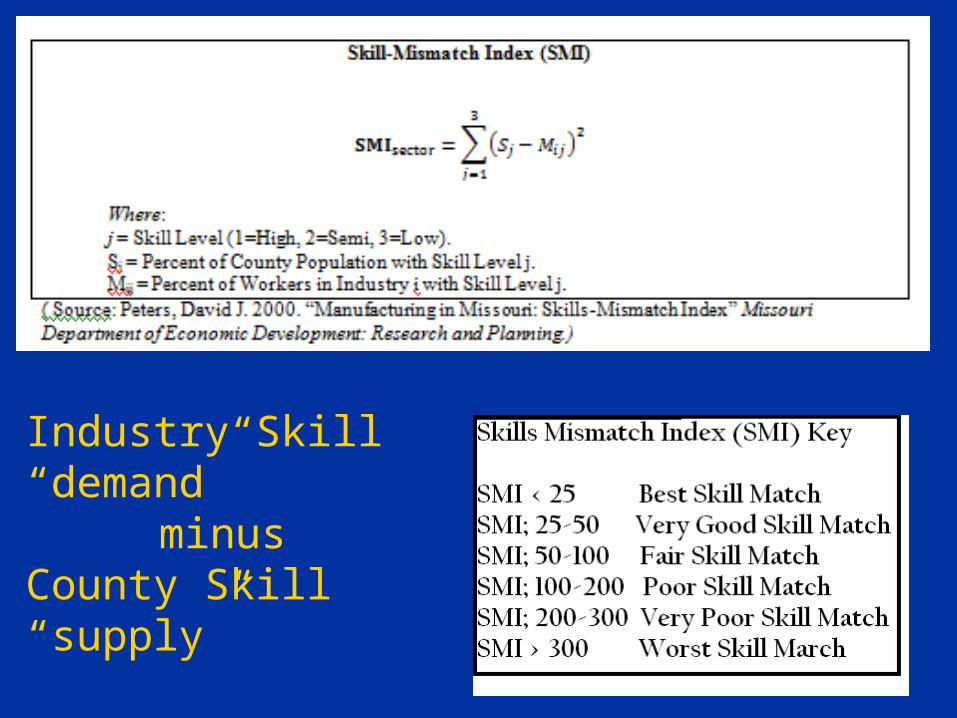
Industry Skill “demand”
minus County Skill “supply”
• Assumption: Any economic development in the Reservations is a result of federal funding. oWhile this may improve living
standards, it does not provide maintainable economic development (Addressing the symptom not the problem)
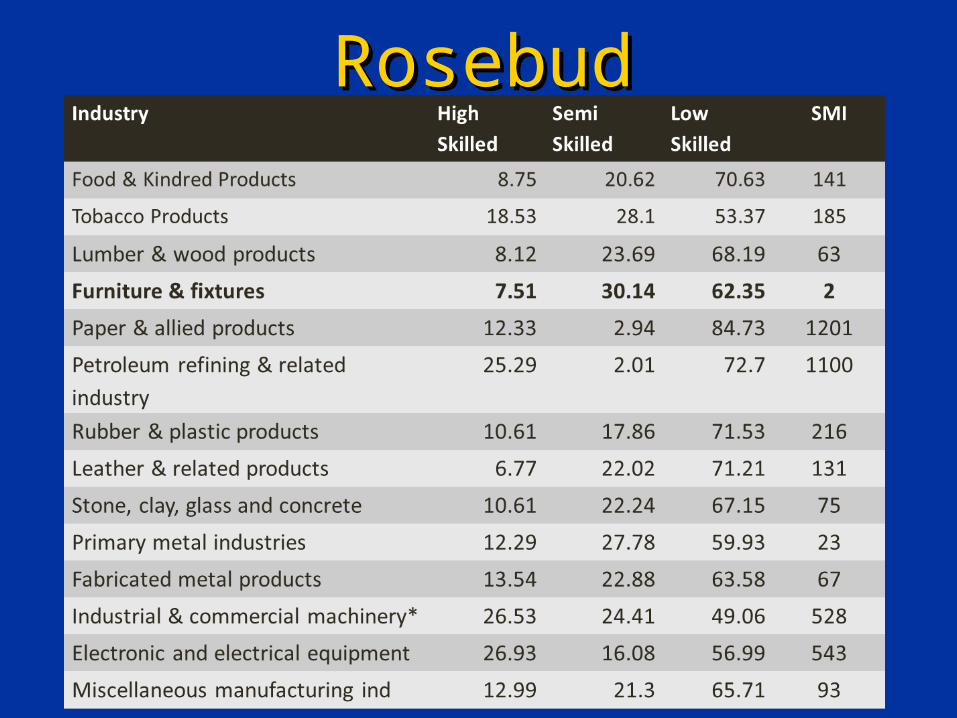
RosebudRosebud

Cheyenne RiverCheyenne RiverIndustry High
SkilledSemi Skilled
Low Skilled
SMI
Food & Kindred Products 8.75 20.62 70.63 193Tobacco Products 18.53 28.1 53.37 203Textile Mill Products 6.36 17.65 75.99 389Lumber & wood products 8.12 23.69 68.19 99Furniture & fixtures 7.51 30.14 62.35 2Paper & allied products 12.33 2.94 84.73 1353Petroleum refining & related industry
25.29 2.01 72.7 1100
Rubber & plastic products 10.61 17.86 71.53 285Leather & related products 6.77 22.02 71.21 175Stone, clay, glass and concrete
10.61 22.24 67.15 120
Primary metal industries 12.29 27.78 59.93 39Fabricated metal products 13.54 22.88 63.58 111Industrial & commercial machinery
26.53 24.41 49.06 572
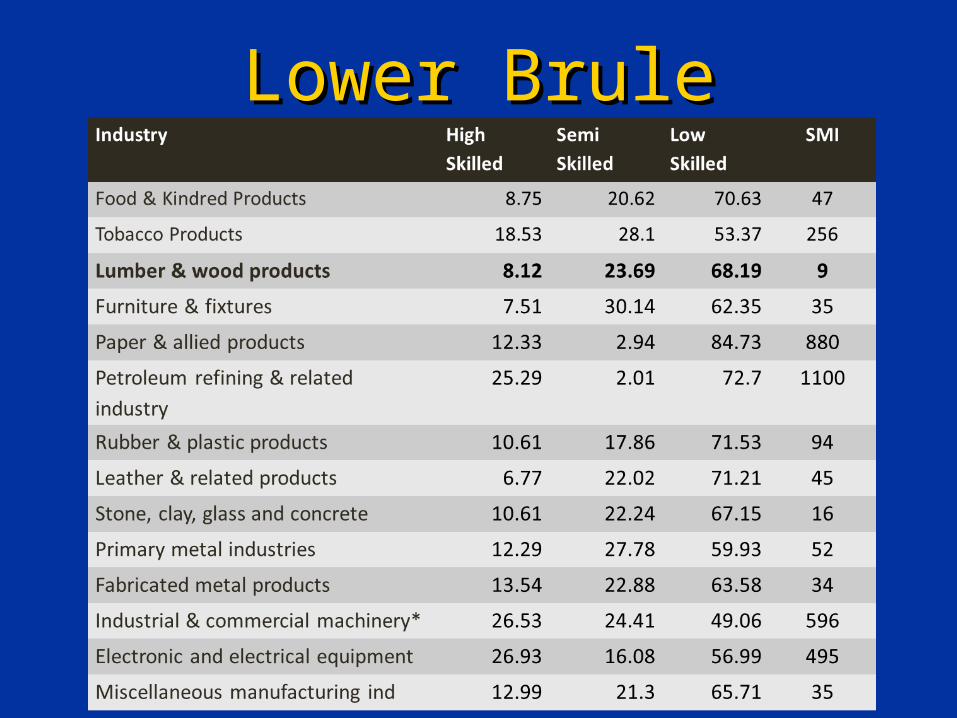
Lower BruleLower Brule
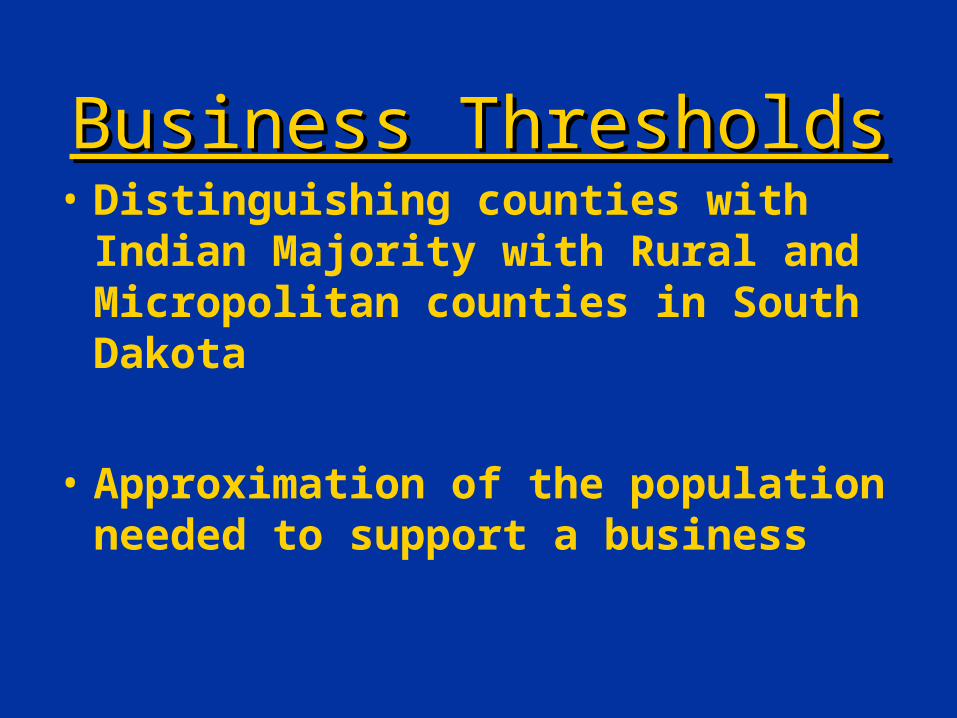
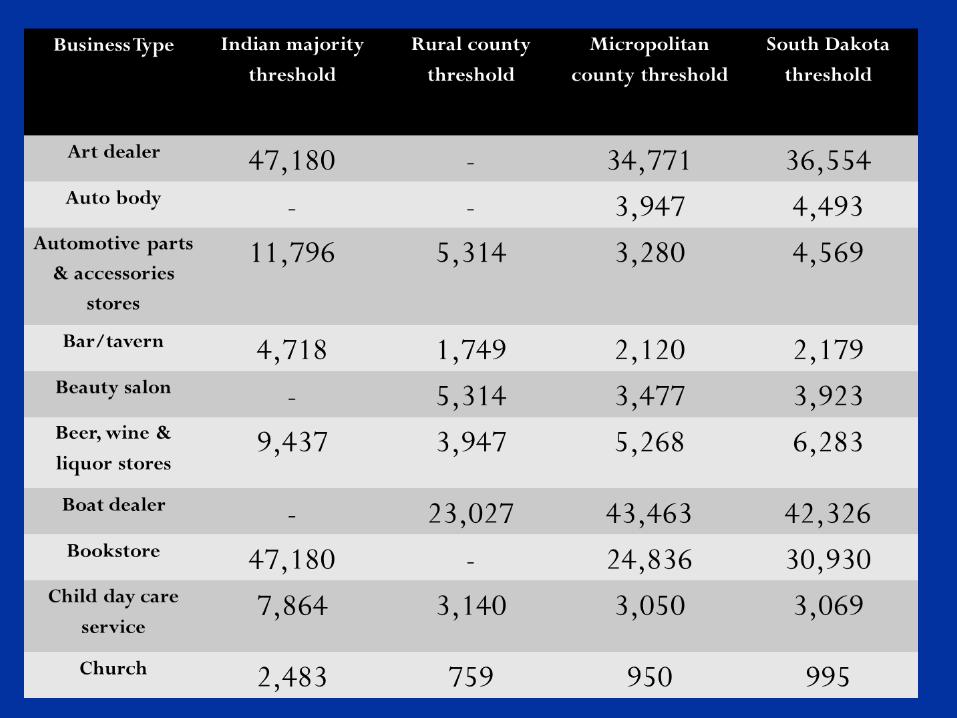
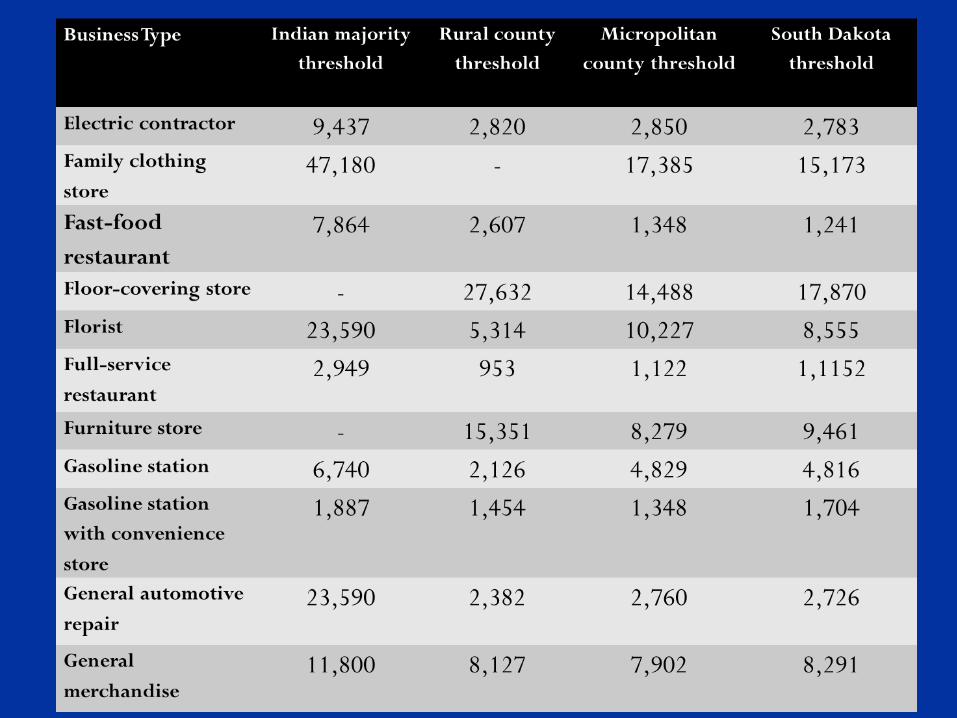
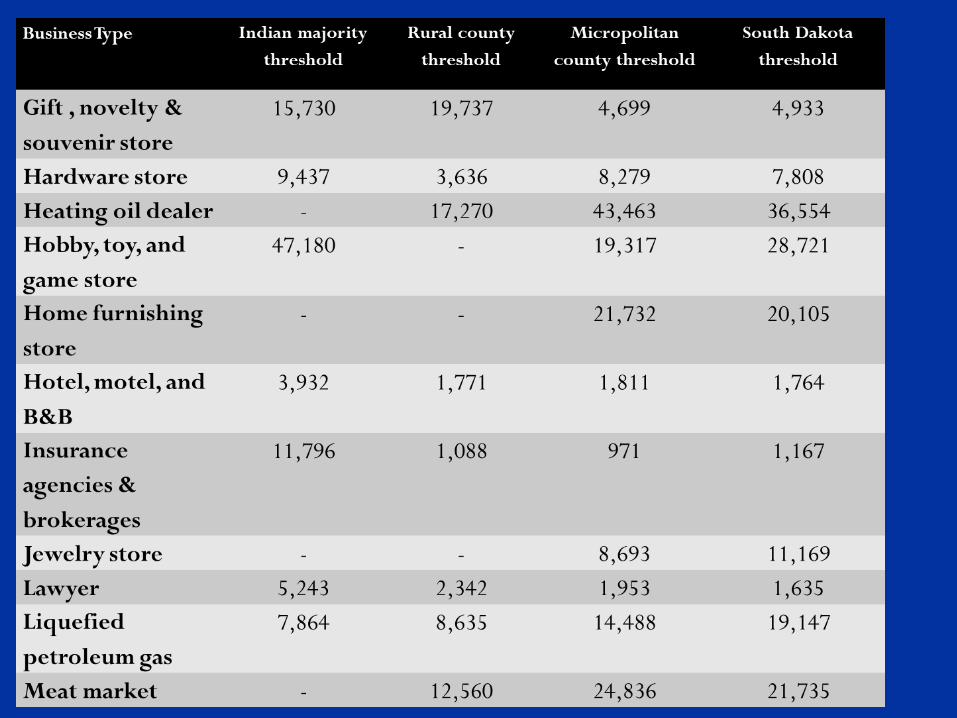
Business ThresholdsBusiness Thresholds• Distinguishing counties with
Indian Majority with Rural and Micropolitan counties in South Dakota
• Approximation of the population needed to support a business
Thank you!
Mary KillsahundredSouth Dakota State UniversityRural Life and Data Center
Recommended