Data Analysis for Scientific Research
BAE 815
Dr. Zifei Liu
2
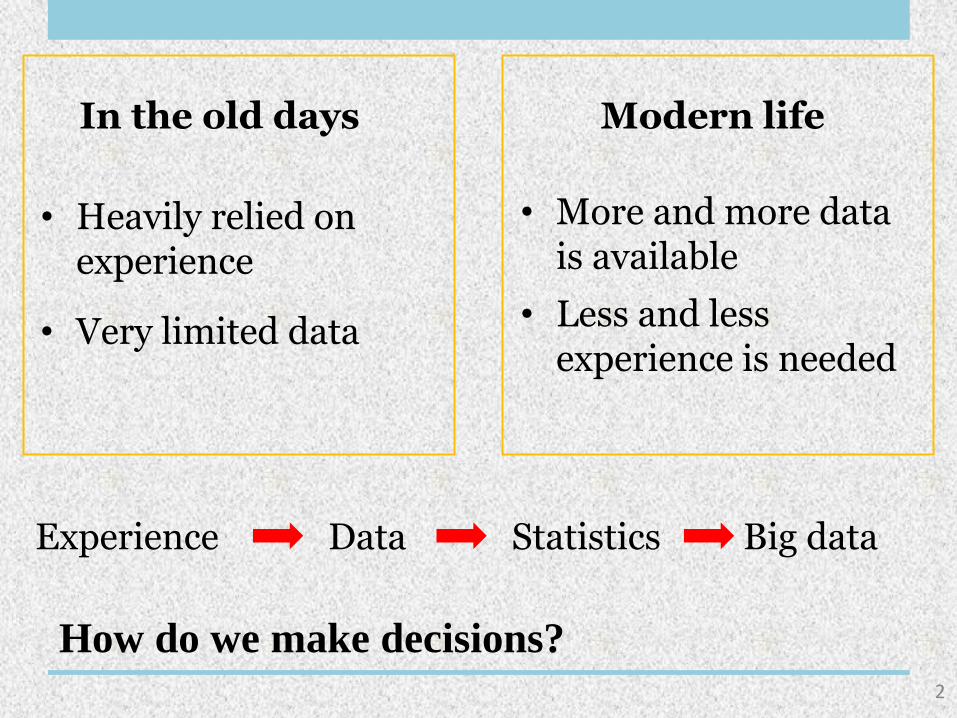
In the old days Modern life
• Very limited data
• More and more data is available
How do we make decisions?
• Heavily relied on experience
• Less and less experience is needed
Experience Data Statistics Big data
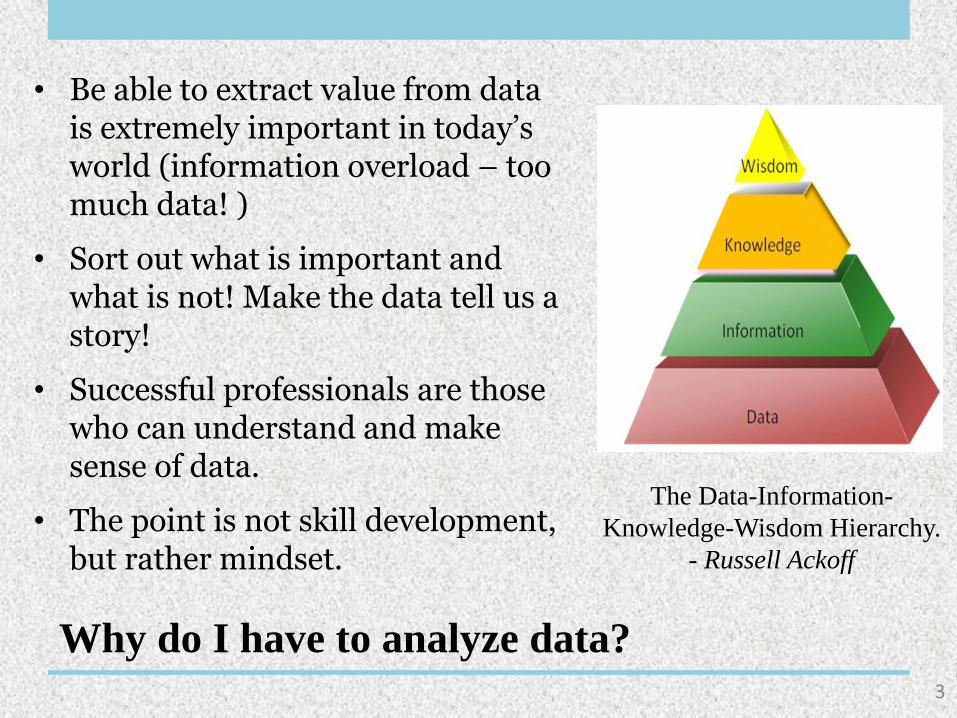
• Be able to extract value from data is extremely important in today’s world (information overload – too much data! )
• Sort out what is important and what is not! Make the data tell us a story!
• Successful professionals are those who can understand and make sense of data.
• The point is not skill development, but rather mindset.
Why do I have to analyze data?3
The Data-Information-
Knowledge-Wisdom Hierarchy.
- Russell Ackoff
4
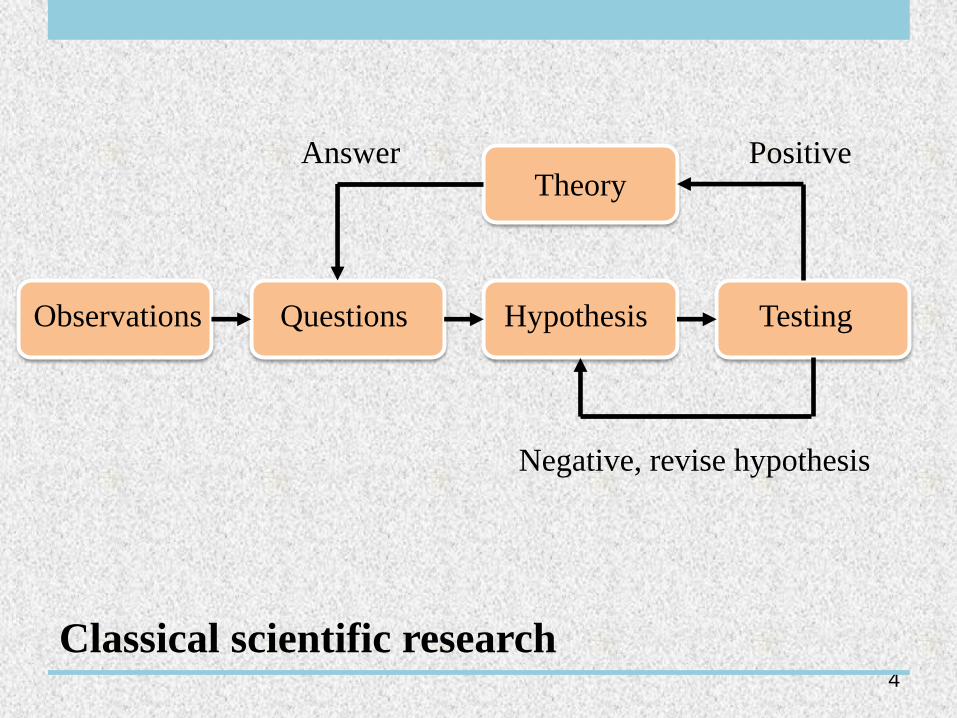
QuestionsObservations Hypothesis Testing
Theory
Negative, revise hypothesis
PositiveAnswer
Classical scientific research
• Very likely, your research will involve data collection and analysis in order to test your hypothesis.
• Data is a universal language allowing scientists to work together no matter where they are and when do they live.
• Without careful data analysis to back up your conclusions, the results of your scientific research won't be taken seriously by other scientists.
Why do I have to analyze data?5
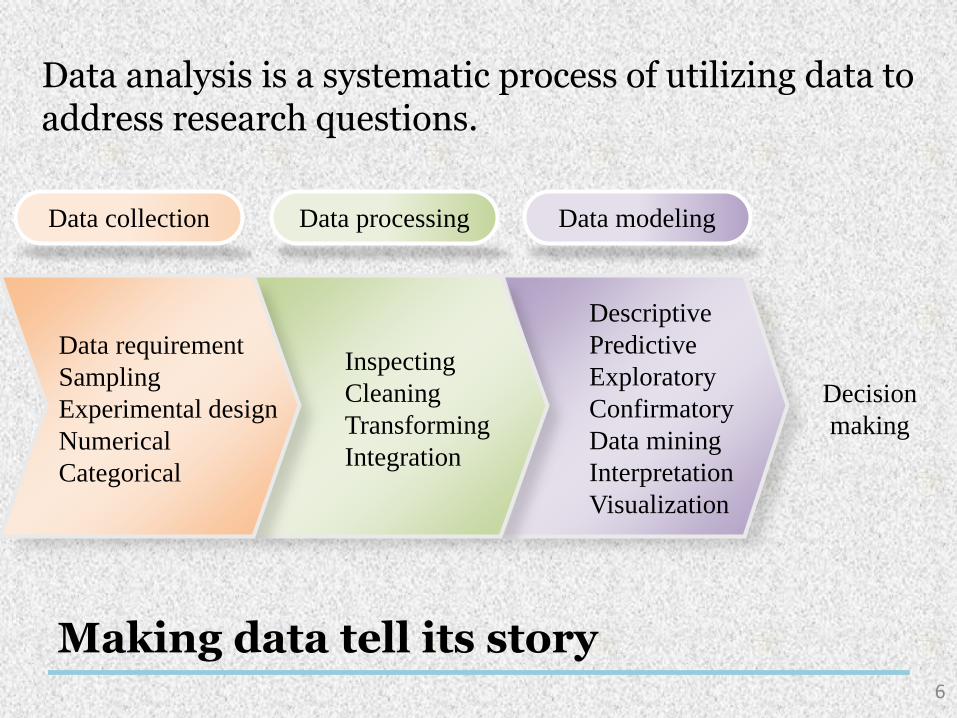
Data analysis is a systematic process of utilizing data to address research questions.
6
Decision
making
Data collection Data processing Data modeling
Data requirement
Sampling
Experimental design
Numerical
Categorical
Inspecting
Cleaning
Transforming
Integration
Descriptive
Predictive
Exploratory
Confirmatory
Data mining
Interpretation
Visualization
Making data tell its story
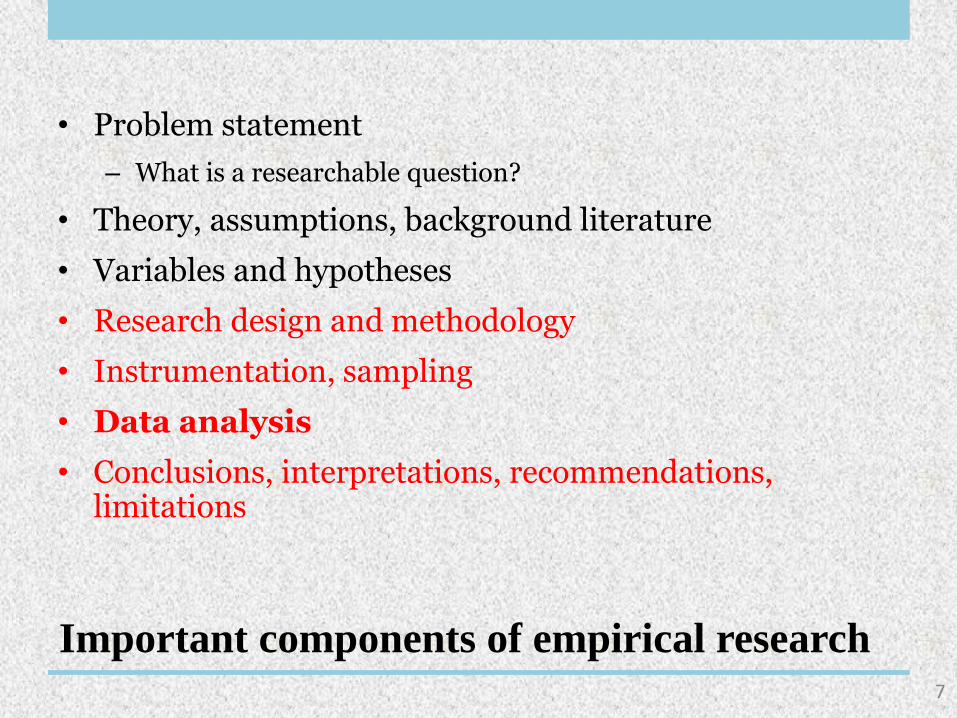
• Problem statement
– What is a researchable question?
• Theory, assumptions, background literature
• Variables and hypotheses
• Research design and methodology
• Instrumentation, sampling
• Data analysis
• Conclusions, interpretations, recommendations, limitations
Important components of empirical research7
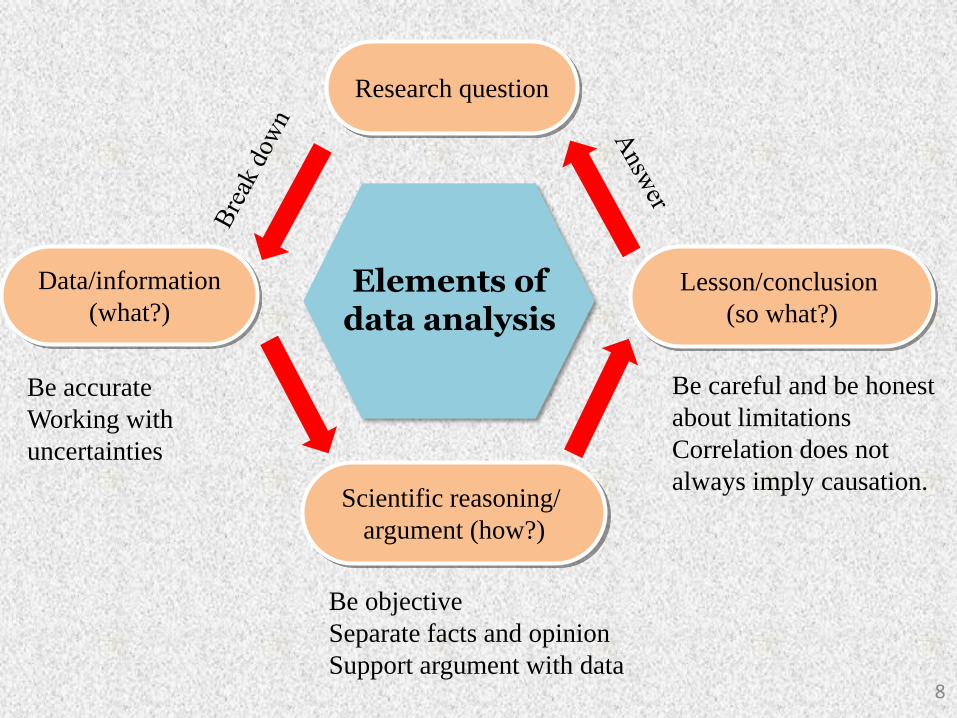
Elements of data analysis
Research question
Data/information
(what?)
Scientific reasoning/
argument (how?)
Lesson/conclusion
(so what?)
Be accurate
Working with
uncertainties
Be objective
Separate facts and opinion
Support argument with data
Be careful and be honest
about limitations
Correlation does not
always imply causation.
8
The goal is to obtain usable and useful information.
• To identify and understand patterns in data
• To identify relationships between variables
• To compare variables and identify the difference between variables
• To explain cause-and-effect phenomena
• To forecast outcomes
Goal of data analysis9
• Data requirements
– Forms of data: text, numbers, images, audio, video.
– Scales of data: nominal, ordinal, numerical.
– Quantitative, qualitative, or mixed?
• Scope of study: case or sample?
– What is your population of interest? How do you want to generalize your results?
– How many data points do we need? Do they represent all the population we want to study?
Before you collect your data10
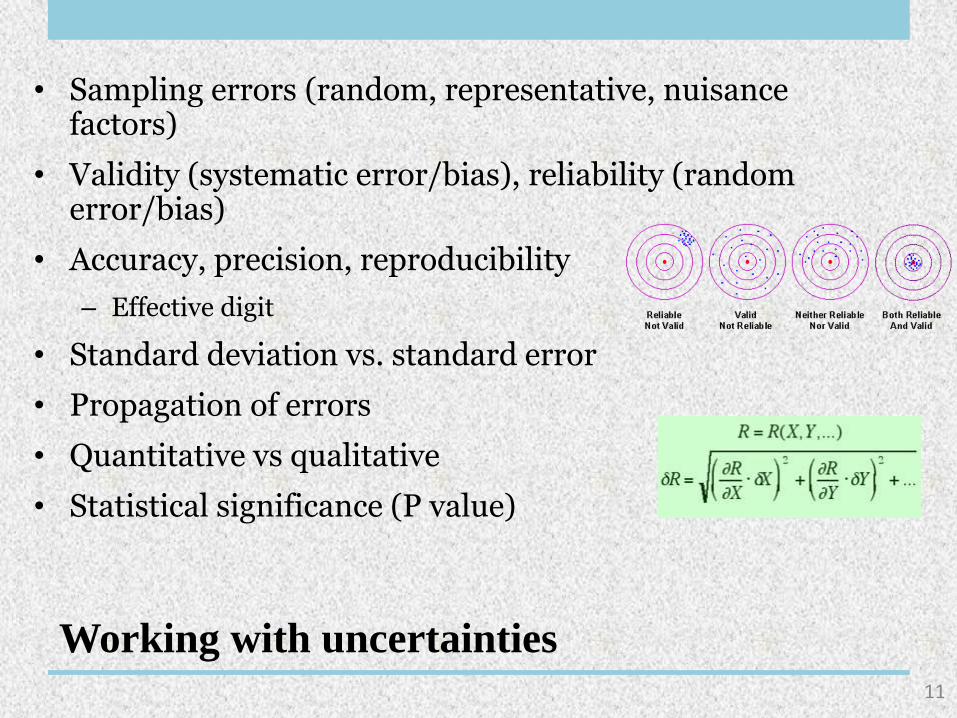
• Sampling errors (random, representative, nuisance factors)
• Validity (systematic error/bias), reliability (random error/bias)
• Accuracy, precision, reproducibility
– Effective digit
• Standard deviation vs. standard error
• Propagation of errors
• Quantitative vs qualitative
• Statistical significance (P value)
Working with uncertainties11
• Data collection is the most important step. If the collected data is wrong, analyses and conclusions can not be right!
• Mode of enquiry: observational or interventionist?
– Observational: The aim is to gather data or information about the world as it is. You hope the act of studying doesn't substantially modify the thing you are interested in. Qualitative methods are often required.
– Interventionist : You do something and see what happens. You gather data or information before and after the intervention, then look for changes, or effects of the treatment on the subject.
Data collection12
• Check for completeness and accuracy of data, handle missing values, undetected values, duplicates, outliers, and correct errors
• Code, clean
• Initial data analysis: check and question the assumptions required for the following data analysis and hypothesis testing.– Linearity– Normality– Symmetry– Effect of uncommon observation
• Make transformations of variables as needed.
Data processing13
• Descriptive: How can the data be summarized?
• Exploratory/Inferential: focuses on discovering new features in the data and suggest new hypotheses. How can we draw inferences from the data?
• Confirmatory: focuses on confirming or falsifying existing hypotheses.
• Predictive: How can we build predictive models using the data available?
Levels of data analysis 14
Test of hypotheses15
• A hypothesis makes a prediction of the expected outcome in a given situation
• Probability of research– Nothing is certain – Scientific “truth” is usually a statement of what is
most probable given the currently known data
• Statistical techniques help us show to which extent our data do support the hypothesis
• Statement 1: A is a human being. B is a gorilla. Between and A and B are many similarities, but A has many superior attributes when compared with B.
• Statement 2: The similarities show that both A and B had a common origin. The superiorities suggest that A evolved from B over millions of years.
• Statement 3: The similarities show that both A and B had a common origin: the creator God. The superior attributes of A show that God chose to create human beings in His own image, and this was not the case with the creation of animals.
Data and interpretation: Knowing the difference16
Credit: Elaine Kennedy
• Data are usually regarded as facts, and are used as a basis for reasoning, discussion, or calculation.
• As technology and science progress, “facts” will be discarded, modified, or replaced with new data
• Numbers do not speak for themselves.
• Interpretation demands fair and careful judgments. Often the same data can be interpreted in different ways. So it is helpful to involve others or take time to hear how different people interpret the same information.
• Much of the controversy that exists in the scientific literature is generated by a common problem: interpretations drawn from limited databases.
Data interpretation17
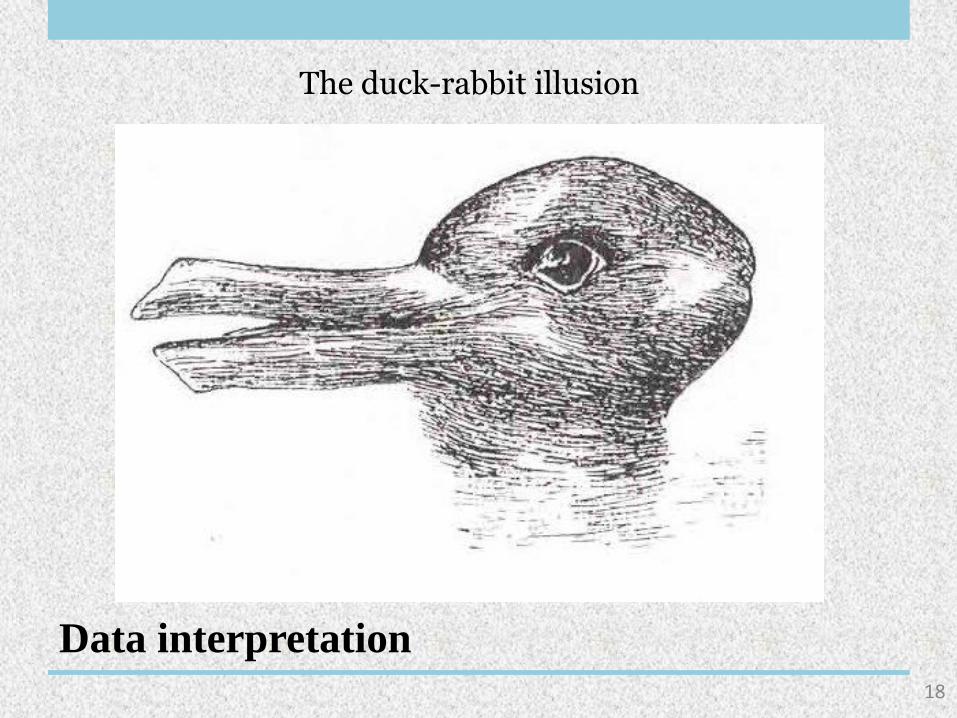
The duck-rabbit illusion
Data interpretation18
• Justifying the methodology; citing agreement with previous studies
• Offer an interpretation/explanation of the results
• Discussing limitations, pointing out discrepancies
• Commenting on the data; state the implications and recommend further research
The results section of your paper/presentation19
There is some merit in indicating what you did not find, or what surprised you.
• Demonstrate your integrity and professionalism
• Chance to get useful feedback
• How to report results?
– Tables, graphs, drawing, flow charts, photographs, multimedia presentations …
• Think in terms of harmony, rhythm, flow, balance, and focus.
• Think creatively to combine these elements together to convey the essential conclusions to the audience effectively.
Presentation and visualization of results20
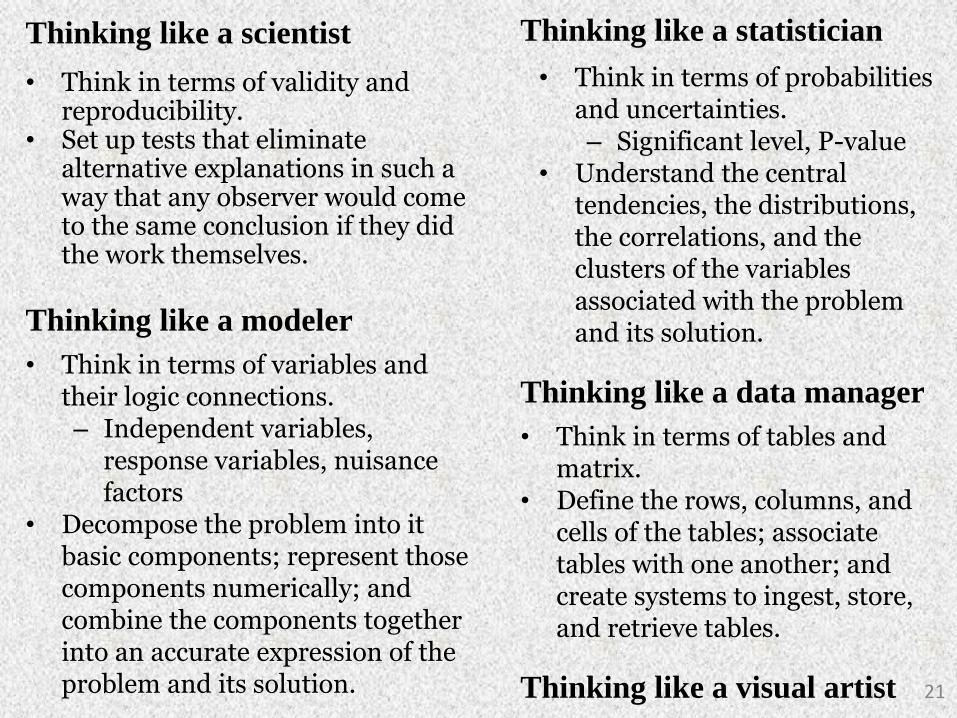
• Think in terms of validity and reproducibility.
• Set up tests that eliminate alternative explanations in such a way that any observer would come to the same conclusion if they did the work themselves.
Thinking like a scientist
21
Thinking like a statistician
• Think in terms of probabilities and uncertainties.– Significant level, P-value
• Understand the central tendencies, the distributions, the correlations, and the clusters of the variables associated with the problem and its solution.Thinking like a modeler
• Think in terms of variables and their logic connections. – Independent variables,
response variables, nuisance factors
• Decompose the problem into it basic components; represent those components numerically; and combine the components together into an accurate expression of the problem and its solution.
Thinking like a data manager
• Think in terms of tables and matrix.
• Define the rows, columns, and cells of the tables; associate tables with one another; and create systems to ingest, store, and retrieve tables.
Thinking like a visual artist
• Understand the basics first - start from basic data analysis textbooks. General reading should never stop.
• Courses related to data analysis
• Read research papers.
– What sort of research is typically conducted in your discipline and how are studies designed
– What are the procedures, techniques, software and tools commonly used in your field
– To learn how to be scientific in your field
What should you be reading?22
• “It is commonly believed that anyone who tabulates numbers is a statistician. This is like believing that anyone who owns a scalpel is a surgeon.” - R. Hooke
• “Torture numbers, and they'll confess to anything.” -Gregg Easterbrook
• How to lie with statistics? - Darrell Huff, 1954
– A most widely read statistics book
23
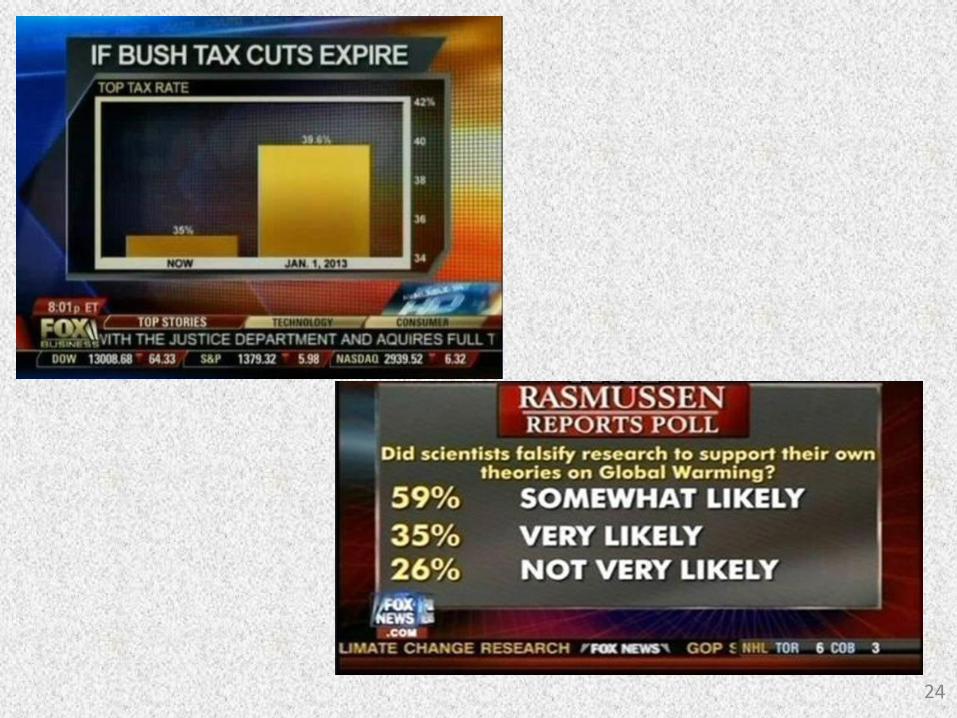
How NOT to lie with statistics:
Avoiding common mistakes
24
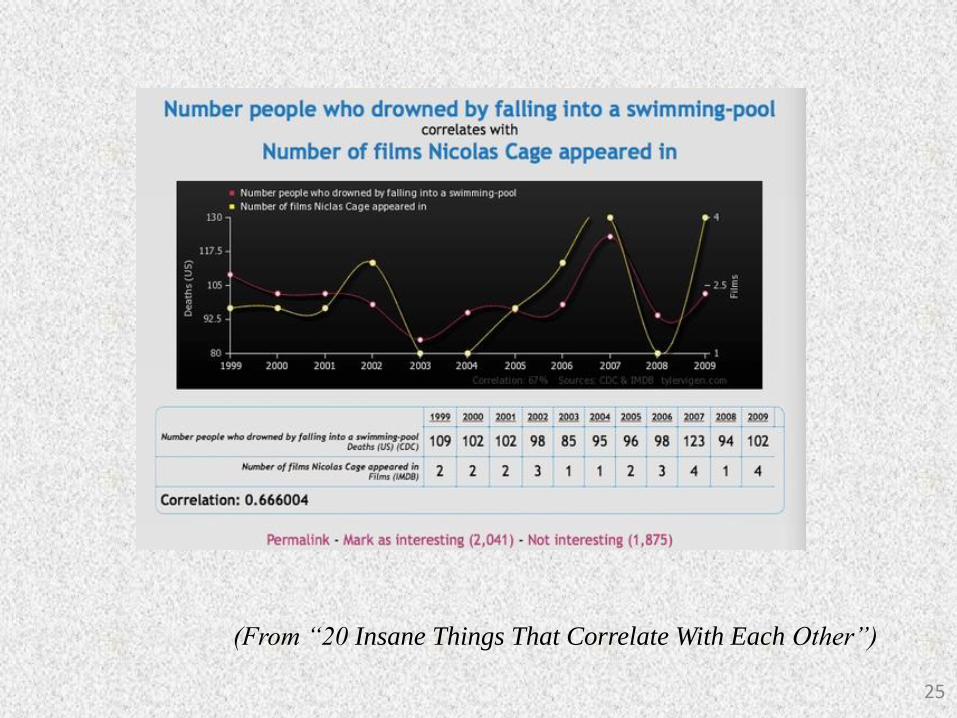
25
(From “20 Insane Things That Correlate With Each Other”)
• Old friend: MS Excel
• Abaqus
• Ansys
• LAMMPS
• Matlab
• Mathematica
• LabView
• SAS, SPSS
• R is available free over internet
• Many more!
Tools for data analysis26
27
Final word
• Every researcher is going to require data analysis skills at some point or the other.
• Understand the assumptions and capabilities (and limitations) of different methods or techniques, select the right one and use them carefully.
• Be very careful when you want to extrapolate results and conclusions.
28
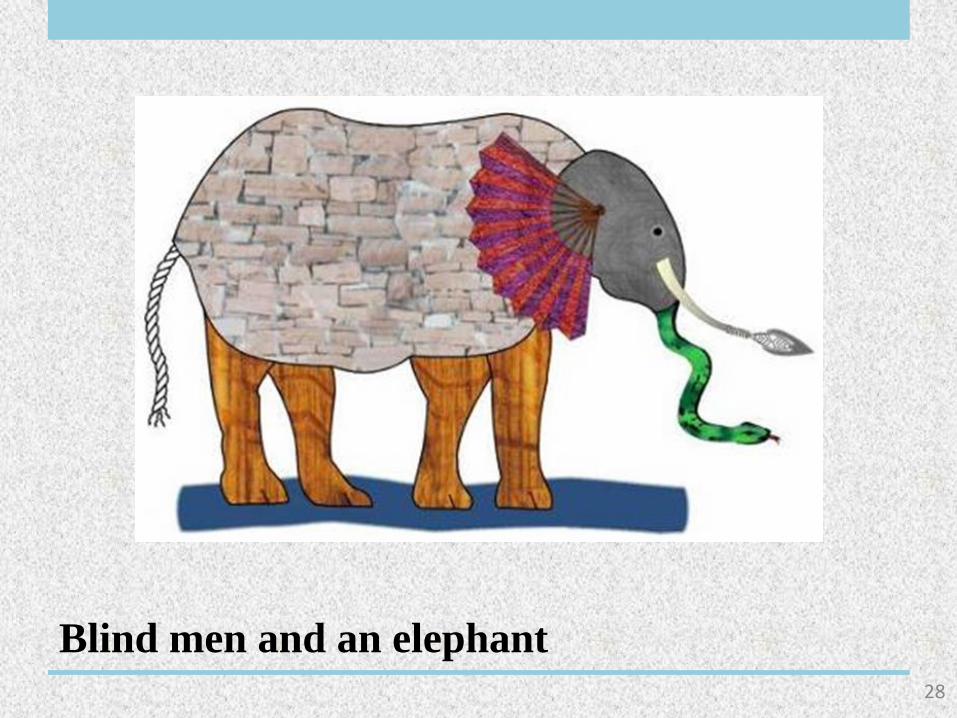
Blind men and an elephant
29
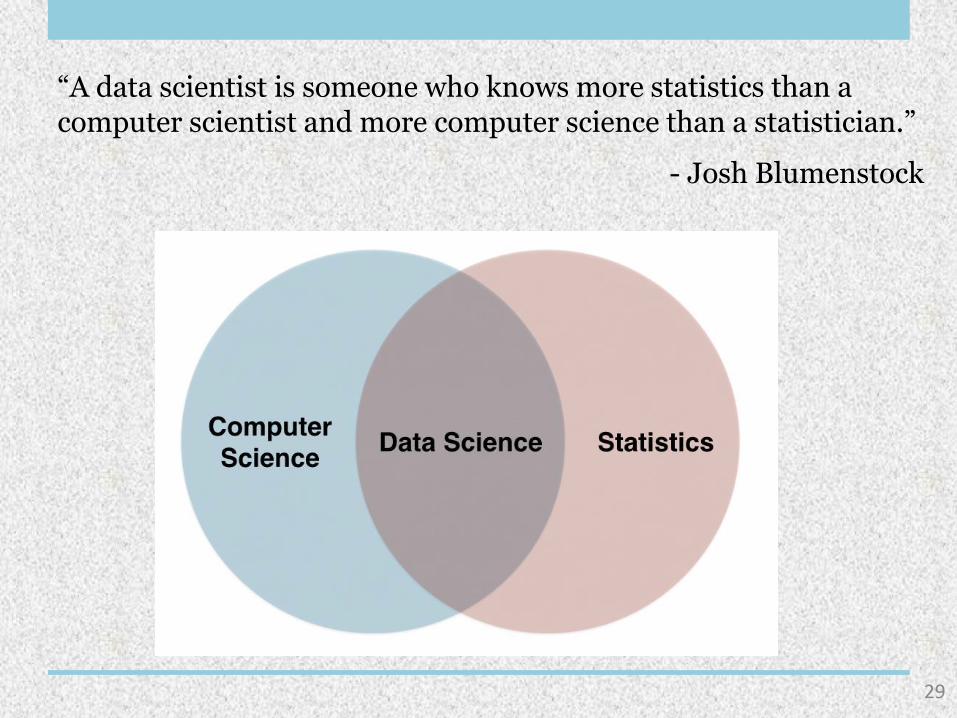
“A data scientist is someone who knows more statistics than a computer scientist and more computer science than a statistician.”
- Josh Blumenstock
Recommended