Curriculum Based Budgeting
Data Driven Programsand Instruction
Board WorkshopOctober 10, 2006

Focus for Work Session
• Report to the Board on the number one priority: Increasing student achievement
• Demonstrate how accountability for student achievement affects the classroom, the school, and the district.
• Challenge the district to be accountable for using resources effectively to meet the needs of students.

Curriculum Based Budgeting
• The district’s first priority is a high quality learning environment for all students.
• The expenditure of resources should be held accountable to support the goal.
• Resources used to support learning must be held accountable for results.
• All programs must be subject to a cost/benefit analysis to continue.

The Model
• Clear identification of student needs
• Identification of measurable results for the use of resources
• Planning and budgeting to meet those needs
• Implementation of programs and process to meet the needs
• Assessment and accountability

Data-Driven Decision Making
Needs of students district-wide identified; resources applied
Needs of students school-wide identified; Programs devised
Student needs identified; Met at the classroom level

Data Driven Instruction
Maple Elementary School
Mr. Amarasekara, Fourth Grade

OARS IN THE OARS IN THE CLASSROOMCLASSROOM

Beginning of the Year Beginning of the Year Data evaluationData evaluation Third grade dataThird grade data Identify target students using CST Identify target students using CST
scale scores scale scores STAR reportSTAR report
– 2005-2006 previous year’s data2005-2006 previous year’s data– (3(3rdrd grade) grade)– Measure – CST scale score Measure – CST scale score

Intervention with Intervention with Target Target studentsstudents Identify specific strengths and weaknessesIdentify specific strengths and weaknesses Using 3Using 3rdrd grade grade District AssessmentsDistrict Assessments Isolate target studentsIsolate target students
– Challenge, Benchmark, Strategic and Intensive Challenge, Benchmark, Strategic and Intensive
Item analysisItem analysis– Analyze fluency, vocabulary, and writingAnalyze fluency, vocabulary, and writing– View standards and responses*View standards and responses*

Group Students for Group Students for Remediation/EnrichmentRemediation/Enrichment
IWT (Independent Work Time)IWT (Independent Work Time) Reading groups Reading groups Listening and RespondingListening and Responding Computer-Study IslandComputer-Study Island

Using Results of District Using Results of District AssessmentsAssessments Evaluate specific dataEvaluate specific data Reading, vocabulary and language skillsReading, vocabulary and language skills View responses entire classView responses entire class
– Item analysisItem analysis– View responsesView responses– View standardsView standards
Compare with the Compare with the CST blueprintsCST blueprints– How students performed in each strands How students performed in each strands

Classroom InstructionClassroom Instruction
Modify instruction according to specific Modify instruction according to specific strengths and weaknesses of the studentsstrengths and weaknesses of the students– Ex: give specific and elaborate instruction on Ex: give specific and elaborate instruction on
word origins, synonyms, antonyms and idiomsword origins, synonyms, antonyms and idioms– Have independent work for students to Have independent work for students to
practicepractice– Change homework activities to fit the needChange homework activities to fit the need
Regroup students according to new scorinRegroup students according to new scoring data during IWT timeg data during IWT time
Tutoring according to strengths and Tutoring according to strengths and weaknesses of the studentsweaknesses of the students

How the Classroom is How the Classroom is Organized during IWT Organized during IWT timetimeScholastic ReadingScholastic ReadingBlending Blending ListeningListeningWord reading Word reading Below basicBelow basic
Read NaturallyRead NaturallyComprehensionComprehensionFluencyFluencyListening Listening Answering Answering questionsquestionsBasic/Below Basic/Below BasicBasic
Open Court Open Court interventioninterventionStudents with Students with teacherteacherBasic/Below Basic/Below Basic Basic
Literature Literature ResponseResponseOpen Court Open Court lessonslessonsBasicBasic
Computer Computer Study islandStudy islandBasicBasic
Literature CircleLiterature CircleProficientProficientAdvance-depth Advance-depth and complexityand complexity

Site Curriculum Based Budgeting
Poplar Elementary
Mr. Alejandro Alvarez, Principal

POPLAR ELEMENTARY POPLAR ELEMENTARY SCHOOLSCHOOL
POPLAR ELEMENTARY POPLAR ELEMENTARY SCHOOLSCHOOL
DEVELOPING AND DEVELOPING AND IMPLEMENTING SPSA IMPLEMENTING SPSA
STRATEGIESSTRATEGIES

IDENTIFYING AREAS FOR GROWTH
• Student Achievement in Language Arts– 33.1% At or Above Proficient School wide– 33.6% At or Above Proficient Hispanic– 28.8% At or Above Proficient SED– 28.4% At or Above Proficient ELL’s
• NCLB Goal 24.4% School Wide and all Significant Sub-Groups for 06-07

IDENTIFYING AREAS FOR GROWTH Cont…
• Attendance– 96.71% Attendance Average for 05-
06– 97.00% State Attendance Average

ESTABLISHING NEW GOALS
• GOAL 1.1
– Meet all 2005/06 AYP goals including percent proficient AMO's 24.4% English Language Arts proficiency and 26.5% Mathematics.
• GOAL 1.2
– Increase attendance rate to 97.00%

ATTENDANCE GOAL
• GOAL 1.2
– Increase attendance rate to 97.00%

DETERMINE EFFECTIVENESS OF PRIOR STRATEGIES
• Attendance Strategy 1.2.3 – Provide awards and incentives for attendance
including, but not limited to:• Grade level trophies • Perfect Attendance K-5 (all 6 years) trophies• Weekly attendance tags w/necklace• Monthly pizza parties• Monthly popsicle parties• Monthly perfect attendance incentive prizes,
such as, scooters, video now players, bicycles, etc.

ESTABLISH NEW STRATEGY
• Attendance Strategy 1.2.3– Provide awards and incentives for
attendance including, but not limited to:• Grade level trophies • Perfect Attendance K-5 (all 6 years)
trophies• Monthly attendance tags w/necklace• Monthly pizza parties (Teacher Choice)• Monthly popsicle parties

ESTABLISH NEW STRATEGY Cont…
• Attendance Strategy 1.2.4– Provide temporary transportation to
and/or from school when needed for students who have missed the bus or are having transportation issues.

IS IT WORKING?• Comparison of Attendance Rates
for Past 3 Months:
2005 2006
July 97.61% 98.19%
August 97.29% 98.18%
September 96.69% 97.72%
*** As mentioned in the What’s Cooking Report’s we have picked up an average of 20 students a month.

STUDENT ACHIEVEMENT GOAL
• GOAL 1.1
– Meet all 2005/06 AYP goals including percent proficient AMO's 24.4% English Language Arts proficiency and 26.5% Mathematics.

PERCENT PROFICIENT• With students dropping and adding at
end of year, percent of students who have passed the CST’s have changed.
Last Years Grade
O5-06Current Grade
06-07
2nd 31% 3rd 28.2%
3rd 21.5% 4th 22.7%
4th 34.7% 5th 26.9%

DETERMINE EFFECTIVENESS OF PRIOR STRATEGIES
• 1.1.5 Provide (5) achievement substitute teachers to assist in off-track intersession classrooms and to work with targeted students during the school day that have been identified through Edusoft and District Multiple Measures.

IDENTIFYING TARGET STUDENTS
• 2ND Grade students targeted.– 18.7% passed the CST’s on 04-05
• Target students identified by teacher and administrator based on Tri. 1 grades.
• Classroom support 45 minutes a day, 4 days a week.

2nd Grade CST RESULTS2ND Grade Target Students
P/A 31% 39%
B 36.1% 32%
BB 18% 21%
FBB 16.5% 27%

ESTABLISHING NEW STRATEGIES
• 1.1.5 Provide (5) substitute teachers to assist in off-track intersession classrooms and to work with targeted students during the school day that have been identified through OARS.

IDENTIFYING TARGET STUDENTS
• Custom Multiple Measures Reports identified a strong correlation (approximately 65%) between Open Court Assessment Results in Comprehension and Vocabulary with CST results.
• Students in 2nd Grade with a score of 8 or higher in Comprehension have a higher success rate of passing the CST’s.
» DATA SAMPLE

IDENTIFYING TARGET STUDENTS Cont…
• Target students must be enrolled no later than date of CBEDS.
• Target students must include ELL students.
• Target students will also be invited to Intersession.

TARGET STUDENT SUPPORT
• Workshop Time– Frontloading Core Curriculum
• Vocabulary• Word Knowledge
– Reinforce Comprehension Strategies• Clarifying/Monitoring, Making Connections, Inferring,
etc…
• Use of Supplemental Programs– Test Taking Strategies
• On-Going Training for Substitute Teachers through Support Staff

MONITORING STUDENT PROGRESS
• Open Court Unit Assessments administered every 6 weeks.
• Site Administrators monitor Target Students progress and make necessary changes.
• Identify new students for those who drop.
• Monitor Accelerated Reader Results

District Curriculum Based Budgeting
Review of district data
2005-2006 School Year

Unpacking the Data
PreliminaryAccountability Progress Report
from theCalifornia Department of Education

Adequate Yearly Progress (AYP)
Annual Measurable Objective Target Increase
Percent Proficient in ELA Percent Proficient in Math
2005 through 2007
(’07-’08 targets in red)
Elementary and Middle Schools
24.4 % (35.2%) 26.5 % (37.0%)
High Schools 22.3 % (33.4%) 20.9 % (32.2%)
Unified School District 23.0 % (34.0%) 23.7 % (34.6%)

Fontana USD
Percent of students At or Above Proficient
2005 2006 2008
Eng/LA Math Eng/LA Math Eng/LA Math
Target 23.0% 23.7% 23.0% 23.7% 34.0% 34.6%
FONTANA 27.0% 33.3% 30.4% 33.8% 37.2% 34.8%
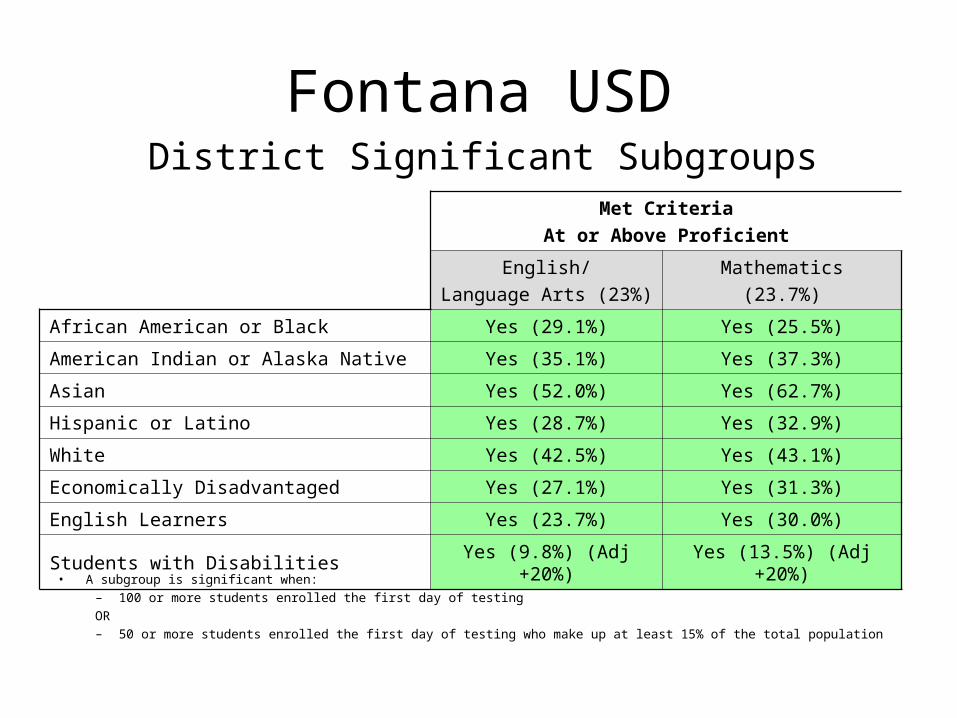
Fontana USDDistrict Significant Subgroups
Met Criteria
At or Above Proficient
English/
Language Arts (23%)
Mathematics
(23.7%)
African American or Black Yes (29.1%) Yes (25.5%)
American Indian or Alaska Native Yes (35.1%) Yes (37.3%)
Asian Yes (52.0%) Yes (62.7%)
Hispanic or Latino Yes (28.7%) Yes (32.9%)
White Yes (42.5%) Yes (43.1%)
Economically Disadvantaged Yes (27.1%) Yes (31.3%)
English Learners Yes (23.7%) Yes (30.0%)
Students with Disabilities Yes (9.8%) (Adj +20%) Yes (13.5%) (Adj +20%)
• A subgroup is significant when:– 100 or more students enrolled the first day of testing
OR– 50 or more students enrolled the first day of testing who make up at least 15% of the total population

Fontana USDELEMENTARY SCHOOLS – p.1
English-Language Arts Proficiency Target2005: 24.4%2006: 24.4%
SCHOOLWIDE
2005 2006 Growth
OVERALL AYP
2005 2006
ELL
2005 2006Growth
Almond 28.3% 28.9% 0.6% No Yes
Canyon Crest 31.3% 35.5% 4.2% Yes Yes
Chaparral 27.9% 35.4% 7.5% No Yes
Citrus 23.9% 28.1% 4.2% No No
Cypress 21.5% 25.0% 3.5% No No
Date 25.1% 24.9% -0.2% No No
Grant 35.6% 40.7% 5.1% No Yes
Hemlock 37.5% 40.7% 3.2% Yes Yes
Juniper 24.8% 28.0% 3.2% No Yes
Live Oak 17.6% 21.7% 4.1% No No
Locust 30.0% 35.5% 5.5% No Yes
Mango 36.3% 35.6% -0.7% Yes Yes
Maple 21.5% 32.8% 11.3% No Yes
North Tamarind 26.9% 34.0% 7.1% No Yes

Fontana USDELEMENTARY SCHOOLS – p.2
English-Language Arts Proficiency Target2005: 24.4%2006: 24.4%
SCHOOLWIDE
2005 2006 Growth
OVERALL AYP
2005 2006
ELL
2005 2006Growth
Oak Park 32.6% 36.7% 4.1% Yes Yes
Oleander 14.9% 23.4% 8.5% No Yes
Palmetto 27.3% 30.9% 3.6% No Yes
Poplar 24.2% 33.1% 8.9% No Yes
Porter 13.5% 30.9% 17.4% No Yes
Primrose 22.8% 32.6% 9.8% Yes Yes
Randall-Pepper 24.1% 26.3% 2.2% No No
Redwood 36.6% 36.8% 0.2% Yes Yes
Shadow Hills 37,8% 38.1% 0.3% Yes Yes
Sierra Lakes 42.6% 48.1% 5.5% No Yes
South Tamarind 26.9% 30.6% 3.7% No Yes
Tokay 27.8% 29.4% 1.6% No Yes
West Randall 20.2% 27.3% 7.1% No No

Fontana USDELEMENTARY SCHOOLS – p. 1
English-Language Arts Proficiency Target2005: 24.4%2006: 24.4%
SCHOOLWIDE
2005 2006 Growth
OVERALL AYP
2005 2006
ELL
2005 2006Growth
Almond 28.3% 28.9% 0.6% No Yes 21.8% 28.9% 2.3%
Canyon Crest 31.3% 35.5% 4.2% Yes Yes 24.7% 35.5% 6.2%
Chaparral 27.9% 35.4% 7.5% No Yes 18.2% 35.4% 7.8%
Citrus 23.9% 28.1% 4.2% No No 14.9% 28.1% 4.2%
Cypress 21.5% 25.0% 3.5% No No 16.3% 25.0% 3.5%
Date 25.1% 24.9% -0.2% No No 22.7% 24.9% -0.2%
Grant 35.6% 40.7% 5.1% No Yes 21.2% 40.7% 8.3%
Hemlock 37.5% 40.7% 3.2% Yes Yes 33.3% 40.7% 9.9%
Juniper 24.8% 28.0% 3.2% No Yes 18.8% 28.0% 3.2%
Live Oak 17.6% 21.7% 4.1% No No 12.6% 21.7% 4.1%
Locust 30.0% 35.5% 5.5% No Yes 22.5% 35.5% 5.5%
Mango 36.3% 35.6% -0.7% Yes Yes 27.5% 35.6% -0.7%
Maple 21.5% 32.8% 11.3% No Yes 11.0% 32.8% 11.2%
North Tamarind 26.9% 34.0% 7.1% No Yes 14.3% 34.0% 7.1%

Fontana USDELEMENTARY SCHOOLS – p. 2
English-Language Arts Proficiency Target2005: 24.4%2006: 24.4%
SCHOOLWIDE
2005 2006 Growth
OVERALL AYP
2005 2006
ELL
2005 2006Growth
Oak Park 32.6% 36.7% 4.1% Yes Yes 21.8% 36.7% 7.1%
Oleander 14.9% 23.4% 8.5% No Yes 13.4% 23.4% 8.5%
Palmetto 27.3% 30.9% 3.6% No Yes 19.1% 30.9% 5.9%
Poplar 24.2% 33.1% 8.9% No Yes 20.0% 33.1% 9.0%
Porter 13.5% 30.9% 17.4% No Yes 6.7% 30.9% 17.4%
Primrose 22.8% 32.6% 9.8% Yes Yes 16.3% 32.6% 9.8%
Randall-Pepper 24.1% 26.3% 2.2% No No 21.0% 26.3% 2.2%
Redwood 36.6% 36.8% 0.2% Yes Yes 31.7% 36.8% 0.2%
Shadow Hills 37,8% 38.1% 0.3% Yes Yes 28.0% 38.1% 3.6%
Sierra Lakes 42.6% 48.1% 5.5% No Yes 22.7% 48.1% 5.7%
South Tamarind 26.9% 30.6% 3.7% No Yes 20.0% 30.6% 3.6%
Tokay 27.8% 29.4% 1.6% No Yes 19.0% 29.4% 1.7%
West Randall 20.2% 27.3% 7.1% No No 13.7% 27.3% 7.1%

Fontana USDELEMENTARY SCHOOLS – p. 1
Mathematics Proficiency Target2005: 26.5%2006: 26.5%
SCHOOLWIDE
2005 2006 Growth
OVERALL AYP
2005 2006
ELL
2005 2006Growth
Almond 38.0% 44.5% 6.5% No Yes
Canyon Crest 52.7% 51.4% -1.3% Yes Yes
Chaparral 46.3% 49.8% 3.5% No Yes
Citrus 44.0% 42.7% -1.3% No No
Cypress 35.7% 37.4% 1.7% No No
Date 43.8% 36.2% -7.6% No No
Grant 47.5% 48.4% 0.9% No Yes
Hemlock 48.7% 45.6% -3.1% Yes Yes
Juniper 39.8% 35.3% -4.5% No Yes
Live Oak 37.4% 29.8% -7.6% No No
Locust 44.4% 44.4% 0.0% No Yes
Mango 47.4% 44.5% -2.9% Yes Yes
Maple 34.1% 43.0% 8.9% No Yes
North Tamarind 35.9% 42.1% 6.2% No Yes

Fontana USDELEMENTARY SCHOOLS – p. 2
Mathematics Proficiency Target2005: 26.5%2006: 26.5%
SCHOOLWIDE
2005 2006 Growth
OVERALL AYP
2005 2006
ELL
2005 2006Growth
Oak Park 55.8% 59.4% 3.6% Yes Yes
Oleander 27.9% 40.0% 12.1% No Yes
Palmetto 42.8% 35.9% -6.9% No Yes
Poplar 36.3% 43.8% 7.5% No Yes
Porter 25.4% 37.6% 12.2% No Yes
Primrose 39.6% 43.0% 3.4% Yes Yes
Randall-Pepper 41.8% 34.1% -7.7% No No
Redwood 57.9% 53.2% -4.7% Yes Yes
Shadow Hills 51.0% 50.4% -0.6% Yes Yes
Sierra Lakes 50.7% 58.0% 7.3% No Yes
South Tamarind 36.9% 36.5% -0.4% No Yes
Tokay 49.2% 48.7% -0.5% No Yes
West Randall 31.0% 38.1% 7.1% No No

Fontana USDELEMENTARY SCHOOLS – p. 1
Mathematics Proficiency Target2005: 26.5%2006: 26.5%
SCHOOLWIDE
2005 2006 Growth
OVERALL AYP
2005 2006
ELL
2005 2006Growth
Almond 38.0% 44.5% 6.5% No Yes 35.0% 40.8% 5.8%
Canyon Crest 52.7% 51.4% -1.3% Yes Yes 48.1% 50.3% 2.2%
Chaparral 46.3% 49.8% 3.5% No Yes 36.5% 44.2% 7.7%
Citrus 44.0% 42.7% -1.3% No No 39.4% 36.7% -2.7%
Cypress 35.7% 37.4% 1.7% No No 32.8% 37.2% 4.4%
Date 43.8% 36.2% -7.6% No No 44.0% 35.5% -8.5%
Grant 47.5% 48.4% 0.9% No Yes 39.8% 41.2% 1.4%
Hemlock 48.7% 45.6% -3.1% Yes Yes 41.7% 41.4% -0.3%
Juniper 39.8% 35.3% -4.5% No Yes 37.6% 37.3% -0.3%
Live Oak 37.4% 29.8% -7.6% No No 32.4% 28.6% -3.8%
Locust 44.4% 44.4% 0.0% No Yes 41.8% 36.5% -5.3%
Mango 47.4% 44.5% -2.9% Yes Yes 42.5% 39.0% -3.5%
Maple 34.1% 43.0% 8.9% No Yes 34.2% 39.0% 4.8%
North Tamarind 35.9% 42.1% 6.2% No Yes 28.1% 36.6% 8.5%

Fontana USDELEMENTARY SCHOOLS – p. 2
Mathematics Proficiency Target2005: 26.5%2006: 26.5%
SCHOOLWIDE
2005 2006 Growth
OVERALL AYP
2005 2006
ELL
2005 2006Growth
Oak Park 55.8% 59.4% 3.6% Yes Yes 47.2% 58.1% 10.9%
Oleander 27.9% 40.0% 12.1% No Yes 29.5% 39.2% 9.7%
Palmetto 42.8% 35.9% -6.9% No Yes 40.8% 34.9% -5.9%
Poplar 36.3% 43.8% 7.5% No Yes 32.4% 39.6% 7.2%
Porter 25.4% 37.6% 12.2% No Yes 23.1% 35.7% 12.6%
Primrose 39.6% 43.0% 3.4% Yes Yes 37.2% 40.9% 3.7%
Randall-Pepper 41.8% 34.1% -7.7% No No 41.7% 34.6% -7.1%
Redwood 57.9% 53.2% -4.7% Yes Yes 53.4% 53.2% -0.2%
Shadow Hills 51.0% 50.4% -0.6% Yes Yes 48.0% 45.5% -2.5%
Sierra Lakes 50.7% 58.0% 7.3% No Yes 40.0% 56.0% 16.0%
South Tamarind 36.9% 36.5% -0.4% No Yes 33.3% 33.7% 0.4%
Tokay 49.2% 48.7% -0.5% No Yes 45.2% 45.3% 0.1%
West Randall 31.0% 38.1% 7.1% No No 26.7% 35.7% 9.0%

Fontana USDMIDDLE SCHOOLS
English-Language Arts Proficiency Target2005: 24.4%2006: 24.4%
SCHOOLWIDE
2005 2006 Growth
OVERALL AYP
2005 2006
ELL
2005 2006Growth
Alder 19.4% 20.3% 0.9% No No
Almeria 30.8% 33.6% 2.8% No No
Fontana 19.4% 24.2% 4.8% No No
Jurupa 24.5% 29.6% 5.1% No No
Sequoia 26.7% 28.1% 3.5% No No
Southridge 37.0% 29.6% 2.9% No Yes
Truman 25.0% 39.7% 2.7% No No
Ruble 24.6% 25.7% 0.7% No No

Fontana USDMIDDLE SCHOOLS
English-Language Arts Proficiency Target2005: 24.4%2006: 24.4%
SCHOOLWIDE
2005 2006 Growth
OVERALL AYP
2005 2006
ELL
2005 2006Growth
Alder 19.4% 20.3% 0.9% No No 10.5% 13.4% 2.9%
Almeria 30.8% 33.6% 2.8% No No 17.5% 27.9% 10.4%
Fontana 19.4% 24.2% 4.8% No No 10.2% 16.9% 6.7%
Jurupa 24.5% 29.6% 5.1% No No 12.4% 21.0% 8.6%
Ruble 26.7% 28.1% 3.5% No No 10.9% 15.8% 5.3%
Sequoia 37.0% 29.6% 2.9% No No 24.2% 18.7% 7.8%
Southridge 25.0% 39.7% 2.7% No Yes 15.2% 31.8% 7.6%
Truman 24.6% 25.7% 0.7% No No 10.5% 20.2% 5.0%

Fontana USDMIDDLE SCHOOLS
Mathematics Proficiency Target2005: 26.5%2006: 26.5%
SCHOOLWIDE
2005 2006 Growth
OVERALL AYP
2005 2006
ELL
2005 2006Growth
Alder 13.9% 18.4% 4.5% No No
Almeria 25.7% 25.5% -0.2% No No
Fontana 14.4% 17.2% 2.8% No No
Jurupa 28.9% 34.6% 5.7% No No
Ruble 21.2% 19.6% -1.3% No No
Sequoia 28.4% 24.3% 3.1% No No
Southridge 19.6% 32.8% 4.4% No Yes
Truman 20.9% 22.5% 2.9% No No

Fontana USDMIDDLE SCHOOLS
Mathematics Proficiency Target2005: 26.5%2006: 26.5%
SCHOOLWIDE
2005 2006 Growth
OVERALL AYP
2005 2006
ELL
2005 2006Growth
Alder 13.9% 18.4% 4.5% No No 7.9% 15.4% 7.5%
Almeria 25.7% 25.5% -0.2% No No 18.7% 20.4% 1.7%
Fontana 14.4% 17.2% 2.8% No No 10.0% 16.7% 6.7%
Jurupa 28.9% 34.6% 5.7% No No 16.5% 27.5% 11.0%
Sequoia 21.2% 19.6% -1.3% No No 10.1% 13.3% 0.8%
Southridge 28.4% 24.3% 3.1% No No 23.1% 15.1% 5.0%
Truman 19.6% 32.8% 4.4% No Yes 12.9% 25.6% 2.5%
Ruble 20.9% 22.5% 2.9% No No 16.2% 20.7% 7.8%

Fontana USDHIGH SCHOOLS
English-Language Arts Proficiency Target2005: 22.3%2006: 22.3%
SCHOOLWIDE
2005 2006 Growth
OVERALL AYP
2005 2006
ELL
2005 2006Growth
Fontana 29.4% 35.2% 5.8% No No
Kaiser 41.7% 41.5% -0.2% No Yes
Miller 37.1% 37.0% -0.1% No Yes

Fontana USDHIGH SCHOOLS
English-Language Arts Proficiency Target2005: 22.3%2006: 22.3%
SCHOOLWIDE
2005 2006 Growth
OVERALL AYP
2005 2006
ELL
2005 2006Growth
Fontana 29.4% 35.2% 5.8% No No 8.7% 25.2% 16.5%
Kaiser 41.7% 41.5% -0.2% No Yes 7.9% 22.6% 14.7%
Miller 37.1% 37.0% -0.1% No Yes 7.1% 26.4% 19.3%

Fontana USDHIGH SCHOOLS
Mathematics Proficiency Target2005: 20.9%2006: 20.9%
SCHOOLWIDE
2005 2006 Growth
OVERALL AYP
2005 2006
ELL
2005 2006Growth
Fontana 34.3% 33.4% -0.9% No No
Kaiser 43.3% 38.1% -5.2% No Yes
Miller 38.2% 28.6% -9.6% No Yes

Fontana USDHIGH SCHOOLS
Mathematics Proficiency Target2005: 20.9%2006: 20.9%
SCHOOLWIDE
2005 2006 Growth
OVERALL AYP
2005 2006
ELL
2005 2006Growth
Fontana 34.3% 33.4% -0.9% No No 18.2% 24.5% 6.3%
Kaiser 43.3% 38.1% -5.2% No Yes 15.8% 29.7% 13.9%
Miller 38.2% 28.6% -9.6% No Yes 16.6% 20.9% 4.3%

• Direction based on what the data is telling us:– Focus on math instruction– Targeted staff development
• Administrators• Teachers
– Focused approach• English Language Development• Front-loading for English learners
– Targeted intervention– New quantitative and qualitative evaluation process– Improving “full and faithful” implementation of
curriculum in core courses K-12
• Secondary reform

Next Steps
• Establish criteria for quality program review(06-07)– Clear goals– Implementation– Data collection
• Budget Planning (spring 07)– Use process to identify needs– Collect Data– Determine effect of program/cost

Curriculum Based Budgeting
• Implement Process fully (07-08)(08-09)– Review programs and provide analysis based
on data.– Analyze the cost benefit– Provide new goals based on data– Re-align the program implementation if
necessary

Monitoring The Process
• Single Plan for Student Achievement
• LEA Plan
• Mid year program and administrator meetings

Data-Driven Decision Making
Needs of students district-wide identified; resources applied
Needs of students school-wide identified; Programs devised
Student needs identified; Met at the classroom level
Recommended