CUMULATIVE INEQUALITIES IN ITALIAN HIGHER EDUCATION An analysis of data from the Italian Household Longitudinal Survey1
Moris Triventi* and Paolo Trivellato** University of Milano Bicocca - Italy
Working paper – Draft version. Please do not quote
14th -17th August 2007 Montreal
Research Committee 28 Summer Meeting
* Ph.D. candidate, Department of Sociology and Social Research. ** Professor of Sociology, Department of Sociology and Social Research.
1 The authors would like to thank Maurizio Pisati and Antonio Schizzerotto for their useful comments and suggestions. The research has been co-funded by the University of Milano-Bicocca and by the Ministero dell’Istruzione, dell’Università e della Ricerca, contract n° 2004149592.
2
Abstract
Using data from the five waves of ILFI, the Italian Household Longitudinal Survey, this paper deals with the dynamics of higher education in the 20th century investigating how and how far cohort of birth and social class are associated with enrolment rate, drop-out rate, graduation behind schedule. Enrolment growth has not been followed by a proportional increase in graduation rates along the whole century. The drop-out rate has been high for decades, the amount of delayed graduations and the duration of the delay have been high too and have been increasing over time. As a consequence Italy is nowadays quite far from the other European countries in terms of tertiary education attainment. Moreover, in spite of the «1969 reform», there are still nowadays relevant inequalities in the rates of enrolment and graduation among different social categories. In particular, absolute social class inequalities tend not to diminish across cohorts. Upper classes not only have more opportunities than working classes to enter university and obtain a degree, they also have less chances of dropping-out, and graduating behind schedule. Results show cumulative advantages for higher classes, and cumulative disadvantages for lower classes.
1. Introduction
Studies of university systems traditionally follow two main approaches: the first one is
the «institutional approach» and the second one is the «inequality approach». The
former looks at universities using organizational concepts, trying to evaluate the
efficiency and the efficacy of the institutional functioning. The latter focuses on
inequalities in the field of tertiary education and how they change over time. In other
words, the focus of the first approach is the university functioning, whereas the object
of interest of the second perspective is the degree of inequality in the field of education
in contemporary societies. The «institutional approach» is adopted by organizations like
OECD (at the international level) or ISTAT, Almalaurea and MIUR (in Italy), which
collect data on the educational attainments of the adult population, university enrolment
and graduation rates, drop-outs and job opportunities for graduates (Almalaurea 2006a,
2006b; Istat 2000, 2004; Oecd 2003, 2006). The «inequality approach» is adopted by
academic scholars who investigate whether access to higher education and the
opportunity of graduating are equally distributed among different social categories,
according to gender, social origin and cultural capital (for example, Blossfeld e Shavit
1993; Schizzerotto et. al 2002; Breen et. al 2005).
3
Usually, these two perspectives have been kept separate; in this paper we build a bridge
between the two research traditions. In the past some research has followed a similar
approach, trying to analyse the performance of university students according to their
social origins (Martinotti 1969; de Francesco and Trivellato 1983, 1985). Nevertheless,
the data which were analysed had many limits. Those surveys were carried out in
particular universities and therefore produced local results. Moreover, they analysed
short time series, based on cross-section data from administrative sources. Those
analyses were pretty good at describing change in university attendance year by year,
but did not enable the monitoring of the careers of students belonging to different
cohorts. The dataset we use for our analysis (Italian Household Longitudinal Survey,
see details below), on the other hand, allows us to study these phenomena. Our
perspective is broader in comparison with past research, for several reasons. First of all,
the members of the panel who have been interviewed have enrolled and graduated in
many Italian institutions, representatives of the whole Italian university system;
therefore our results can be generalised at the national level. Second, we can count on
data which are not related to specific academic years, but to the different academic
experiences of the members of different cohorts of birth. Third, information is collected
in a longitudinal and retrospective frame; hence we can study changes at the individual
or «micro» level and study in detail the diachronic characteristics of the social
phenomena under scrutiny (Blossfeld and Rowher 1995).
The paper is organized as follows. In the next section we present a brief history of
Italian Higher Education and in the third section we outline the broad theoretical
structure on which the hypotheses are built. After this, data, variables and statistic
methods employed in the analysis are described. In the fourth and fifth section we
present the main results of the analysis; in the sixth part we discuss the most important
results of the analysis and, finally, we outline some considerations on higher education
policy in the concluding remarks.
2. A brief history of Italian Higher Education
This paragraph is meant to provide an overall picture of the university system during the
second half of the 20th century. We focus on this time span because reliable data on
higher education are available since the mid-forties and because it is during those five
4
decades that the cohorts under scrutiny experience their university education. Before
commenting graph 1 and 2, we underline two peculiar elements which are to be kept in
mind in order to better understand the dynamics of Italian higher education. First, in this
country degrees have legal validity, i.e. graduates are considered to have the same
amount of knowledge and competence in their field irrespective of the university where
they have gained their degrees. This validity rests on the still centralised system of
control (the ministry which states national regulatory frames) and is in the meantime the
main hindrance to devolving autonomy to Universities. While this validity has
straightforward effects in the domain of public employment (two thirds of graduate
posts in Italy), in the private sector recruiters tend more and more to screen graduates
according to actual competences and personality traits. To hold the laurea, the
certificate that entitles the holder to be named dottore has been for long time and partly
still is one of the most important pillars of the Italian culture. As a consequence
meritocracy has probably always been considered with mixed feelings. The key point is
to get a degree; then friends, relatives, patrons and the like will help in finding a
reasonably rated and paid post. If one considers that, as far as the starting salary is
concerned, graduates and high schools diploma holders are nearly on the same foot and
that career mobility of Italian graduates is nearly non-existent (Pisati e Schizzerotto
2002), one can better interpret what might be the mood of many university students and
the ensuing phenomena on which we have drawn attention at the very beginning,
namely high dropout rates, low graduation rates and long duration of studies.
The cost charged for tuition and fees has been, and still is, pretty low in Italian state
universities; if the legal validity is the same and the cost is lower, why spend more?
This is likely to be the rationale of most students, many of them entering the higher
education system for the first time in the history of their family. And most of them
commuting to the nearest university, as they cannot afford the cost of living out of
home. Attending the university in a town far from home is not a popular attitude in
Italy. Halls of residence are few and renting a flat can be very expensive in many
university towns. Student loans were virtually unknown till the mid nineties and are still
not popular today (a few thousands granted, mainly to engineering students).
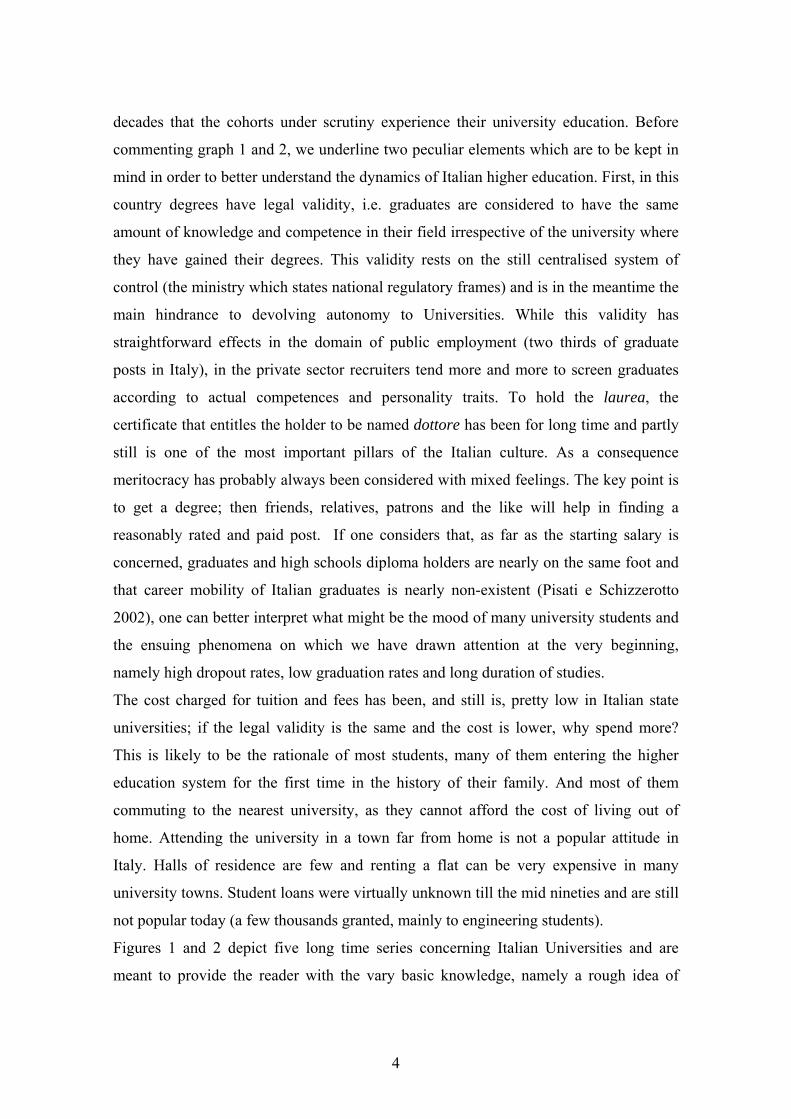
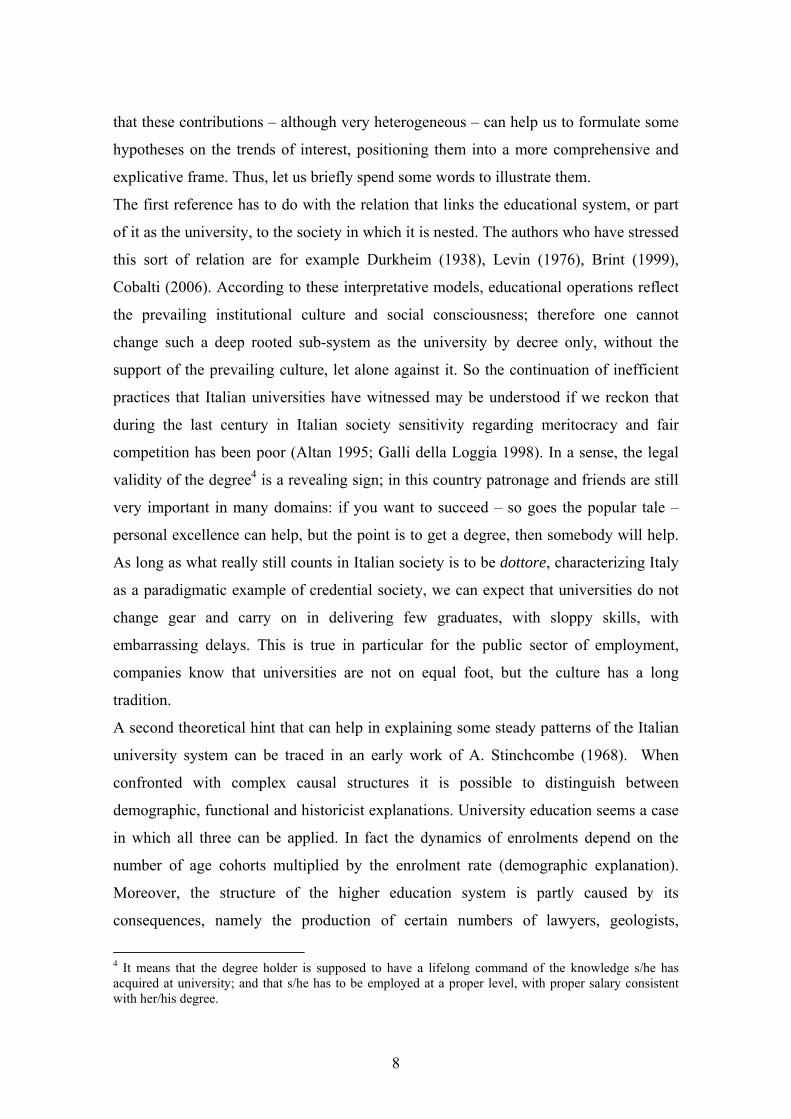
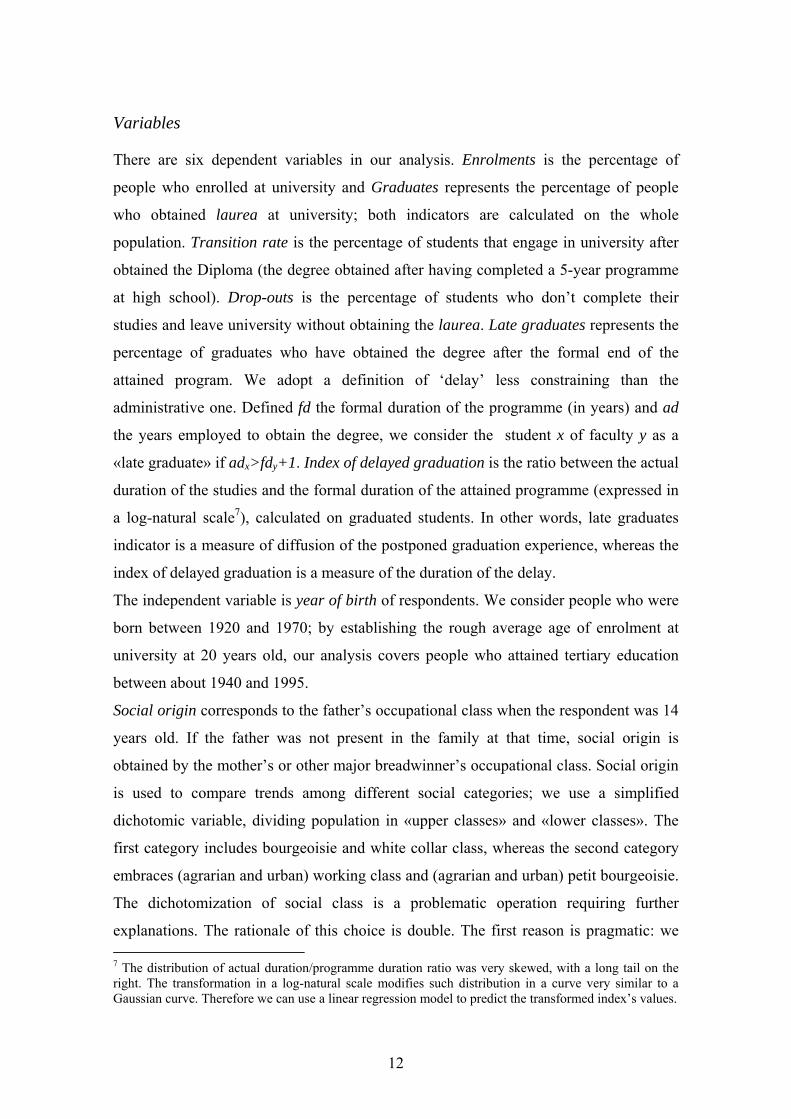
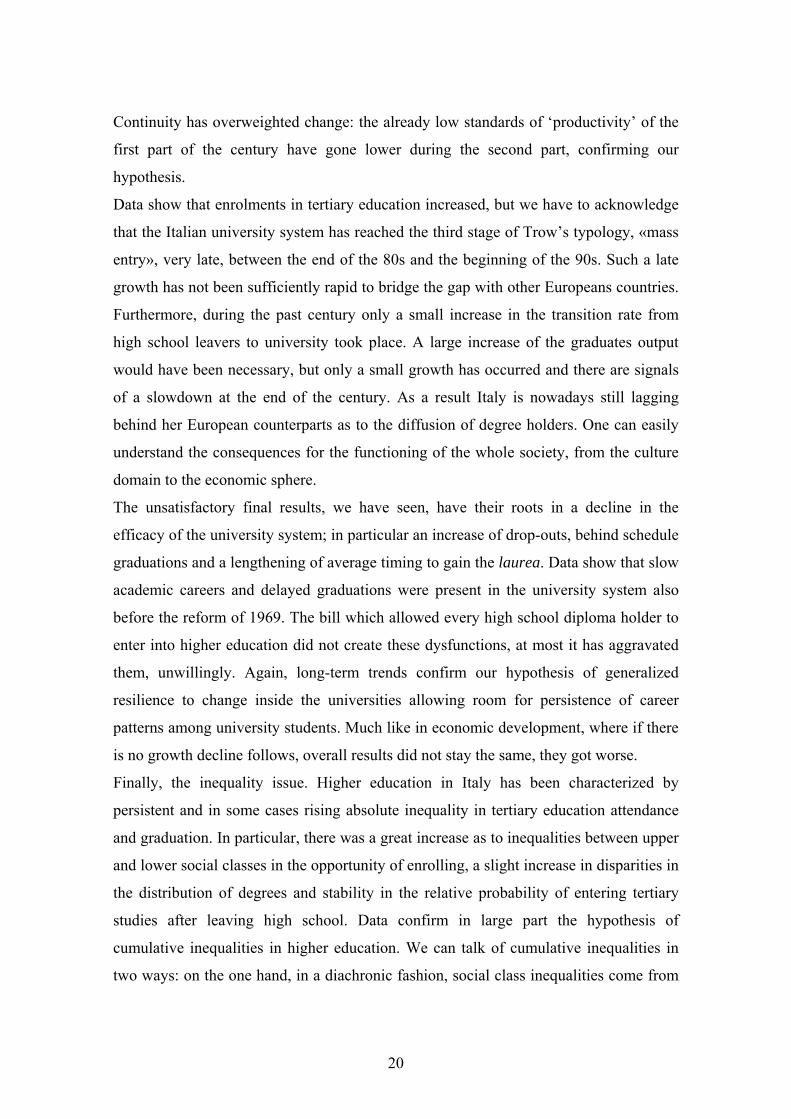
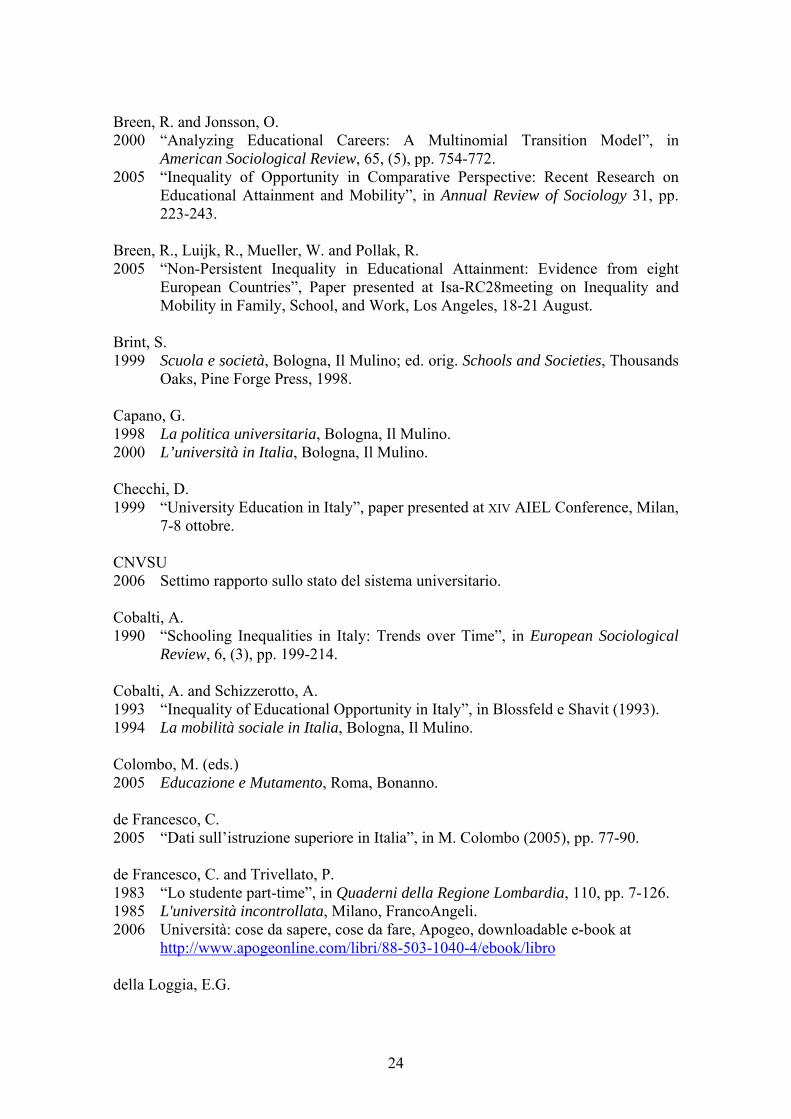
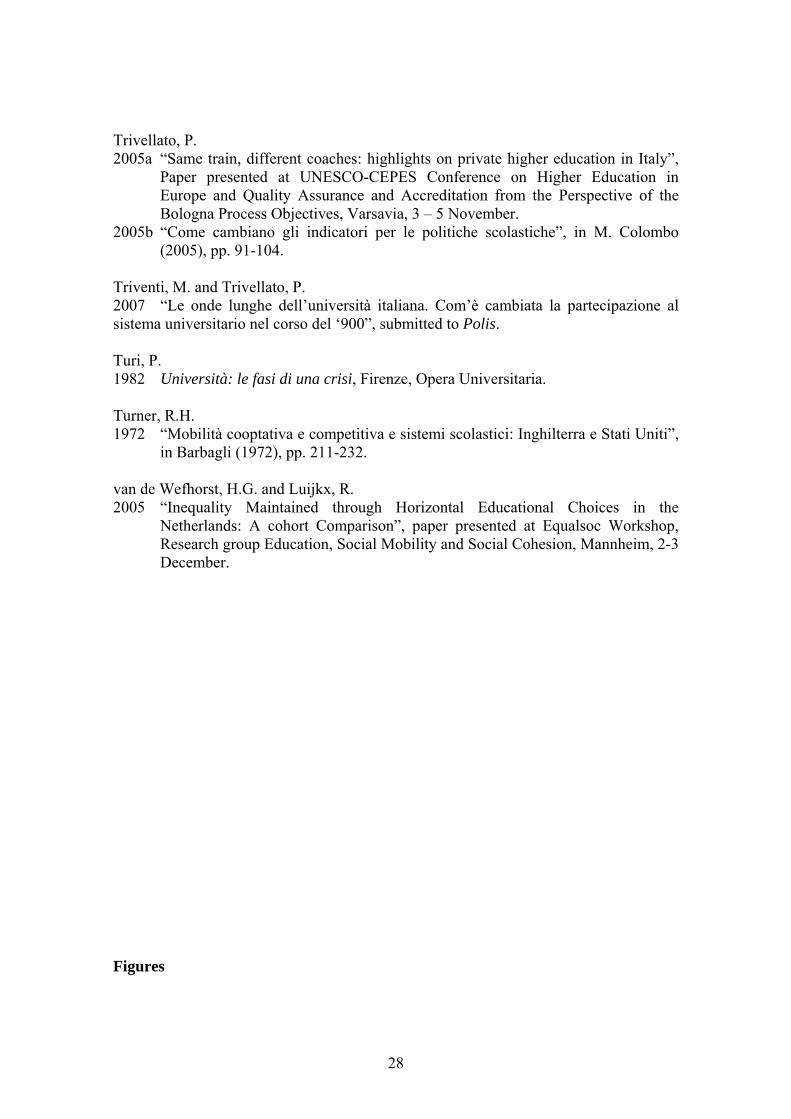
Figures 1 and 2 depict five long time series concerning Italian Universities and are
meant to provide the reader with the vary basic knowledge, namely a rough idea of
5
sheer numbers and an awareness of the most important changes-cum-reform which did
occur during the century. We look at the main trends starting that year and ending 1995-
96, i.e. when respondents born in 1970 should in principle have completed their
university study, allowing a three year period delay for graduating in case of 4 year
programmes and two year delay for graduating in case of 5 year programmes.
Let us look at total enrolments. During second world war and in the ensuing decade
numbers stay even around 220 thousand. Rules of access had been established by the
law enacted by the fascist minister G. Gentile which was inspired by what we would
call today ‘sponsored mobility’. Admission to tertiary education was allowed only to
students who had graduated from licei. No numerus clausus was implemented in any
faculty. The university was strictly under the ministerial central control. During the
second part of the fifties enrolments start to grow, helped by economic development
which was gaining momentum. But it is in 1965-66, when the baby-boomers were ready
for higher education, that numbers jump over 400 thousand. Growth constantly
continues till 1977-78. The sixties and the seventies are key years for Italian higher
education: in fact the “natural” increase of the first decade receives a boost in 1969
when a law is enacted which allows everyone who has successfully completed a five
year high school programme (licei, technical school, vocational education, any diploma
holder) to enrol in whatever university programme2. Numbers rose over 800 thousand,
for the Italian academic world it was some sort of revolution. As Recchi (2003) puts it,
«the door was open, but the house remained the same. The result was overcrowding,
physically and symbolically: physically because universities had to face expansion
without adequate facilities and re-arrangement of teaching roles; symbolically because
all students had to contend for the same degree». Interestingly enough, the reform did
not trigger expansion, which had started earlier, but provided a boost bound to last till
the end of the seventies. As a matter of fact new teaching resources were pretty fast
conferred, see the graph showing the boost in the number of professors which started in
2 After the pressures of students’ contestation in the second half of the ‘60s, the decree n.1239 of 31st
October 1969 instituted the first great reform of university system after the Second World War. Its main function was to liberalize the access to university by abolishing the rule imposed by Gentile’s law of 1923, which didn’t allow the access to tertiary education to students who had not attended the licei (classical or scientific studies). After the 1969 reform all students that have successfully concluded 5-year programmes at upper secondary school can enter university, without any restriction on the choice of the faculty or course.
6
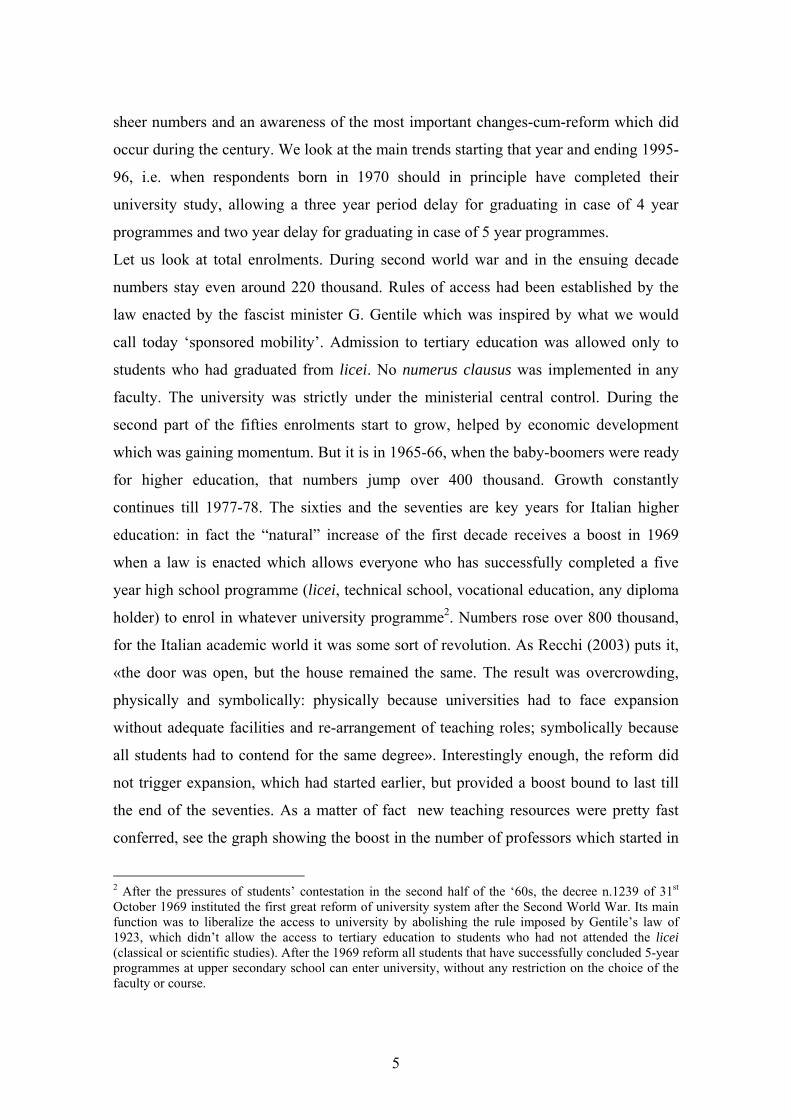
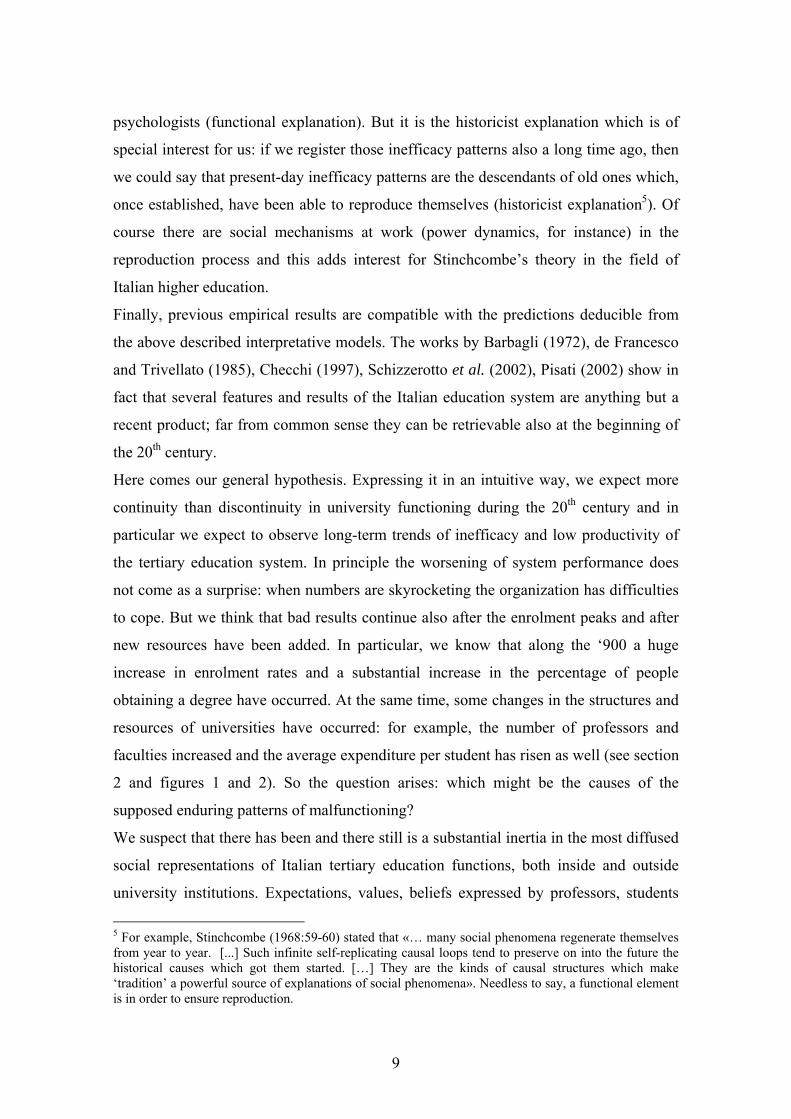
1971-72. But they were from the traditional breed, and neither immediately nor in later
years they understood that their role should have been revised, in order to cope with the
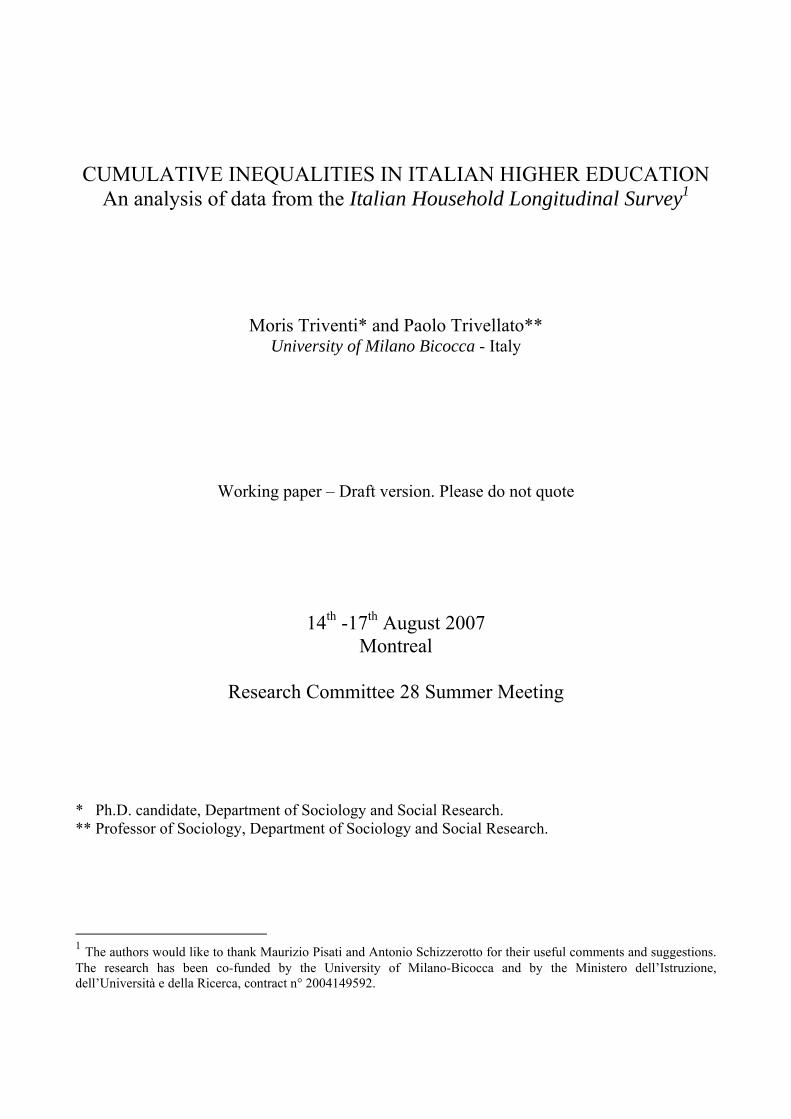
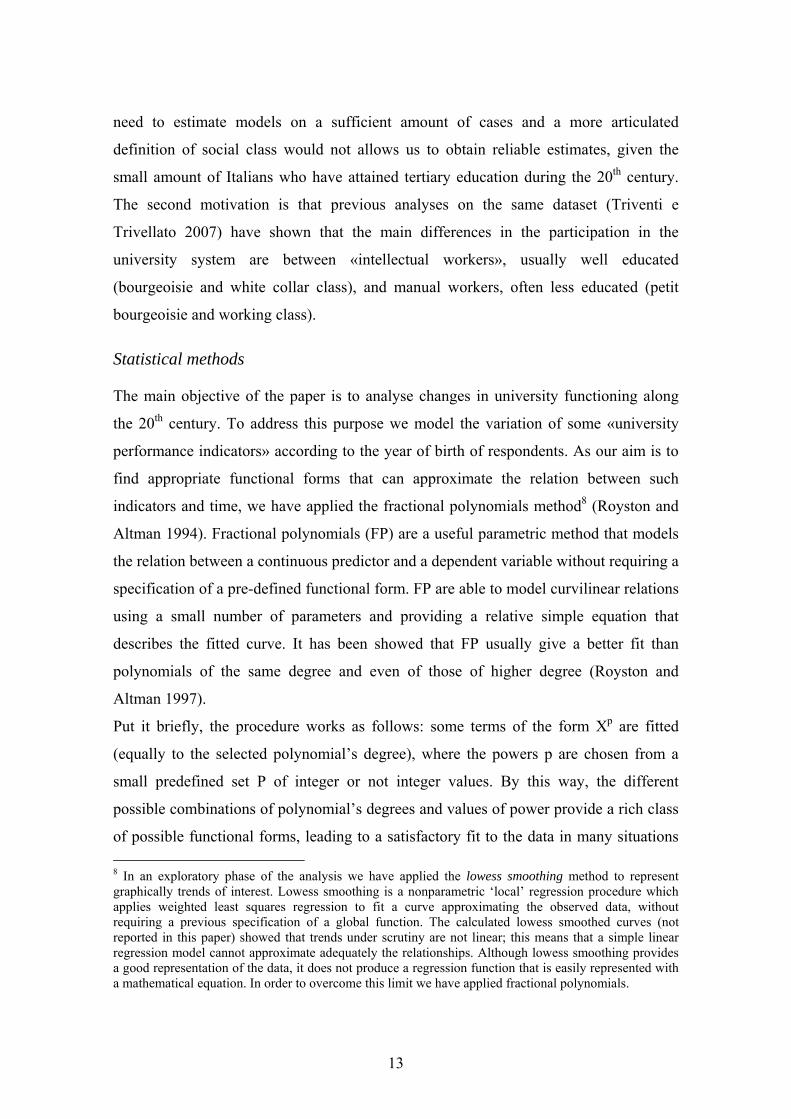
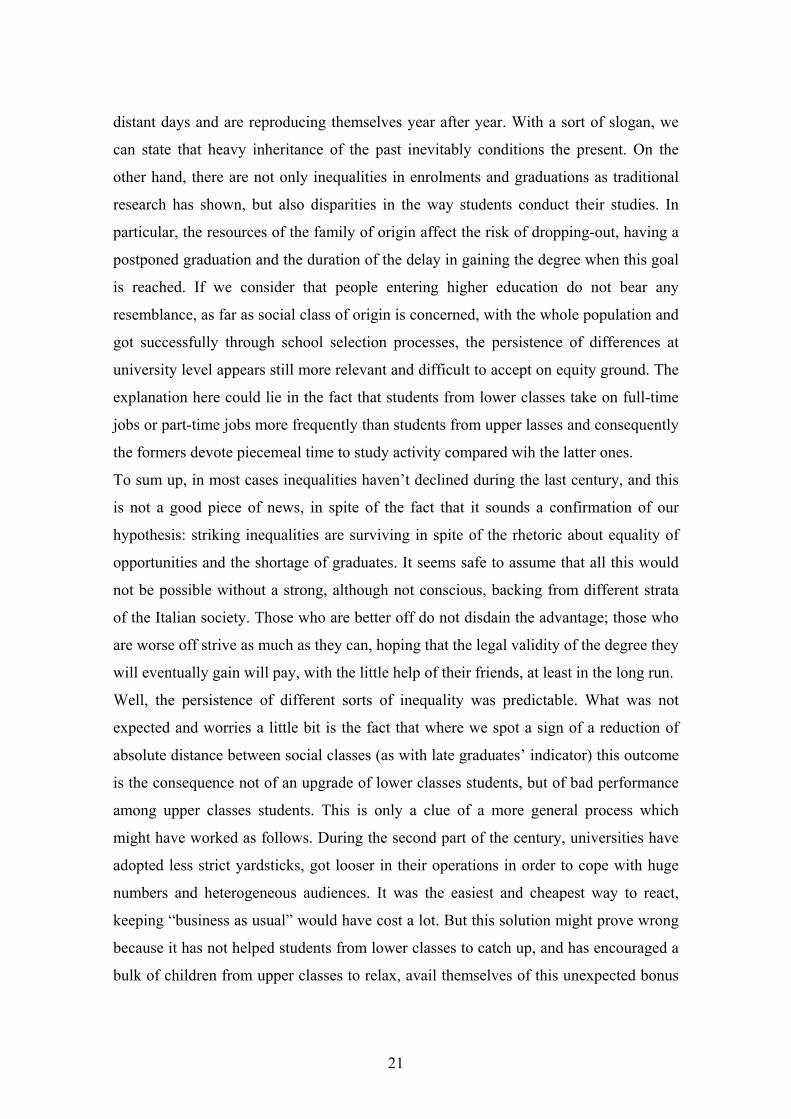
new profile of the audience. In principle, the quality of teaching should have improved,
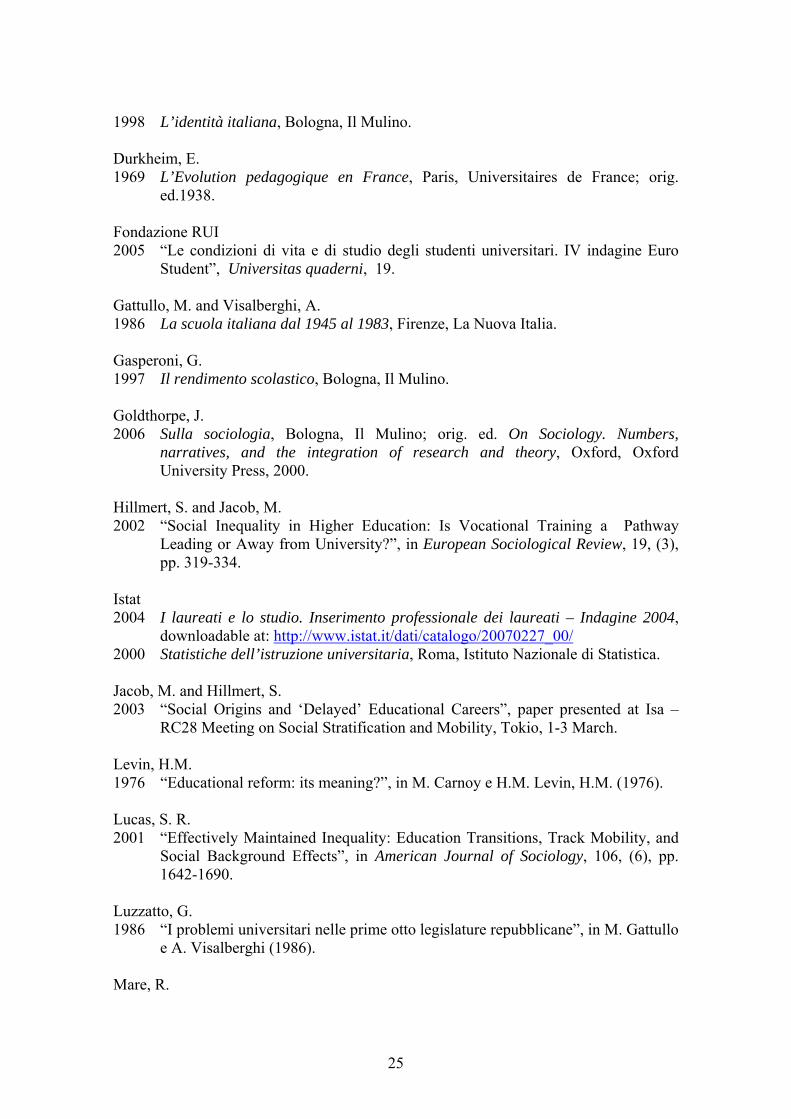
as the student/teacher ratio, after a steady growth during the sixties, went down very
quickly (Figure 2). But the distance between the new students and the old university
was too simply too large. Also in Figure 2 one can see that in the academic year 1971-
72 the percentage of students behind schedule (fuori-corso) resumes its rise, a rise
which was bound to continue till the end of the nineties, when it was again as high as in
1950. The count of people who were admitted and soon gave up sounds as a memorable
defeat: two thirds of students who enrolled between 1970 and 1985 (de Francesco,
1988). Between 1977-78 and 1986-87 enrolments remained stable, around one million.
Public debate was continuing around the issues of how to cope with the unexpected
consequences which where under everybody’s eyes, but no overall solution was agreed
upon. So, when the trend resumed to rise in 1987-88 (see upper graph in figure1) the
Italian university system was still unprepared to deal with the second, robust wave of
growth.
It was only in 1999 that a full-fledged reform was enacted, defining three levels of post-
secondary education, a structure complying with the agreements signed in Bologna and
envisaging a European higher education space, namely first level or bachelor degree
(three years), second level laurea magistrale (two years) and doctoral studies (three
years). Therefore the reader should keep in mind that the work presented in this paper is
based on data which refer to the “old rule” (only one type of degree, 4 years). As the
first academic year of implementation of the new organization has been 2001-02, we
cannot say at present if the goals are going to be achieved3. Data from the first two
cohorts of new entrants seem to follow the usual pattern (one year delay in graduation,
25% dropout rate from first to second year).
One could be tempted to say that the legislative reaction aimed at redressing the
functioning of Italian higher education institutions has arrived too late in 1999. But one
3 The university reform - decree n° 509 - was enacted in 1999, but started to be implemented with the beginning of academic year 2001-02. The rationale was as follows: 1) to re-design the degree structure according to the Bologna model, 2) to allow university autonomy in curriculum design, 3) to stress a student-centered approach in teaching and learning, 4) to focus on employability of graduates, 5) to introduce opportunities for internationalisation.
7
could wonder if a decree can effectively influence teaching and learning practices which
– we shall see in the following sections – have been in place for decades. Or if it is the
case that practices start changing and then the law follows, as in 1969. The issue is open
ended, in six or nine years time we will be able to draw a balance. By now, in 2007, no
relevant departure from the old practices can be seen, so the idea according to which
continuity and tradition will outbalance change and innovation cannot be dismissed, yet.
3. Theory and hypotheses
Our perspective is mainly descriptive in character: we share the persuasion that social
scientists very often devote themselves to the elaboration of complex explanatory
theories or sophisticated statistical models without paying enough attention to the
description of the empirical evidence they have under their eyes (Goldthorpe 2006).
True, descriptive analysis is often driven by contingent interests (Boudon 2002) and for
this reason it is usually based on short-term data. But in our opinion an attempt at
depicting an illustrative overview of the long-term trends of an important institutional
field such as higher education of contemporary Italy is worth doing.
The research has four main goals: the first aim is to update and give an overview of
changes in the participation of Italians in the higher education system during the 20th
century. The second aim is to analyse how some indicators of the ‘quality’ of university
students’ careers (called in the paper ‘performance’ or ‘efficacy’ indicators) have
changed over time. The third goal is to identify trends in absolute inequalities in
university participation between upper and lower classes. Finally, the fourth objective is
to evaluate whether social origin affects the ways in which students conduct their
studies and, eventually, whether the differences between classes are changed over time.
Specifically, we are in a position to analyse drop-outs and delayed graduations in a
long-term perspective and follow these trends according to the social class of the
students: this is probably the distinctive feature of our work.
Although the main purpose of the paper is descriptive, this does not mean that we don’t
have any theory of reference or hypotheses. In particular, we can formulate several
hypotheses on the trends of interest by looking at different sources: the influence that
society exerts on the educational system, Stinchcombe’s typology of sociological
explanation, and previous research results on the Italian educational system. We think
8
that these contributions – although very heterogeneous – can help us to formulate some
hypotheses on the trends of interest, positioning them into a more comprehensive and
explicative frame. Thus, let us briefly spend some words to illustrate them.
The first reference has to do with the relation that links the educational system, or part
of it as the university, to the society in which it is nested. The authors who have stressed
this sort of relation are for example Durkheim (1938), Levin (1976), Brint (1999),
Cobalti (2006). According to these interpretative models, educational operations reflect
the prevailing institutional culture and social consciousness; therefore one cannot
change such a deep rooted sub-system as the university by decree only, without the
support of the prevailing culture, let alone against it. So the continuation of inefficient
practices that Italian universities have witnessed may be understood if we reckon that
during the last century in Italian society sensitivity regarding meritocracy and fair
competition has been poor (Altan 1995; Galli della Loggia 1998). In a sense, the legal
validity of the degree4 is a revealing sign; in this country patronage and friends are still
very important in many domains: if you want to succeed – so goes the popular tale –
personal excellence can help, but the point is to get a degree, then somebody will help.
As long as what really still counts in Italian society is to be dottore, characterizing Italy
as a paradigmatic example of credential society, we can expect that universities do not
change gear and carry on in delivering few graduates, with sloppy skills, with
embarrassing delays. This is true in particular for the public sector of employment,
companies know that universities are not on equal foot, but the culture has a long
tradition.
A second theoretical hint that can help in explaining some steady patterns of the Italian
university system can be traced in an early work of A. Stinchcombe (1968). When
confronted with complex causal structures it is possible to distinguish between
demographic, functional and historicist explanations. University education seems a case
in which all three can be applied. In fact the dynamics of enrolments depend on the
number of age cohorts multiplied by the enrolment rate (demographic explanation).
Moreover, the structure of the higher education system is partly caused by its
consequences, namely the production of certain numbers of lawyers, geologists,
4 It means that the degree holder is supposed to have a lifelong command of the knowledge s/he has acquired at university; and that s/he has to be employed at a proper level, with proper salary consistent with her/his degree.
9
psychologists (functional explanation). But it is the historicist explanation which is of
special interest for us: if we register those inefficacy patterns also a long time ago, then
we could say that present-day inefficacy patterns are the descendants of old ones which,
once established, have been able to reproduce themselves (historicist explanation5). Of
course there are social mechanisms at work (power dynamics, for instance) in the
reproduction process and this adds interest for Stinchcombe’s theory in the field of
Italian higher education.
Finally, previous empirical results are compatible with the predictions deducible from
the above described interpretative models. The works by Barbagli (1972), de Francesco
and Trivellato (1985), Checchi (1997), Schizzerotto et al. (2002), Pisati (2002) show in
fact that several features and results of the Italian education system are anything but a
recent product; far from common sense they can be retrievable also at the beginning of
the 20th century.
Here comes our general hypothesis. Expressing it in an intuitive way, we expect more
continuity than discontinuity in university functioning during the 20th century and in
particular we expect to observe long-term trends of inefficacy and low productivity of
the tertiary education system. In principle the worsening of system performance does
not come as a surprise: when numbers are skyrocketing the organization has difficulties
to cope. But we think that bad results continue also after the enrolment peaks and after
new resources have been added. In particular, we know that along the ‘900 a huge
increase in enrolment rates and a substantial increase in the percentage of people
obtaining a degree have occurred. At the same time, some changes in the structures and
resources of universities have occurred: for example, the number of professors and
faculties increased and the average expenditure per student has risen as well (see section
2 and figures 1 and 2). So the question arises: which might be the causes of the
supposed enduring patterns of malfunctioning?
We suspect that there has been and there still is a substantial inertia in the most diffused
social representations of Italian tertiary education functions, both inside and outside
university institutions. Expectations, values, beliefs expressed by professors, students
5 For example, Stinchcombe (1968:59-60) stated that «… many social phenomena regenerate themselves from year to year. [...] Such infinite self-replicating causal loops tend to preserve on into the future the historical causes which got them started. […] They are the kinds of causal structures which make ‘tradition’ a powerful source of explanations of social phenomena». Needless to say, a functional element is in order to ensure reproduction.
10
and their families and – eventually – the labour market have stayed invariant. Teaching
practices of the formers may have gone hand in hand with habits that students adopt in
their academic life. If daily functioning of the university system is affected by the
expectations, values and practices of its actors, well, not only continuity of pattern
behaviour can be expected but a slight worsening in the performance of Italian higher
education institution along the 20th century would be expected as well. In other terms,
while great changes in the students’ population, in the demands of education, and in the
whole society took place, universities have progressively adapted their resources to the
new conditions, but in the meantime no structural mending action or real re-routing in
the way to conceive higher education has been taken.
Second, we expect that social origin affects not only the probability of entering
university or taking the degree, but also the ways in which the students conduct their
studies and, in particular, the timing they use to reach the laurea. We expect that
members of upper classes exhibit a less proportion of drop-outs and delayed graduations
than students from lower classes. Third, we expect that there has not been a decrease of
absolute inequalities in participation and university performances between classes. At
the beginning of the last century in fact the grade of selection at inferior lever of
education was more severe and only the talented and motivated members of the working
classes could attend higher education, and so their performances would not have been
significantly different from those of upper classes. During the 20th century an increase
of students from lower classes has occurred and this has probably increased their
heterogeneity and, consequently, the proportion of less motivated and talented students.
It’s possible that an analogous process has occurred also among upper classes’ students,
but their resources could have cushioned the effect of the diminishing motivation and
talent. Moreover, students of the lower classes have more probability to engage in a
part-time job during their tertiary studies than upper classes’ students and this
differential behaviour can affect the timing they devote to study and to attend the
lessons; therefore, this can influence in a not negligible way the risk of dropping-out
and postponing the graduation.
11
4. Data, variables and method
Data
The data analysed in this paper is sourced from the five waves of Indagine
Longitudinale sulle Famiglie Italiane ILFI (Italian Household Longitudinal Survey), a
prospective panel conducted in 1997, 1999, 2001, 2003 and 2005 by a research team
coordinated by Prof. A. Schizzerotto. The 1997 wave asked retrospective information to
respondents, whereas the other waves contributed to update information on the same
respondents and collect retrospective data on first-time interviewed entered in the
sample after the first wave. ILFI was carried out on a representative sample of Italian
men and women aged 18 or older and residing in Italy at the moment of the interview.
The sample design was a stratified two-stage one. The 8,104 Italian municipalities were
taken as the PSUs and divided into 42 strata defined by two variables: region and
municipalities type (metropolitan, suburbs, other). The 12 metropolitan municipalities
were included in the sample with certainty as self-representing PSUs. Within each of
the remaining 30 strata, a random sample of municipalities was extracted with
probabilities proportional to the number of residents; on the whole 248 municipalities
were selected. After this, within each selected municipality a simple random sample of
households was extracted, using the registry list as a sampling frame; on the whole
4,637 households were selected. Within each household, all individuals aged 18 or older
were defined eligible for interview6. The overall sample of the five surveys is
constituted by 11,221 cases; since we consider in the analysis persons born between
1920 and 1970, the overall sample is 7,684 cases: 1,002 are members of upper classes
and 6,682 are members of lower classes. Since ILFI is based on a complex sample design
the calculation of uncertainty around estimates may be distorted. However, some
previous tests (Bernardi and Pisati 2002; Pisati and Schizzerotto 2002) have shown that
the design effect tends to be fairly small (ranging in most cases from 0.8 to 1.2);
therefore we decided not to incorporate sample design in the analysis.
6 More detailed information on the sample design are available in Bernardi and Pisati (2002).
12
Variables
There are six dependent variables in our analysis. Enrolments is the percentage of
people who enrolled at university and Graduates represents the percentage of people
who obtained laurea at university; both indicators are calculated on the whole
population. Transition rate is the percentage of students that engage in university after
obtained the Diploma (the degree obtained after having completed a 5-year programme
at high school). Drop-outs is the percentage of students who don’t complete their
studies and leave university without obtaining the laurea. Late graduates represents the
percentage of graduates who have obtained the degree after the formal end of the
attained program. We adopt a definition of ‘delay’ less constraining than the
administrative one. Defined fd the formal duration of the programme (in years) and ad
the years employed to obtain the degree, we consider the student x of faculty y as a
«late graduate» if adx>fdy+1. Index of delayed graduation is the ratio between the actual
duration of the studies and the formal duration of the attained programme (expressed in
a log-natural scale7), calculated on graduated students. In other words, late graduates
indicator is a measure of diffusion of the postponed graduation experience, whereas the
index of delayed graduation is a measure of the duration of the delay.
The independent variable is year of birth of respondents. We consider people who were
born between 1920 and 1970; by establishing the rough average age of enrolment at
university at 20 years old, our analysis covers people who attained tertiary education
between about 1940 and 1995.
Social origin corresponds to the father’s occupational class when the respondent was 14
years old. If the father was not present in the family at that time, social origin is
obtained by the mother’s or other major breadwinner’s occupational class. Social origin
is used to compare trends among different social categories; we use a simplified
dichotomic variable, dividing population in «upper classes» and «lower classes». The
first category includes bourgeoisie and white collar class, whereas the second category
embraces (agrarian and urban) working class and (agrarian and urban) petit bourgeoisie.
The dichotomization of social class is a problematic operation requiring further
explanations. The rationale of this choice is double. The first reason is pragmatic: we 7 The distribution of actual duration/programme duration ratio was very skewed, with a long tail on the right. The transformation in a log-natural scale modifies such distribution in a curve very similar to a Gaussian curve. Therefore we can use a linear regression model to predict the transformed index’s values.
13
need to estimate models on a sufficient amount of cases and a more articulated
definition of social class would not allows us to obtain reliable estimates, given the
small amount of Italians who have attained tertiary education during the 20th century.
The second motivation is that previous analyses on the same dataset (Triventi e
Trivellato 2007) have shown that the main differences in the participation in the
university system are between «intellectual workers», usually well educated
(bourgeoisie and white collar class), and manual workers, often less educated (petit
bourgeoisie and working class).
Statistical methods
The main objective of the paper is to analyse changes in university functioning along
the 20th century. To address this purpose we model the variation of some «university
performance indicators» according to the year of birth of respondents. As our aim is to
find appropriate functional forms that can approximate the relation between such
indicators and time, we have applied the fractional polynomials method8 (Royston and
Altman 1994). Fractional polynomials (FP) are a useful parametric method that models
the relation between a continuous predictor and a dependent variable without requiring a
specification of a pre-defined functional form. FP are able to model curvilinear relations
using a small number of parameters and providing a relative simple equation that
describes the fitted curve. It has been showed that FP usually give a better fit than
polynomials of the same degree and even of those of higher degree (Royston and
Altman 1997).
Put it briefly, the procedure works as follows: some terms of the form Xp are fitted
(equally to the selected polynomial’s degree), where the powers p are chosen from a
small predefined set P of integer or not integer values. By this way, the different
possible combinations of polynomial’s degrees and values of power provide a rich class
of possible functional forms, leading to a satisfactory fit to the data in many situations 8 In an exploratory phase of the analysis we have applied the lowess smoothing method to represent graphically trends of interest. Lowess smoothing is a nonparametric ‘local’ regression procedure which applies weighted least squares regression to fit a curve approximating the observed data, without requiring a previous specification of a global function. The calculated lowess smoothed curves (not reported in this paper) showed that trends under scrutiny are not linear; this means that a simple linear regression model cannot approximate adequately the relationships. Although lowess smoothing provides a good representation of the data, it does not produce a regression function that is easily represented with a mathematical equation. In order to overcome this limit we have applied fractional polynomials.
14
(Sauerbrei 2006). Following the standard procedure, we decided to estimate FP of
second degree, choosing values of p from the set { }3,2,1,5.0,0,5.0,1,2 −−−=P .
We elaborate six major models: each of them includes the year of birth as continuous
predictor, whereas the dependent variables are: 1) the probability of enrolment at
university in the whole population, 2) the probability of graduation in the whole
population, 3) the probability of enrolment at university among high school leavers, 4)
the probability of dropping-out among university students, 5) the probability of having a
delayed graduation among graduates, 6) the values of index of delayed graduation
among graduates.
We estimate logistic regression (1-5 models) and linear regression models (the sixth
model) to predict values of interest and 95% confidence interval generated from the best
fitting fractional polynomial. We represent these values on a line graphic, wherein the
x-axis contains the years of birth and y-axis contains the predicted values of dependent
variables. After this, we estimate the same models in two major social groups: people
coming from upper classes and those coming from lower classes.
5. Results
Participation and performances in Italian Higher Education
To give a summary overview of the trends of interest we present the results of the
analysis in a graphic form. As we said in the previous section, the predicted values
reported in these graphics are estimated by applying logistic and linear regression
models in which the functional form of the relation between the independent variable
(year of birth) and the dependent variables has been determined by the fractional
polynomials method9.
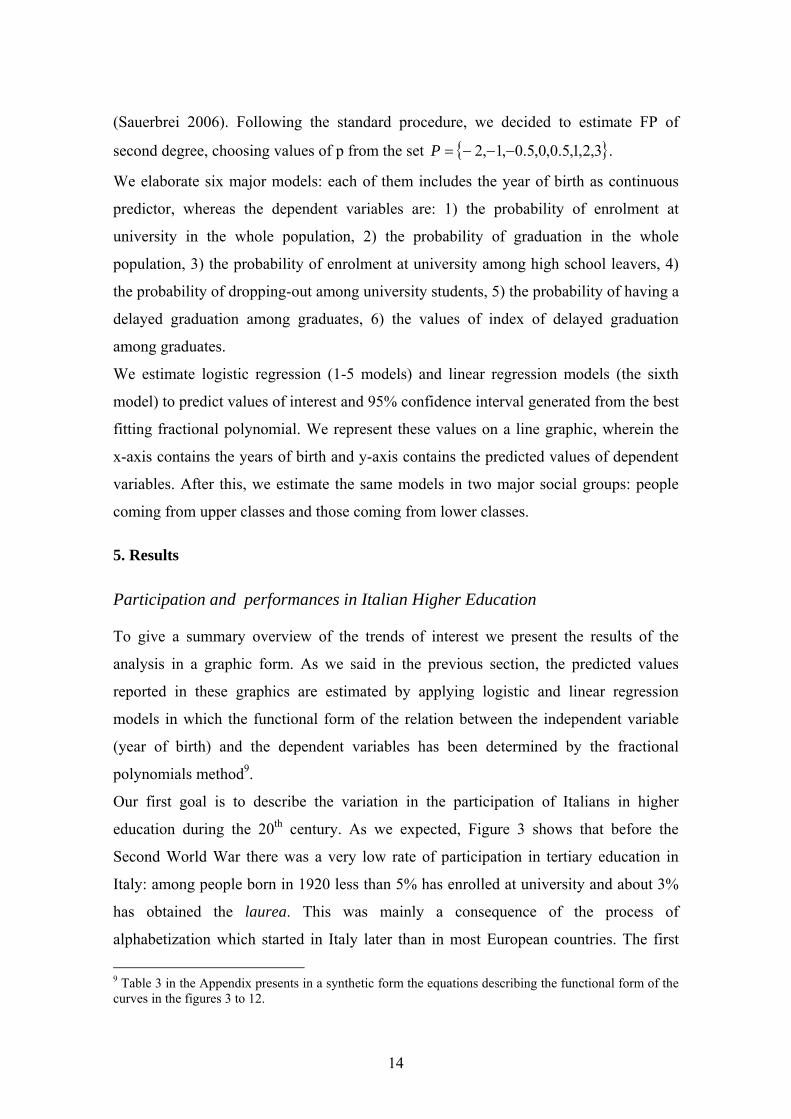
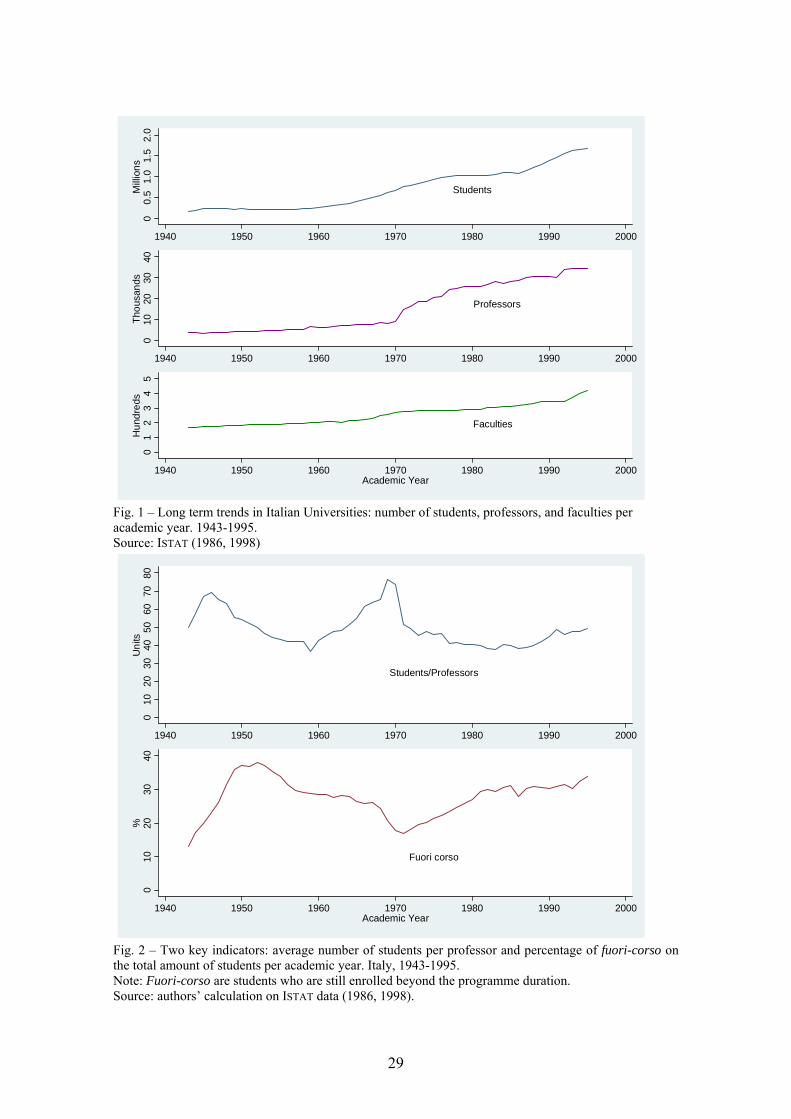
Our first goal is to describe the variation in the participation of Italians in higher
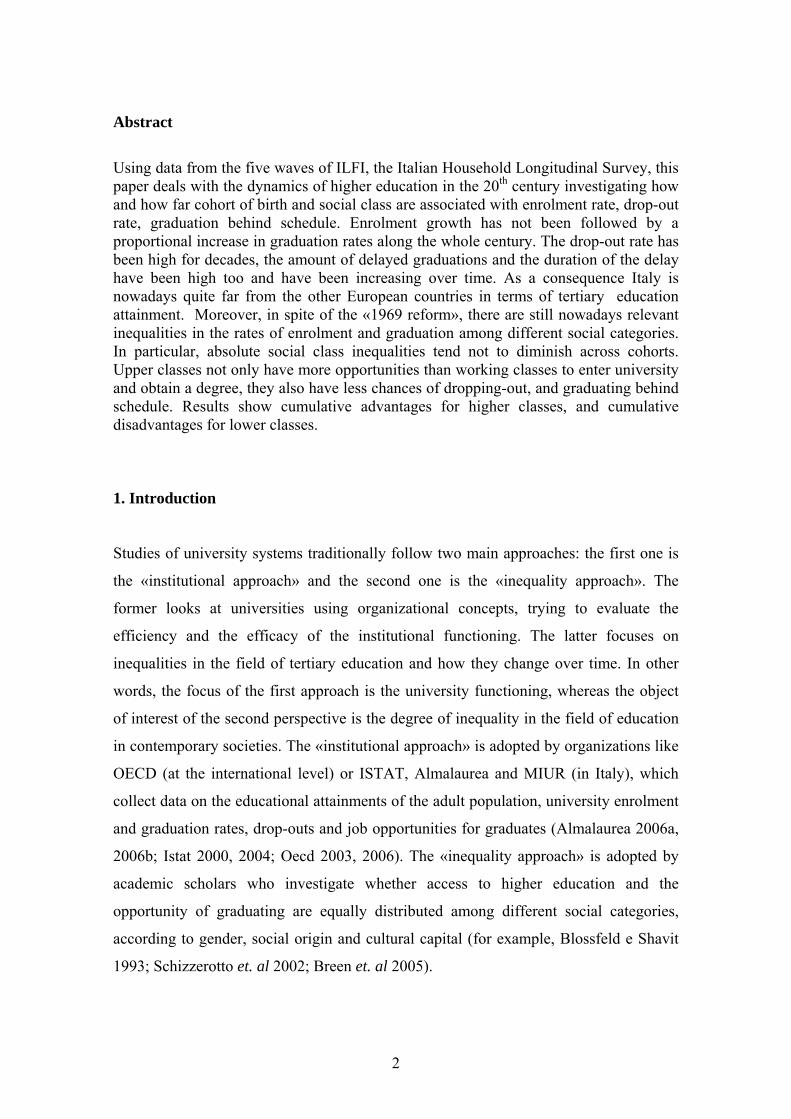
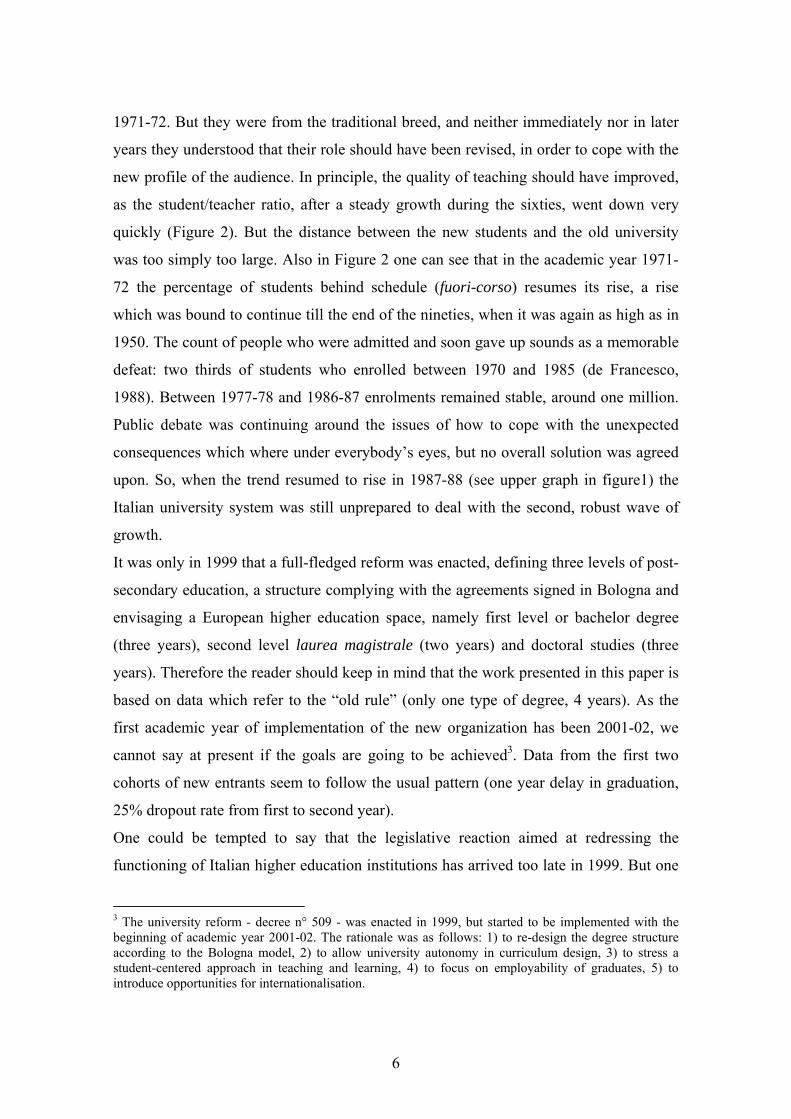
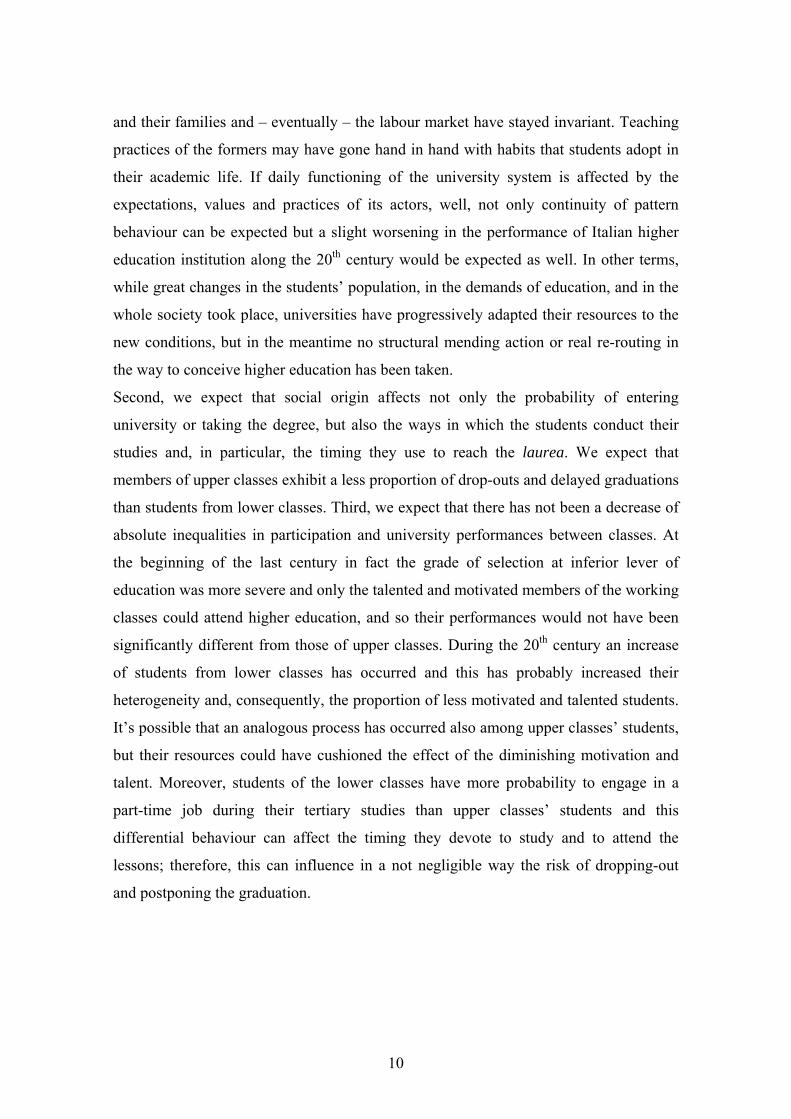
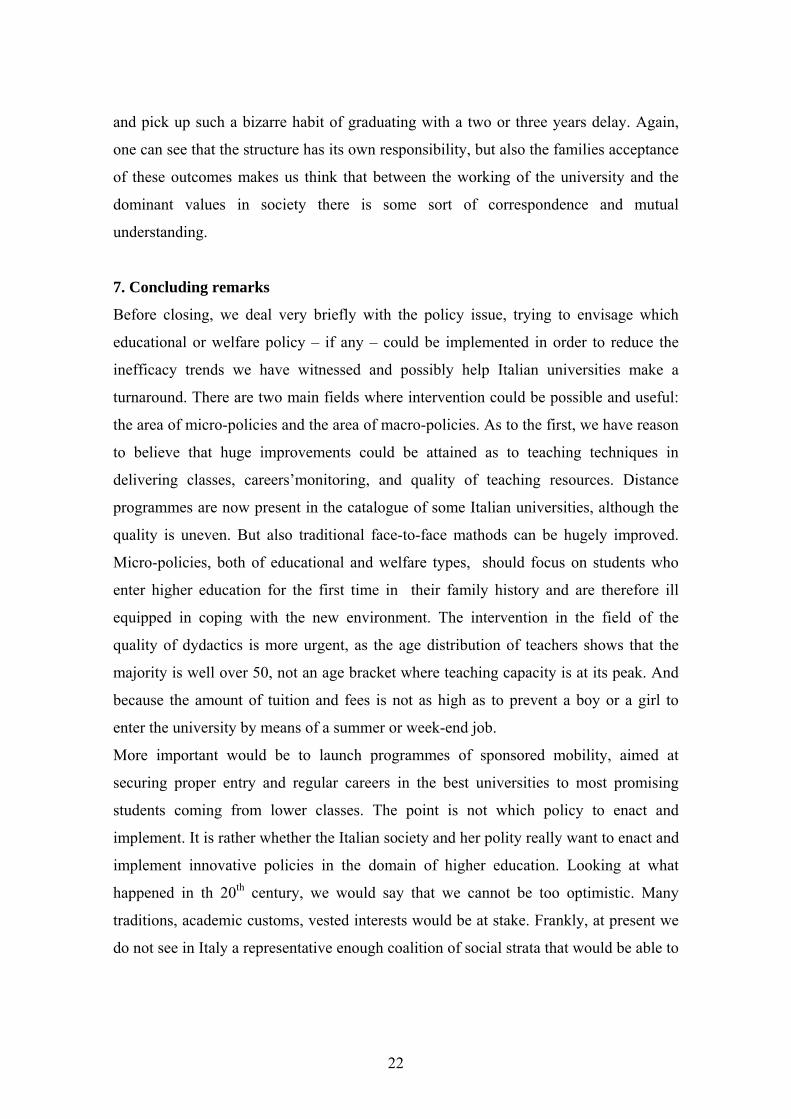
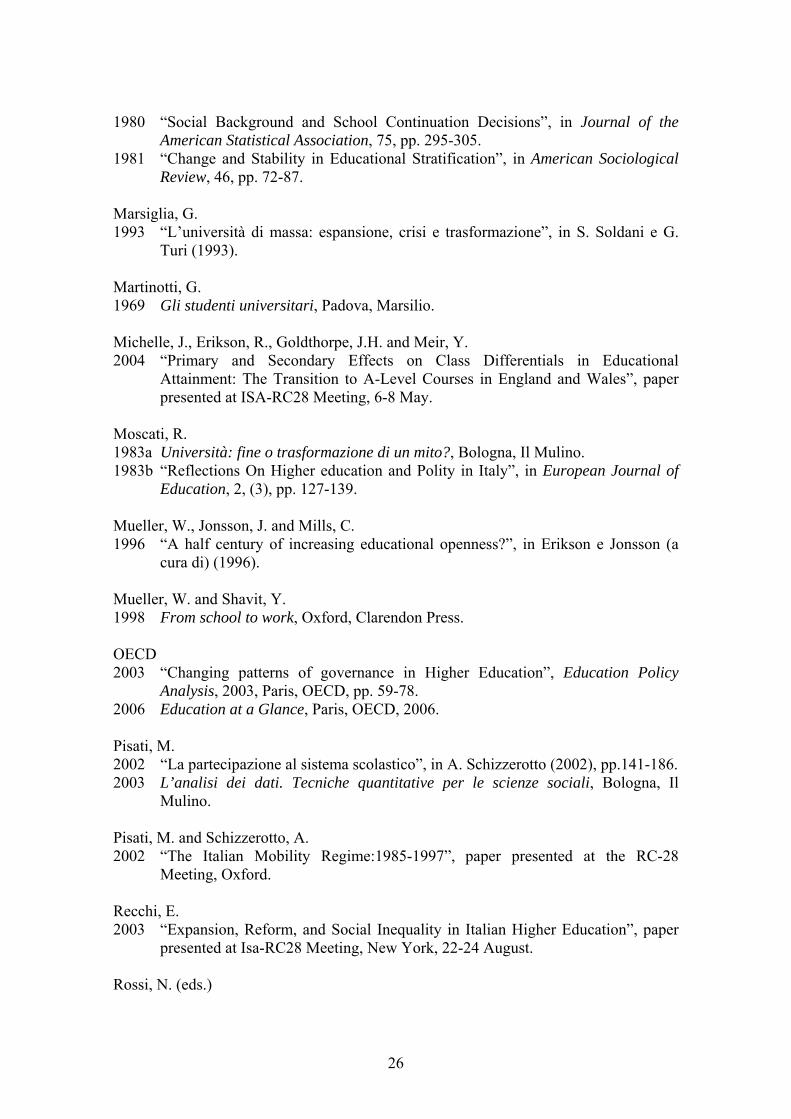
education during the 20th century. As we expected, Figure 3 shows that before the
Second World War there was a very low rate of participation in tertiary education in
Italy: among people born in 1920 less than 5% has enrolled at university and about 3%
has obtained the laurea. This was mainly a consequence of the process of
alphabetization which started in Italy later than in most European countries. The first
9 Table 3 in the Appendix presents in a synthetic form the equations describing the functional form of the curves in the figures 3 to 12.
15
curve presents an overall form fairly similar to a logistic curve, with a not pronounced
slope for the early years, a rapid increase in correspondence of the central values of the
predictor and, finally, a less pronounced slope. In substantial terms, this means that
people born between 1940 and 1960 have experienced a leap in the access to tertiary
education, while people born in the following period don’t show an analogous growth in
the enrolments. The second curve presents a shape similar to the previous one but a
different slope. Both curves show a growth but the graduates’ slope is less intense, and
therefore the absolute difference in graduation rates between people born in 1950 and
people born in 1970 is not very high (about five percentage points). As a consequence
of these trends, at the beginning of 90s about 30% of the population in ‘academic age’
enters university and about 15% graduates; as we can see these values are very low,
especially compared with other European countries’ results (see tab. 1), and this
represents a signal of a sort of empass of the Italian university system.
Figure 3 shows further interesting information: the difference between the proportion of
enrolments and graduates increased during the century, in fact the distance between the
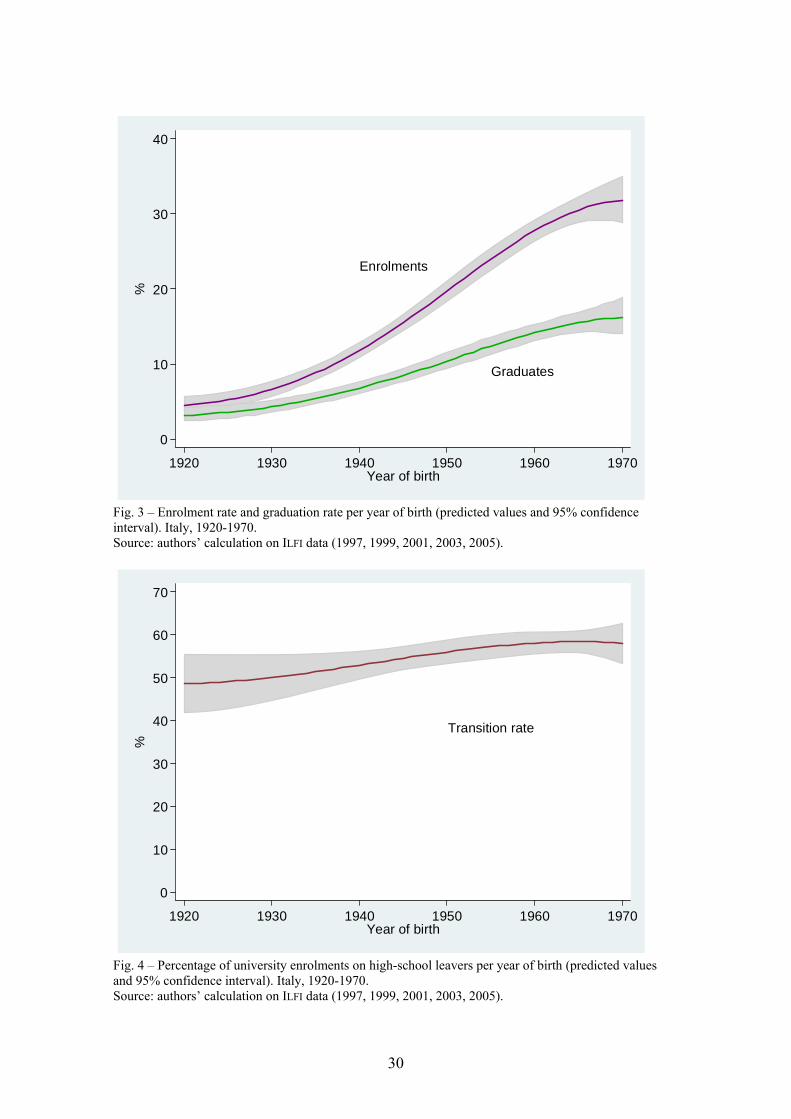
two lines becomes larger and larger. Looking at Figure 5, it is possible to find a piece of
evidence which is consistent with the trend shown in Figure 3: even though the
uncertainty around the estimate is not small, it seems that the percentage of drop-outs
increased during the ‘900. It must be noted that our starting hypothesis seems to be
confirmed: in fact, the problem of the high diffusion of drop-outs is far from being a
recent problem or an issue emerging after the 1969 reform. Among people born before
1950, in fact, the percentage of students who didn’t conclude with success their
academic course is between 30% and 40%. However, the worsening trend of drop-outs
seems to have been stopped among students born after 1960.
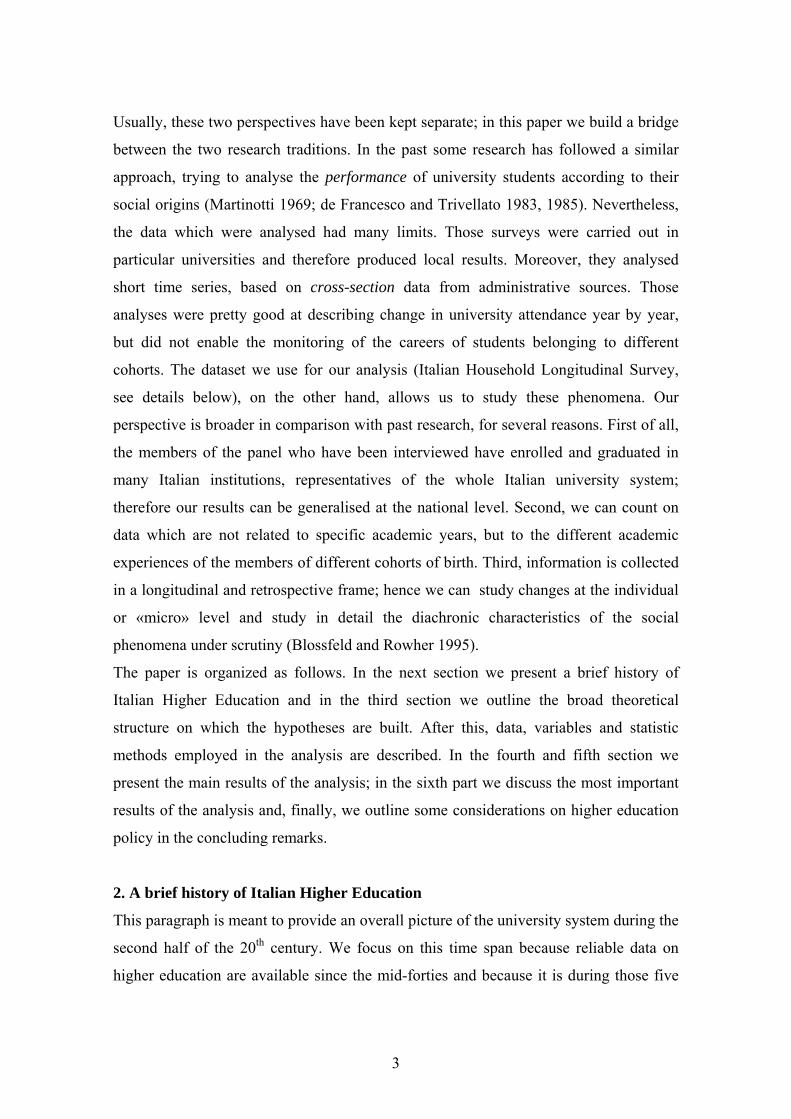
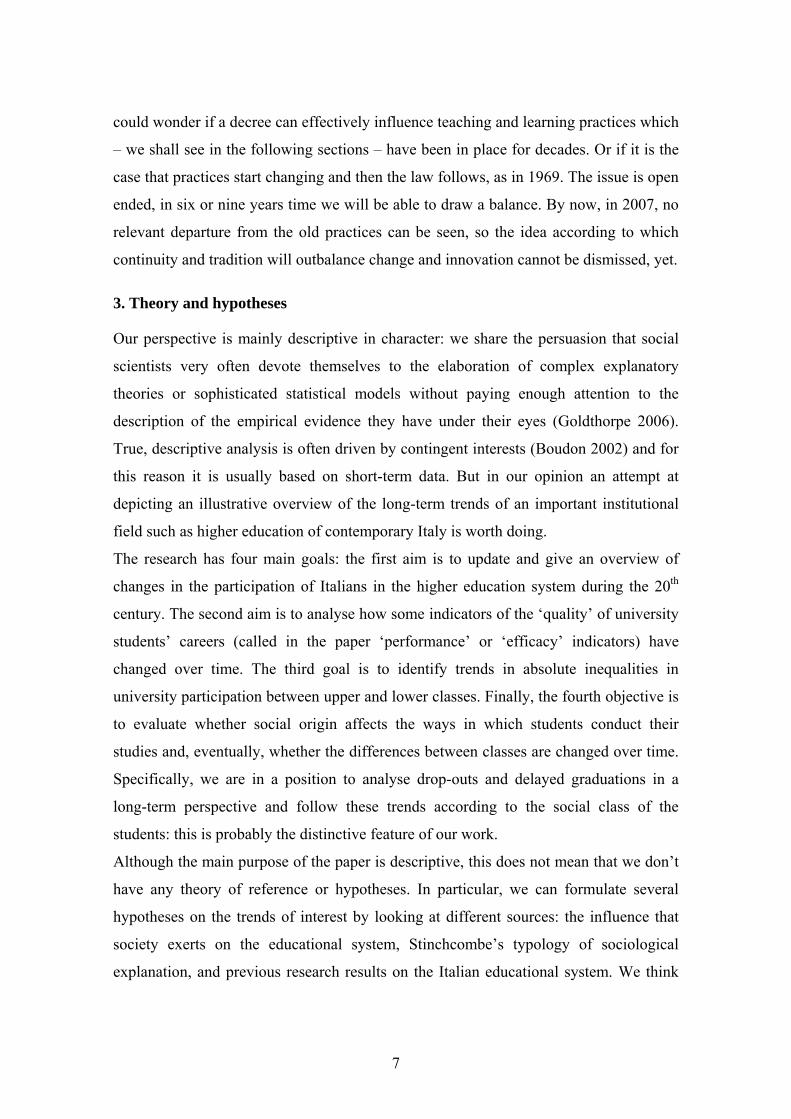
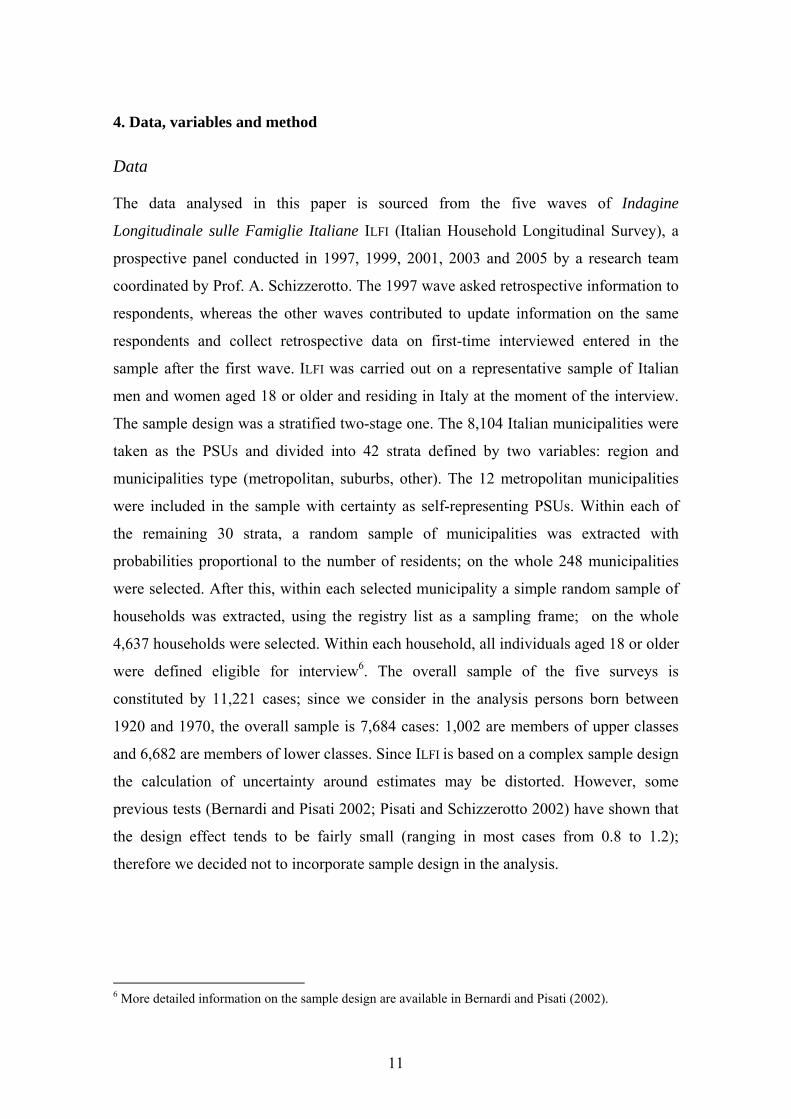
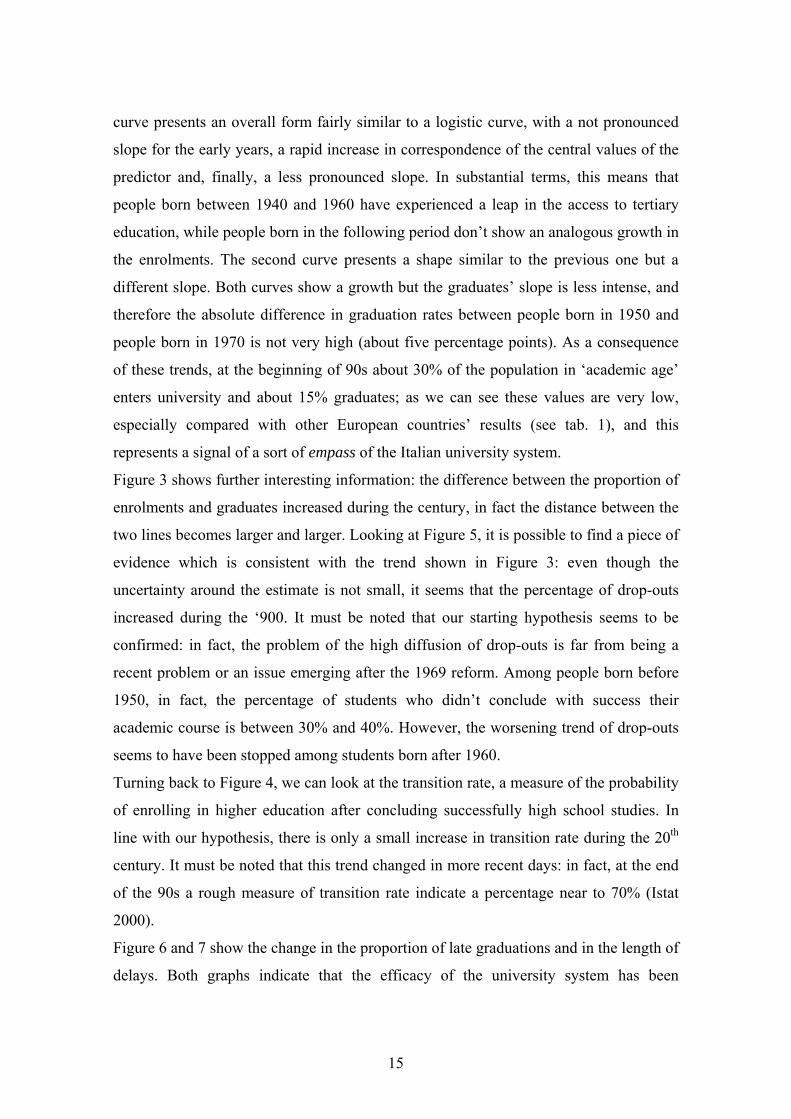
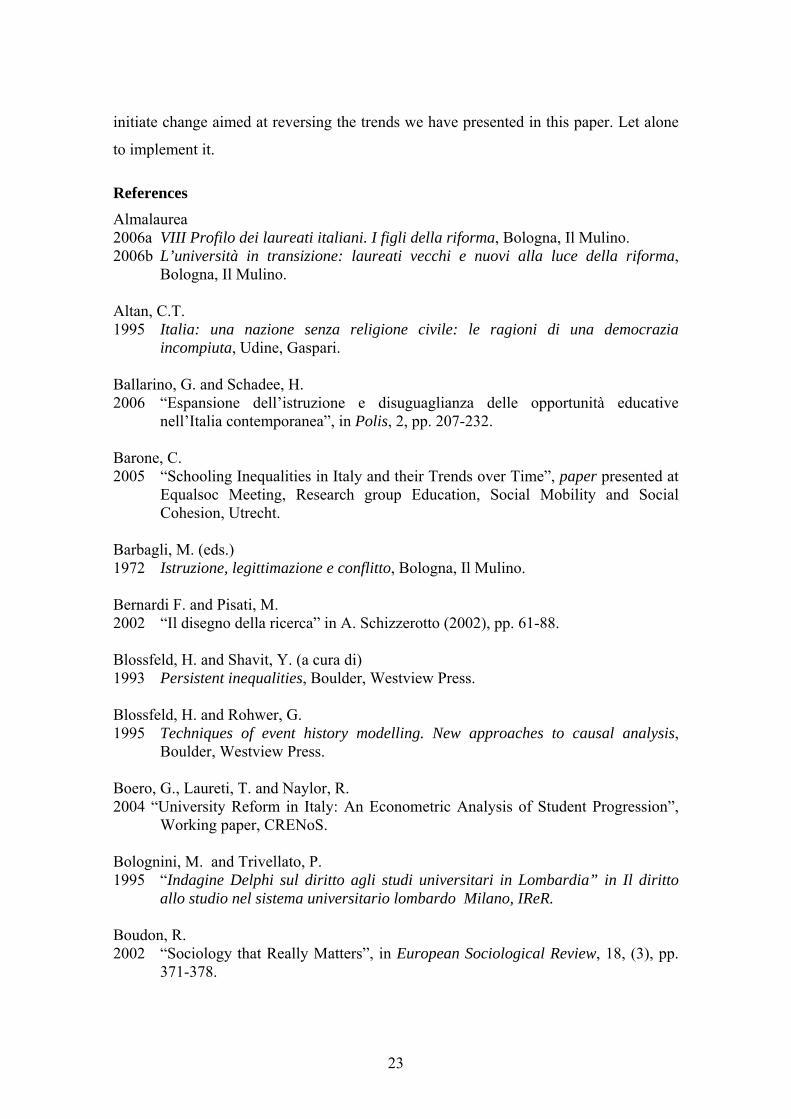
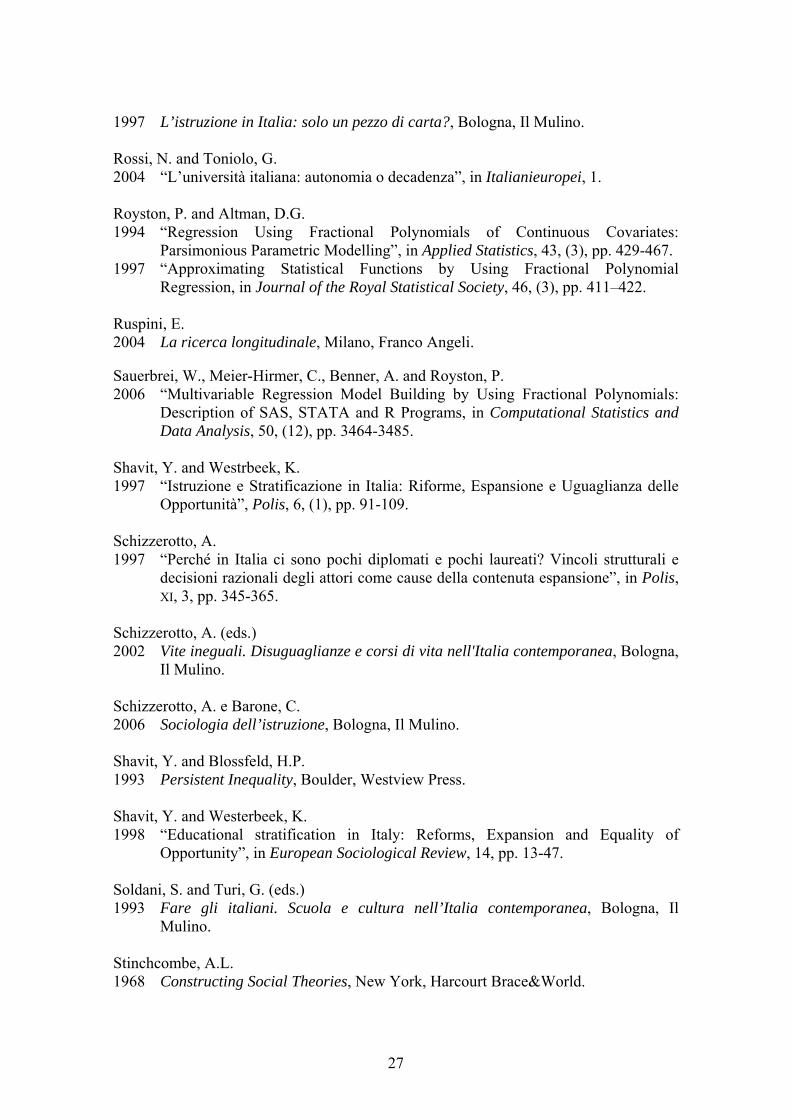
Turning back to Figure 4, we can look at the transition rate, a measure of the probability
of enrolling in higher education after concluding successfully high school studies. In
line with our hypothesis, there is only a small increase in transition rate during the 20th
century. It must be noted that this trend changed in more recent days: in fact, at the end
of the 90s a rough measure of transition rate indicate a percentage near to 70% (Istat
2000).
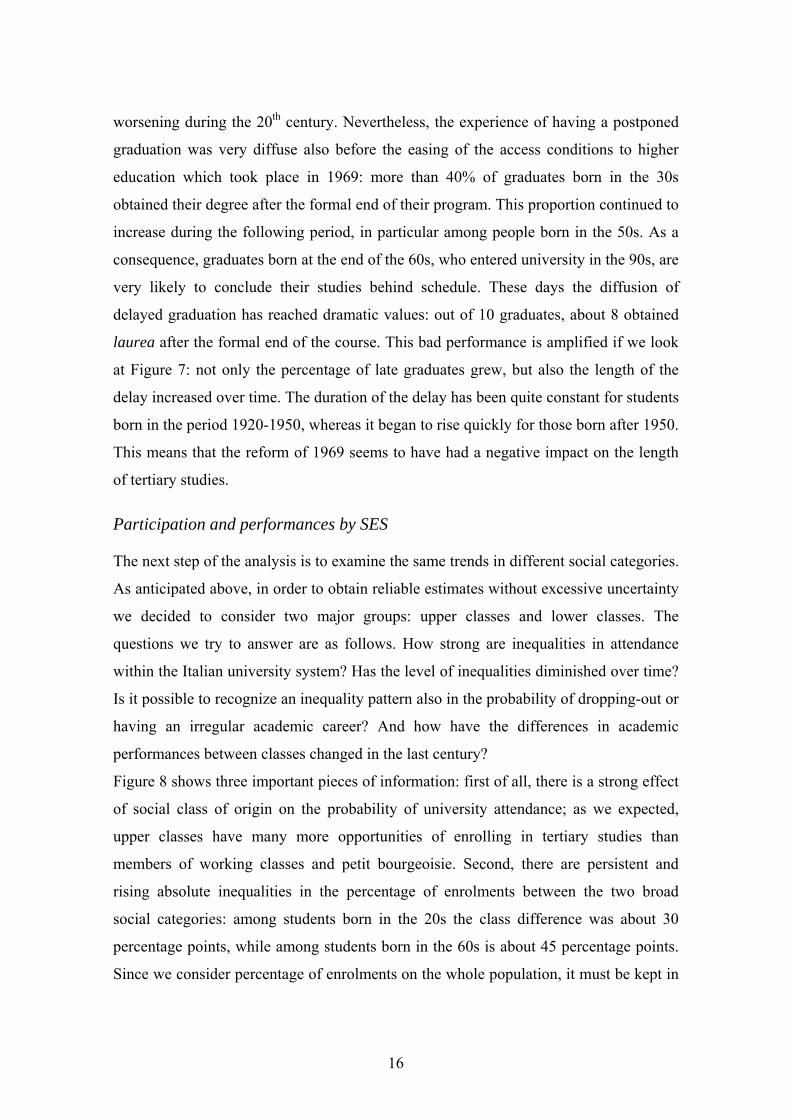
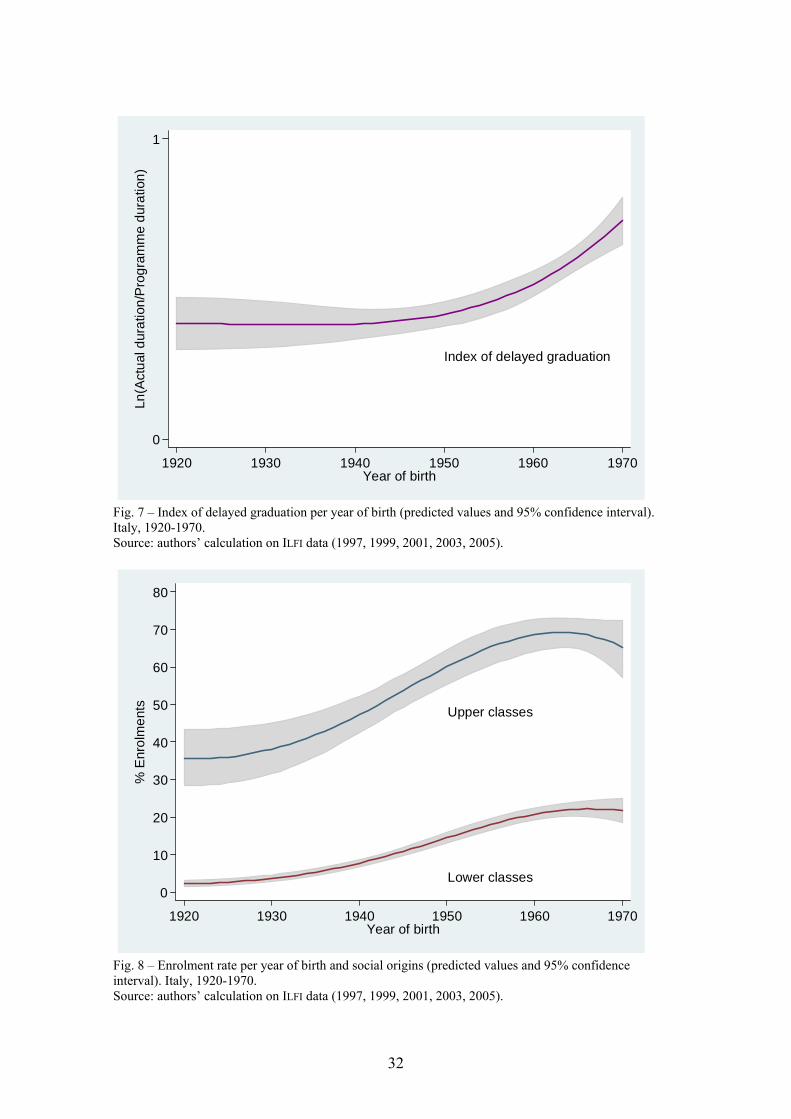
Figure 6 and 7 show the change in the proportion of late graduations and in the length of
delays. Both graphs indicate that the efficacy of the university system has been
16
worsening during the 20th century. Nevertheless, the experience of having a postponed
graduation was very diffuse also before the easing of the access conditions to higher
education which took place in 1969: more than 40% of graduates born in the 30s
obtained their degree after the formal end of their program. This proportion continued to
increase during the following period, in particular among people born in the 50s. As a
consequence, graduates born at the end of the 60s, who entered university in the 90s, are
very likely to conclude their studies behind schedule. These days the diffusion of
delayed graduation has reached dramatic values: out of 10 graduates, about 8 obtained
laurea after the formal end of the course. This bad performance is amplified if we look
at Figure 7: not only the percentage of late graduates grew, but also the length of the
delay increased over time. The duration of the delay has been quite constant for students
born in the period 1920-1950, whereas it began to rise quickly for those born after 1950.
This means that the reform of 1969 seems to have had a negative impact on the length
of tertiary studies.
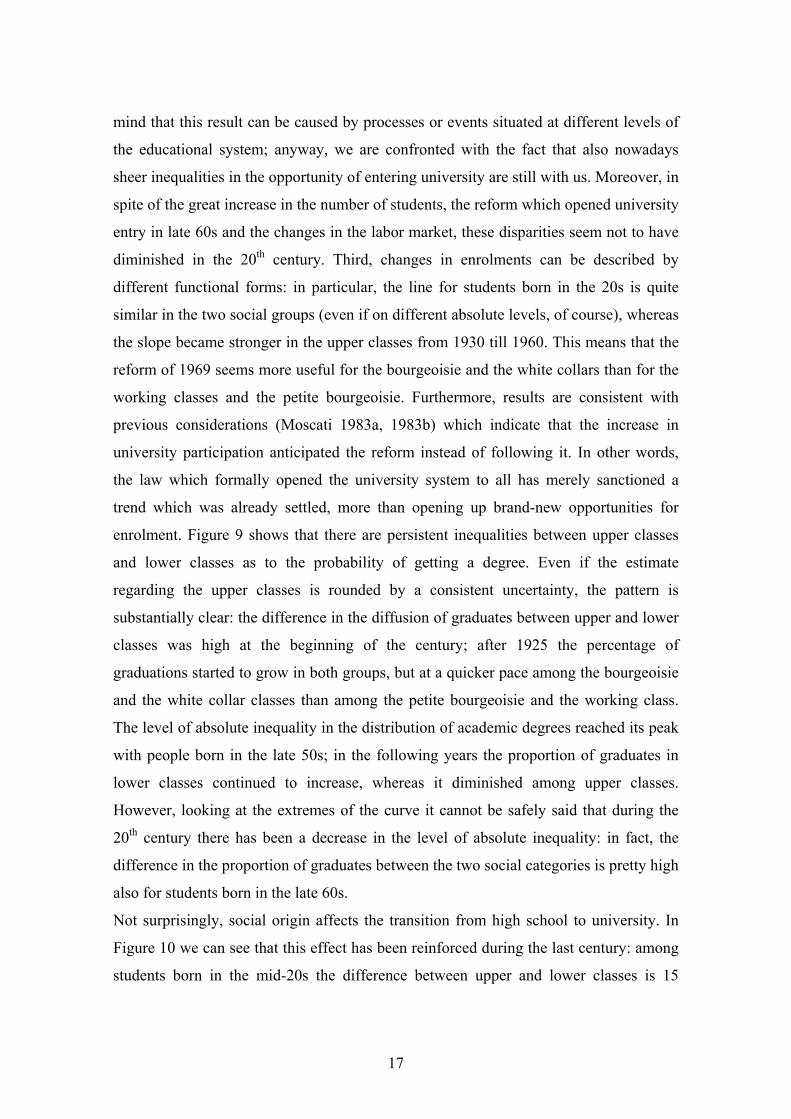
Participation and performances by SES
The next step of the analysis is to examine the same trends in different social categories.
As anticipated above, in order to obtain reliable estimates without excessive uncertainty
we decided to consider two major groups: upper classes and lower classes. The
questions we try to answer are as follows. How strong are inequalities in attendance
within the Italian university system? Has the level of inequalities diminished over time?
Is it possible to recognize an inequality pattern also in the probability of dropping-out or
having an irregular academic career? And how have the differences in academic
performances between classes changed in the last century?
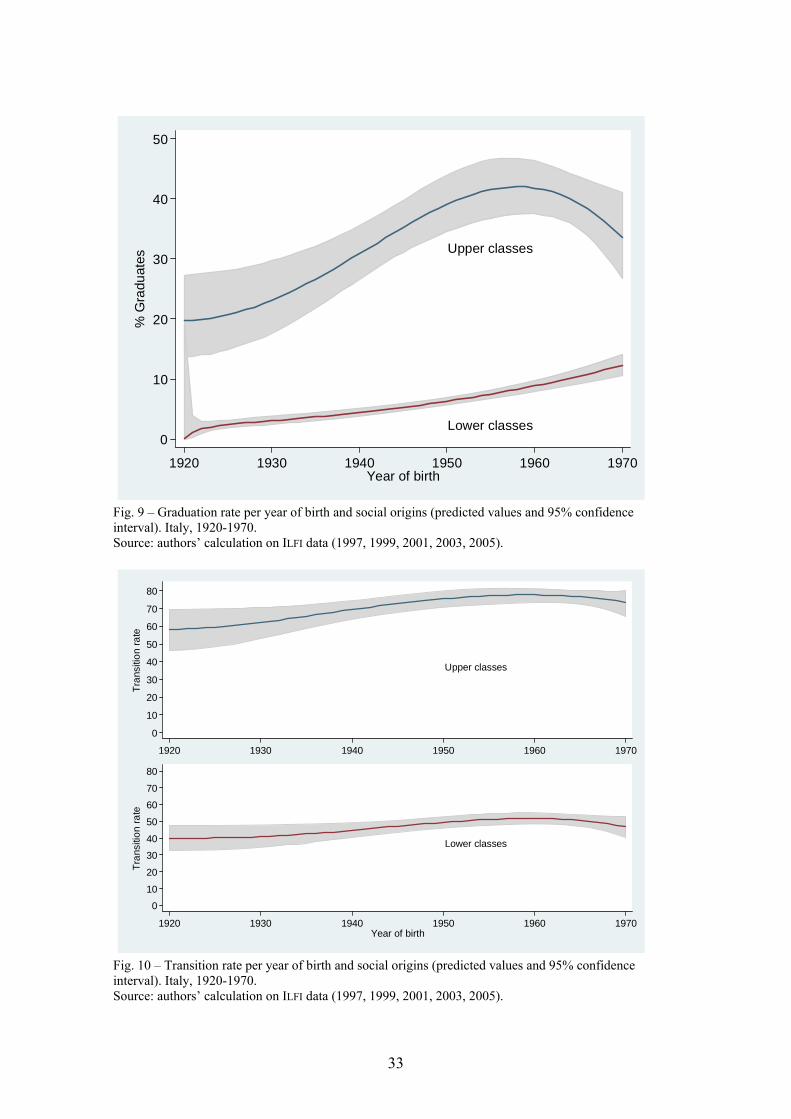
Figure 8 shows three important pieces of information: first of all, there is a strong effect
of social class of origin on the probability of university attendance; as we expected,
upper classes have many more opportunities of enrolling in tertiary studies than
members of working classes and petit bourgeoisie. Second, there are persistent and
rising absolute inequalities in the percentage of enrolments between the two broad
social categories: among students born in the 20s the class difference was about 30
percentage points, while among students born in the 60s is about 45 percentage points.
Since we consider percentage of enrolments on the whole population, it must be kept in
17
mind that this result can be caused by processes or events situated at different levels of
the educational system; anyway, we are confronted with the fact that also nowadays
sheer inequalities in the opportunity of entering university are still with us. Moreover, in
spite of the great increase in the number of students, the reform which opened university
entry in late 60s and the changes in the labor market, these disparities seem not to have
diminished in the 20th century. Third, changes in enrolments can be described by
different functional forms: in particular, the line for students born in the 20s is quite
similar in the two social groups (even if on different absolute levels, of course), whereas
the slope became stronger in the upper classes from 1930 till 1960. This means that the
reform of 1969 seems more useful for the bourgeoisie and the white collars than for the
working classes and the petite bourgeoisie. Furthermore, results are consistent with
previous considerations (Moscati 1983a, 1983b) which indicate that the increase in
university participation anticipated the reform instead of following it. In other words,
the law which formally opened the university system to all has merely sanctioned a
trend which was already settled, more than opening up brand-new opportunities for
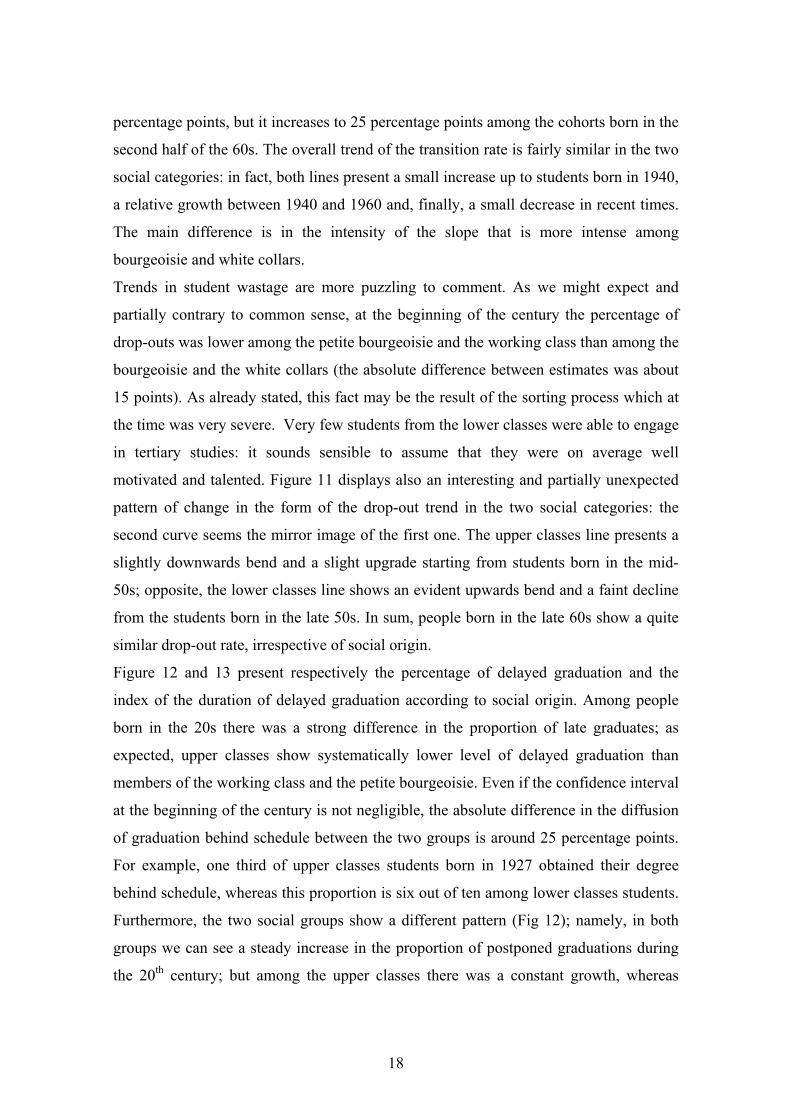
enrolment. Figure 9 shows that there are persistent inequalities between upper classes
and lower classes as to the probability of getting a degree. Even if the estimate
regarding the upper classes is rounded by a consistent uncertainty, the pattern is
substantially clear: the difference in the diffusion of graduates between upper and lower
classes was high at the beginning of the century; after 1925 the percentage of
graduations started to grow in both groups, but at a quicker pace among the bourgeoisie
and the white collar classes than among the petite bourgeoisie and the working class.
The level of absolute inequality in the distribution of academic degrees reached its peak
with people born in the late 50s; in the following years the proportion of graduates in
lower classes continued to increase, whereas it diminished among upper classes.
However, looking at the extremes of the curve it cannot be safely said that during the
20th century there has been a decrease in the level of absolute inequality: in fact, the
difference in the proportion of graduates between the two social categories is pretty high
also for students born in the late 60s.
Not surprisingly, social origin affects the transition from high school to university. In
Figure 10 we can see that this effect has been reinforced during the last century: among
students born in the mid-20s the difference between upper and lower classes is 15
18
percentage points, but it increases to 25 percentage points among the cohorts born in the
second half of the 60s. The overall trend of the transition rate is fairly similar in the two
social categories: in fact, both lines present a small increase up to students born in 1940,
a relative growth between 1940 and 1960 and, finally, a small decrease in recent times.
The main difference is in the intensity of the slope that is more intense among
bourgeoisie and white collars.
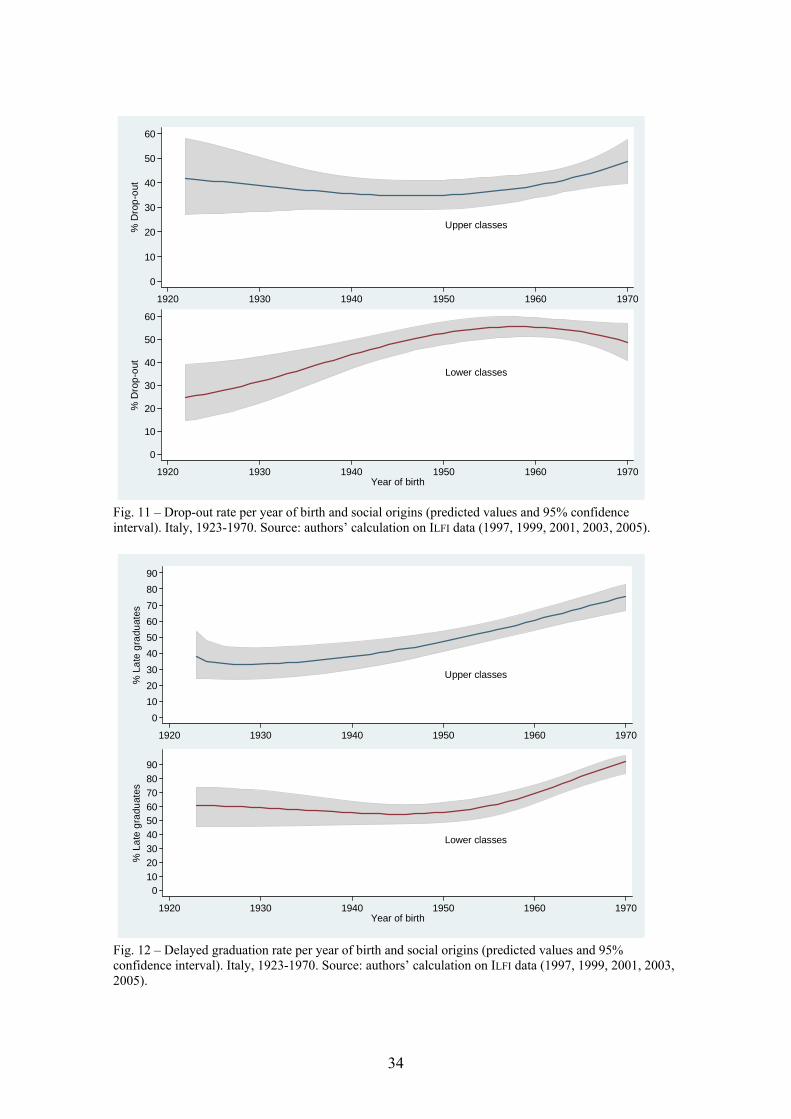
Trends in student wastage are more puzzling to comment. As we might expect and
partially contrary to common sense, at the beginning of the century the percentage of
drop-outs was lower among the petite bourgeoisie and the working class than among the
bourgeoisie and the white collars (the absolute difference between estimates was about
15 points). As already stated, this fact may be the result of the sorting process which at
the time was very severe. Very few students from the lower classes were able to engage
in tertiary studies: it sounds sensible to assume that they were on average well
motivated and talented. Figure 11 displays also an interesting and partially unexpected
pattern of change in the form of the drop-out trend in the two social categories: the
second curve seems the mirror image of the first one. The upper classes line presents a
slightly downwards bend and a slight upgrade starting from students born in the mid-
50s; opposite, the lower classes line shows an evident upwards bend and a faint decline
from the students born in the late 50s. In sum, people born in the late 60s show a quite
similar drop-out rate, irrespective of social origin.
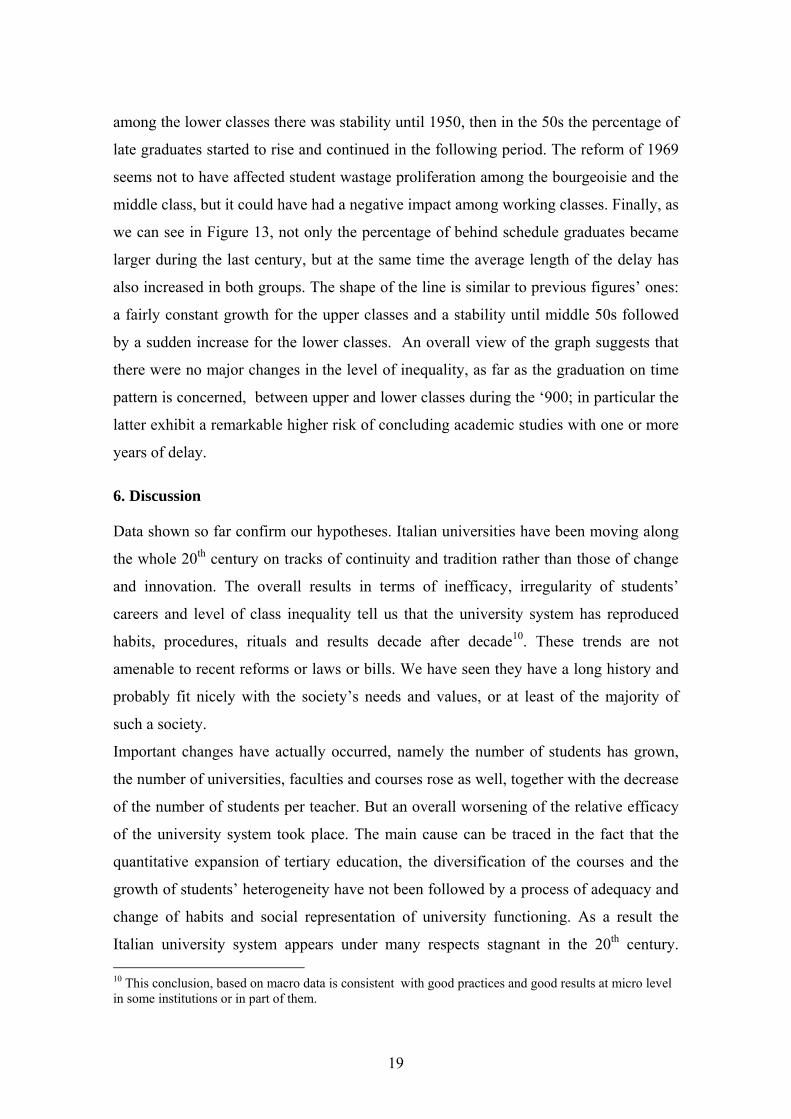
Figure 12 and 13 present respectively the percentage of delayed graduation and the
index of the duration of delayed graduation according to social origin. Among people
born in the 20s there was a strong difference in the proportion of late graduates; as
expected, upper classes show systematically lower level of delayed graduation than
members of the working class and the petite bourgeoisie. Even if the confidence interval
at the beginning of the century is not negligible, the absolute difference in the diffusion
of graduation behind schedule between the two groups is around 25 percentage points.
For example, one third of upper classes students born in 1927 obtained their degree
behind schedule, whereas this proportion is six out of ten among lower classes students.
Furthermore, the two social groups show a different pattern (Fig 12); namely, in both
groups we can see a steady increase in the proportion of postponed graduations during
the 20th century; but among the upper classes there was a constant growth, whereas
19
among the lower classes there was stability until 1950, then in the 50s the percentage of
late graduates started to rise and continued in the following period. The reform of 1969
seems not to have affected student wastage proliferation among the bourgeoisie and the
middle class, but it could have had a negative impact among working classes. Finally, as
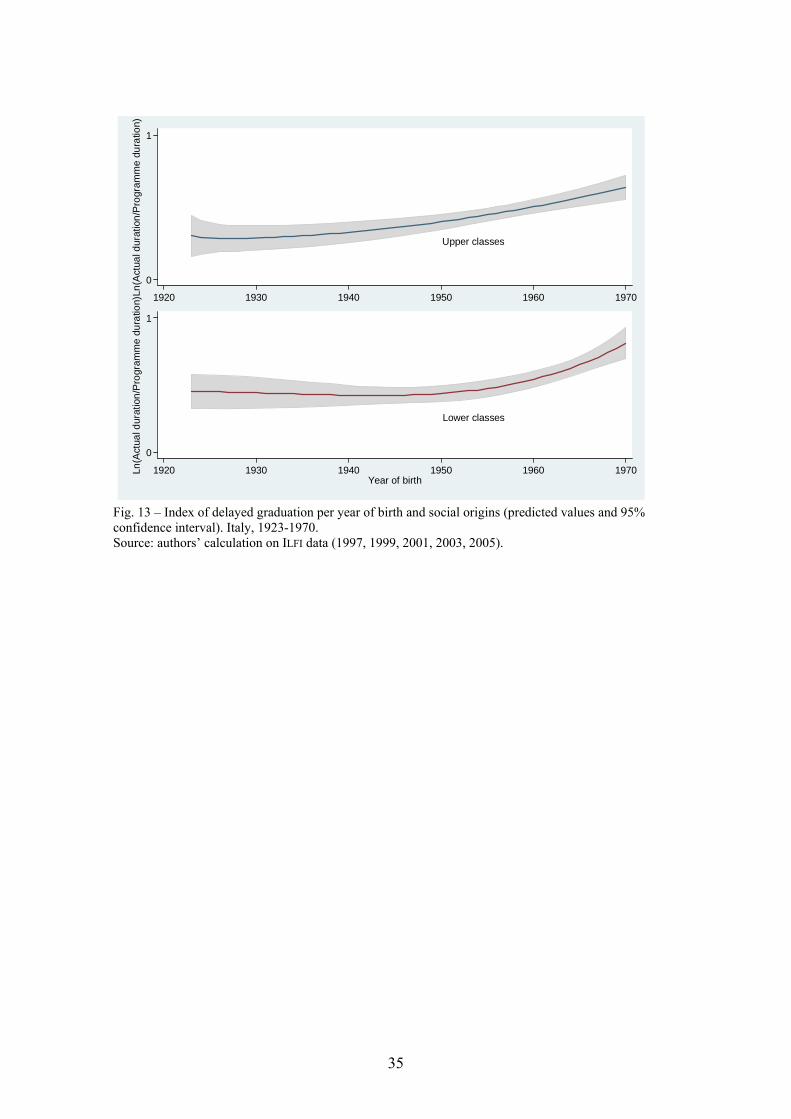
we can see in Figure 13, not only the percentage of behind schedule graduates became
larger during the last century, but at the same time the average length of the delay has
also increased in both groups. The shape of the line is similar to previous figures’ ones:
a fairly constant growth for the upper classes and a stability until middle 50s followed
by a sudden increase for the lower classes. An overall view of the graph suggests that
there were no major changes in the level of inequality, as far as the graduation on time
pattern is concerned, between upper and lower classes during the ‘900; in particular the
latter exhibit a remarkable higher risk of concluding academic studies with one or more
years of delay.
6. Discussion
Data shown so far confirm our hypotheses. Italian universities have been moving along
the whole 20th century on tracks of continuity and tradition rather than those of change
and innovation. The overall results in terms of inefficacy, irregularity of students’
careers and level of class inequality tell us that the university system has reproduced
habits, procedures, rituals and results decade after decade10. These trends are not
amenable to recent reforms or laws or bills. We have seen they have a long history and
probably fit nicely with the society’s needs and values, or at least of the majority of
such a society.
Important changes have actually occurred, namely the number of students has grown,
the number of universities, faculties and courses rose as well, together with the decrease
of the number of students per teacher. But an overall worsening of the relative efficacy
of the university system took place. The main cause can be traced in the fact that the
quantitative expansion of tertiary education, the diversification of the courses and the
growth of students’ heterogeneity have not been followed by a process of adequacy and
change of habits and social representation of university functioning. As a result the
Italian university system appears under many respects stagnant in the 20th century. 10 This conclusion, based on macro data is consistent with good practices and good results at micro level in some institutions or in part of them.
20
Continuity has overweighted change: the already low standards of ‘productivity’ of the
first part of the century have gone lower during the second part, confirming our
hypothesis.
Data show that enrolments in tertiary education increased, but we have to acknowledge
that the Italian university system has reached the third stage of Trow’s typology, «mass
entry», very late, between the end of the 80s and the beginning of the 90s. Such a late
growth has not been sufficiently rapid to bridge the gap with other Europeans countries.
Furthermore, during the past century only a small increase in the transition rate from
high school leavers to university took place. A large increase of the graduates output
would have been necessary, but only a small growth has occurred and there are signals
of a slowdown at the end of the century. As a result Italy is nowadays still lagging
behind her European counterparts as to the diffusion of degree holders. One can easily
understand the consequences for the functioning of the whole society, from the culture
domain to the economic sphere.
The unsatisfactory final results, we have seen, have their roots in a decline in the
efficacy of the university system; in particular an increase of drop-outs, behind schedule
graduations and a lengthening of average timing to gain the laurea. Data show that slow
academic careers and delayed graduations were present in the university system also
before the reform of 1969. The bill which allowed every high school diploma holder to
enter into higher education did not create these dysfunctions, at most it has aggravated
them, unwillingly. Again, long-term trends confirm our hypothesis of generalized
resilience to change inside the universities allowing room for persistence of career
patterns among university students. Much like in economic development, where if there
is no growth decline follows, overall results did not stay the same, they got worse.
Finally, the inequality issue. Higher education in Italy has been characterized by
persistent and in some cases rising absolute inequality in tertiary education attendance
and graduation. In particular, there was a great increase as to inequalities between upper
and lower social classes in the opportunity of enrolling, a slight increase in disparities in
the distribution of degrees and stability in the relative probability of entering tertiary
studies after leaving high school. Data confirm in large part the hypothesis of
cumulative inequalities in higher education. We can talk of cumulative inequalities in
two ways: on the one hand, in a diachronic fashion, social class inequalities come from
21
distant days and are reproducing themselves year after year. With a sort of slogan, we
can state that heavy inheritance of the past inevitably conditions the present. On the
other hand, there are not only inequalities in enrolments and graduations as traditional
research has shown, but also disparities in the way students conduct their studies. In
particular, the resources of the family of origin affect the risk of dropping-out, having a
postponed graduation and the duration of the delay in gaining the degree when this goal
is reached. If we consider that people entering higher education do not bear any
resemblance, as far as social class of origin is concerned, with the whole population and
got successfully through school selection processes, the persistence of differences at
university level appears still more relevant and difficult to accept on equity ground. The
explanation here could lie in the fact that students from lower classes take on full-time
jobs or part-time jobs more frequently than students from upper lasses and consequently
the formers devote piecemeal time to study activity compared wih the latter ones.
To sum up, in most cases inequalities haven’t declined during the last century, and this
is not a good piece of news, in spite of the fact that it sounds a confirmation of our
hypothesis: striking inequalities are surviving in spite of the rhetoric about equality of
opportunities and the shortage of graduates. It seems safe to assume that all this would
not be possible without a strong, although not conscious, backing from different strata
of the Italian society. Those who are better off do not disdain the advantage; those who
are worse off strive as much as they can, hoping that the legal validity of the degree they
will eventually gain will pay, with the little help of their friends, at least in the long run.
Well, the persistence of different sorts of inequality was predictable. What was not
expected and worries a little bit is the fact that where we spot a sign of a reduction of
absolute distance between social classes (as with late graduates’ indicator) this outcome
is the consequence not of an upgrade of lower classes students, but of bad performance
among upper classes students. This is only a clue of a more general process which
might have worked as follows. During the second part of the century, universities have
adopted less strict yardsticks, got looser in their operations in order to cope with huge
numbers and heterogeneous audiences. It was the easiest and cheapest way to react,
keeping “business as usual” would have cost a lot. But this solution might prove wrong
because it has not helped students from lower classes to catch up, and has encouraged a
bulk of children from upper classes to relax, avail themselves of this unexpected bonus
22
and pick up such a bizarre habit of graduating with a two or three years delay. Again,
one can see that the structure has its own responsibility, but also the families acceptance
of these outcomes makes us think that between the working of the university and the
dominant values in society there is some sort of correspondence and mutual
understanding.
7. Concluding remarks
Before closing, we deal very briefly with the policy issue, trying to envisage which
educational or welfare policy – if any – could be implemented in order to reduce the
inefficacy trends we have witnessed and possibly help Italian universities make a
turnaround. There are two main fields where intervention could be possible and useful:
the area of micro-policies and the area of macro-policies. As to the first, we have reason
to believe that huge improvements could be attained as to teaching techniques in
delivering classes, careers’monitoring, and quality of teaching resources. Distance
programmes are now present in the catalogue of some Italian universities, although the
quality is uneven. But also traditional face-to-face mathods can be hugely improved.
Micro-policies, both of educational and welfare types, should focus on students who
enter higher education for the first time in their family history and are therefore ill
equipped in coping with the new environment. The intervention in the field of the
quality of dydactics is more urgent, as the age distribution of teachers shows that the
majority is well over 50, not an age bracket where teaching capacity is at its peak. And
because the amount of tuition and fees is not as high as to prevent a boy or a girl to
enter the university by means of a summer or week-end job.
More important would be to launch programmes of sponsored mobility, aimed at
securing proper entry and regular careers in the best universities to most promising
students coming from lower classes. The point is not which policy to enact and
implement. It is rather whether the Italian society and her polity really want to enact and
implement innovative policies in the domain of higher education. Looking at what
happened in th 20th century, we would say that we cannot be too optimistic. Many
traditions, academic customs, vested interests would be at stake. Frankly, at present we
do not see in Italy a representative enough coalition of social strata that would be able to
23
initiate change aimed at reversing the trends we have presented in this paper. Let alone
to implement it.
References Almalaurea 2006a VIII Profilo dei laureati italiani. I figli della riforma, Bologna, Il Mulino. 2006b L’università in transizione: laureati vecchi e nuovi alla luce della riforma,
Bologna, Il Mulino. Altan, C.T. 1995 Italia: una nazione senza religione civile: le ragioni di una democrazia
incompiuta, Udine, Gaspari. Ballarino, G. and Schadee, H. 2006 “Espansione dell’istruzione e disuguaglianza delle opportunità educative
nell’Italia contemporanea”, in Polis, 2, pp. 207-232. Barone, C. 2005 “Schooling Inequalities in Italy and their Trends over Time”, paper presented at
Equalsoc Meeting, Research group Education, Social Mobility and Social Cohesion, Utrecht.
Barbagli, M. (eds.) 1972 Istruzione, legittimazione e conflitto, Bologna, Il Mulino. Bernardi F. and Pisati, M. 2002 “Il disegno della ricerca” in A. Schizzerotto (2002), pp. 61-88. Blossfeld, H. and Shavit, Y. (a cura di) 1993 Persistent inequalities, Boulder, Westview Press. Blossfeld, H. and Rohwer, G. 1995 Techniques of event history modelling. New approaches to causal analysis,
Boulder, Westview Press. Boero, G., Laureti, T. and Naylor, R. 2004 “University Reform in Italy: An Econometric Analysis of Student Progression”,
Working paper, CRENoS. Bolognini, M. and Trivellato, P. 1995 “Indagine Delphi sul diritto agli studi universitari in Lombardia” in Il diritto
allo studio nel sistema universitario lombardo Milano, IReR. Boudon, R. 2002 “Sociology that Really Matters”, in European Sociological Review, 18, (3), pp.
371-378.
24
Breen, R. and Jonsson, O. 2000 “Analyzing Educational Careers: A Multinomial Transition Model”, in
American Sociological Review, 65, (5), pp. 754-772. 2005 “Inequality of Opportunity in Comparative Perspective: Recent Research on
Educational Attainment and Mobility”, in Annual Review of Sociology 31, pp. 223-243.
Breen, R., Luijk, R., Mueller, W. and Pollak, R. 2005 “Non-Persistent Inequality in Educational Attainment: Evidence from eight
European Countries”, Paper presented at Isa-RC28meeting on Inequality and Mobility in Family, School, and Work, Los Angeles, 18-21 August.
Brint, S. 1999 Scuola e società, Bologna, Il Mulino; ed. orig. Schools and Societies, Thousands
Oaks, Pine Forge Press, 1998. Capano, G. 1998 La politica universitaria, Bologna, Il Mulino. 2000 L’università in Italia, Bologna, Il Mulino. Checchi, D. 1999 “University Education in Italy”, paper presented at XIV AIEL Conference, Milan,
7-8 ottobre. CNVSU 2006 Settimo rapporto sullo stato del sistema universitario. Cobalti, A. 1990 “Schooling Inequalities in Italy: Trends over Time”, in European Sociological
Review, 6, (3), pp. 199-214. Cobalti, A. and Schizzerotto, A. 1993 “Inequality of Educational Opportunity in Italy”, in Blossfeld e Shavit (1993). 1994 La mobilità sociale in Italia, Bologna, Il Mulino. Colombo, M. (eds.) 2005 Educazione e Mutamento, Roma, Bonanno. de Francesco, C. 2005 “Dati sull’istruzione superiore in Italia”, in M. Colombo (2005), pp. 77-90. de Francesco, C. and Trivellato, P. 1983 “Lo studente part-time”, in Quaderni della Regione Lombardia, 110, pp. 7-126. 1985 L'università incontrollata, Milano, FrancoAngeli. 2006 Università: cose da sapere, cose da fare, Apogeo, downloadable e-book at
http://www.apogeonline.com/libri/88-503-1040-4/ebook/libro della Loggia, E.G.
25
1998 L’identità italiana, Bologna, Il Mulino. Durkheim, E. 1969 L’Evolution pedagogique en France, Paris, Universitaires de France; orig.
ed.1938. Fondazione RUI 2005 “Le condizioni di vita e di studio degli studenti universitari. IV indagine Euro
Student”, Universitas quaderni, 19. Gattullo, M. and Visalberghi, A. 1986 La scuola italiana dal 1945 al 1983, Firenze, La Nuova Italia. Gasperoni, G. 1997 Il rendimento scolastico, Bologna, Il Mulino. Goldthorpe, J. 2006 Sulla sociologia, Bologna, Il Mulino; orig. ed. On Sociology. Numbers,
narratives, and the integration of research and theory, Oxford, Oxford University Press, 2000.
Hillmert, S. and Jacob, M. 2002 “Social Inequality in Higher Education: Is Vocational Training a Pathway
Leading or Away from University?”, in European Sociological Review, 19, (3), pp. 319-334.
Istat 2004 I laureati e lo studio. Inserimento professionale dei laureati – Indagine 2004,
downloadable at: http://www.istat.it/dati/catalogo/20070227_00/ 2000 Statistiche dell’istruzione universitaria, Roma, Istituto Nazionale di Statistica. Jacob, M. and Hillmert, S. 2003 “Social Origins and ‘Delayed’ Educational Careers”, paper presented at Isa –
RC28 Meeting on Social Stratification and Mobility, Tokio, 1-3 March. Levin, H.M. 1976 “Educational reform: its meaning?”, in M. Carnoy e H.M. Levin, H.M. (1976). Lucas, S. R. 2001 “Effectively Maintained Inequality: Education Transitions, Track Mobility, and
Social Background Effects”, in American Journal of Sociology, 106, (6), pp. 1642-1690.
Luzzatto, G. 1986 “I problemi universitari nelle prime otto legislature repubblicane”, in M. Gattullo
e A. Visalberghi (1986). Mare, R.
26
1980 “Social Background and School Continuation Decisions”, in Journal of the American Statistical Association, 75, pp. 295-305.
1981 “Change and Stability in Educational Stratification”, in American Sociological Review, 46, pp. 72-87.
Marsiglia, G. 1993 “L’università di massa: espansione, crisi e trasformazione”, in S. Soldani e G.
Turi (1993). Martinotti, G. 1969 Gli studenti universitari, Padova, Marsilio. Michelle, J., Erikson, R., Goldthorpe, J.H. and Meir, Y. 2004 “Primary and Secondary Effects on Class Differentials in Educational
Attainment: The Transition to A-Level Courses in England and Wales”, paper presented at ISA-RC28 Meeting, 6-8 May.
Moscati, R. 1983a Università: fine o trasformazione di un mito?, Bologna, Il Mulino. 1983b “Reflections On Higher education and Polity in Italy”, in European Journal of
Education, 2, (3), pp. 127-139. Mueller, W., Jonsson, J. and Mills, C. 1996 “A half century of increasing educational openness?”, in Erikson e Jonsson (a
cura di) (1996). Mueller, W. and Shavit, Y. 1998 From school to work, Oxford, Clarendon Press. OECD 2003 “Changing patterns of governance in Higher Education”, Education Policy
Analysis, 2003, Paris, OECD, pp. 59-78. 2006 Education at a Glance, Paris, OECD, 2006. Pisati, M. 2002 “La partecipazione al sistema scolastico”, in A. Schizzerotto (2002), pp.141-186. 2003 L’analisi dei dati. Tecniche quantitative per le scienze sociali, Bologna, Il
Mulino. Pisati, M. and Schizzerotto, A. 2002 “The Italian Mobility Regime:1985-1997”, paper presented at the RC-28
Meeting, Oxford. Recchi, E. 2003 “Expansion, Reform, and Social Inequality in Italian Higher Education”, paper
presented at Isa-RC28 Meeting, New York, 22-24 August. Rossi, N. (eds.)
27
1997 L’istruzione in Italia: solo un pezzo di carta?, Bologna, Il Mulino. Rossi, N. and Toniolo, G. 2004 “L’università italiana: autonomia o decadenza”, in Italianieuropei, 1. Royston, P. and Altman, D.G. 1994 “Regression Using Fractional Polynomials of Continuous Covariates:
Parsimonious Parametric Modelling”, in Applied Statistics, 43, (3), pp. 429-467. 1997 “Approximating Statistical Functions by Using Fractional Polynomial
Regression, in Journal of the Royal Statistical Society, 46, (3), pp. 411–422. Ruspini, E. 2004 La ricerca longitudinale, Milano, Franco Angeli. Sauerbrei, W., Meier-Hirmer, C., Benner, A. and Royston, P. 2006 “Multivariable Regression Model Building by Using Fractional Polynomials:
Description of SAS, STATA and R Programs, in Computational Statistics and Data Analysis, 50, (12), pp. 3464-3485.
Shavit, Y. and Westrbeek, K. 1997 “Istruzione e Stratificazione in Italia: Riforme, Espansione e Uguaglianza delle
Opportunità”, Polis, 6, (1), pp. 91-109. Schizzerotto, A. 1997 “Perché in Italia ci sono pochi diplomati e pochi laureati? Vincoli strutturali e
decisioni razionali degli attori come cause della contenuta espansione”, in Polis, XI, 3, pp. 345-365.
Schizzerotto, A. (eds.) 2002 Vite ineguali. Disuguaglianze e corsi di vita nell'Italia contemporanea, Bologna,
Il Mulino. Schizzerotto, A. e Barone, C. 2006 Sociologia dell’istruzione, Bologna, Il Mulino. Shavit, Y. and Blossfeld, H.P. 1993 Persistent Inequality, Boulder, Westview Press. Shavit, Y. and Westerbeek, K. 1998 “Educational stratification in Italy: Reforms, Expansion and Equality of
Opportunity”, in European Sociological Review, 14, pp. 13-47. Soldani, S. and Turi, G. (eds.) 1993 Fare gli italiani. Scuola e cultura nell’Italia contemporanea, Bologna, Il
Mulino. Stinchcombe, A.L. 1968 Constructing Social Theories, New York, Harcourt Brace&World.
28
Trivellato, P. 2005a “Same train, different coaches: highlights on private higher education in Italy”,
Paper presented at UNESCO-CEPES Conference on Higher Education in Europe and Quality Assurance and Accreditation from the Perspective of the Bologna Process Objectives, Varsavia, 3 – 5 November.
2005b “Come cambiano gli indicatori per le politiche scolastiche”, in M. Colombo (2005), pp. 91-104.
Triventi, M. and Trivellato, P. 2007 “Le onde lunghe dell’università italiana. Com’è cambiata la partecipazione al sistema universitario nel corso del ‘900”, submitted to Polis. Turi, P. 1982 Università: le fasi di una crisi, Firenze, Opera Universitaria. Turner, R.H. 1972 “Mobilità cooptativa e competitiva e sistemi scolastici: Inghilterra e Stati Uniti”,
in Barbagli (1972), pp. 211-232. van de Wefhorst, H.G. and Luijkx, R. 2005 “Inequality Maintained through Horizontal Educational Choices in the
Netherlands: A cohort Comparison”, paper presented at Equalsoc Workshop, Research group Education, Social Mobility and Social Cohesion, Mannheim, 2-3 December.
Figures
29
Students
00.
51.
01.
52.
0M
illio
ns
1940 1950 1960 1970 1980 1990 2000
Professors
010
2030
40Th
ousa
nds
1940 1950 1960 1970 1980 1990 2000
Faculties
01
23
45
Hun
dred
s
1940 1950 1960 1970 1980 1990 2000Academic Year
Fig. 1 – Long term trends in Italian Universities: number of students, professors, and faculties per academic year. 1943-1995. Source: ISTAT (1986, 1998)
Students/Professors
010
2030
4050
6070
80U
nits
1940 1950 1960 1970 1980 1990 2000
Fuori corso
010
2030
40%
1940 1950 1960 1970 1980 1990 2000Academic Year
Fig. 2 – Two key indicators: average number of students per professor and percentage of fuori-corso on the total amount of students per academic year. Italy, 1943-1995. Note: Fuori-corso are students who are still enrolled beyond the programme duration. Source: authors’ calculation on ISTAT data (1986, 1998).
30
Enrolments
Graduates
0
10
20
30
40%
1920 1930 1940 1950 1960 1970Year of birth
Fig. 3 – Enrolment rate and graduation rate per year of birth (predicted values and 95% confidence interval). Italy, 1920-1970. Source: authors’ calculation on ILFI data (1997, 1999, 2001, 2003, 2005).
Transition rate
0
10
20
30
40
50
60
70
%
1920 1930 1940 1950 1960 1970Year of birth
Fig. 4 – Percentage of university enrolments on high-school leavers per year of birth (predicted values and 95% confidence interval). Italy, 1920-1970. Source: authors’ calculation on ILFI data (1997, 1999, 2001, 2003, 2005).
31
Drop-outs
0
10
20
30
40
50
60%
1920 1930 1940 1950 1960 1970Year of birth
Fig. 5 – Drop-out rate per year of birth (predicted values and 95% confidence interval). Italy, 1920-1970. Source: authors’ calculation on ILFI data (1997, 1999, 2001, 2003, 2005).
Late graduates
0
10
20
30
40
50
60
70
80
90
%
1920 1930 1940 1950 1960 1970Year of birth
Fig. 6 – Delayed graduation rate per year of birth (predicted values and 95% confidence interval). Italy, 1922-1970. Source: authors’ calculation on ILFI data (1997, 1999, 2001, 2003, 2005).
32
Index of delayed graduation
0
1Ln
(Act
ual d
urat
ion/
Pro
gram
me
dura
tion)
1920 1930 1940 1950 1960 1970Year of birth
Fig. 7 – Index of delayed graduation per year of birth (predicted values and 95% confidence interval). Italy, 1920-1970. Source: authors’ calculation on ILFI data (1997, 1999, 2001, 2003, 2005).
Upper classes
Lower classes0
10
20
30
40
50
60
70
80
% E
nrol
men
ts
1920 1930 1940 1950 1960 1970Year of birth
Fig. 8 – Enrolment rate per year of birth and social origins (predicted values and 95% confidence interval). Italy, 1920-1970. Source: authors’ calculation on ILFI data (1997, 1999, 2001, 2003, 2005).
33
Upper classes
Lower classes0
10
20
30
40
50%
Gra
duat
es
1920 1930 1940 1950 1960 1970Year of birth
Fig. 9 – Graduation rate per year of birth and social origins (predicted values and 95% confidence interval). Italy, 1920-1970. Source: authors’ calculation on ILFI data (1997, 1999, 2001, 2003, 2005).
Upper classes
0
10
20
30
40
50
60
70
80
Tran
sitio
n ra
te
1920 1930 1940 1950 1960 1970
Lower classes
0
10
20
30
40
50
60
70
80
Tran
sitio
n ra
te
1920 1930 1940 1950 1960 1970Year of birth
Fig. 10 – Transition rate per year of birth and social origins (predicted values and 95% confidence interval). Italy, 1920-1970. Source: authors’ calculation on ILFI data (1997, 1999, 2001, 2003, 2005).
34
Upper classes
0
10
20
30
40
50
60%
Dro
p-ou
t
1920 1930 1940 1950 1960 1970
Lower classes
0
10
20
30
40
50
60
% D
rop-
out
1920 1930 1940 1950 1960 1970Year of birth
Fig. 11 – Drop-out rate per year of birth and social origins (predicted values and 95% confidence interval). Italy, 1923-1970. Source: authors’ calculation on ILFI data (1997, 1999, 2001, 2003, 2005).
Upper classes
0102030405060708090
% L
ate
grad
uate
s
1920 1930 1940 1950 1960 1970
Lower classes
0102030405060708090
% L
ate
grad
uate
s
1920 1930 1940 1950 1960 1970Year of birth
Fig. 12 – Delayed graduation rate per year of birth and social origins (predicted values and 95% confidence interval). Italy, 1923-1970. Source: authors’ calculation on ILFI data (1997, 1999, 2001, 2003, 2005).
35
Upper classes
0
1Ln
(Act
ual d
urat
ion/
Pro
gram
me
dura
tion)
1920 1930 1940 1950 1960 1970
Lower classes
0
1
Ln(A
ctua
l dur
atio
n/P
rogr
amm
e du
ratio
n)
1920 1930 1940 1950 1960 1970Year of birth
Fig. 13 – Index of delayed graduation per year of birth and social origins (predicted values and 95% confidence interval). Italy, 1923-1970. Source: authors’ calculation on ILFI data (1997, 1999, 2001, 2003, 2005).
36
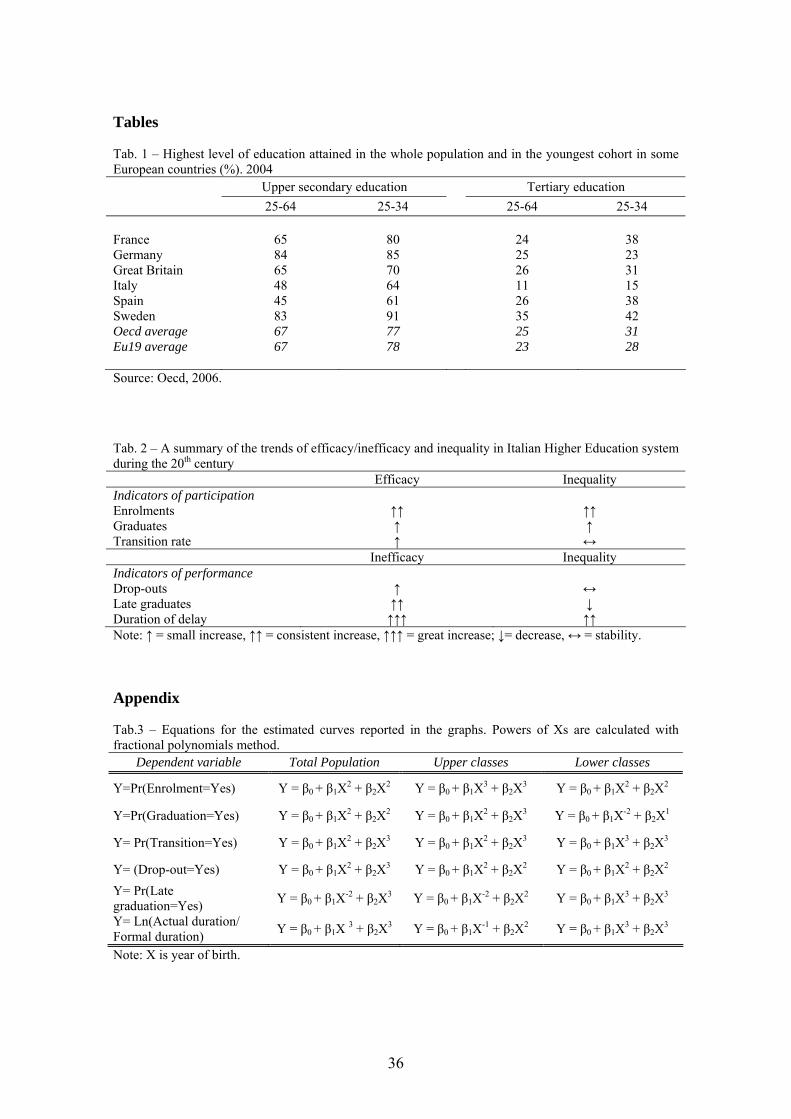
Tables Tab. 1 – Highest level of education attained in the whole population and in the youngest cohort in some European countries (%). 2004
Upper secondary education Tertiary education 25-64 25-34 25-64 25-34
France 65 80 24 38 Germany 84 85 25 23 Great Britain 65 70 26 31 Italy 48 64 11 15 Spain 45 61 26 38 Sweden 83 91 35 42 Oecd average 67 77 25 31 Eu19 average 67 78 23 28 Source: Oecd, 2006. Tab. 2 – A summary of the trends of efficacy/inefficacy and inequality in Italian Higher Education system during the 20th century Efficacy Inequality Indicators of participation Enrolments ↑↑ ↑↑ Graduates ↑ ↑ Transition rate ↑ ↔ Inefficacy Inequality Indicators of performance Drop-outs ↑ ↔ Late graduates ↑↑ ↓ Duration of delay ↑↑↑ ↑↑ Note: ↑ = small increase, ↑↑ = consistent increase, ↑↑↑ = great increase; ↓= decrease, ↔ = stability. Appendix Tab.3 – Equations for the estimated curves reported in the graphs. Powers of Xs are calculated with fractional polynomials method.
Note: X is year of birth.
Dependent variable Total Population Upper classes Lower classes
Y=Pr(Enrolment=Yes) Y = β0 + β1X2 + β2X2 Y = β0 + β1X3 + β2X3 Y = β0 + β1X2 + β2X2
Y=Pr(Graduation=Yes) Y = β0 + β1X2 + β2X2 Y = β0 + β1X2 + β2X3 Y = β0 + β1X-2 + β2X1
Y= Pr(Transition=Yes) Y = β0 + β1X2 + β2X3 Y = β0 + β1X2 + β2X3 Y = β0 + β1X3 + β2X3
Y= (Drop-out=Yes) Y = β0 + β1X2 + β2X3 Y = β0 + β1X2 + β2X2 Y = β0 + β1X2 + β2X2 Y= Pr(Late graduation=Yes) Y = β0 + β1X-2 + β2X3 Y = β0 + β1X-2 + β2X2 Y = β0 + β1X3 + β2X3
Y= Ln(Actual duration/ Formal duration) Y = β0 + β1X 3 + β2X3 Y = β0 + β1X-1 + β2X2 Y = β0 + β1X3 + β2X3
Recommended