©2015 Morningstar, Inc. All rights reserved.
Andy Tang, CFA
@QWAFAFEW Pittsburgh
June 9th, 2015
The Wisdom of Crowds - Random Forest™ and Morningstar Quant Equity Rating
Agenda
2
gRandom Forest™ methodology
gMorningstar Quant Equity Rating
gQ&A
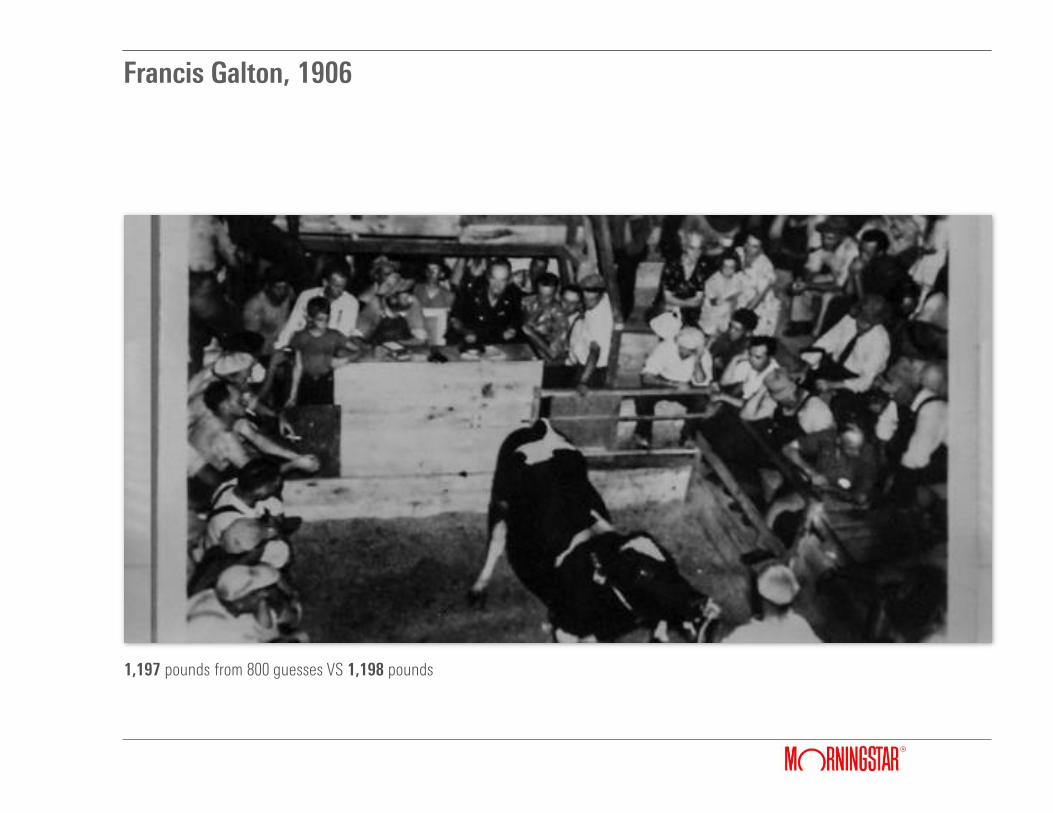
Francis Galton, 1906
1,197 pounds from 800 guesses VS 1,198 pounds
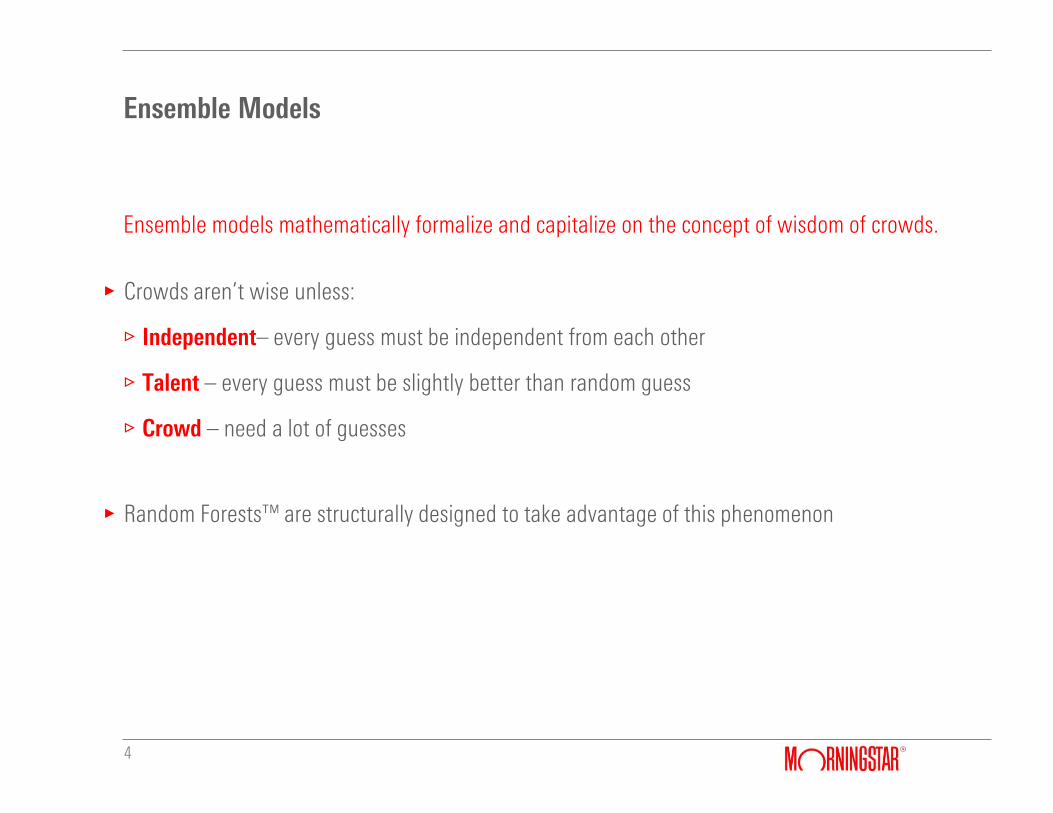
Ensemble Models
4
gCrowds aren’t wise unless:
/Independent– every guess must be independent from each other
/Talent – every guess must be slightly better than random guess
/Crowd – need a lot of guesses
gRandom Forests™ are structurally designed to take advantage of this phenomenon
Ensemble models mathematically formalize and capitalize on the concept of wisdom of crowds.
Random Forest™
5
gCollection of independent decision trees (“forest”)
gRandom subspaces to fit the trees (“random”)
g Idea: Wisdom of crowds
/Several weak predictions can be averaged to make ONE strong prediction
Random Forest™ Methodology
6
gHow to construct a decision tree?
/What to split?
/Where to split?
/When to stop splitting?
gHow to use Random Forest™?
/How to predict?
/Variable Importance
Methodology – what to split?
7
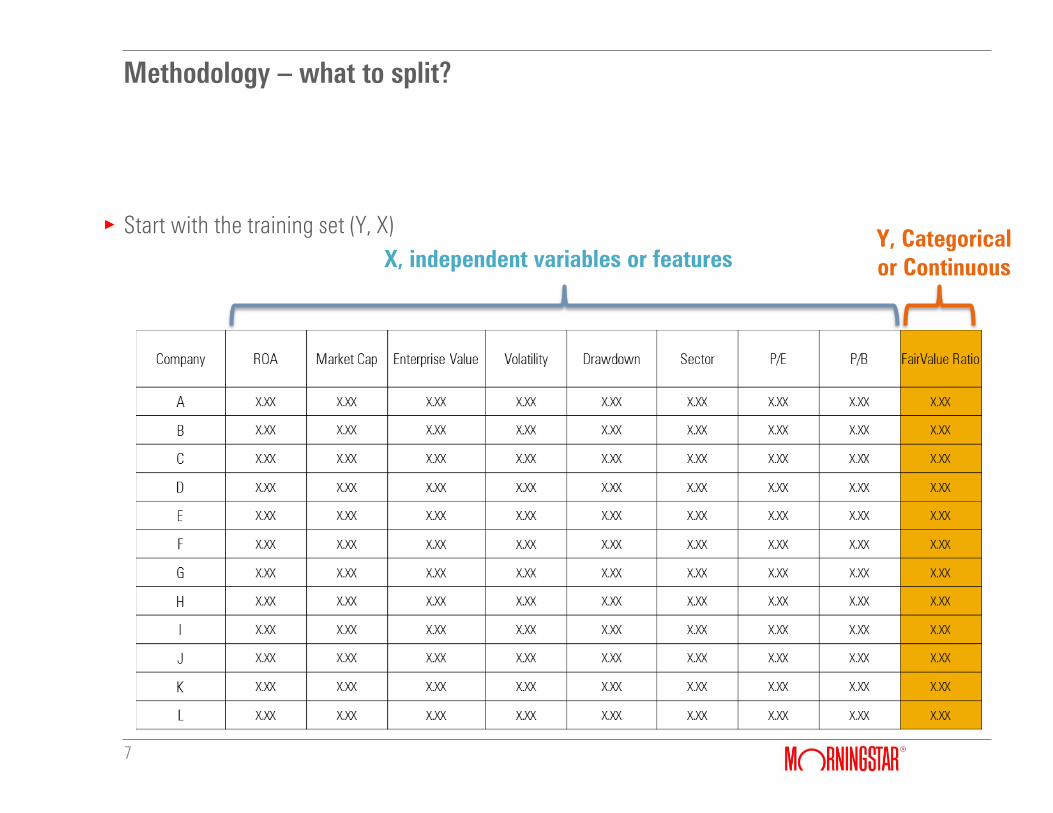
gStart with the training set (Y, X)
X, independent variables or features
Y, Categorical
or Continuous
Methodology – what to split?
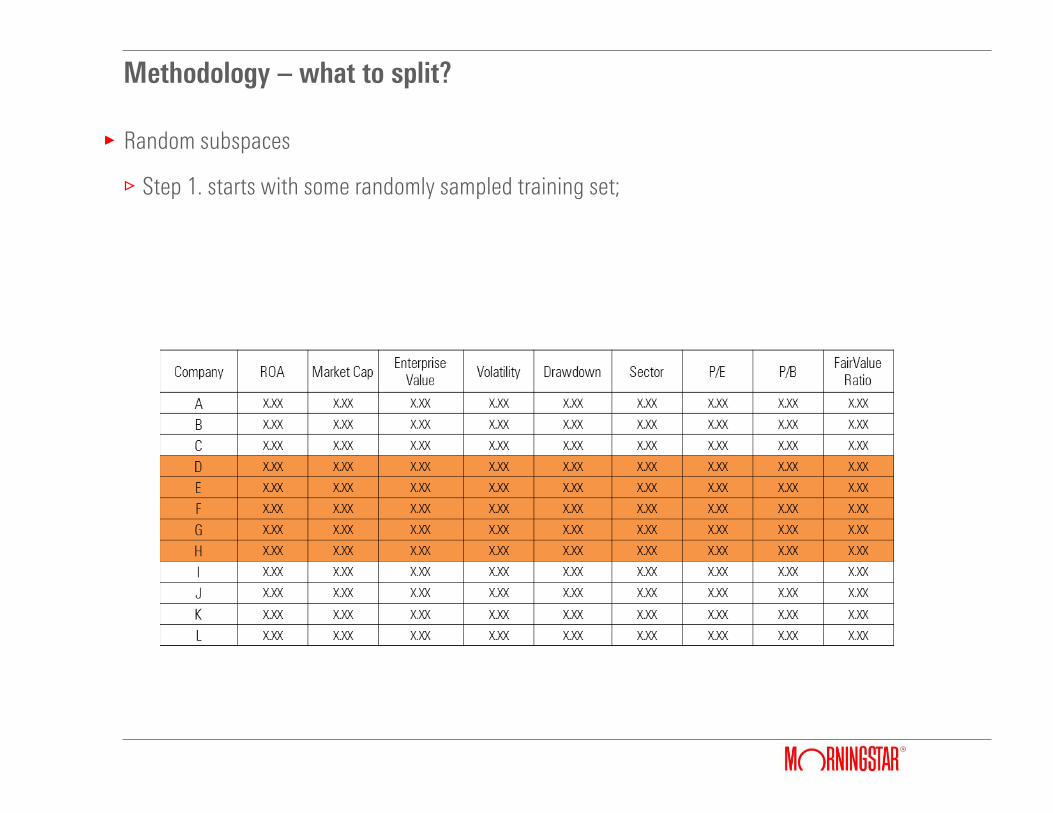
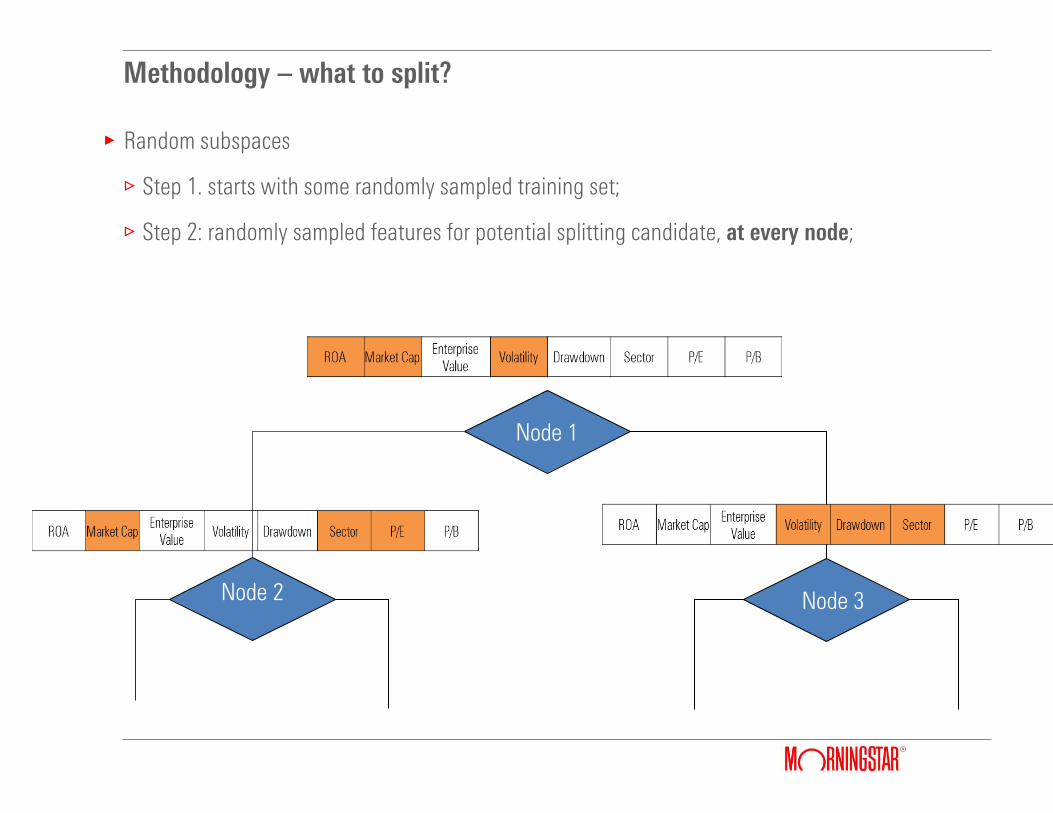
gRandom subspaces
/Step 1. starts with some randomly sampled training set;
Methodology – what to split?
gRandom subspaces
/Step 1. starts with some randomly sampled training set;
/Step 2: randomly sampled features for potential splitting candidate, at every node;
Node 1
Node 2 Node 3
Methodology – what to split?
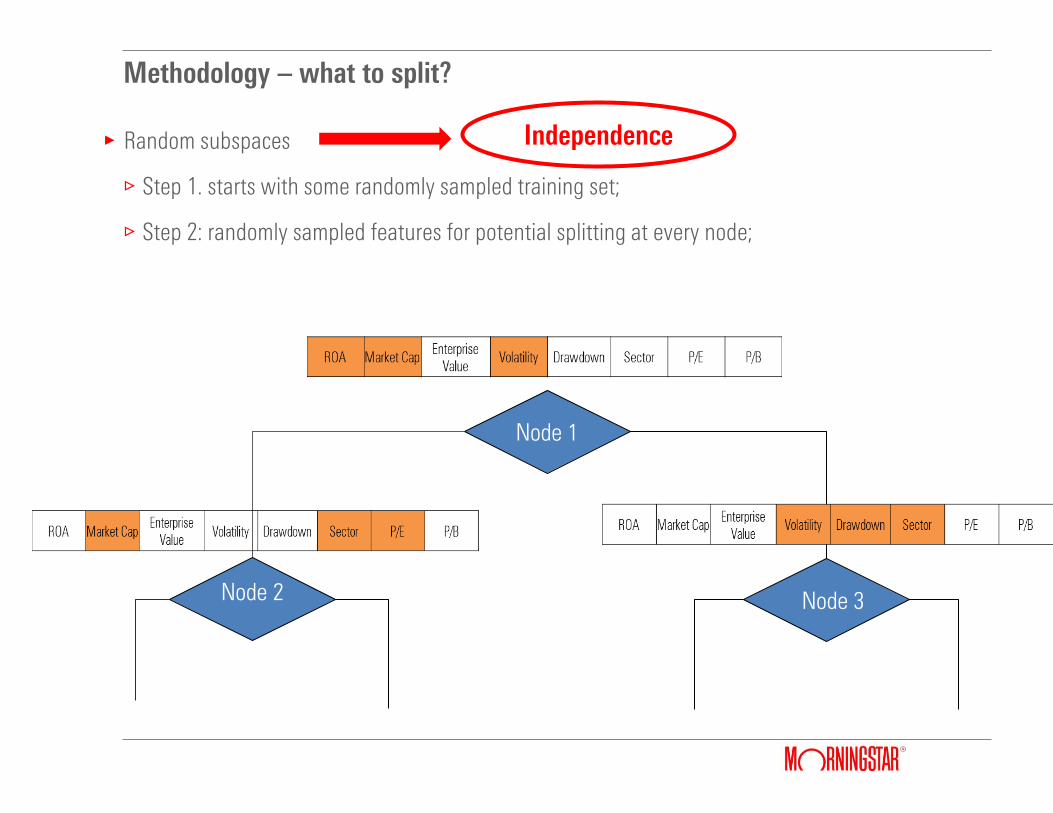
gRandom subspaces
/Step 1. starts with some randomly sampled training set;
/Step 2: randomly sampled features for potential splitting at every node;
Node 1
Node 2 Node 3
Independence
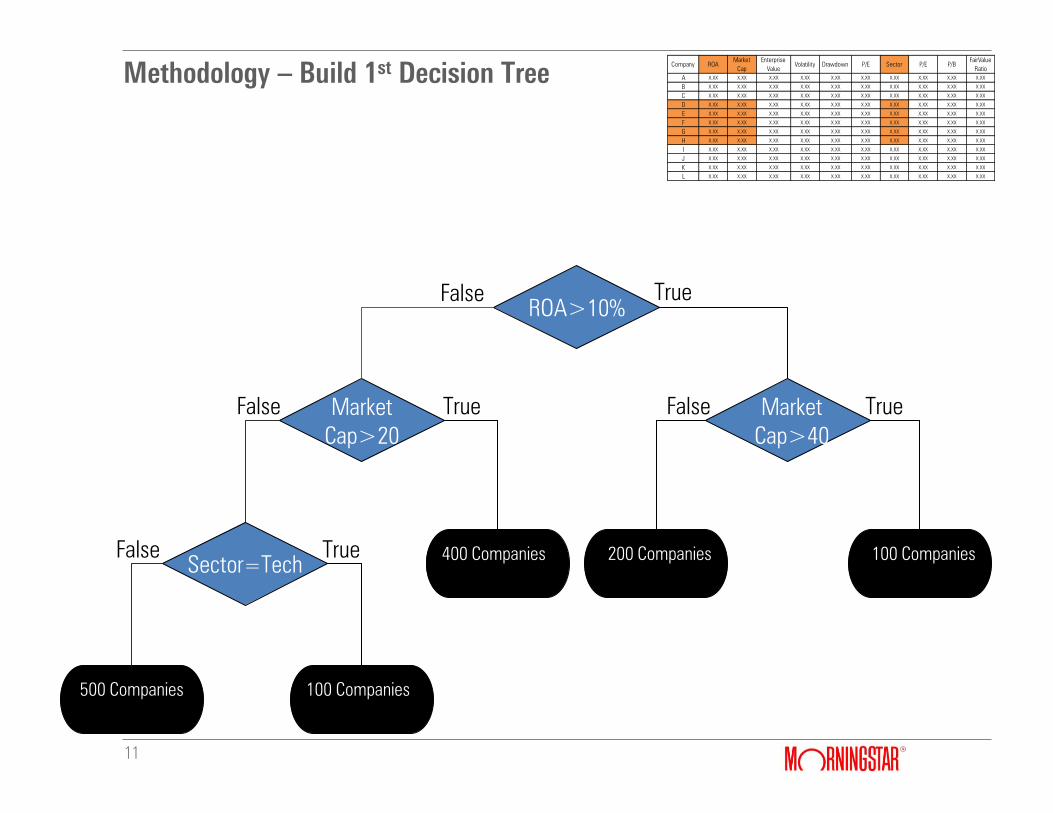
Methodology – Build 1st Decision Tree
11
ROA>10%
Market
Cap>20
Market
Cap>40
Sector=Tech
True False
False False True True
500 Companies 500 Companies
Avg P/FV = 0.8
False True
100 Companies
400 Companies
200 Companies
100 Companies
Company ROA
Market
Cap
Enterprise
Value
Volatility Drawdown P/E Sector P/E P/B
FairValue
Ratio
A X.XX X.XX X.XX X.XX X.XX X.XX X.XX X.XX X.XX X.XX
B X.XX X.XX X.XX X.XX X.XX X.XX X.XX X.XX X.XX X.XX
C X.XX X.XX X.XX X.XX X.XX X.XX X.XX X.XX X.XX X.XX
D X.XX X.XX X.XX X.XX X.XX X.XX X.XX X.XX X.XX X.XX
E X.XX X.XX X.XX X.XX X.XX X.XX X.XX X.XX X.XX X.XX
F X.XX X.XX X.XX X.XX X.XX X.XX X.XX X.XX X.XX X.XX
G X.XX X.XX X.XX X.XX X.XX X.XX X.XX X.XX X.XX X.XX
H X.XX X.XX X.XX X.XX X.XX X.XX X.XX X.XX X.XX X.XX
I X.XX X.XX X.XX X.XX X.XX X.XX X.XX X.XX X.XX X.XX
J X.XX X.XX X.XX X.XX X.XX X.XX X.XX X.XX X.XX X.XX
K X.XX X.XX X.XX X.XX X.XX X.XX X.XX X.XX X.XX X.XX
L X.XX X.XX X.XX X.XX X.XX X.XX X.XX X.XX X.XX X.XX

Methodology – Build 1st Decision Tree
12
ROA>10%
Market
Cap>20
Market
Cap>40
Sector=Tech
True False
False False True True
500 Companies
Avg P/FV = 0.8
500 Companies
Avg P/FV = 0.8
False True
100 Companies
Avg P/FV = 1.0
400 Companies
Avg P/FV = 1.2
200 Companies
Avg P/FV = 0.8
100 Companies
Avg P/FV = 1.8
Company ROA
Market
Cap
Enterprise
Value
Volatility Drawdown P/E Sector P/E P/B
FairValue
Ratio
A X.XX X.XX X.XX X.XX X.XX X.XX X.XX X.XX X.XX X.XX
B X.XX X.XX X.XX X.XX X.XX X.XX X.XX X.XX X.XX X.XX
C X.XX X.XX X.XX X.XX X.XX X.XX X.XX X.XX X.XX X.XX
D X.XX X.XX X.XX X.XX X.XX X.XX X.XX X.XX X.XX X.XX
E X.XX X.XX X.XX X.XX X.XX X.XX X.XX X.XX X.XX X.XX
F X.XX X.XX X.XX X.XX X.XX X.XX X.XX X.XX X.XX X.XX
G X.XX X.XX X.XX X.XX X.XX X.XX X.XX X.XX X.XX X.XX
H X.XX X.XX X.XX X.XX X.XX X.XX X.XX X.XX X.XX X.XX
I X.XX X.XX X.XX X.XX X.XX X.XX X.XX X.XX X.XX X.XX
J X.XX X.XX X.XX X.XX X.XX X.XX X.XX X.XX X.XX X.XX
K X.XX X.XX X.XX X.XX X.XX X.XX X.XX X.XX X.XX X.XX
L X.XX X.XX X.XX X.XX X.XX X.XX X.XX X.XX X.XX X.XX
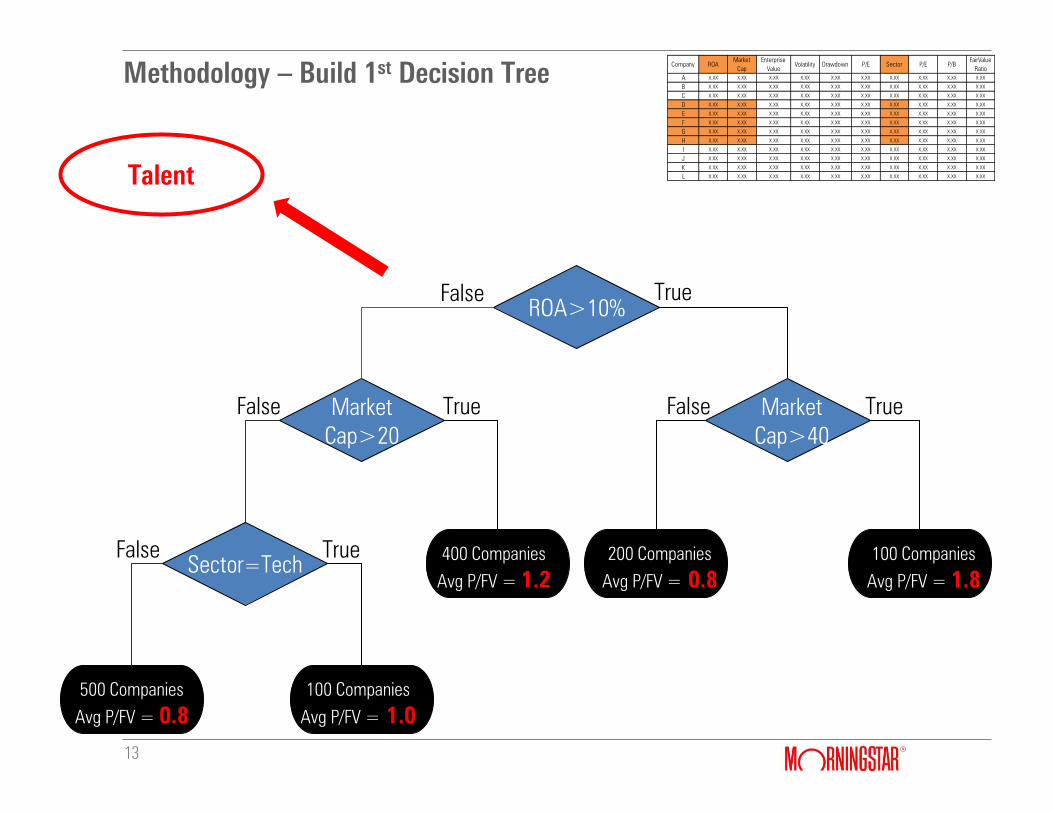
Methodology – Build 1st Decision Tree
13
ROA>10%
Market
Cap>20
Market
Cap>40
Sector=Tech
True False
False False True True
500 Companies
Avg P/FV = 0.8
500 Companies
Avg P/FV = 0.8
False True
100 Companies
Avg P/FV = 1.0
400 Companies
Avg P/FV = 1.2
200 Companies
Avg P/FV = 0.8
100 Companies
Avg P/FV = 1.8
Company ROA
Market
Cap
Enterprise
Value
Volatility Drawdown P/E Sector P/E P/B
FairValue
Ratio
A X.XX X.XX X.XX X.XX X.XX X.XX X.XX X.XX X.XX X.XX
B X.XX X.XX X.XX X.XX X.XX X.XX X.XX X.XX X.XX X.XX
C X.XX X.XX X.XX X.XX X.XX X.XX X.XX X.XX X.XX X.XX
D X.XX X.XX X.XX X.XX X.XX X.XX X.XX X.XX X.XX X.XX
E X.XX X.XX X.XX X.XX X.XX X.XX X.XX X.XX X.XX X.XX
F X.XX X.XX X.XX X.XX X.XX X.XX X.XX X.XX X.XX X.XX
G X.XX X.XX X.XX X.XX X.XX X.XX X.XX X.XX X.XX X.XX
H X.XX X.XX X.XX X.XX X.XX X.XX X.XX X.XX X.XX X.XX
I X.XX X.XX X.XX X.XX X.XX X.XX X.XX X.XX X.XX X.XX
J X.XX X.XX X.XX X.XX X.XX X.XX X.XX X.XX X.XX X.XX
K X.XX X.XX X.XX X.XX X.XX X.XX X.XX X.XX X.XX X.XX
L X.XX X.XX X.XX X.XX X.XX X.XX X.XX X.XX X.XX X.XXTalent
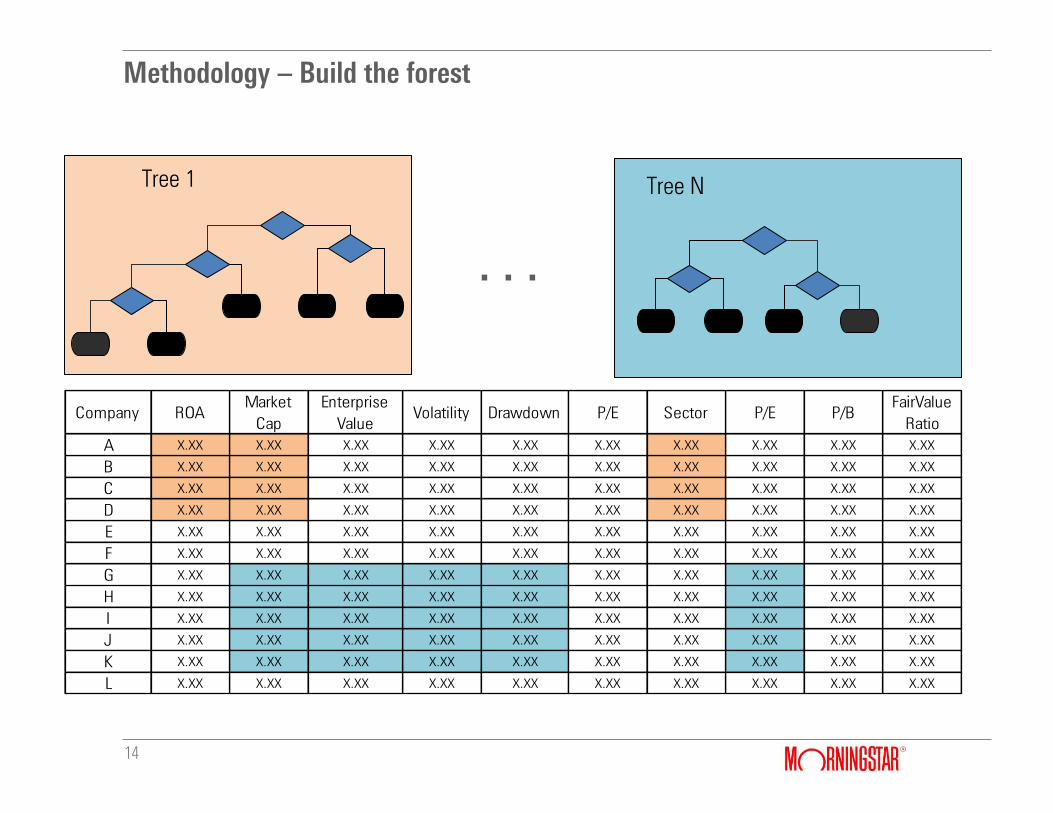
Methodology – Build the forest
14
Tree 1 Tree N
Company ROA
Market
Cap
Enterprise
Value
Volatility Drawdown P/E Sector P/E P/B
FairValue
Ratio
A X.XX X.XX X.XX X.XX X.XX X.XX X.XX X.XX X.XX X.XX
B X.XX X.XX X.XX X.XX X.XX X.XX X.XX X.XX X.XX X.XX
C X.XX X.XX X.XX X.XX X.XX X.XX X.XX X.XX X.XX X.XX
D X.XX X.XX X.XX X.XX X.XX X.XX X.XX X.XX X.XX X.XX
E X.XX X.XX X.XX X.XX X.XX X.XX X.XX X.XX X.XX X.XX
F X.XX X.XX X.XX X.XX X.XX X.XX X.XX X.XX X.XX X.XX
G X.XX X.XX X.XX X.XX X.XX X.XX X.XX X.XX X.XX X.XX
H X.XX X.XX X.XX X.XX X.XX X.XX X.XX X.XX X.XX X.XX
I X.XX X.XX X.XX X.XX X.XX X.XX X.XX X.XX X.XX X.XX
J X.XX X.XX X.XX X.XX X.XX X.XX X.XX X.XX X.XX X.XX
K X.XX X.XX X.XX X.XX X.XX X.XX X.XX X.XX X.XX X.XX
L X.XX X.XX X.XX X.XX X.XX X.XX X.XX X.XX X.XX X.XX
…
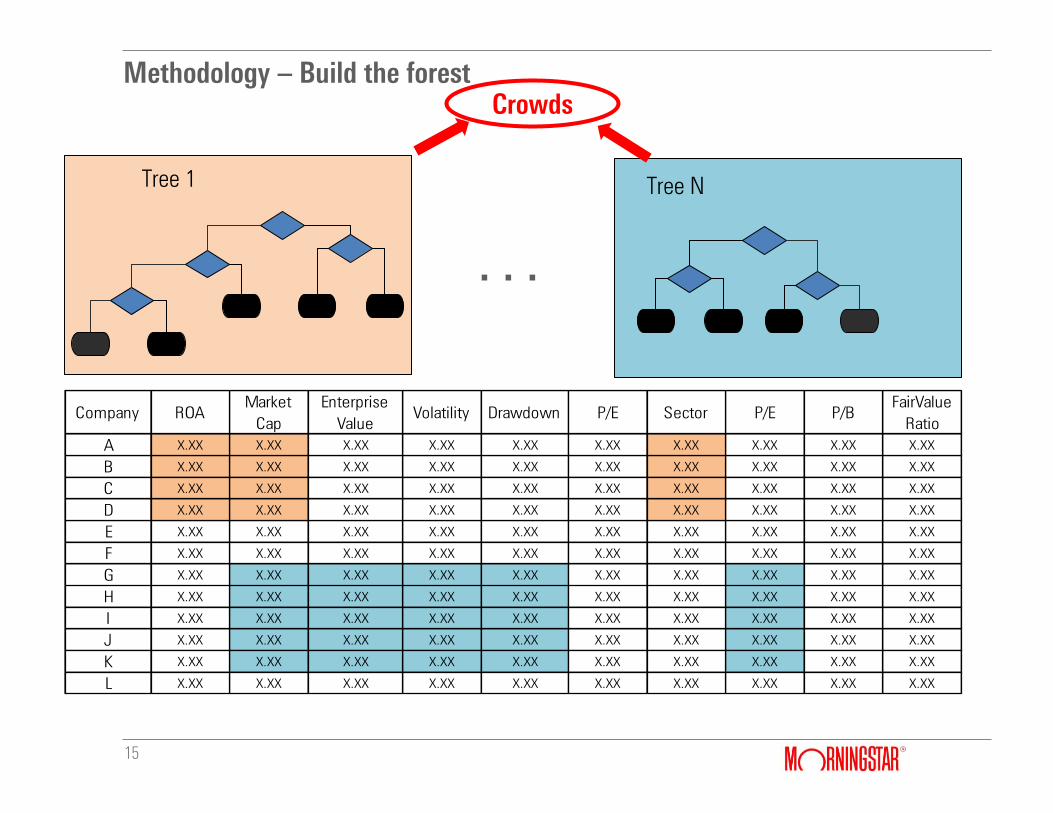
Methodology – Build the forest
15
Tree 1 Tree N
Company ROA
Market
Cap
Enterprise
Value
Volatility Drawdown P/E Sector P/E P/B
FairValue
Ratio
A X.XX X.XX X.XX X.XX X.XX X.XX X.XX X.XX X.XX X.XX
B X.XX X.XX X.XX X.XX X.XX X.XX X.XX X.XX X.XX X.XX
C X.XX X.XX X.XX X.XX X.XX X.XX X.XX X.XX X.XX X.XX
D X.XX X.XX X.XX X.XX X.XX X.XX X.XX X.XX X.XX X.XX
E X.XX X.XX X.XX X.XX X.XX X.XX X.XX X.XX X.XX X.XX
F X.XX X.XX X.XX X.XX X.XX X.XX X.XX X.XX X.XX X.XX
G X.XX X.XX X.XX X.XX X.XX X.XX X.XX X.XX X.XX X.XX
H X.XX X.XX X.XX X.XX X.XX X.XX X.XX X.XX X.XX X.XX
I X.XX X.XX X.XX X.XX X.XX X.XX X.XX X.XX X.XX X.XX
J X.XX X.XX X.XX X.XX X.XX X.XX X.XX X.XX X.XX X.XX
K X.XX X.XX X.XX X.XX X.XX X.XX X.XX X.XX X.XX X.XX
L X.XX X.XX X.XX X.XX X.XX X.XX X.XX X.XX X.XX X.XX
…
Crowds
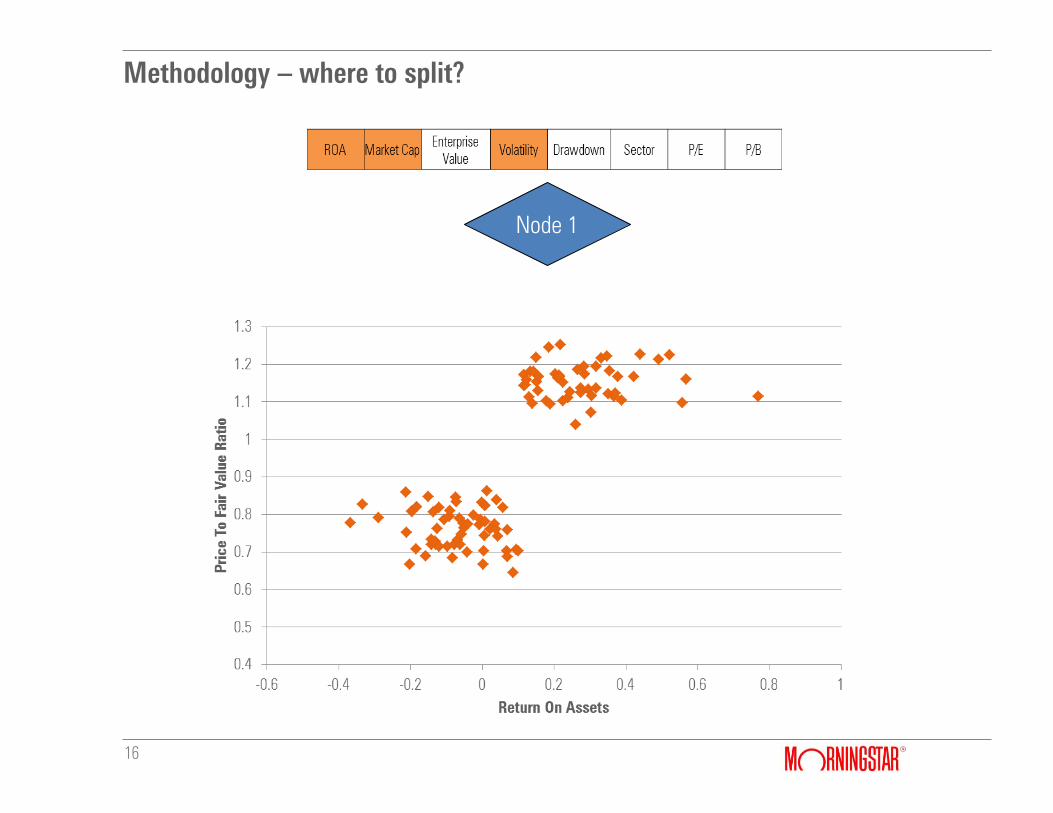
Methodology – where to split?
16
Node 1
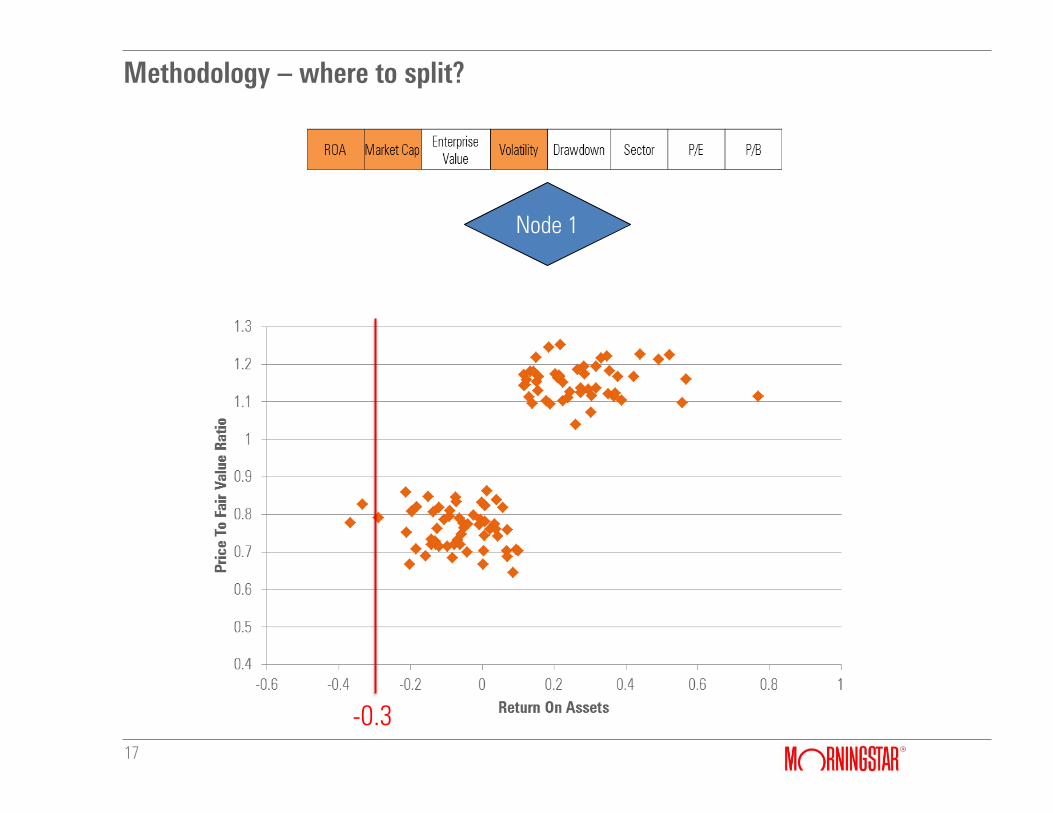
Methodology – where to split?
17
Node 1
-0.3
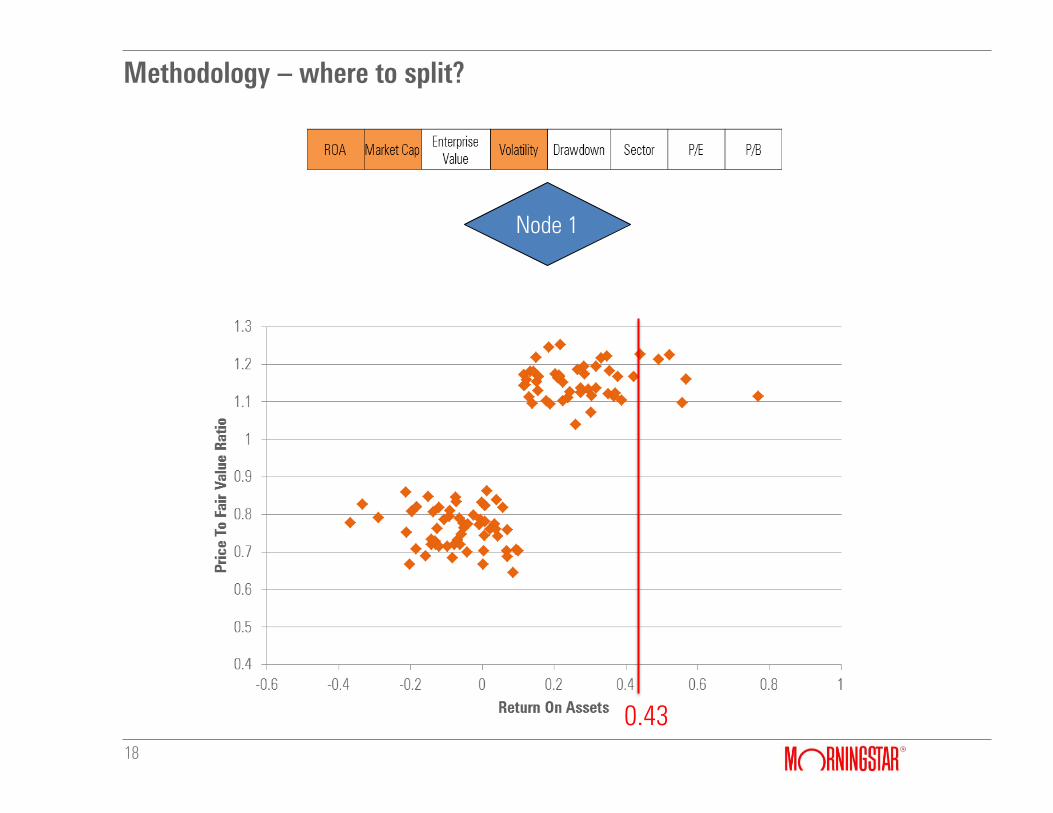
Methodology – where to split?
18
Node 1
0.43
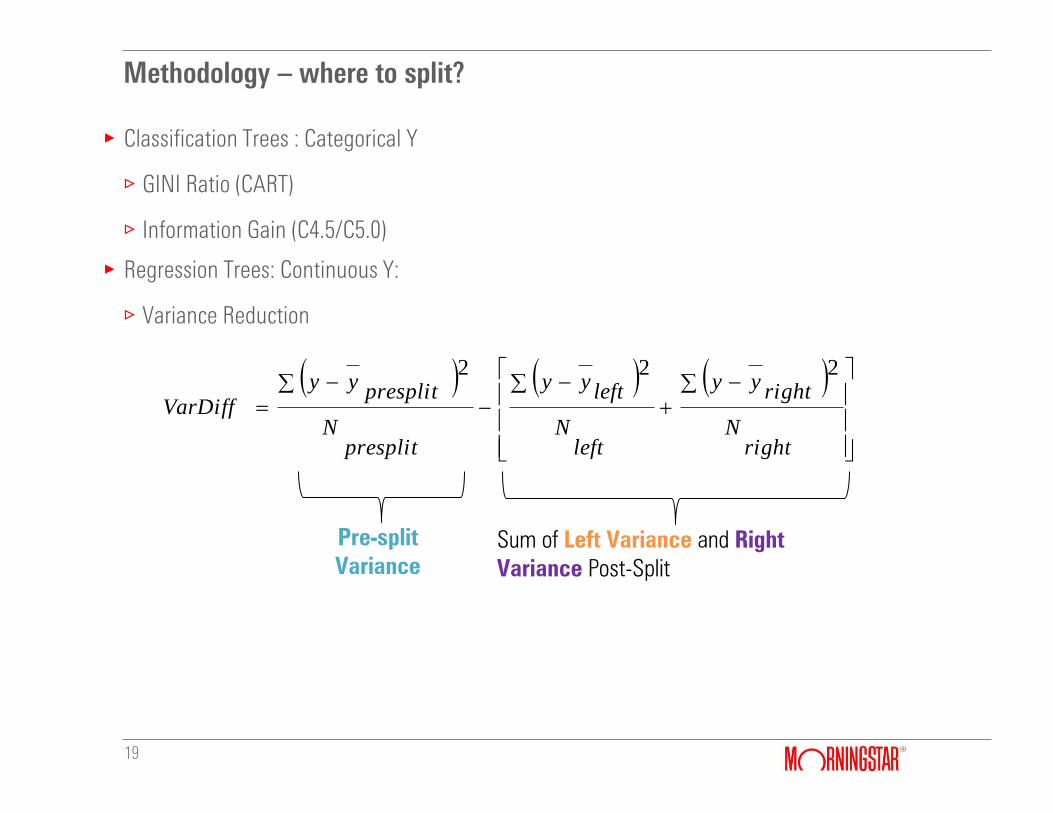
Methodology – where to split?
19
gClassification Trees : Categorical Y
/GINI Ratio (CART)
/ Information Gain (C4.5/C5.0)
gRegression Trees: Continuous Y:
/Variance Reduction
Pre-split
Variance
Sum of Left Variance and Right
Variance Post-Split
rightN
rightyy
leftN
leftyy
presplitN
presplityy
VarDiff
222
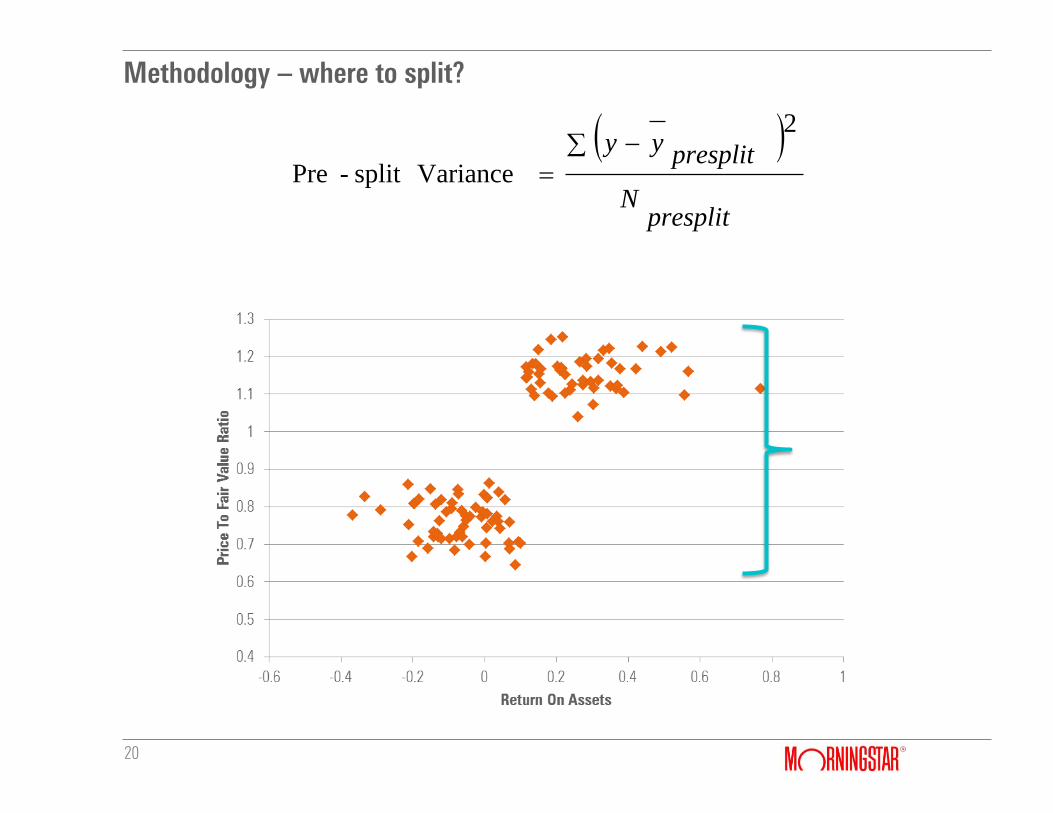
Methodology – where to split?
20
presplitN
presplityy
2
Variancesplit -Pre
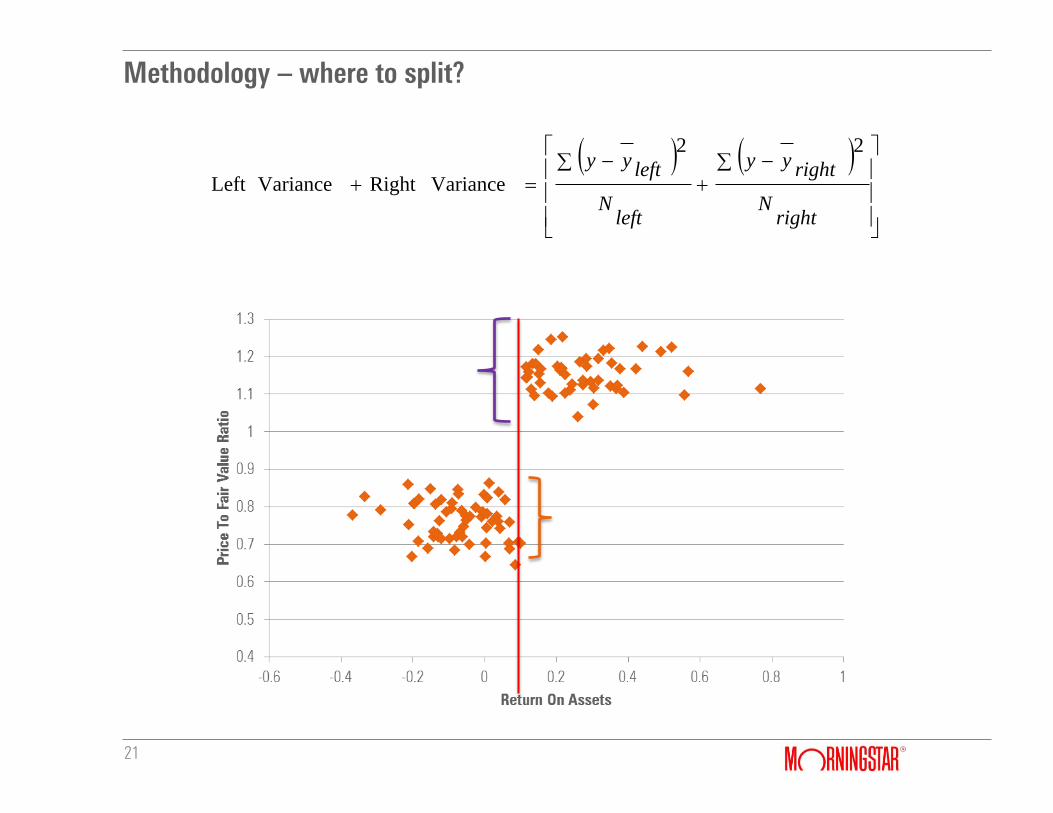
Methodology – where to split?
21
rightN
rightyy
leftN
leftyy22
VarianceRight VarianceLeft
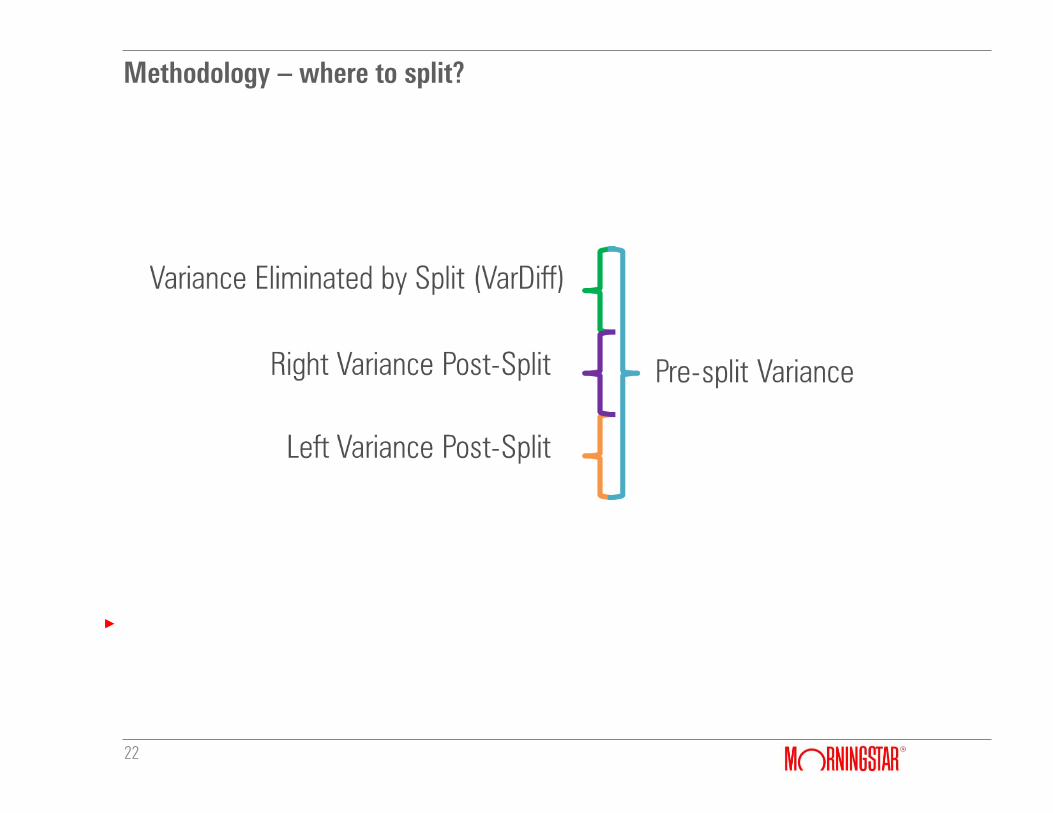
Methodology – where to split?
22
g
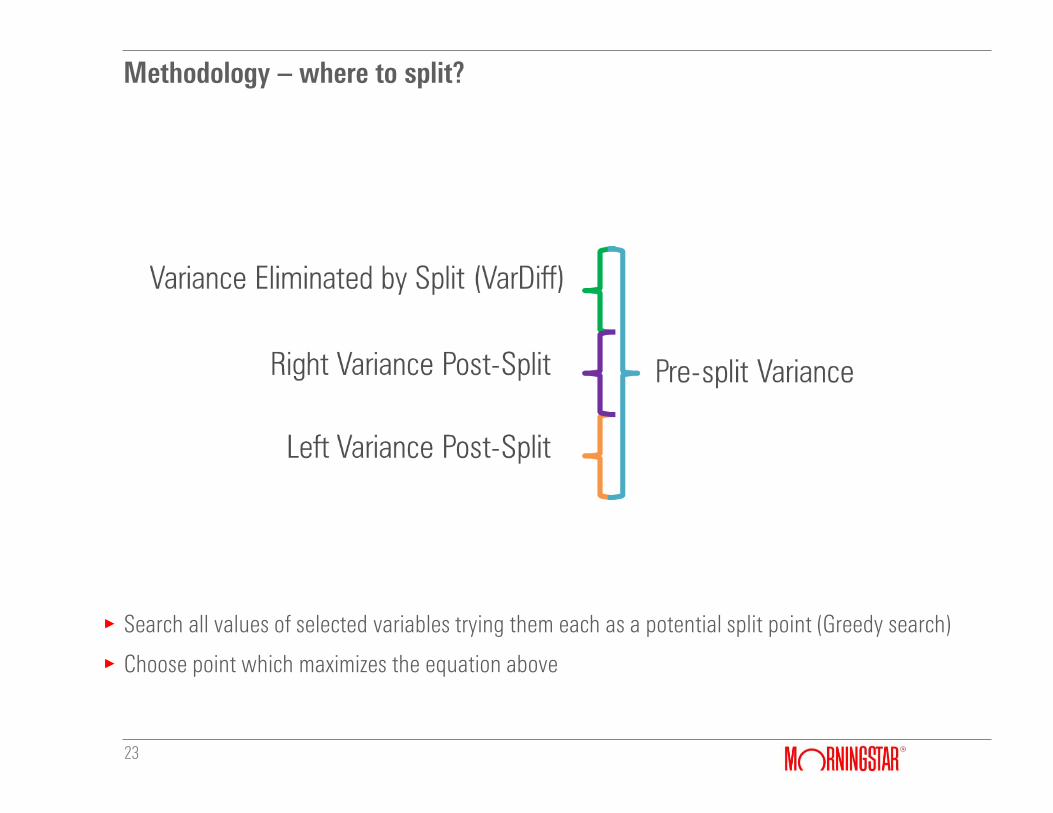
Methodology – where to split?
23
gSearch all values of selected variables trying them each as a potential split point (Greedy search)
gChoose point which maximizes the equation above
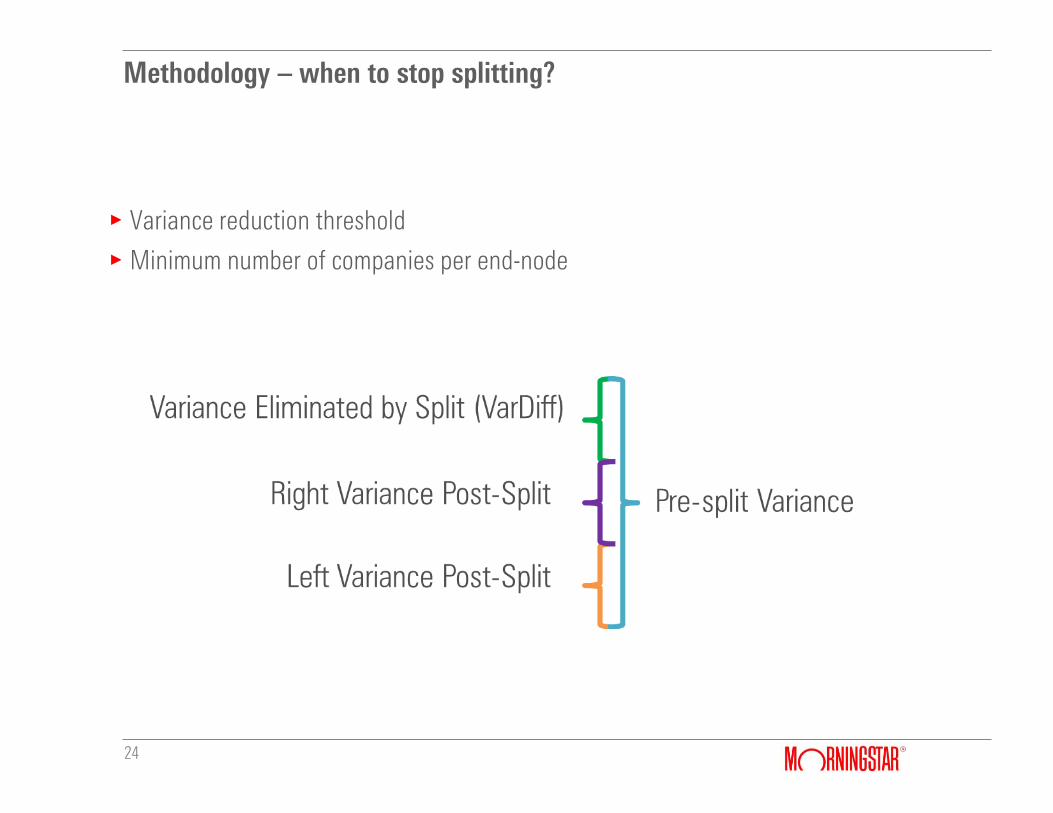
Methodology – when to stop splitting?
24
gVariance reduction threshold
gMinimum number of companies per end-node
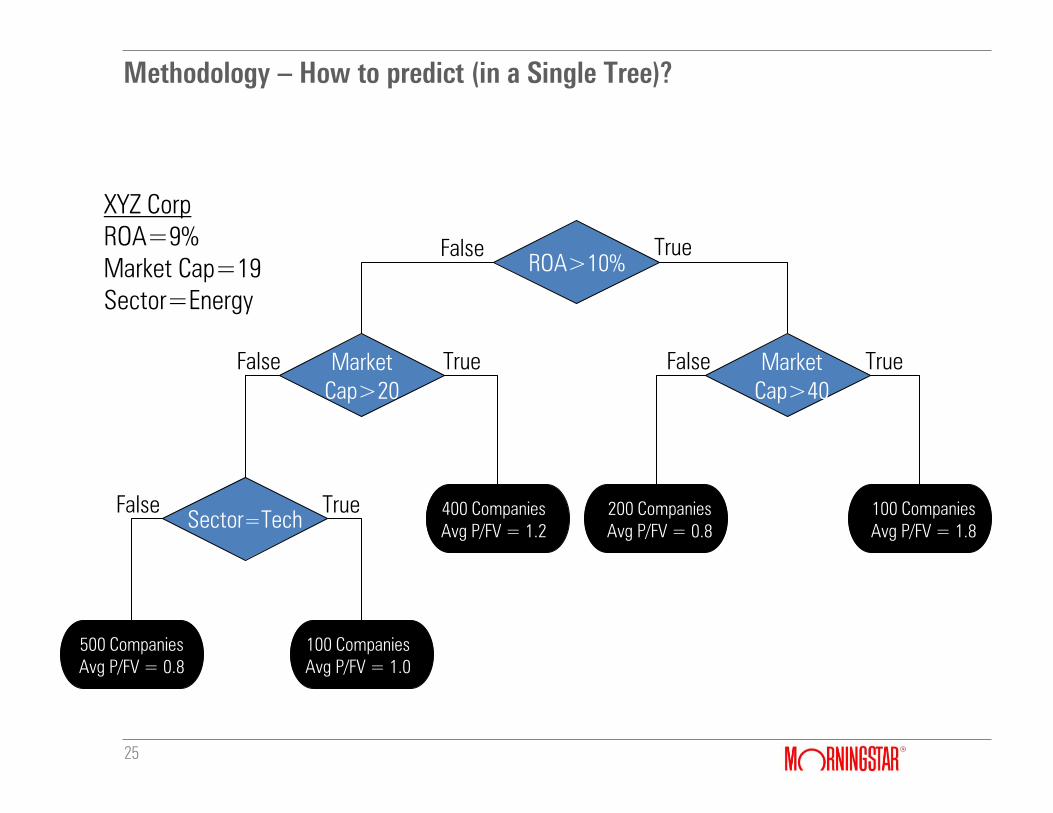
Methodology – How to predict (in a Single Tree)?
25
ROA>10%
Market
Cap>20
Market
Cap>40
Sector=Tech
True False
False False True True
500 Companies
Avg P/FV = 0.8
500 Companies
Avg P/FV = 0.8
XYZ Corp
ROA=9%
Market Cap=19
Sector=Energy
False True
100 Companies
Avg P/FV = 1.0
400 Companies
Avg P/FV = 1.2
200 Companies
Avg P/FV = 0.8
100 Companies
Avg P/FV = 1.8
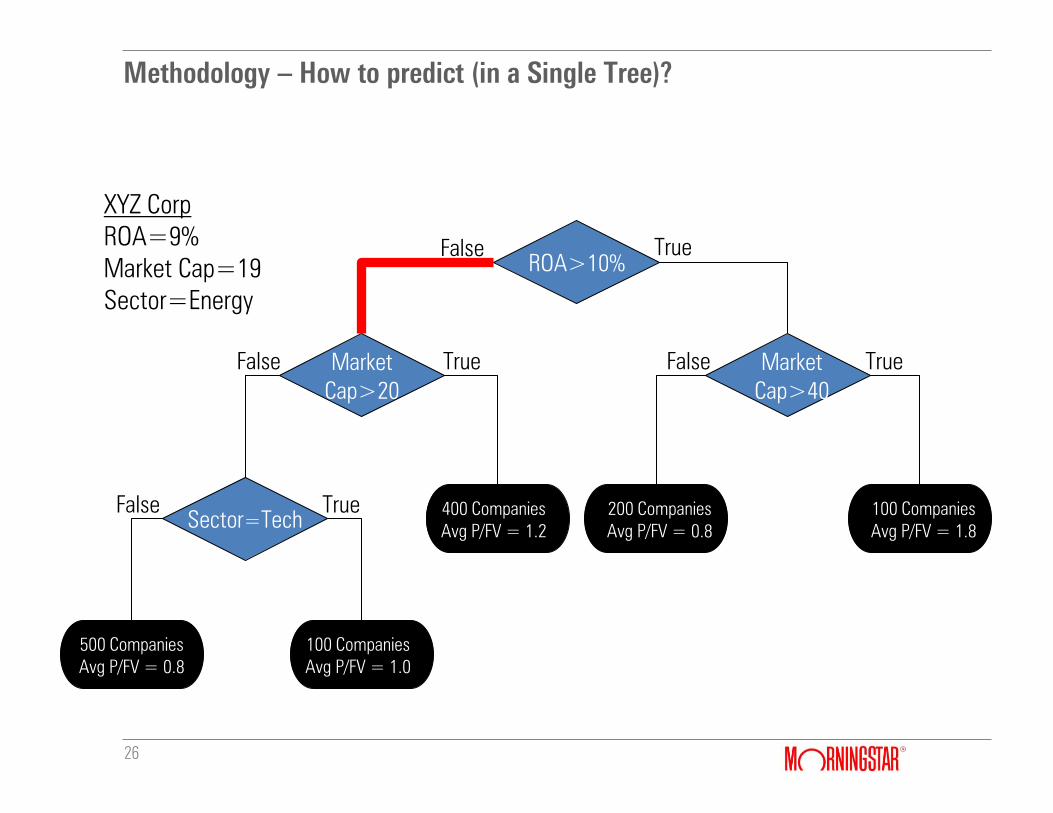
Methodology – How to predict (in a Single Tree)?
26
ROA>10%
Market
Cap>20
Market
Cap>40
Sector=Tech
True False
False False True True
500 Companies
Avg P/FV = 0.8
500 Companies
Avg P/FV = 0.8
XYZ Corp
ROA=9%
Market Cap=19
Sector=Energy
False True
100 Companies
Avg P/FV = 1.0
400 Companies
Avg P/FV = 1.2
200 Companies
Avg P/FV = 0.8
100 Companies
Avg P/FV = 1.8
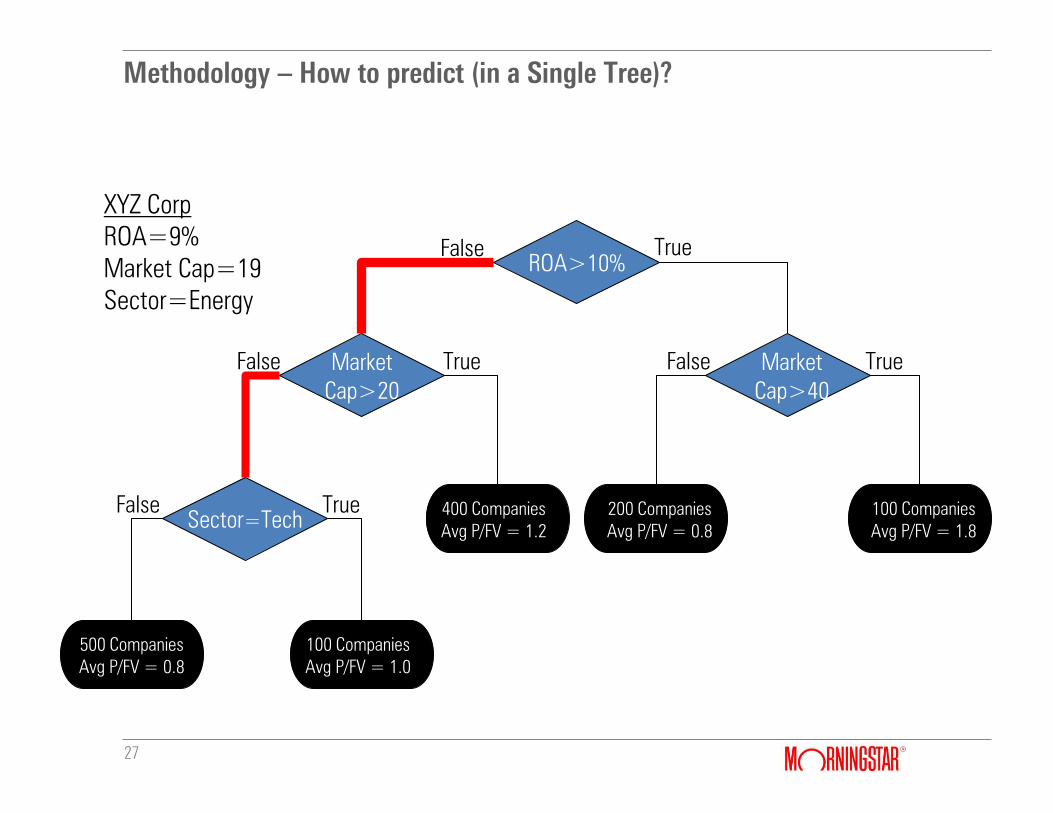
Methodology – How to predict (in a Single Tree)?
27
ROA>10%
Market
Cap>20
Market
Cap>40
Sector=Tech
True False
False False True True
500 Companies
Avg P/FV = 0.8
500 Companies
Avg P/FV = 0.8
XYZ Corp
ROA=9%
Market Cap=19
Sector=Energy
False True
100 Companies
Avg P/FV = 1.0
400 Companies
Avg P/FV = 1.2
200 Companies
Avg P/FV = 0.8
100 Companies
Avg P/FV = 1.8
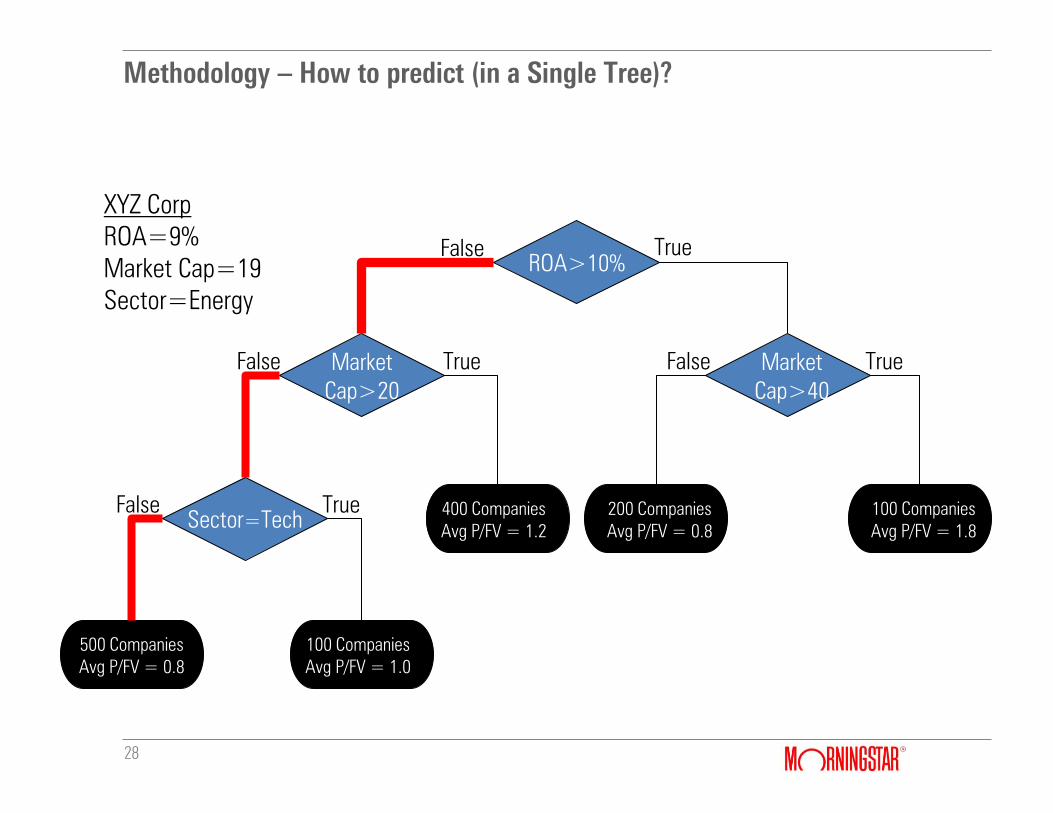
Methodology – How to predict (in a Single Tree)?
28
ROA>10%
Market
Cap>20
Market
Cap>40
Sector=Tech
True False
False False True True
500 Companies
Avg P/FV = 0.8
500 Companies
Avg P/FV = 0.8
XYZ Corp
ROA=9%
Market Cap=19
Sector=Energy
False True
100 Companies
Avg P/FV = 1.0
400 Companies
Avg P/FV = 1.2
200 Companies
Avg P/FV = 0.8
100 Companies
Avg P/FV = 1.8
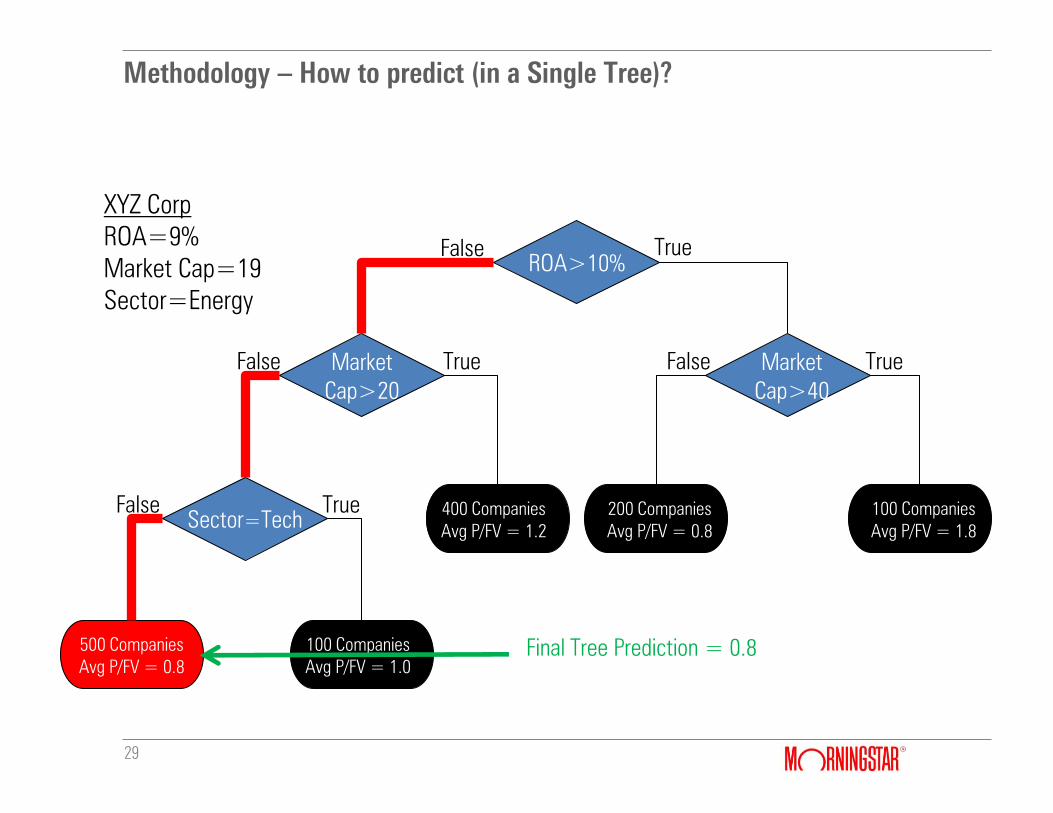
Methodology – How to predict (in a Single Tree)?
29
ROA>10%
Market
Cap>20
Market
Cap>40
Sector=Tech
True False
False False True True
500 Companies
Avg P/FV = 0.8
500 Companies
Avg P/FV = 0.8
XYZ Corp
ROA=9%
Market Cap=19
Sector=Energy
False
Final Tree Prediction = 0.8
True
100 Companies
Avg P/FV = 1.0
400 Companies
Avg P/FV = 1.2
200 Companies
Avg P/FV = 0.8
100 Companies
Avg P/FV = 1.8
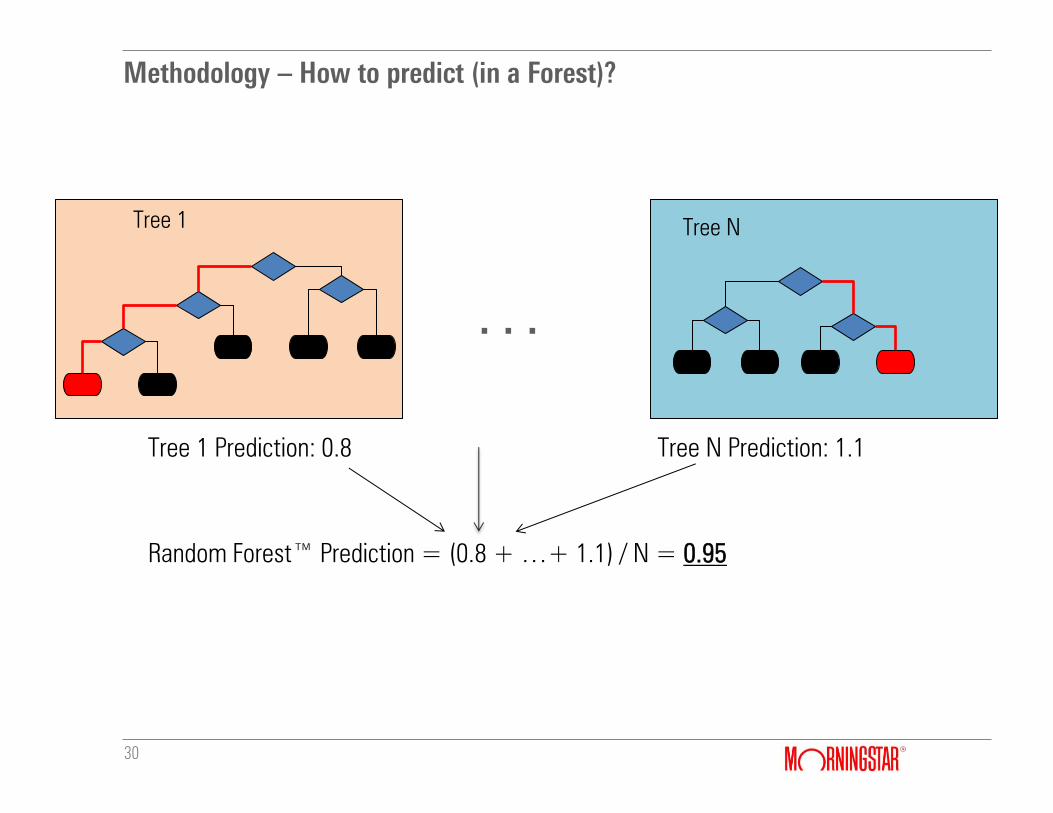
Methodology – How to predict (in a Forest)?
30
Tree 1 Prediction: 0.8 Tree N Prediction: 1.1
Random Forest™ Prediction = (0.8 + …+ 1.1) / N = 0.95
Tree 1 Tree N
…
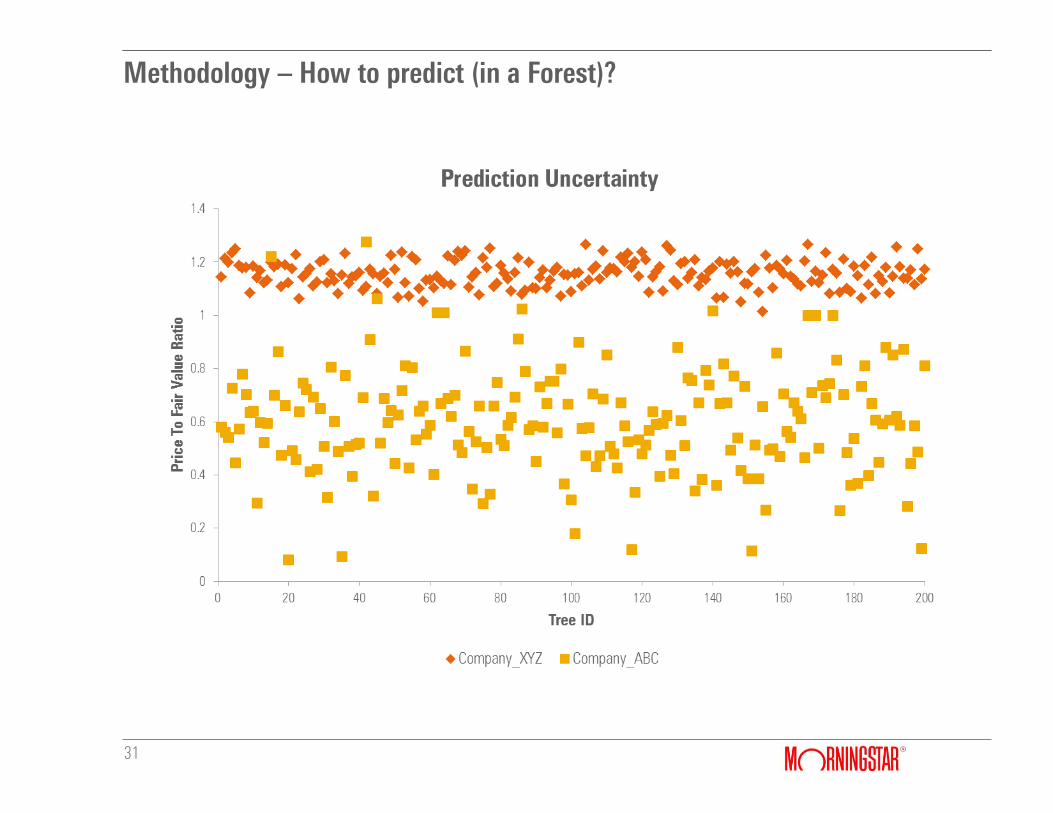
31
Methodology – How to predict (in a Forest)?
Methodology – Variable Importance
32
gWhat variables or features are important for our prediction, ROA or Market Cap?
Methodology – Variable Importance
33
gWhat variables or features are important for our prediction, ROA or Market Cap?
gOOB (Out-Of-Bag) Error Rate
Methodology – Variable Importance
34
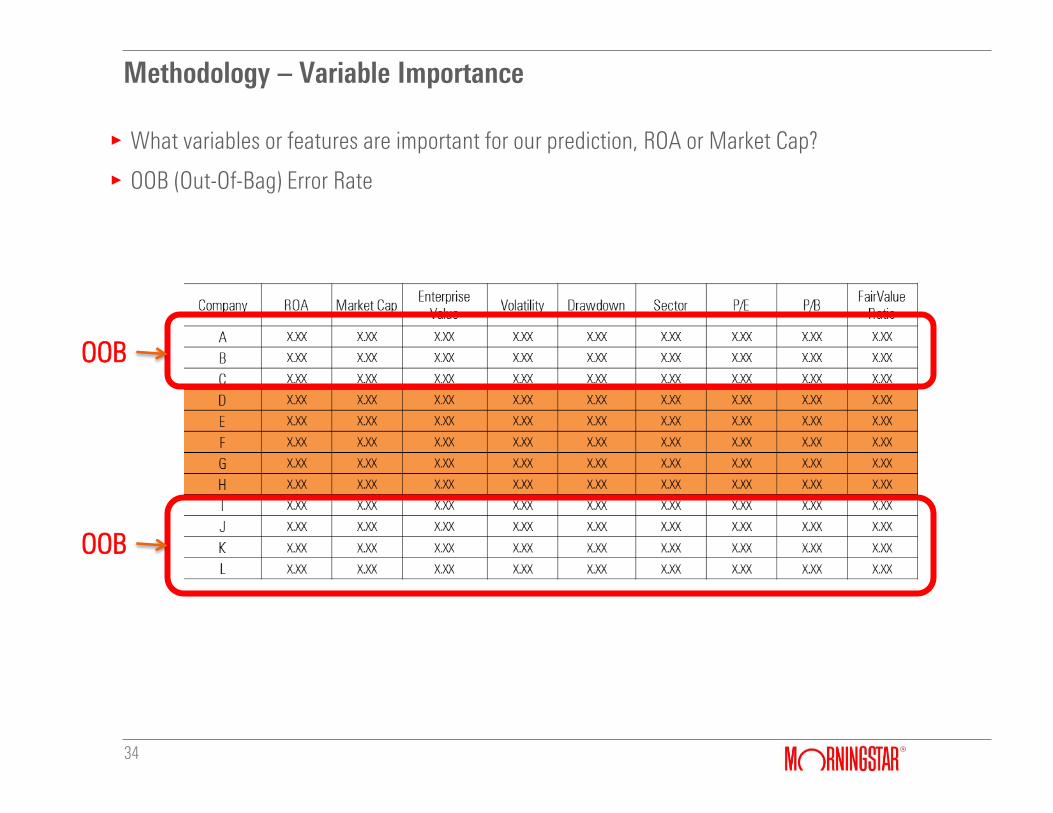
gWhat variables or features are important for our prediction, ROA or Market Cap?
gOOB (Out-Of-Bag) Error Rate
OOB
OOB
Methodology – Variable Importance
35
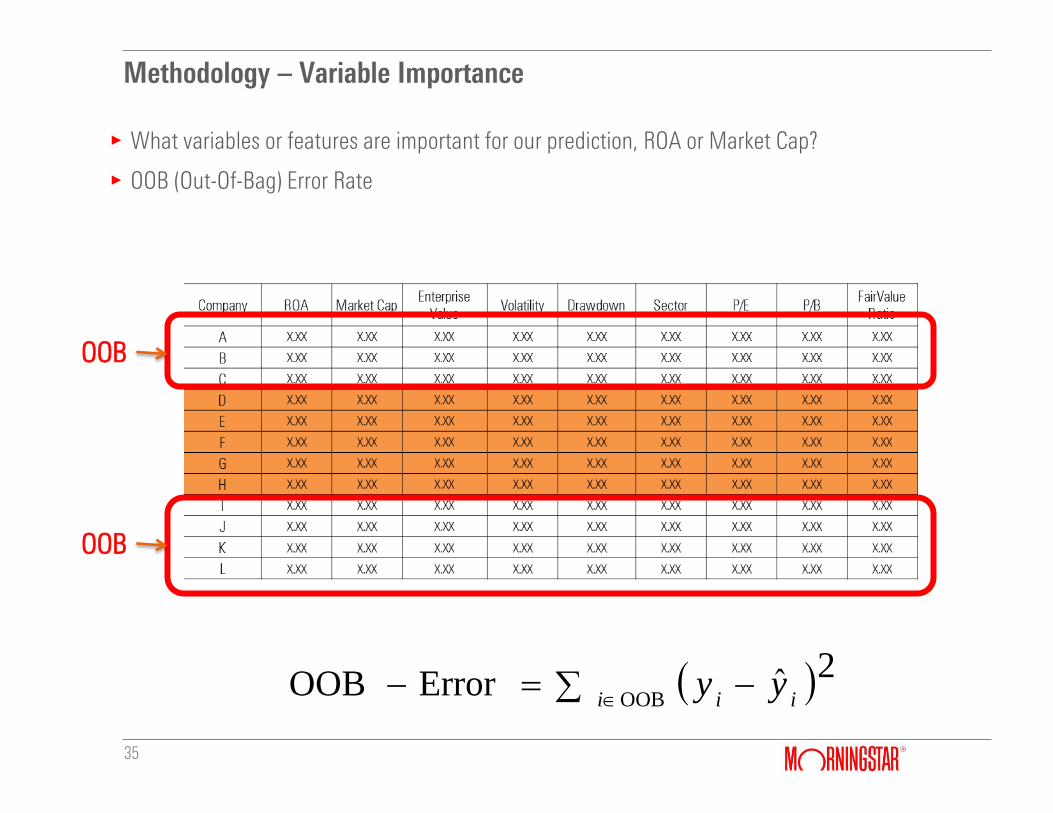
gWhat variables or features are important for our prediction, ROA or Market Cap?
gOOB (Out-Of-Bag) Error Rate
OOB
OOB
2ˆErrorOOBOOB iii
yy
Methodology – Variable Importance
36
gWhat variables or features are important for our prediction, ROA or Market Cap?
gOOB (Out-Of-Bag) Error Rate
gVariable Importance
Methodology – Variable Importance
37
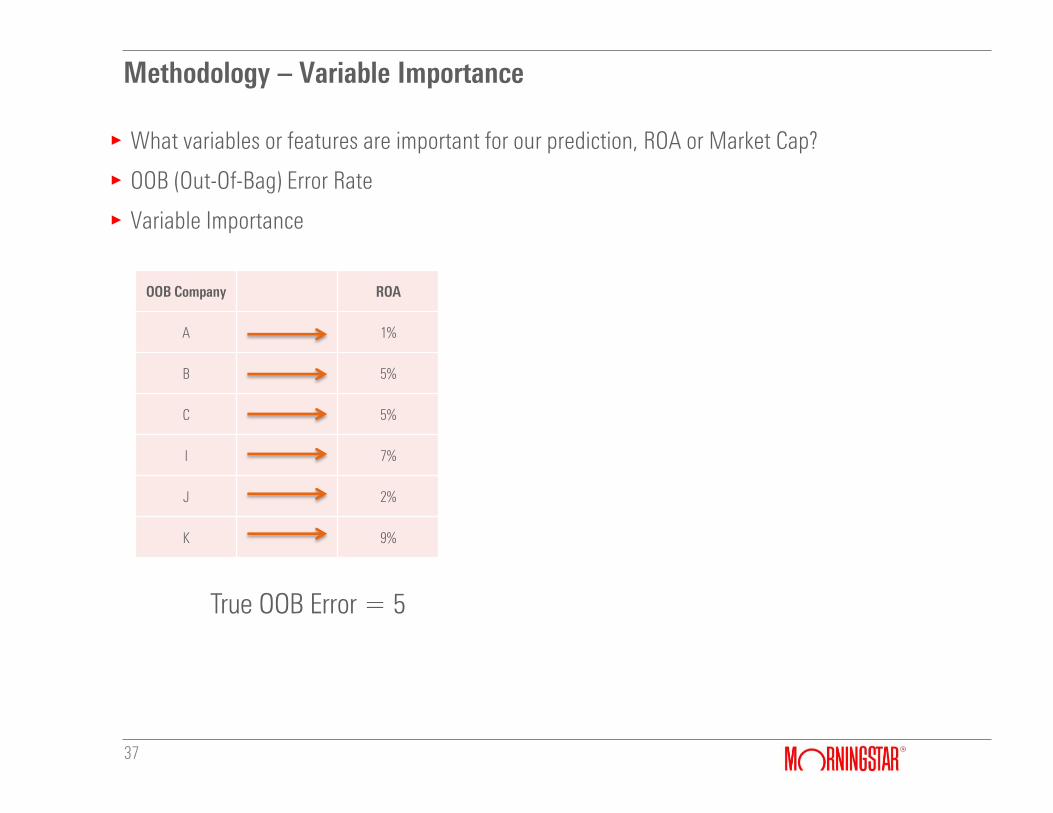
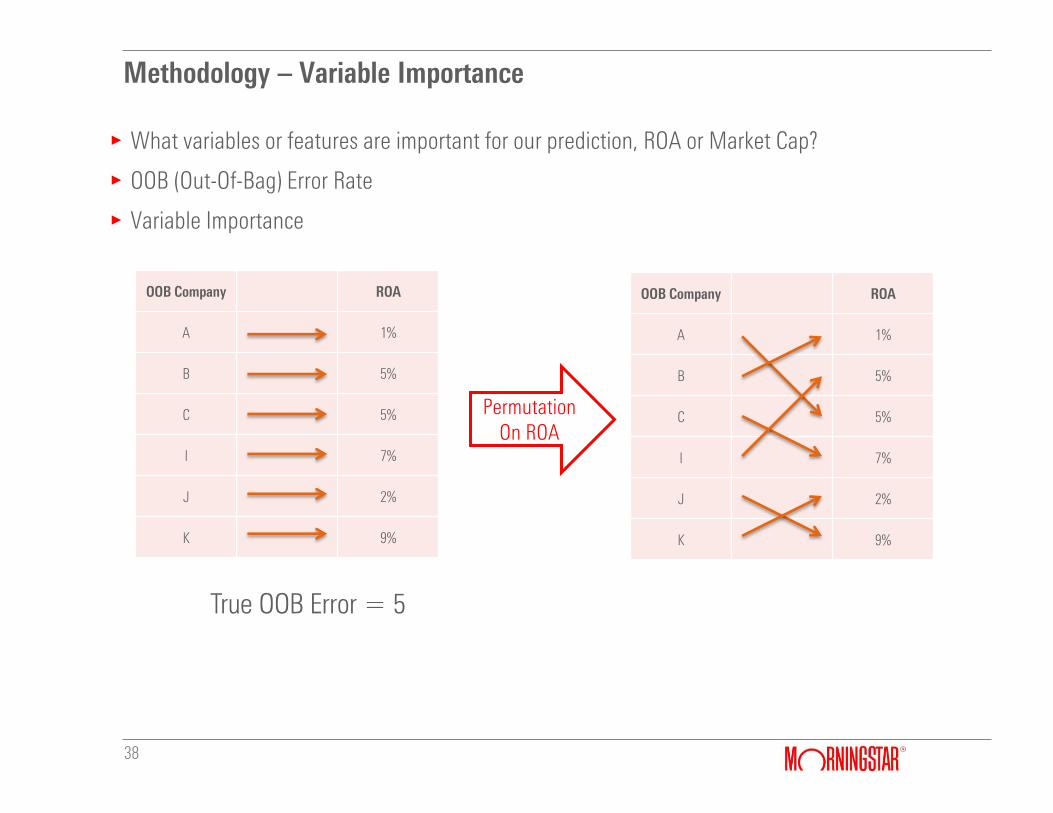
gWhat variables or features are important for our prediction, ROA or Market Cap?
gOOB (Out-Of-Bag) Error Rate
gVariable Importance
OOB Company ROA
A 1%
B 5%
C 5%
I 7%
J 2%
K 9%
True OOB Error = 5
Methodology – Variable Importance
38
gWhat variables or features are important for our prediction, ROA or Market Cap?
gOOB (Out-Of-Bag) Error Rate
gVariable Importance
OOB Company ROA
A 1%
B 5%
C 5%
I 7%
J 2%
K 9%
OOB Company ROA
A 1%
B 5%
C 5%
I 7%
J 2%
K 9%
Permutation On ROA
True OOB Error = 5
Methodology – Variable Importance
39
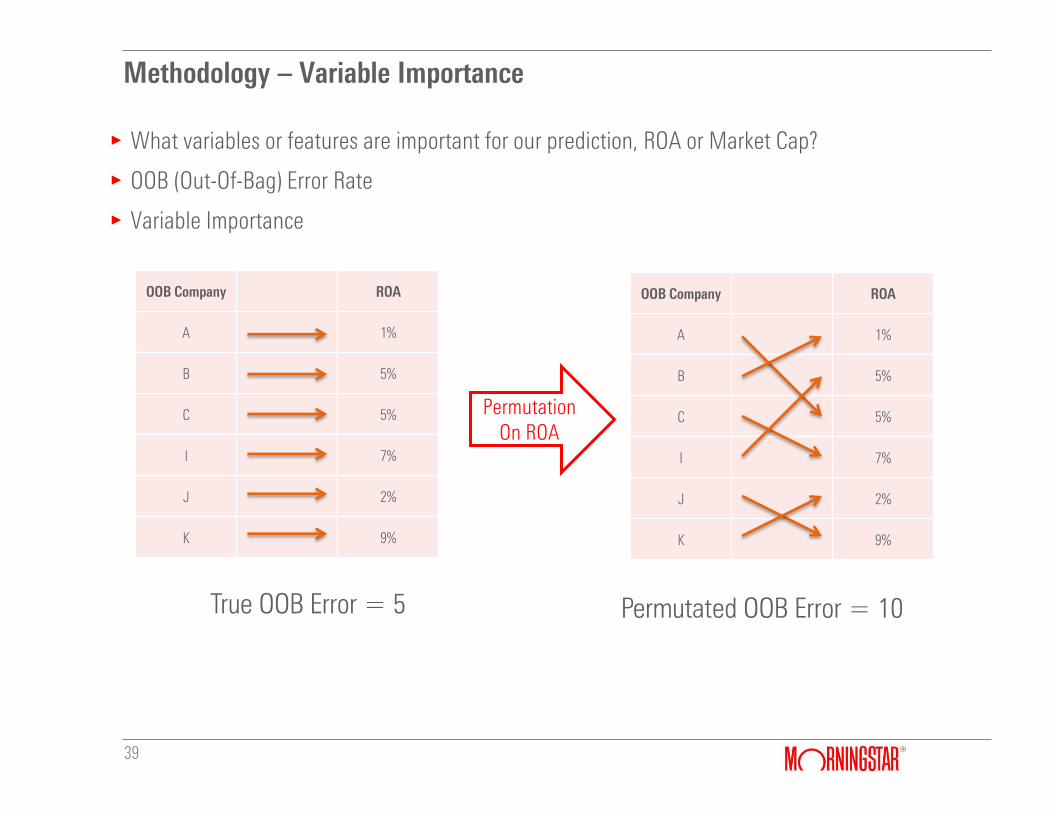
gWhat variables or features are important for our prediction, ROA or Market Cap?
gOOB (Out-Of-Bag) Error Rate
gVariable Importance
OOB Company ROA
A 1%
B 5%
C 5%
I 7%
J 2%
K 9%
OOB Company ROA
A 1%
B 5%
C 5%
I 7%
J 2%
K 9%
Permutation On ROA
True OOB Error = 5 Permutated OOB Error = 10
Methodology – Variable Importance
40
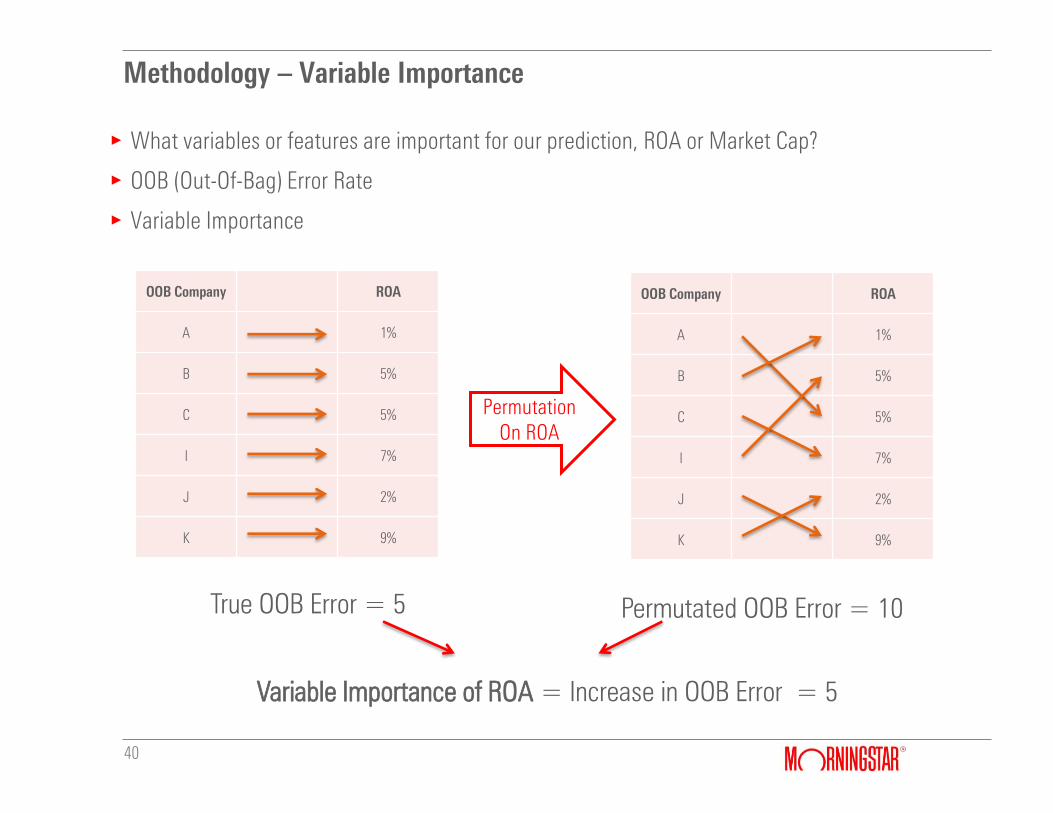
gWhat variables or features are important for our prediction, ROA or Market Cap?
gOOB (Out-Of-Bag) Error Rate
gVariable Importance
OOB Company ROA
A 1%
B 5%
C 5%
I 7%
J 2%
K 9%
OOB Company ROA
A 1%
B 5%
C 5%
I 7%
J 2%
K 9%
Permutation On ROA
Variable Importance of ROA = Increase in OOB Error = 5
True OOB Error = 5 Permutated OOB Error = 10
Methodology – Variable Importance
41
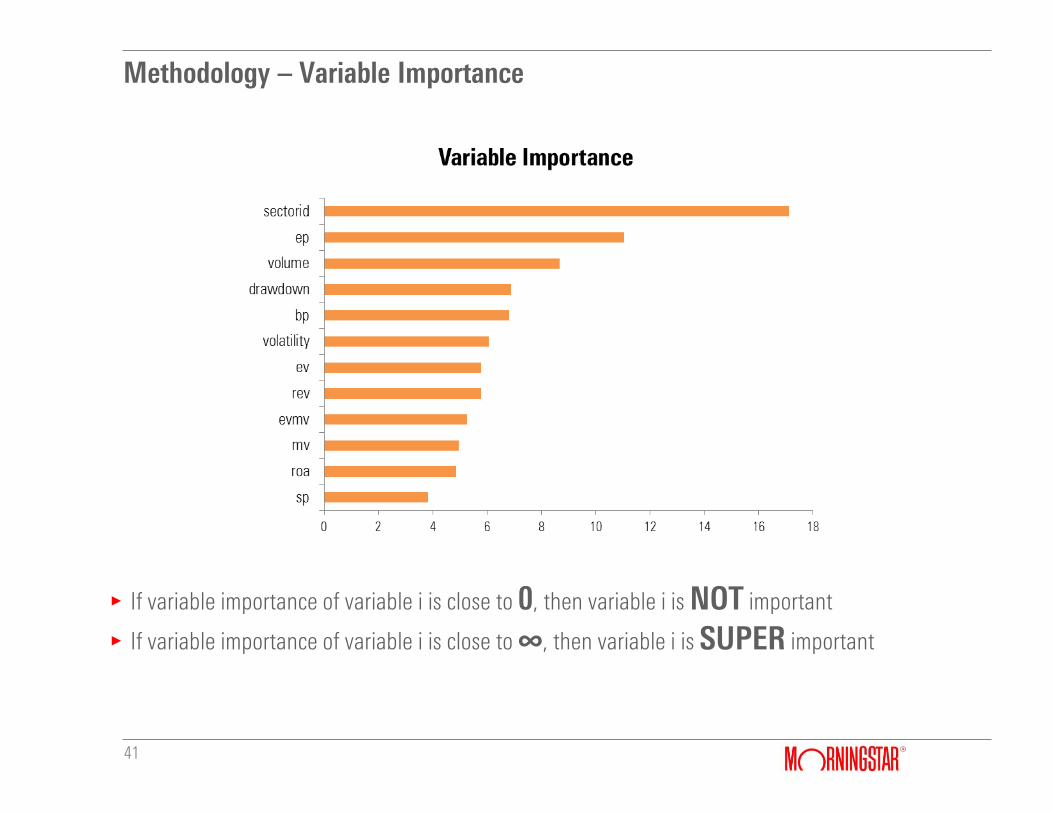
g If variable importance of variable i is close to 0, then variable i is NOT important
g If variable importance of variable i is close to ∞, then variable i is SUPER important
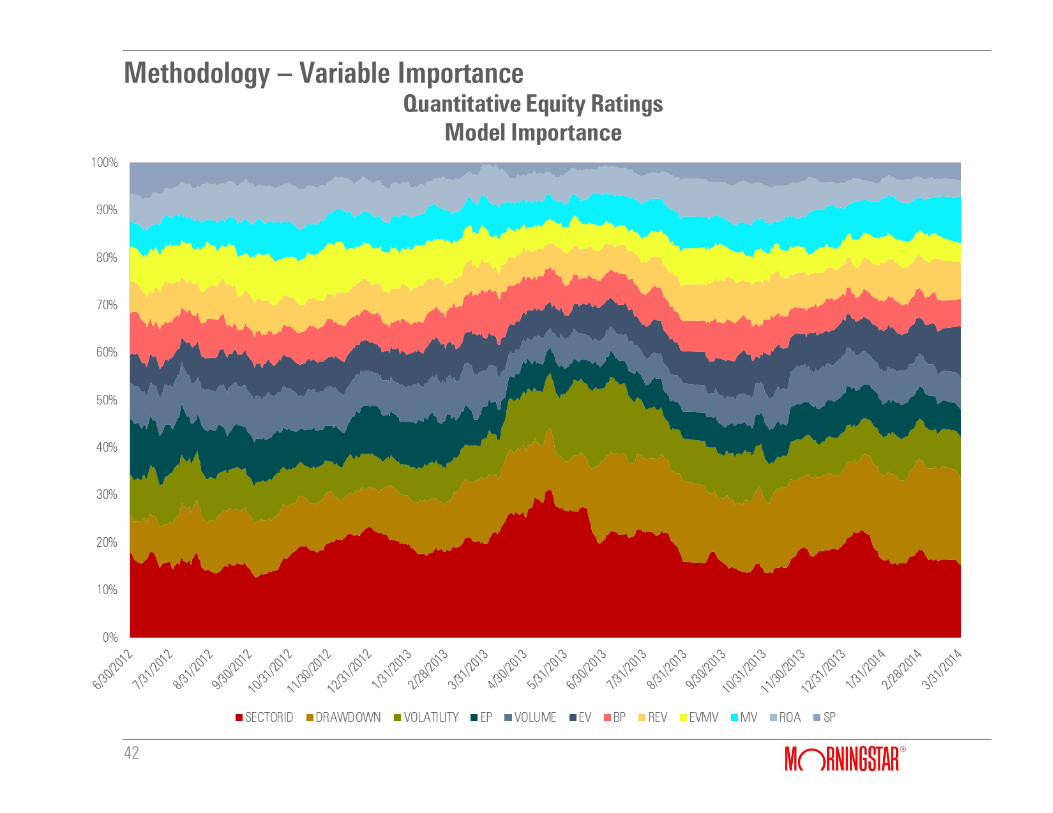
Methodology – Variable Importance
42
©2015 Morningstar, Inc. All rights reserved.
Morningstar Quantitative Research
44
Morningstar Quantitative Research Overview
Morningstar quantitative equity ratings vastly expand our coverage of the equity universe. They are designed to replicate the proven, proprietary, forward-looking analysis of our research team.
Morningstar Global Analyst Team
45
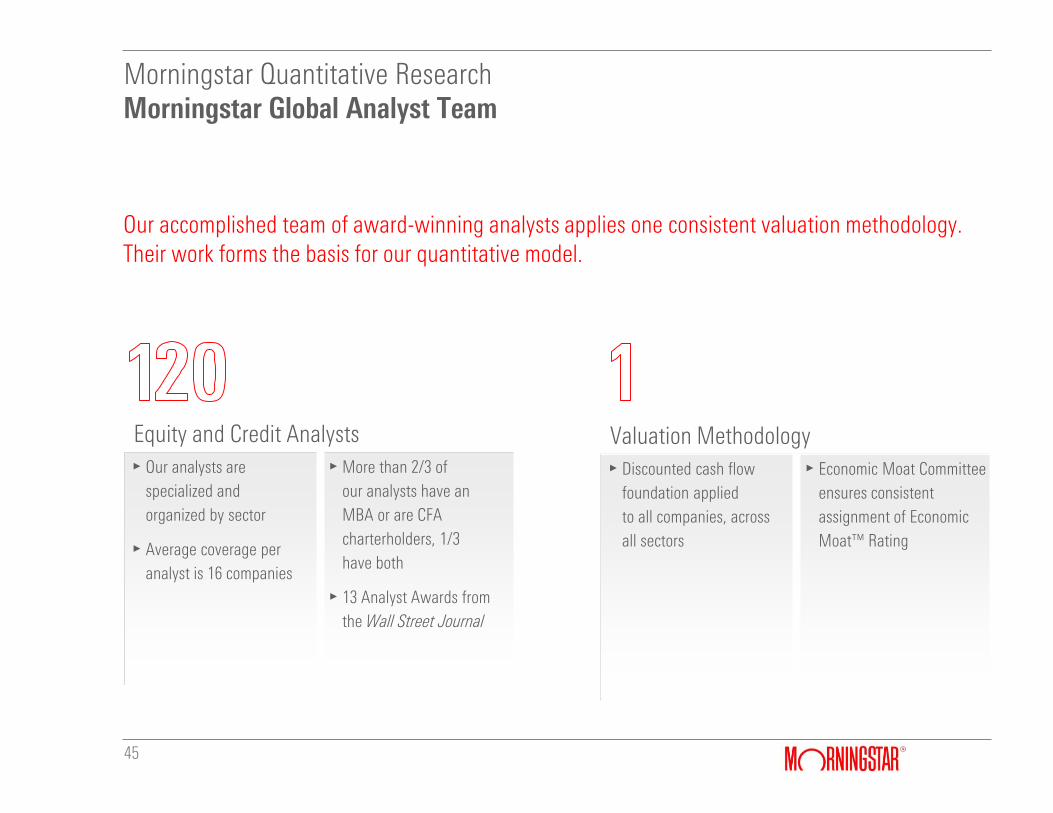
Morningstar Quantitative Research
Our accomplished team of award-winning analysts applies one consistent valuation methodology. Their work forms the basis for our quantitative model.
Equity and Credit Analysts
gOur analysts are
specialized and
organized by sector
gAverage coverage per
analyst is 16 companies
gMore than 2/3 of
our analysts have an
MBA or are CFA
charterholders, 1/3
have both
g13 Analyst Awards from
the Wall Street Journal
Valuation Methodology
gDiscounted cash flow
foundation applied
to all companies, across
all sectors
gEconomic Moat Committee
ensures consistent
assignment of Economic
Moat™ Rating
Morningstar’s Analyst Research Methodology
46
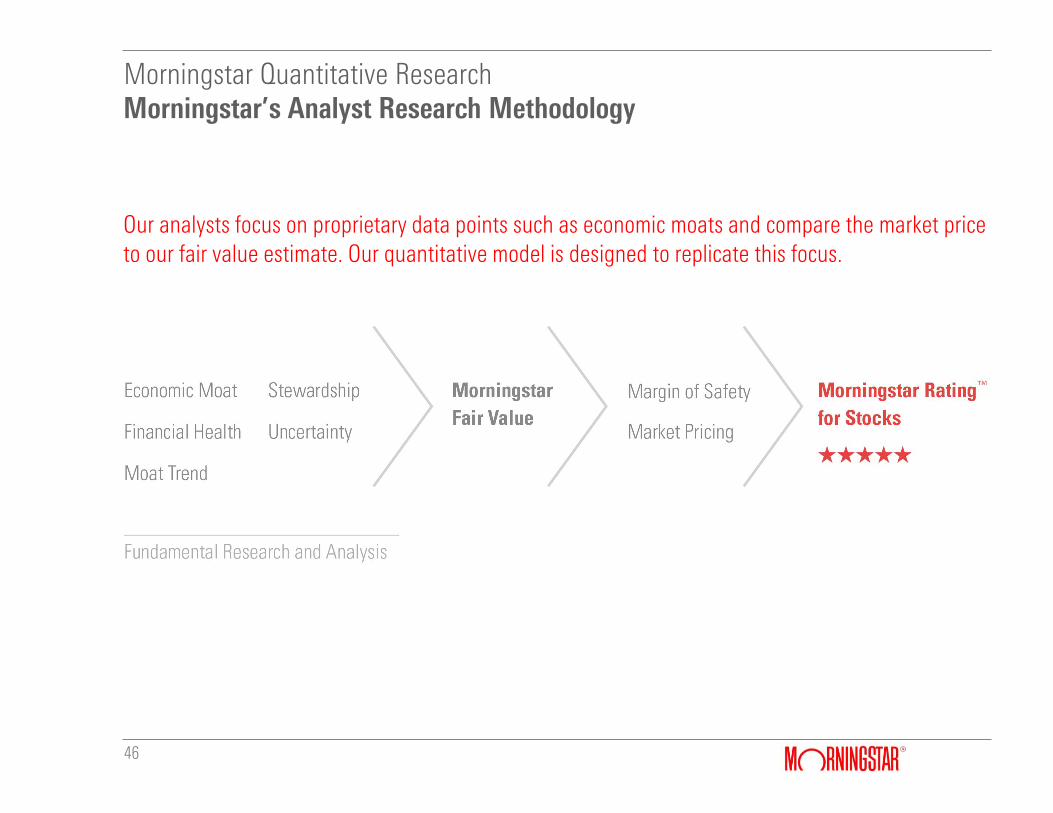
Morningstar Quantitative Research
Our analysts focus on proprietary data points such as economic moats and compare the market price to our fair value estimate. Our quantitative model is designed to replicate this focus.
The Effectiveness of Our Ratings Over Time
47
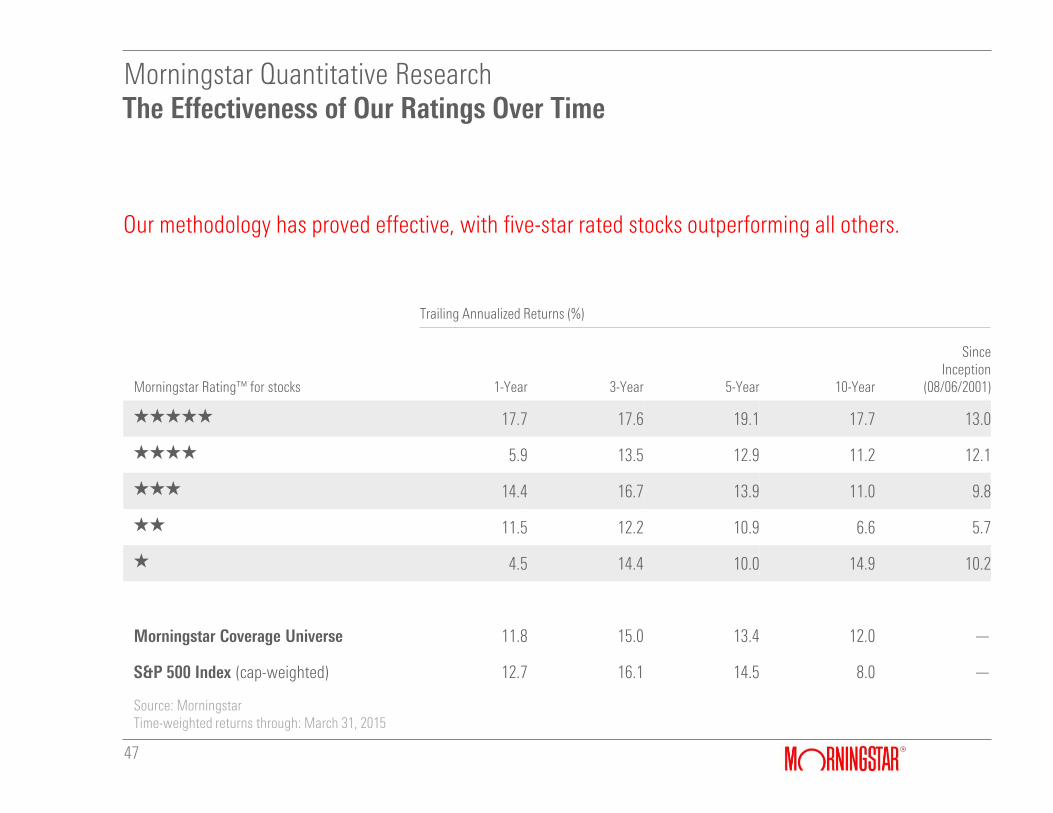
Morningstar Quantitative Research
Our methodology has proved effective, with five-star rated stocks outperforming all others.
Trailing Annualized Returns (%)
Morningstar Rating™ for stocks 1-Year 3-Year 5-Year 10-Year
Since Inception
(08/06/2001)
QQQQQ 17.7 17.6 19.1 17.7 13.0
QQQQ 5.9 13.5 12.9 11.2 12.1
QQQ 14.4 16.7 13.9 11.0 9.8
QQ 11.5 12.2 10.9 6.6 5.7
Q 4.5 14.4 10.0 14.9 10.2
Morningstar Coverage Universe 11.8 15.0 13.4 12.0 —
S&P 500 Index (cap-weighted) 12.7 16.1 14.5 8.0 —
Source: Morningstar Time-weighted returns through: March 31, 2015
Morningstar’s Quantitative Research Methodology
48
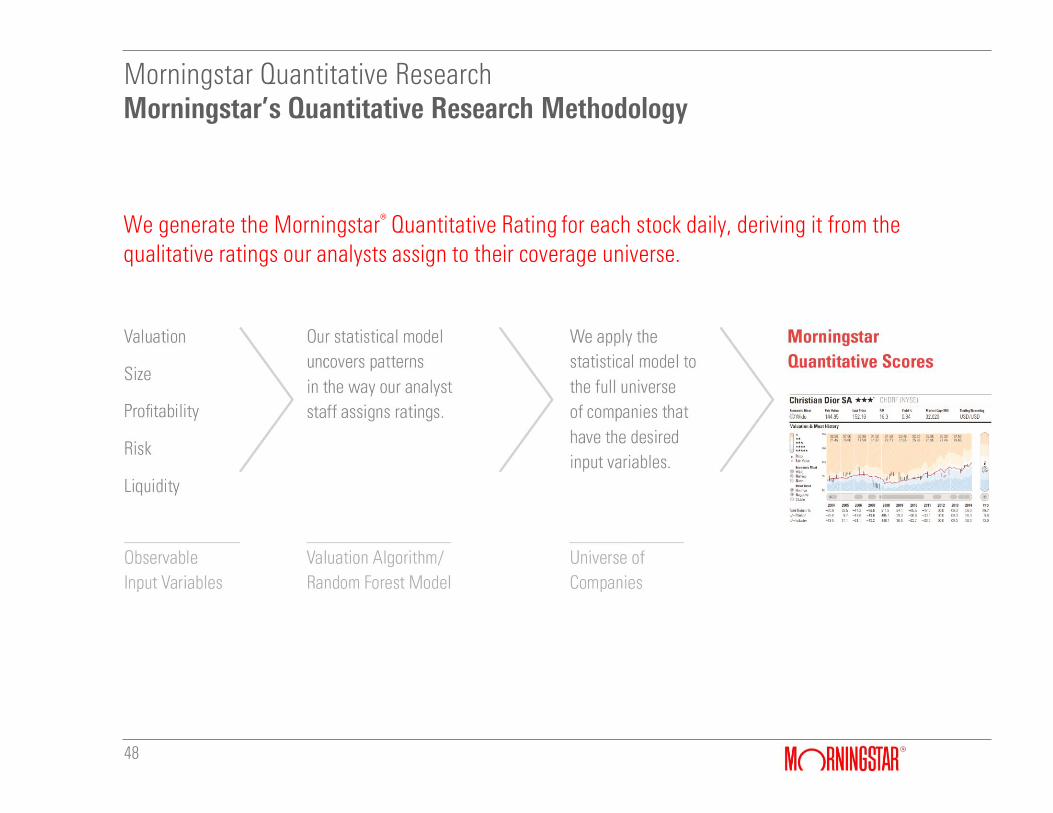
Morningstar Quantitative Research
We generate the Morningstar® Quantitative Rating for each stock daily, deriving it from the qualitative ratings our analysts assign to their coverage universe.
Our Quantitative Model Matches Our Analyst Ratings
49
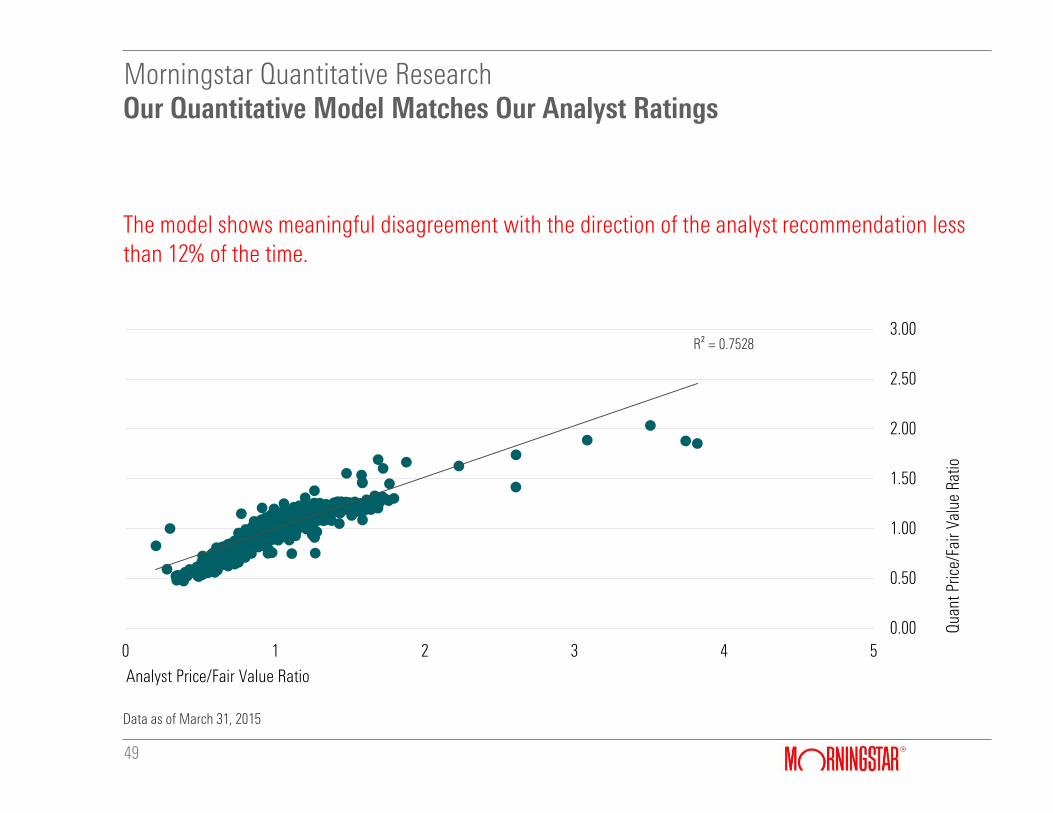
Morningstar Quantitative Research
The model shows meaningful disagreement with the direction of the analyst recommendation less than 12% of the time.
0.00
0.50
1.00
1.50
2.00
2.50
3.00
0 1 2 3 4 5
Qua
nt P
rice/
Fair
Valu
e R
atio
Analyst Price/Fair Value Ratio
Data as of March 31, 2015
R² = 0.7528
How Our Model Has Performed Over Time
50
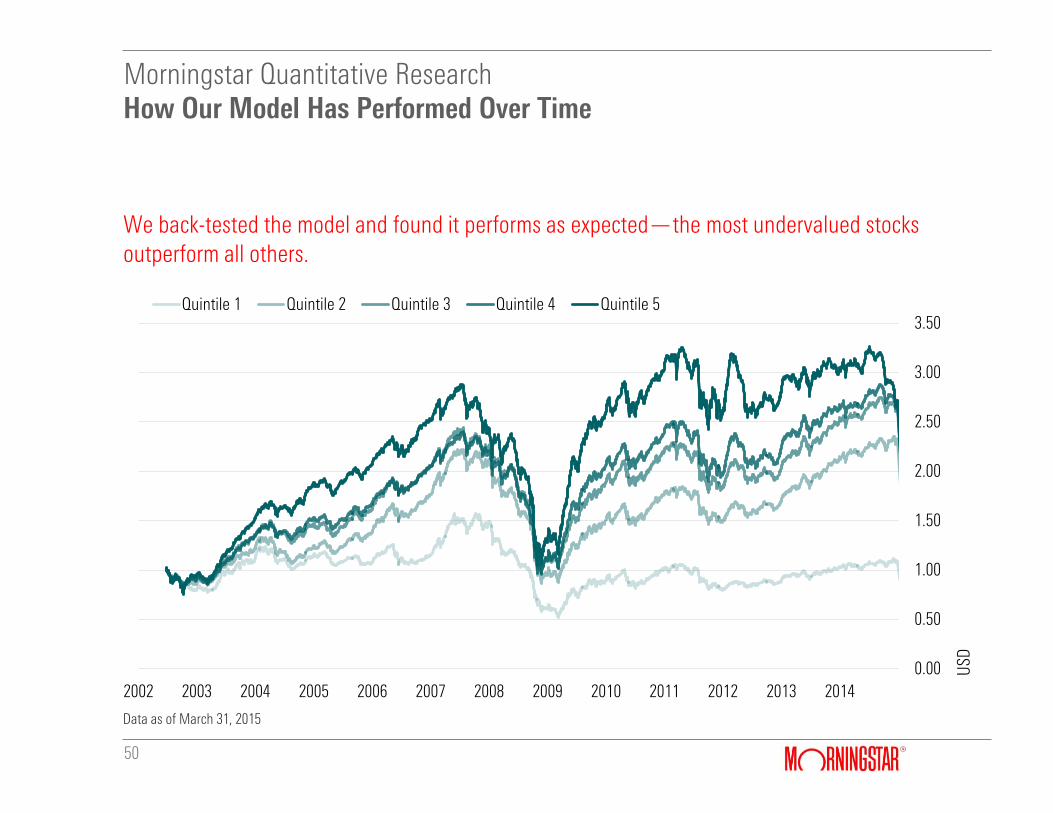
Morningstar Quantitative Research
We back-tested the model and found it performs as expected—the most undervalued stocks outperform all others.
0.00
0.50
1.00
1.50
2.00
2.50
3.00
3.50
2002 2003 2004 2005 2006 2007 2008 2009 2010 2011 2012 2013 2014
USD
Quintile 1 Quintile 2 Quintile 3 Quintile 4 Quintile 5
Data as of March 31, 2015
51
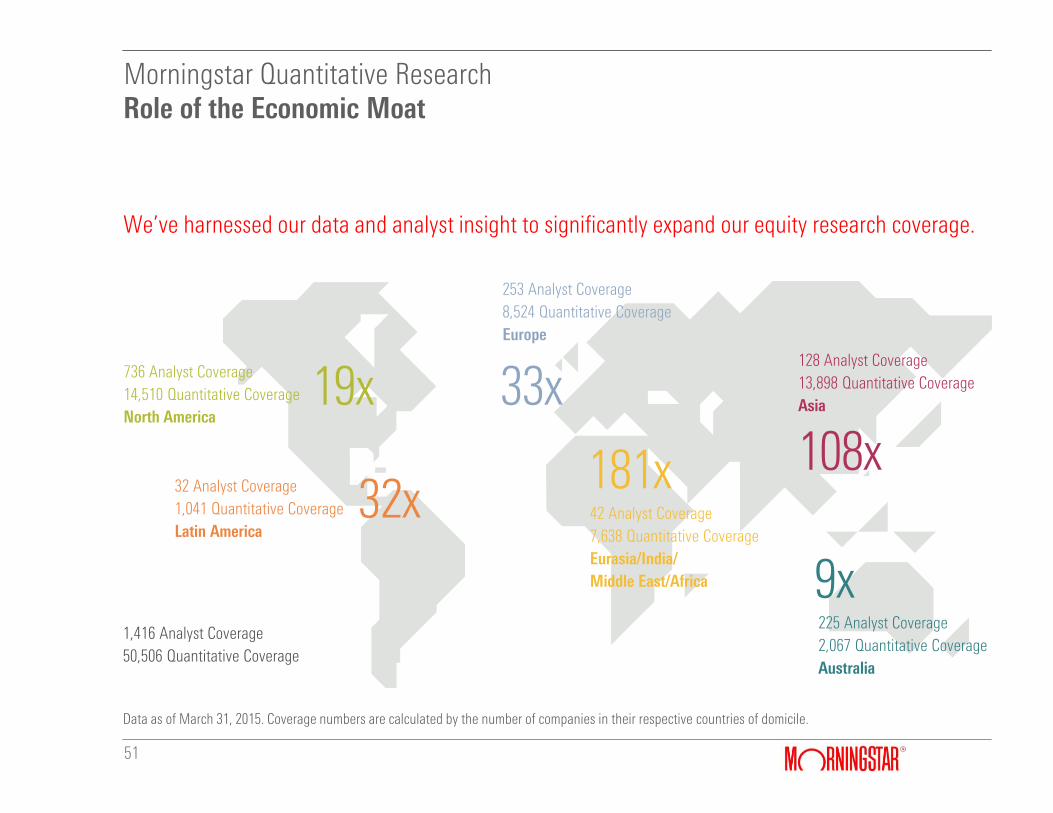
Role of the Economic Moat
We’ve harnessed our data and analyst insight to significantly expand our equity research coverage.
Morningstar Quantitative Research
736 Analyst Coverage
14,510 Quantitative Coverage
North America
253 Analyst Coverage
8,524 Quantitative Coverage
Europe
128 Analyst Coverage
13,898 Quantitative Coverage
Asia
32 Analyst Coverage
1,041 Quantitative Coverage
Latin America 42 Analyst Coverage
7,638 Quantitative Coverage
Eurasia/India/
Middle East/Africa
225 Analyst Coverage
2,067 Quantitative Coverage
Australia
1,416 Analyst Coverage
50,506 Quantitative Coverage
19x 33x 108x 181x
32x
9x
Data as of March 31, 2015. Coverage numbers are calculated by the number of companies in their respective countries of domicile.
52
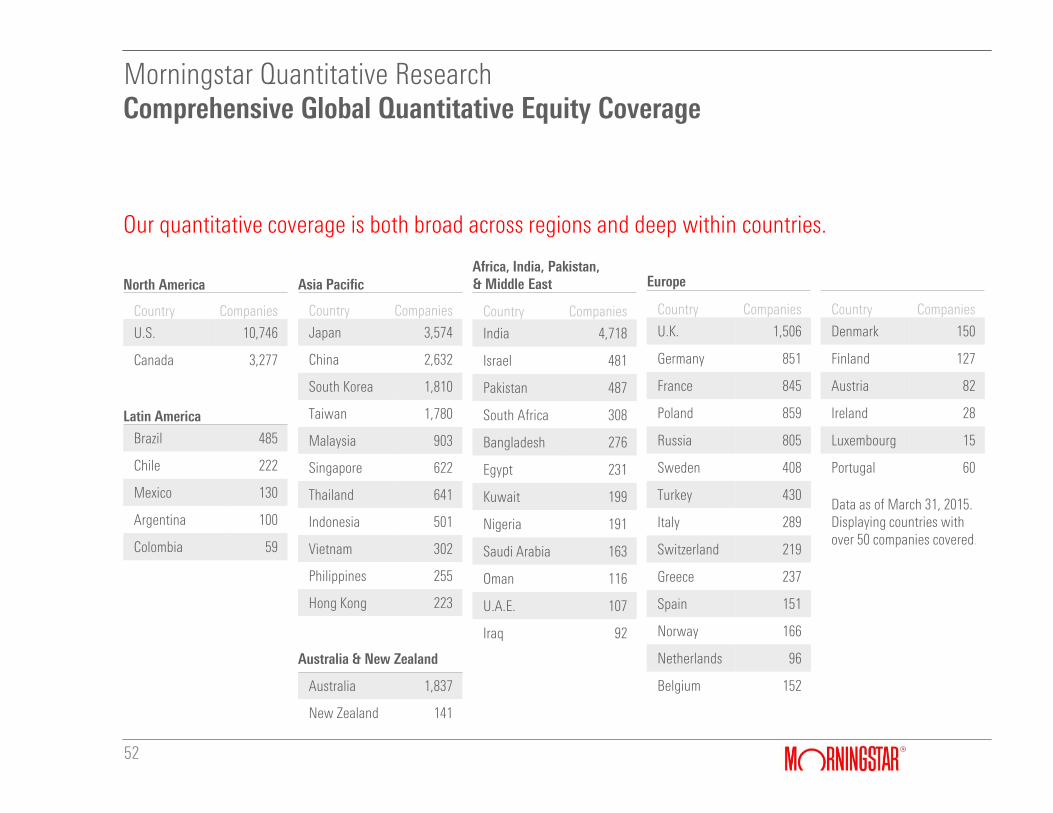
Comprehensive Global Quantitative Equity Coverage
Our quantitative coverage is both broad across regions and deep within countries.
Morningstar Quantitative Research
North America
Country Companies
U.S. 10,746
Canada 3,277
Latin America
Brazil 485
Chile 222
Mexico 130
Argentina 100
Colombia 59
Asia Pacific
Country Companies
Japan 3,574
China 2,632
South Korea 1,810
Taiwan 1,780
Malaysia 903
Singapore 622
Thailand 641
Indonesia 501
Vietnam 302
Philippines 255
Hong Kong 223
Australia & New Zealand
Australia 1,837
New Zealand 141
Africa, India, Pakistan, & Middle East
Country Companies
India 4,718
Israel 481
Pakistan 487
South Africa 308
Bangladesh 276
Egypt 231
Kuwait 199
Nigeria 191
Saudi Arabia 163
Oman 116
U.A.E. 107
Iraq 92
Europe
Country Companies
U.K. 1,506
Germany 851
France 845
Poland 859
Russia 805
Sweden 408
Turkey 430
Italy 289
Switzerland 219
Greece 237
Spain 151
Norway 166
Netherlands 96
Belgium 152
Country Companies
Denmark 150
Finland 127
Austria 82
Ireland 28
Luxembourg 15
Portugal 60
Data as of March 31, 2015. Displaying countries with over 50 companies covered.
53
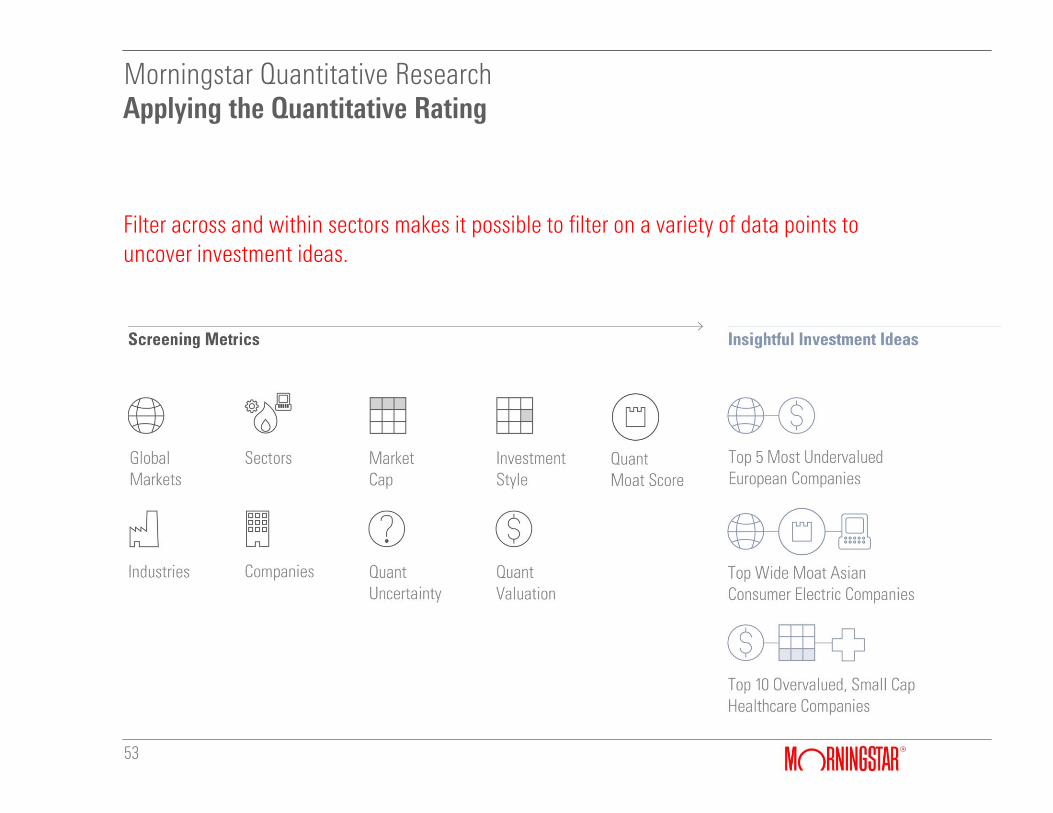
Applying the Quantitative Rating
Filter across and within sectors makes it possible to filter on a variety of data points to uncover investment ideas.
Morningstar Quantitative Research
Next Steps
54
Morningstar Quantitative Research
gMorningstar’s quantitative research:
/ Is forward-looking and distinct from other quantitative tools
/Applies the principles of 10 years of successful Morningstar analyst experience
/Aims to predict future alpha
/Offers broad and deep global coverage
gMeet with one of our quantitative analysts to learn more about our methodology and explore sample data
Andy Tang, CFA
Quantitative Analyst
(312) 384-4839
55
Appendix
56
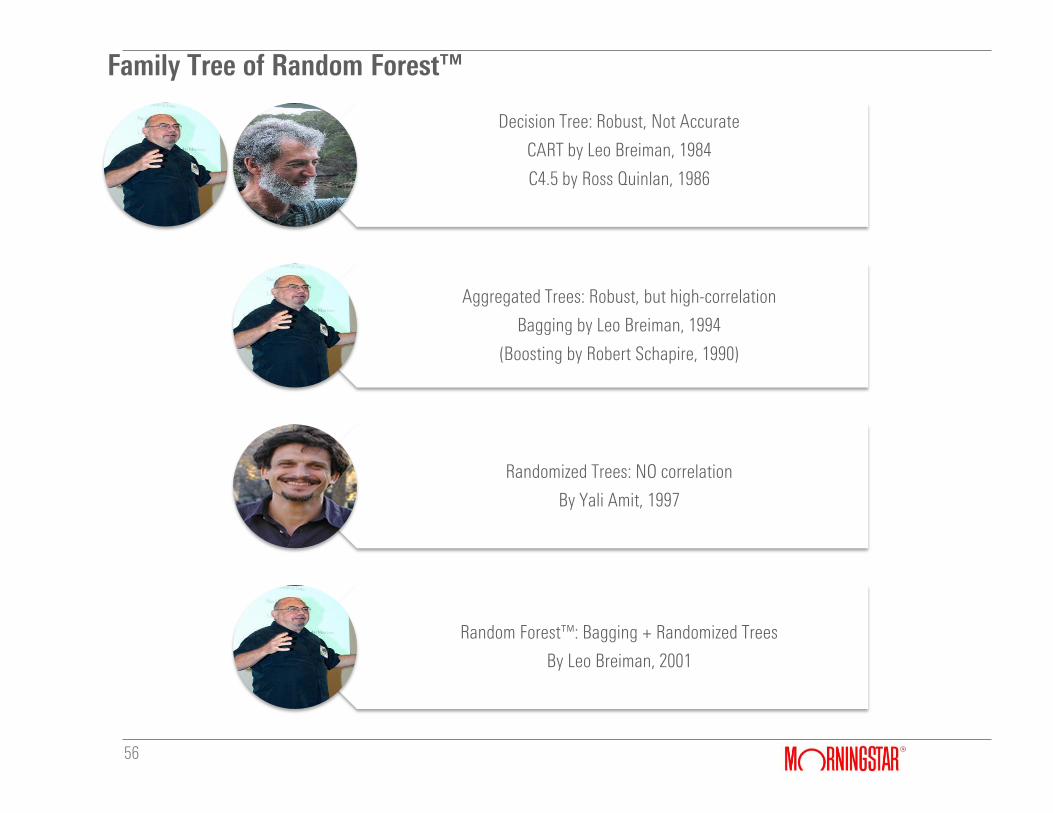
Decision Tree: Robust, Not Accurate
CART by Leo Breiman, 1984
C4.5 by Ross Quinlan, 1986
Aggregated Trees: Robust, but high-correlation
Bagging by Leo Breiman, 1994
(Boosting by Robert Schapire, 1990)
Randomized Trees: NO correlation
By Yali Amit, 1997
Random Forest™: Bagging + Randomized Trees
By Leo Breiman, 2001
Family Tree of Random Forest™
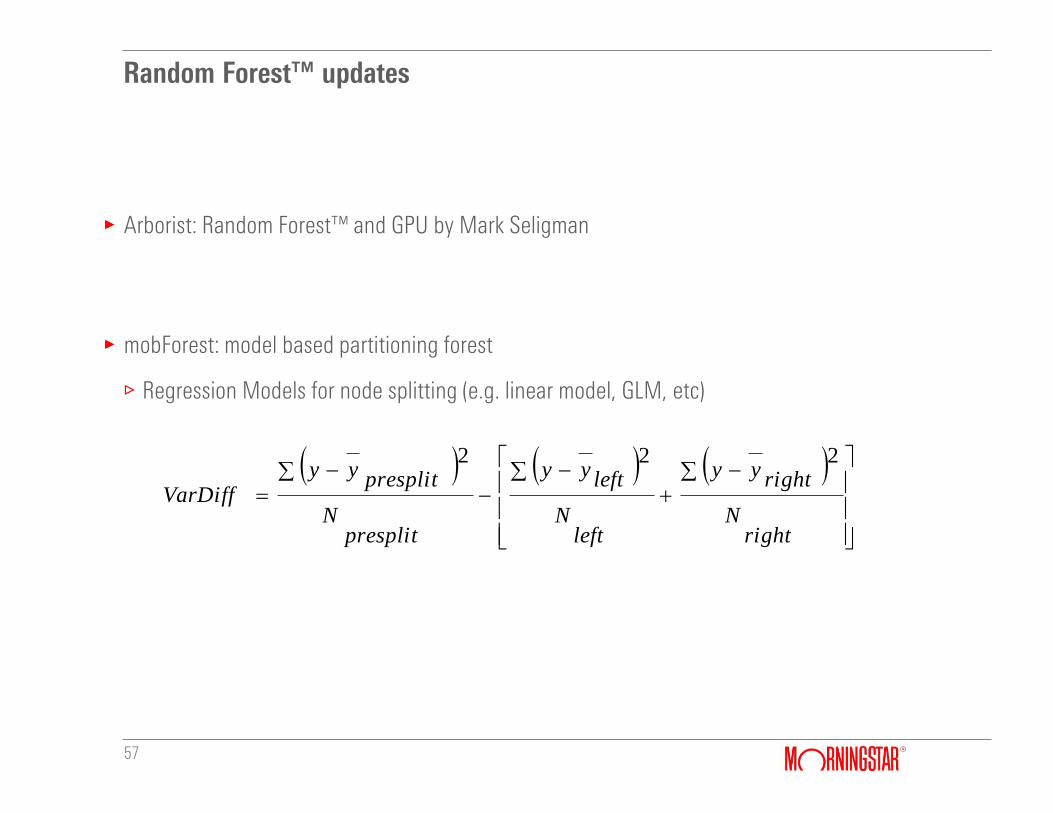
Random Forest™ updates
57
gArborist: Random Forest™ and GPU by Mark Seligman
gmobForest: model based partitioning forest
/Regression Models for node splitting (e.g. linear model, GLM, etc)
rightN
rightyy
leftN
leftyy
presplitN
presplityy
VarDiff
222

Recommended