ELEC 492 Senior Design Project:
Cycle to Sustain
Critical Design Review
A Design Report Submitted by:
Javier Flamarique, David Leyva, Nichole Norby, and Marilyn Smith
Group # 3
Submittal Date: March 22, 2011
Cycle to Sustain
2
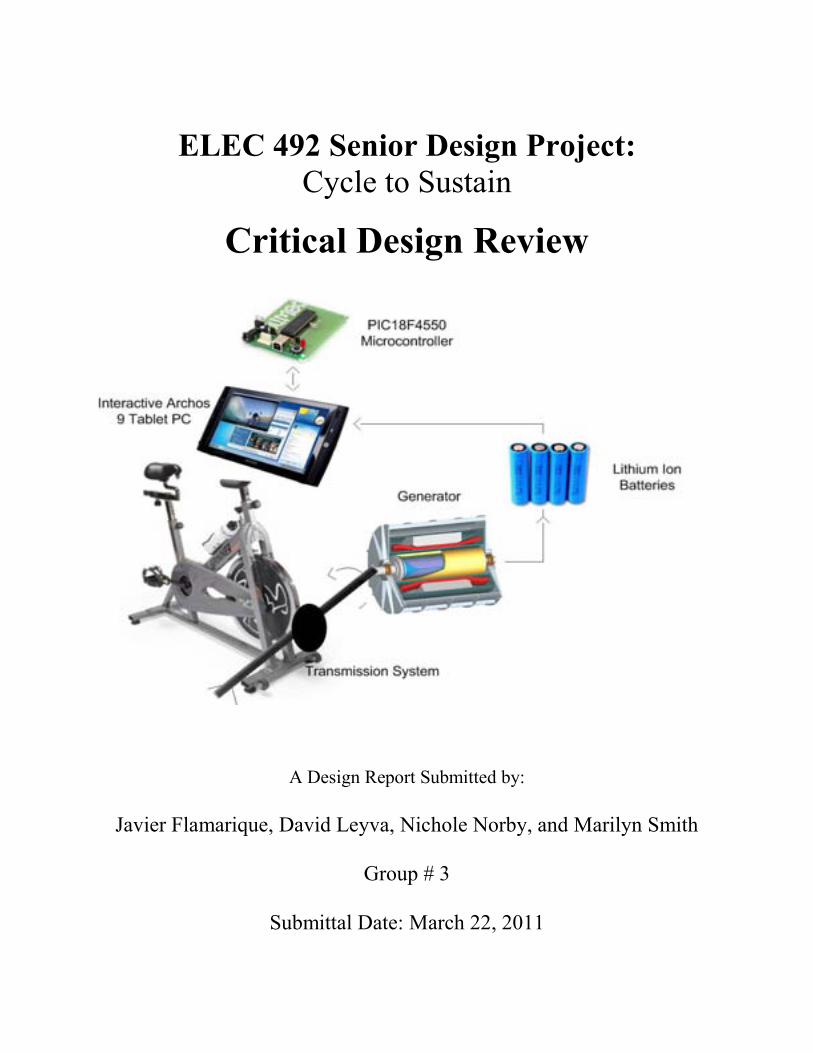
Abstract Energy conservation is becoming progressively more important as the demand for electricity from renewable energy sources continues to increase. As consumers of electricity, people should have a grasp of the amount of electrical energy that they use every day and understand how their choices and habits effect the environment. Our goal for Cycle to Sustain is to provide a tangible display of the amount of energy that students use. Our design will convert the mechanical energy from the wheel of a spin bicycle into electrical energy, and we will use that energy to power a display screen. The system will promote energy efficiency and conservation by relating physical work to the amount of power that is used in common electrical devices and appliances. By providing students the opportunity to compare their physical work to their daily electricity usage, they will witness firsthand what they can do to live a more energy efficient lifestyle.
Cycle to Sustain
3
Table of Contents Abstract ........................................................................................................................................... 2
List of Figures ................................................................................................................................. 4
List of Tables .................................................................................................................................. 4
1. Context and Deliverables ........................................................................................................ 5
2. Design Analysis and Results ................................................................................................... 6
2.1. System Analysis and Design ............................................................................................ 6
2.2. Subsystem Analysis and Design ...................................................................................... 8
2.2.1. Transmission ............................................................................................................. 8
2.2.2. Generator................................................................................................................. 10
2.2.3. Battery and Voltage Regulation .............................................................................. 14
2.2.4. Microprocessor and Screen ..................................................................................... 17
3. Appendices ............................................................................................................................ 22
A. Complete Parts List ........................................................................................................ 22
B. Team Member Information ............................................................................................ 24
C. Technical Design Documents......................................................................................... 29
1. Mechanical Drawings ........................................................................................................ 29
2. Electrical Hardware Schematics ........................................................................................ 34
Cycle to Sustain
4
List of Figures Figure 1: Overall System Block Diagram ........................................................................................................................ 6 Figure 2: System Layout Diagram .................................................................................................................................. 7 Figure 3: Electric model of a DC Generator .................................................................................................................. 11 Figure 4: Electrical Energy Output – 9.72 ohms load ................................................................................................... 13 Figure 5: Visual Studios C# Form Design ...................................................................................................................... 20
List of Tables Table 1: Specifications and Design for Transmission System ......................................................................................... 8 Table 2: Mechanical Energy Input - Shaft speed .......................................................................................................... 12 Table 3: Electrical Energy Output - 1.55 ohms load ..................................................................................................... 12 Table 4: Electrical Energy Output – 2.5 ohms load ...................................................................................................... 12 Table 5: Electrical Energy Output – 9.72 ohms load .................................................................................................... 13 Table 6: Output Signals Displayed on Tablet PC .......................................................................................................... 15 Table 7: Specifications for PCB ..................................................................................................................................... 15 Table 8: Specifications for Hardware (for PCB) ............................................................................................................ 16 Table 9: Microcontroller and Screen Specifications ..................................................................................................... 17 Table 10: Screen Program Flowchart ........................................................................................................................... 19

Cycle to Sustain
5
1. Context and Deliverables This project is intended to create an awareness of energy efficiency and usage. Specifically we are aiming to encourage the students on University of San Diego (USD) campus to live a more sustainable lifestyle. Our project will address the need to promote energy efficiency and increase the awareness of electrical energy usage. We were approached by the Director of Sustainability at the University of San Diego, Michael Catanzaro, to provide an innovative and appealing way to make energy more tangible to the campus. We will provide Mr. Catanzaro with a product that supports his mission to increase awareness and conservation of finite resources on our campus. Cycle to Sustain will to join Mr. Catanzaro in his effort to make the University of San Diego a more sustainable and energy conscious campus. Our project hopes to a tangible example of energy to increase understanding. By more comprehensively understanding how much energy it takes to light a classroom or dorm, or run common appliances, students can begin to make sustainable choices when it comes to energy. By implementing this project, we will educate students on their effects on the environment, providing them with important information that they can use in their futures. We plan to promote this concept by designing an entirely sustainable project and providing a way to economically generate power from a bicycle and use this power to drive screen that will provide a correlation between the power being produced and the power users typically use in a day. The following are project deliverables that have been obtained as of this report:
Revision 1 of our circuit board has been designed, soldered and tested Microprocessor programmed to convert the analog power monitor output to a digital
signal that is output via USB Tablet PC programmed to read microprocessor output and calculate total power
generated given the signal result Transmission system is built and initial tests have been run Generator is purchased and tests have been completed to characterize the generator
Cycle to Sustain
6
2. Design Analysis and Results
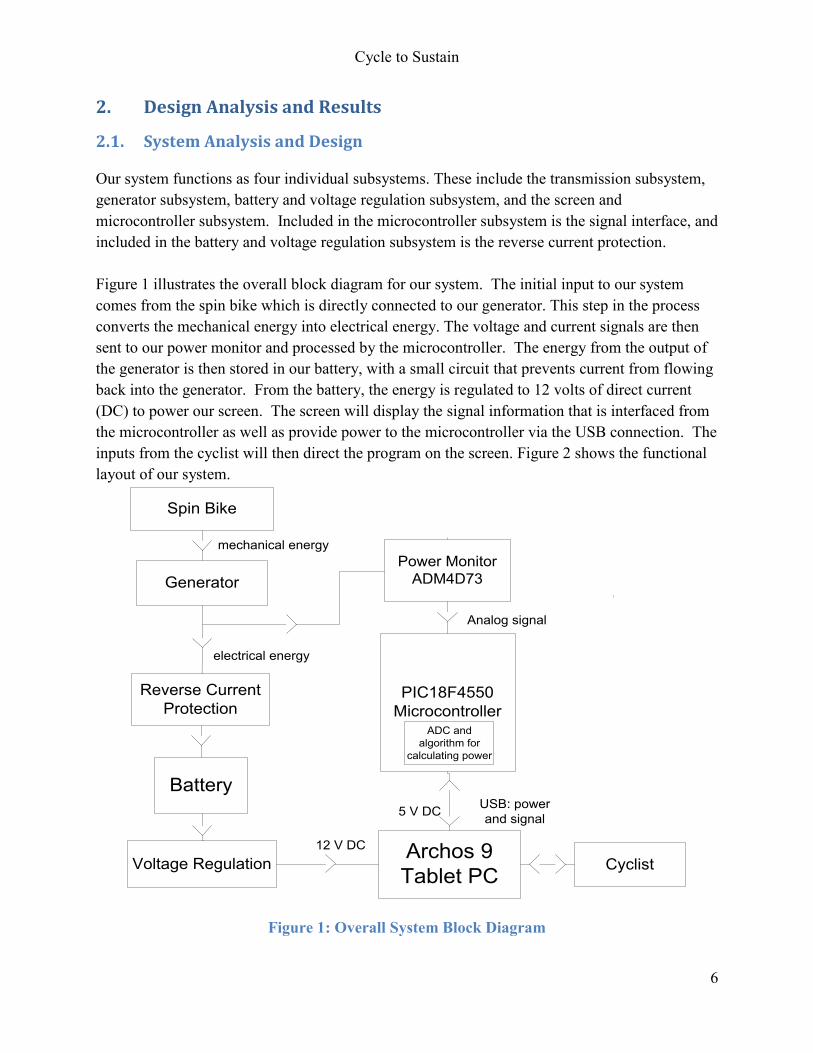
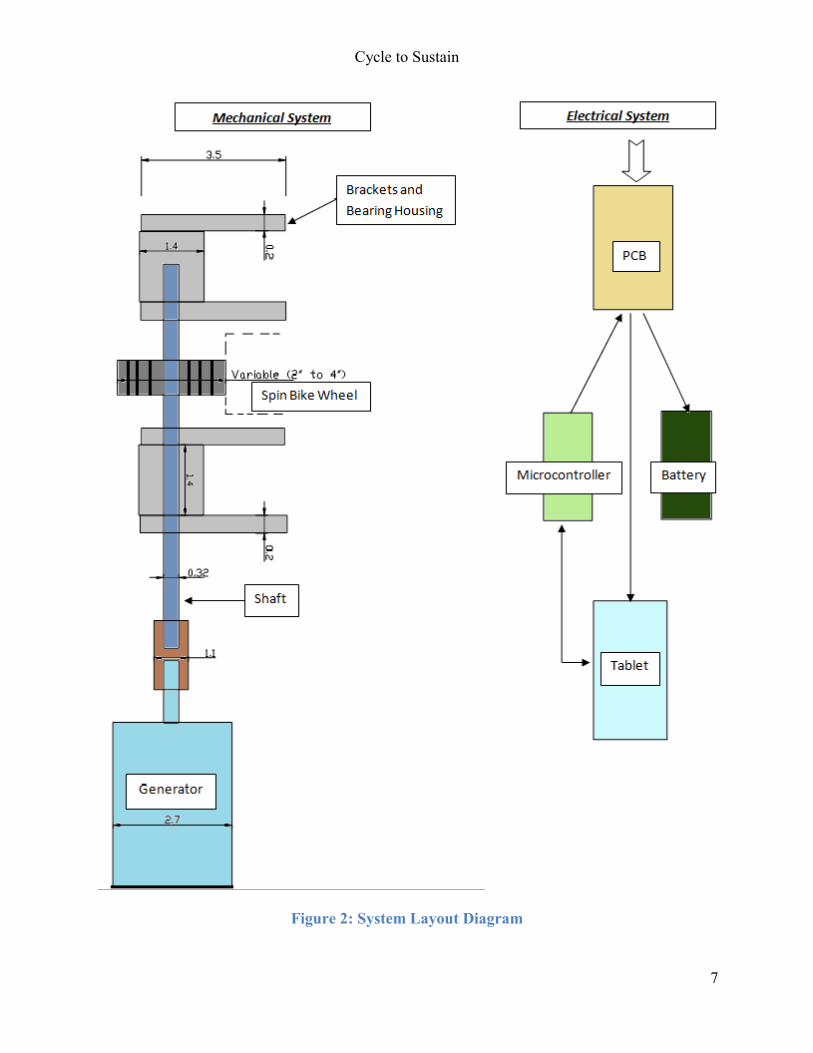
2.1. System Analysis and Design Our system functions as four individual subsystems. These include the transmission subsystem, generator subsystem, battery and voltage regulation subsystem, and the screen and microcontroller subsystem. Included in the microcontroller subsystem is the signal interface, and included in the battery and voltage regulation subsystem is the reverse current protection. Figure 1 illustrates the overall block diagram for our system. The initial input to our system comes from the spin bike which is directly connected to our generator. This step in the process converts the mechanical energy into electrical energy. The voltage and current signals are then sent to our power monitor and processed by the microcontroller. The energy from the output of the generator is then stored in our battery, with a small circuit that prevents current from flowing back into the generator. From the battery, the energy is regulated to 12 volts of direct current (DC) to power our screen. The screen will display the signal information that is interfaced from the microcontroller as well as provide power to the microcontroller via the USB connection. The inputs from the cyclist will then direct the program on the screen. Figure 2 shows the functional layout of our system.
PIC18F4550Microcontroller
Battery
Archos 9 Tablet PC Cyclist
Generator
ADC and algorithm for
calculating power
Voltage Regulation
Power MonitorADM4D73
Spin Bike
USB: power and signal
12 V DC
mechanical energy
electrical energy
Analog signal
Reverse Current Protection
5 V DC
Figure 1: Overall System Block Diagram
Cycle to Sustain
7
Figure 2: System Layout Diagram
Cycle to Sustain
8
2.2. Subsystem Analysis and Design
2.2.1. Transmission
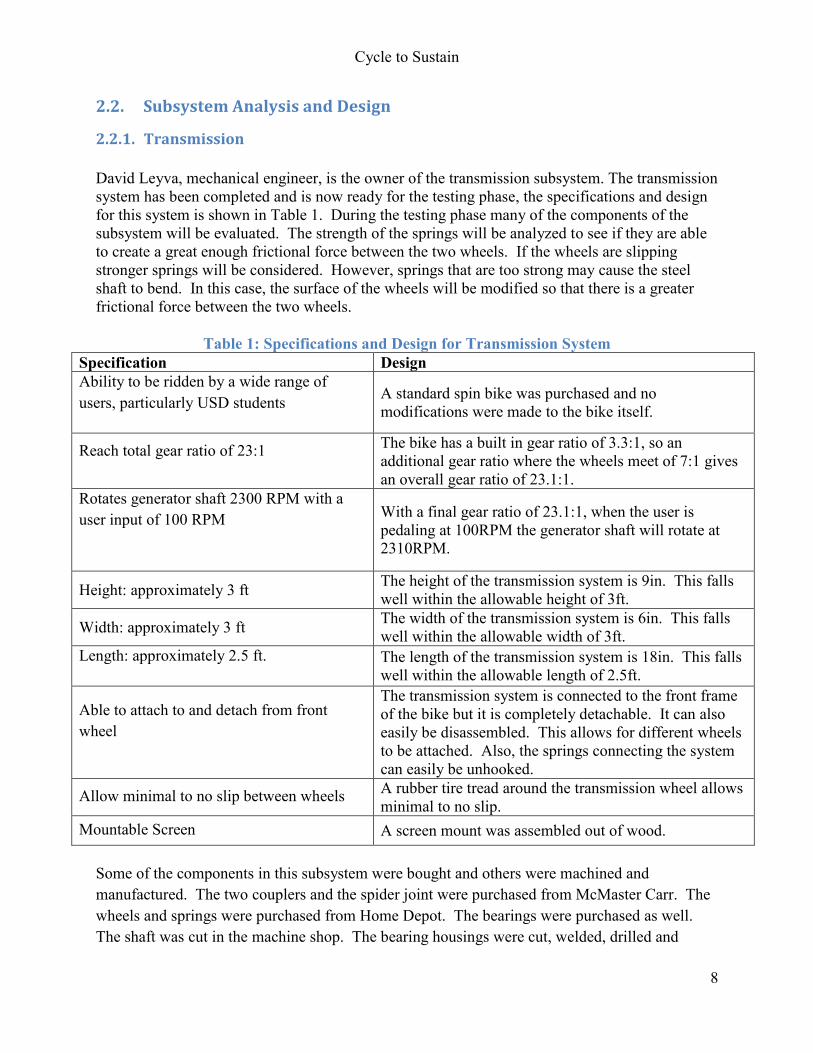
David Leyva, mechanical engineer, is the owner of the transmission subsystem. The transmission system has been completed and is now ready for the testing phase, the specifications and design for this system is shown in Table 1. During the testing phase many of the components of the subsystem will be evaluated. The strength of the springs will be analyzed to see if they are able to create a great enough frictional force between the two wheels. If the wheels are slipping stronger springs will be considered. However, springs that are too strong may cause the steel shaft to bend. In this case, the surface of the wheels will be modified so that there is a greater frictional force between the two wheels.
Table 1: Specifications and Design for Transmission System
Specification Design Ability to be ridden by a wide range of users, particularly USD students
A standard spin bike was purchased and no modifications were made to the bike itself.
Reach total gear ratio of 23:1
The bike has a built in gear ratio of 3.3:1, so an additional gear ratio where the wheels meet of 7:1 gives an overall gear ratio of 23.1:1.
Rotates generator shaft 2300 RPM with a user input of 100 RPM
With a final gear ratio of 23.1:1, when the user is pedaling at 100RPM the generator shaft will rotate at 2310RPM.
Height: approximately 3 ft The height of the transmission system is 9in. This falls well within the allowable height of 3ft.
Width: approximately 3 ft The width of the transmission system is 6in. This falls well within the allowable width of 3ft.
Length: approximately 2.5 ft.
The length of the transmission system is 18in. This falls well within the allowable length of 2.5ft.
Able to attach to and detach from front wheel
The transmission system is connected to the front frame of the bike but it is completely detachable. It can also easily be disassembled. This allows for different wheels to be attached. Also, the springs connecting the system can easily be unhooked.
Allow minimal to no slip between wheels A rubber tire tread around the transmission wheel allows minimal to no slip.
Mountable Screen A screen mount was assembled out of wood. Some of the components in this subsystem were bought and others were machined and manufactured. The two couplers and the spider joint were purchased from McMaster Carr. The wheels and springs were purchased from Home Depot. The bearings were purchased as well. The shaft was cut in the machine shop. The bearing housings were cut, welded, drilled and
Cycle to Sustain
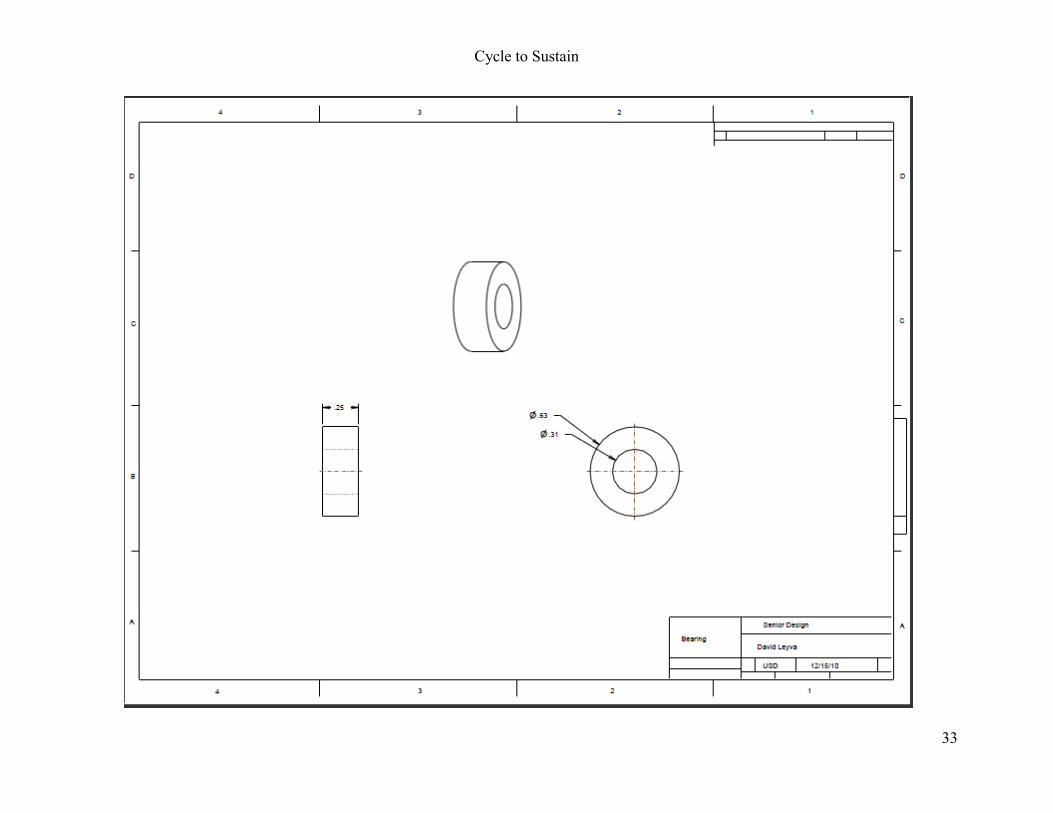
9
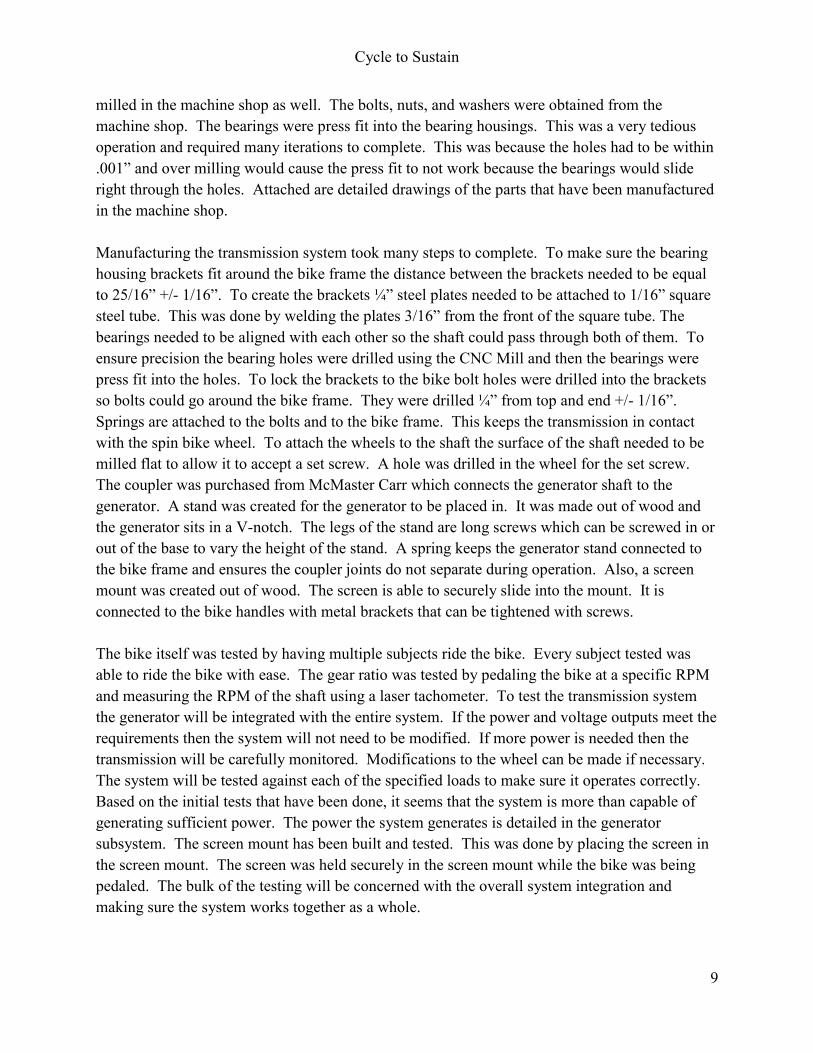
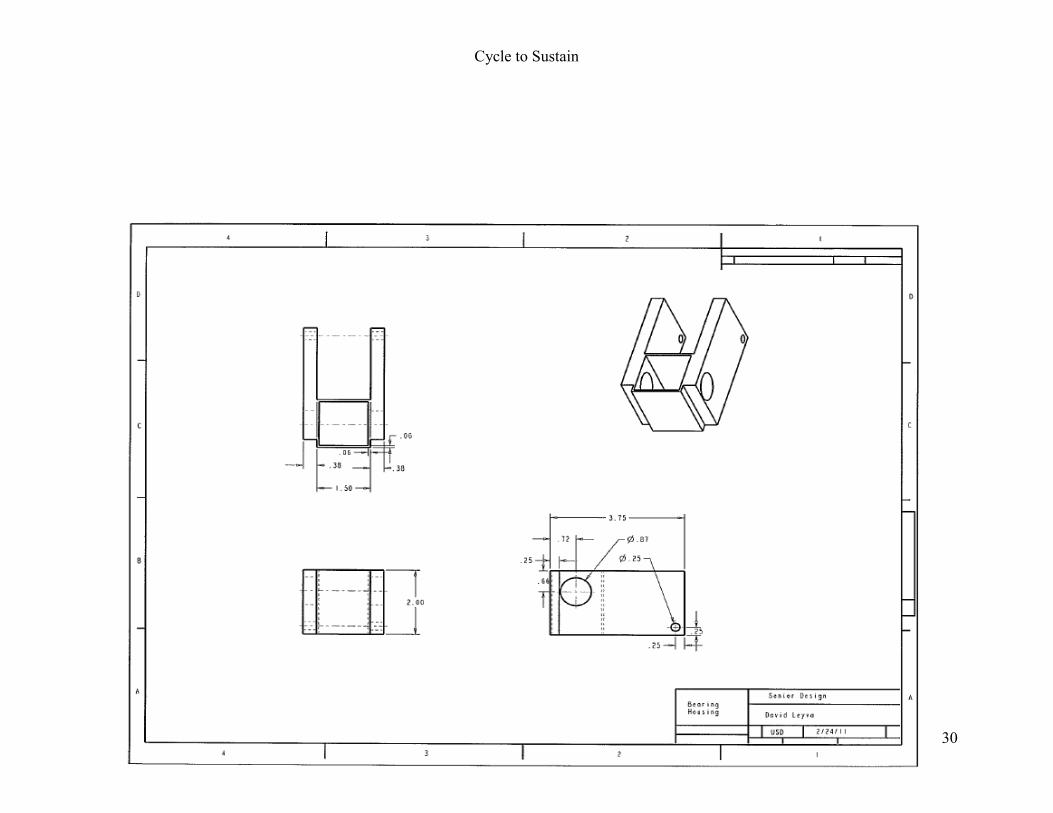
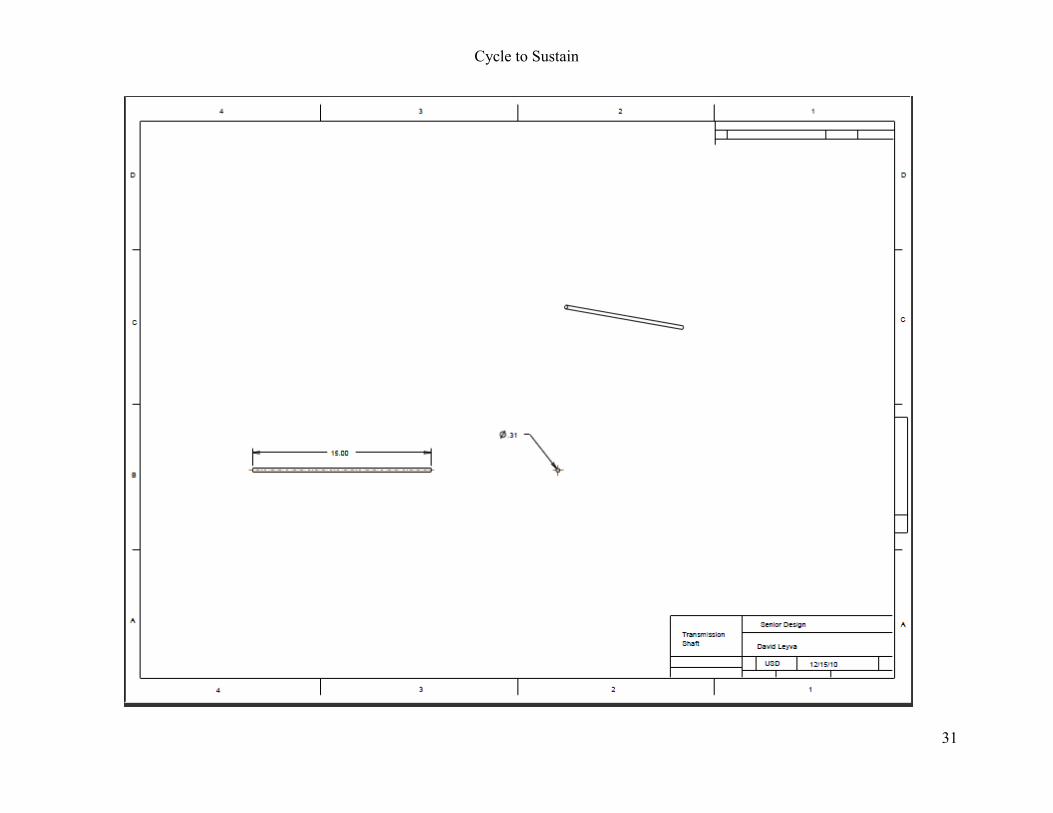
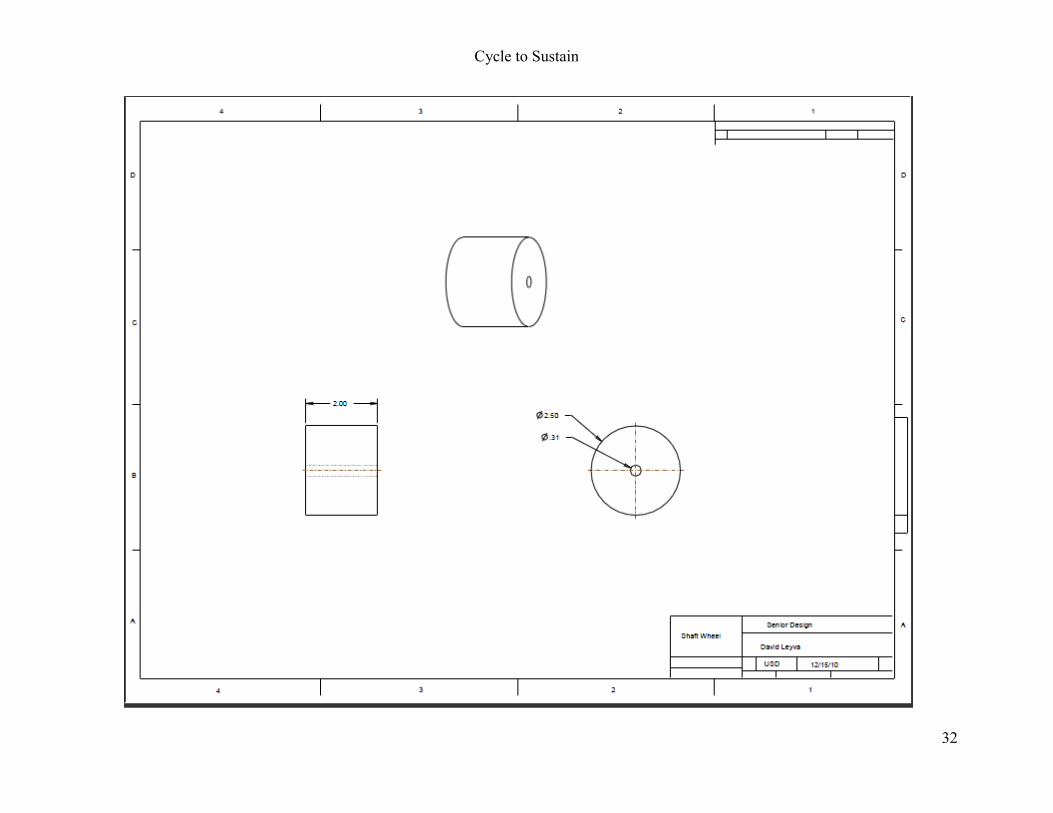
milled in the machine shop as well. The bolts, nuts, and washers were obtained from the machine shop. The bearings were press fit into the bearing housings. This was a very tedious operation and required many iterations to complete. This was because the holes had to be within .001” and over milling would cause the press fit to not work because the bearings would slide right through the holes. Attached are detailed drawings of the parts that have been manufactured in the machine shop. Manufacturing the transmission system took many steps to complete. To make sure the bearing housing brackets fit around the bike frame the distance between the brackets needed to be equal to 25/16” +/- 1/16”. To create the brackets ¼” steel plates needed to be attached to 1/16” square steel tube. This was done by welding the plates 3/16” from the front of the square tube. The bearings needed to be aligned with each other so the shaft could pass through both of them. To ensure precision the bearing holes were drilled using the CNC Mill and then the bearings were press fit into the holes. To lock the brackets to the bike bolt holes were drilled into the brackets so bolts could go around the bike frame. They were drilled ¼” from top and end +/- 1/16”. Springs are attached to the bolts and to the bike frame. This keeps the transmission in contact with the spin bike wheel. To attach the wheels to the shaft the surface of the shaft needed to be milled flat to allow it to accept a set screw. A hole was drilled in the wheel for the set screw. The coupler was purchased from McMaster Carr which connects the generator shaft to the generator. A stand was created for the generator to be placed in. It was made out of wood and the generator sits in a V-notch. The legs of the stand are long screws which can be screwed in or out of the base to vary the height of the stand. A spring keeps the generator stand connected to the bike frame and ensures the coupler joints do not separate during operation. Also, a screen mount was created out of wood. The screen is able to securely slide into the mount. It is connected to the bike handles with metal brackets that can be tightened with screws.
The bike itself was tested by having multiple subjects ride the bike. Every subject tested was able to ride the bike with ease. The gear ratio was tested by pedaling the bike at a specific RPM and measuring the RPM of the shaft using a laser tachometer. To test the transmission system the generator will be integrated with the entire system. If the power and voltage outputs meet the requirements then the system will not need to be modified. If more power is needed then the transmission will be carefully monitored. Modifications to the wheel can be made if necessary. The system will be tested against each of the specified loads to make sure it operates correctly. Based on the initial tests that have been done, it seems that the system is more than capable of generating sufficient power. The power the system generates is detailed in the generator subsystem. The screen mount has been built and tested. This was done by placing the screen in the screen mount. The screen was held securely in the screen mount while the bike was being pedaled. The bulk of the testing will be concerned with the overall system integration and making sure the system works together as a whole.
Cycle to Sustain
10
2.2.2. Generator
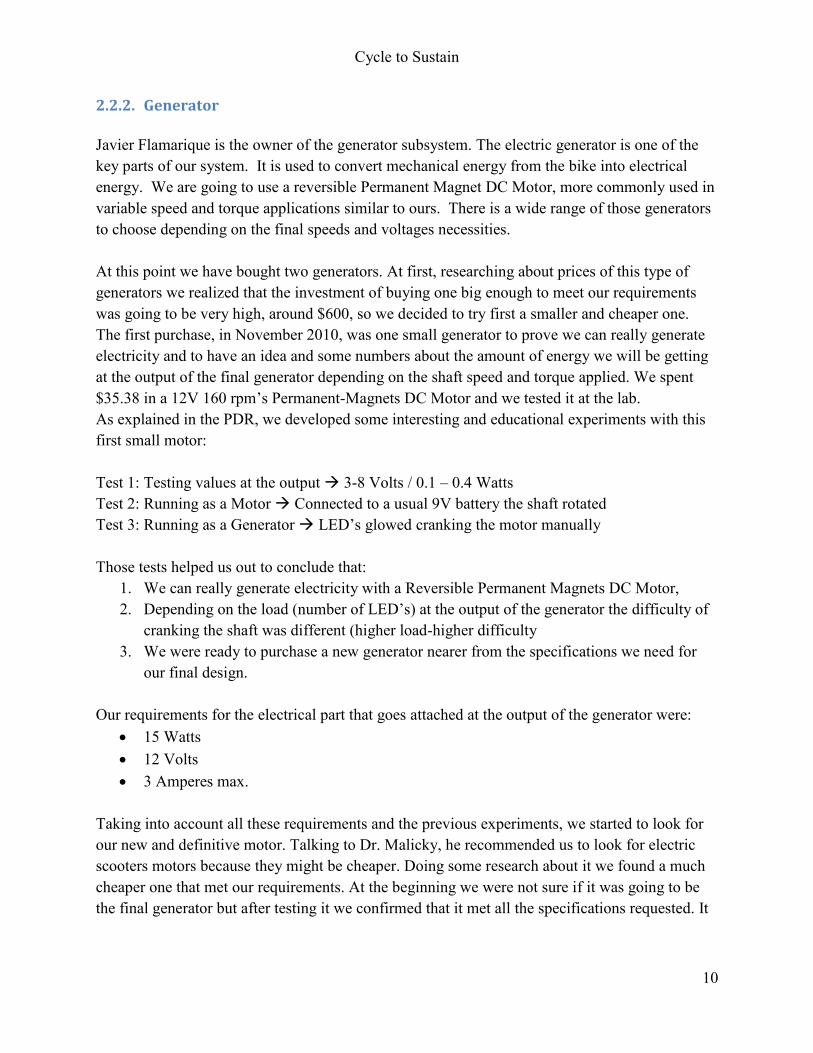
Javier Flamarique is the owner of the generator subsystem. The electric generator is one of the key parts of our system. It is used to convert mechanical energy from the bike into electrical energy. We are going to use a reversible Permanent Magnet DC Motor, more commonly used in variable speed and torque applications similar to ours. There is a wide range of those generators to choose depending on the final speeds and voltages necessities. At this point we have bought two generators. At first, researching about prices of this type of generators we realized that the investment of buying one big enough to meet our requirements was going to be very high, around $600, so we decided to try first a smaller and cheaper one. The first purchase, in November 2010, was one small generator to prove we can really generate electricity and to have an idea and some numbers about the amount of energy we will be getting at the output of the final generator depending on the shaft speed and torque applied. We spent $35.38 in a 12V 160 rpm’s Permanent-Magnets DC Motor and we tested it at the lab. As explained in the PDR, we developed some interesting and educational experiments with this first small motor: Test 1: Testing values at the output 3-8 Volts / 0.1 – 0.4 Watts Test 2: Running as a Motor Connected to a usual 9V battery the shaft rotated Test 3: Running as a Generator LED’s glowed cranking the motor manually Those tests helped us out to conclude that:
1. We can really generate electricity with a Reversible Permanent Magnets DC Motor, 2. Depending on the load (number of LED’s) at the output of the generator the difficulty of
cranking the shaft was different (higher load-higher difficulty 3. We were ready to purchase a new generator nearer from the specifications we need for
our final design.
Our requirements for the electrical part that goes attached at the output of the generator were: 15 Watts 12 Volts 3 Amperes max.
Taking into account all these requirements and the previous experiments, we started to look for our new and definitive motor. Talking to Dr. Malicky, he recommended us to look for electric scooters motors because they might be cheaper. Doing some research about it we found a much cheaper one that met our requirements. At the beginning we were not sure if it was going to be the final generator but after testing it we confirmed that it met all the specifications requested. It
Cycle to Sustain
11
cost was going to be $43.38 and it would be our second and definitive motor, reducing enormously the huge cost primarily expected:
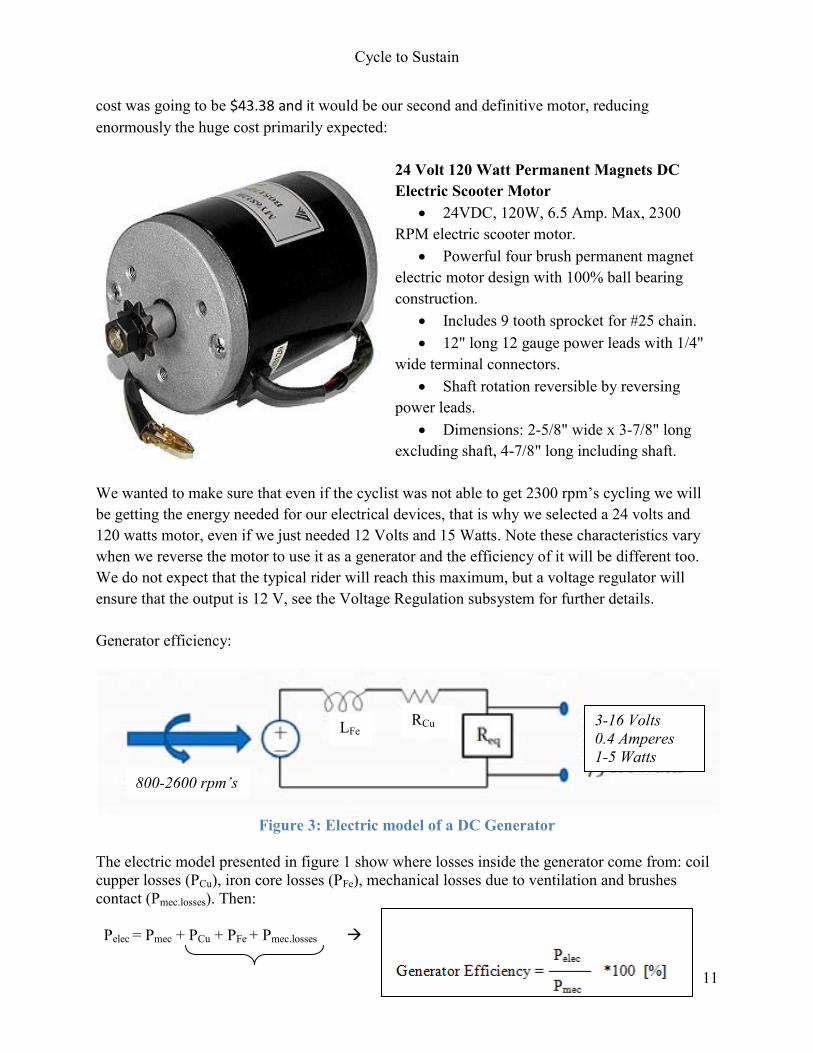
24 Volt 120 Watt Permanent Magnets DC Electric Scooter Motor
24VDC, 120W, 6.5 Amp. Max, 2300 RPM electric scooter motor.
Powerful four brush permanent magnet electric motor design with 100% ball bearing construction.
Includes 9 tooth sprocket for #25 chain. 12" long 12 gauge power leads with 1/4"
wide terminal connectors. Shaft rotation reversible by reversing
power leads. Dimensions: 2-5/8" wide x 3-7/8" long
excluding shaft, 4-7/8" long including shaft.
We wanted to make sure that even if the cyclist was not able to get 2300 rpm’s cycling we will be getting the energy needed for our electrical devices, that is why we selected a 24 volts and 120 watts motor, even if we just needed 12 Volts and 15 Watts. Note these characteristics vary when we reverse the motor to use it as a generator and the efficiency of it will be different too. We do not expect that the typical rider will reach this maximum, but a voltage regulator will ensure that the output is 12 V, see the Voltage Regulation subsystem for further details. Generator efficiency:
Figure 3: Electric model of a DC Generator
The electric model presented in figure 1 show where losses inside the generator come from: coil cupper losses (PCu), iron core losses (PFe), mechanical losses due to ventilation and brushes contact (Pmec.losses). Then: Pelec = Pmec + PCu + PFe + Pmec.losses
800-2600 rpm’s
LFe RCu 3-16 Volts
0.4 Amperes 1-5 Watts
Cycle to Sustain
12
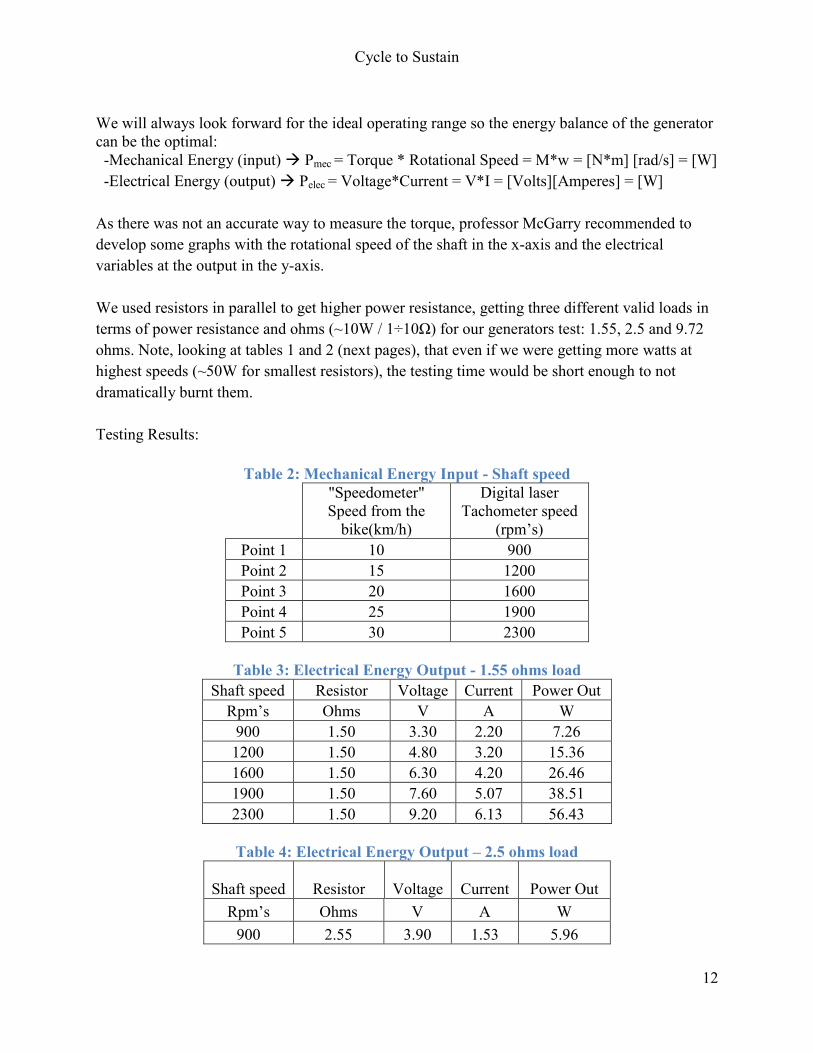
We will always look forward for the ideal operating range so the energy balance of the generator can be the optimal: -Mechanical Energy (input) Pmec = Torque * Rotational Speed = M*w = [N*m] [rad/s] = [W] -Electrical Energy (output) Pelec = Voltage*Current = V*I = [Volts][Amperes] = [W] As there was not an accurate way to measure the torque, professor McGarry recommended to develop some graphs with the rotational speed of the shaft in the x-axis and the electrical variables at the output in the y-axis. We used resistors in parallel to get higher power resistance, getting three different valid loads in terms of power resistance and ohms (~10W / 1÷10Ω) for our generators test: 1.55, 2.5 and 9.72 ohms. Note, looking at tables 1 and 2 (next pages), that even if we were getting more watts at highest speeds (~50W for smallest resistors), the testing time would be short enough to not dramatically burnt them. Testing Results:
Table 2: Mechanical Energy Input - Shaft speed
"Speedometer" Speed from the
bike(km/h)
Digital laser Tachometer speed
(rpm’s) Point 1 10 900 Point 2 15 1200 Point 3 20 1600 Point 4 25 1900 Point 5 30 2300
Table 3: Electrical Energy Output - 1.55 ohms load
Shaft speed Resistor Voltage Current Power Out Rpm’s Ohms V A W
900 1.50 3.30 2.20 7.26 1200 1.50 4.80 3.20 15.36 1600 1.50 6.30 4.20 26.46 1900 1.50 7.60 5.07 38.51 2300 1.50 9.20 6.13 56.43
Table 4: Electrical Energy Output – 2.5 ohms load
Shaft speed Resistor Voltage Current Power Out
Rpm’s Ohms V A W 900 2.55 3.90 1.53 5.96
Cycle to Sustain
13
1200 2.55 5.80 2.27 13.19 1600 2.55 7.00 2.75 19.22 1900 2.55 9.50 3.73 35.39 2300 2.55 12.00 4.71 56.47
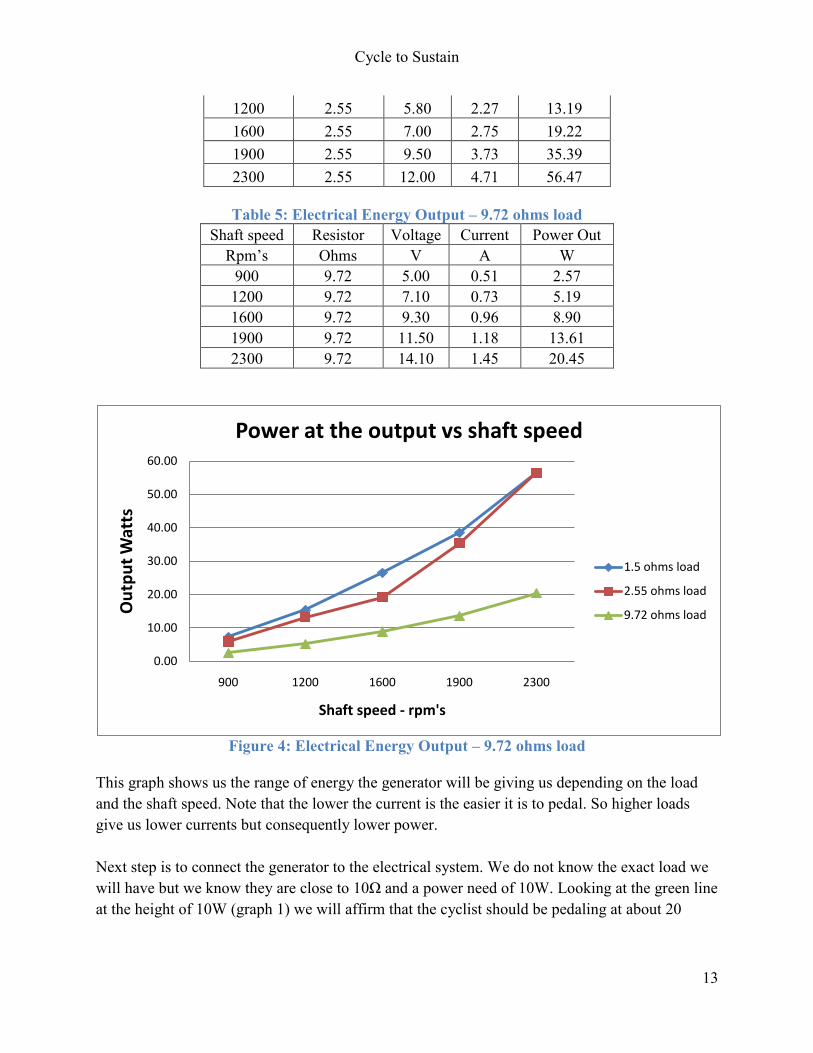
Table 5: Electrical Energy Output – 9.72 ohms load
Shaft speed Resistor Voltage Current Power Out Rpm’s Ohms V A W
900 9.72 5.00 0.51 2.57 1200 9.72 7.10 0.73 5.19 1600 9.72 9.30 0.96 8.90 1900 9.72 11.50 1.18 13.61 2300 9.72 14.10 1.45 20.45
Figure 4: Electrical Energy Output – 9.72 ohms load
This graph shows us the range of energy the generator will be giving us depending on the load and the shaft speed. Note that the lower the current is the easier it is to pedal. So higher loads give us lower currents but consequently lower power. Next step is to connect the generator to the electrical system. We do not know the exact load we will have but we know they are close to 10Ω and a power need of 10W. Looking at the green line at the height of 10W (graph 1) we will affirm that the cyclist should be pedaling at about 20
0.00
10.00
20.00
30.00
40.00
50.00
60.00
900 1200 1600 1900 2300
Ou
tpu
t W
atts
Shaft speed - rpm's
Power at the output vs shaft speed
1.5 ohms load
2.55 ohms load
9.72 ohms load

Cycle to Sustain
14
km/h (see table 1 for 1600rpm’s). If this does not been happen it will not be a huge problem because we will be taking the energy from the battery previously charged.
2.2.3. Battery and Voltage Regulation
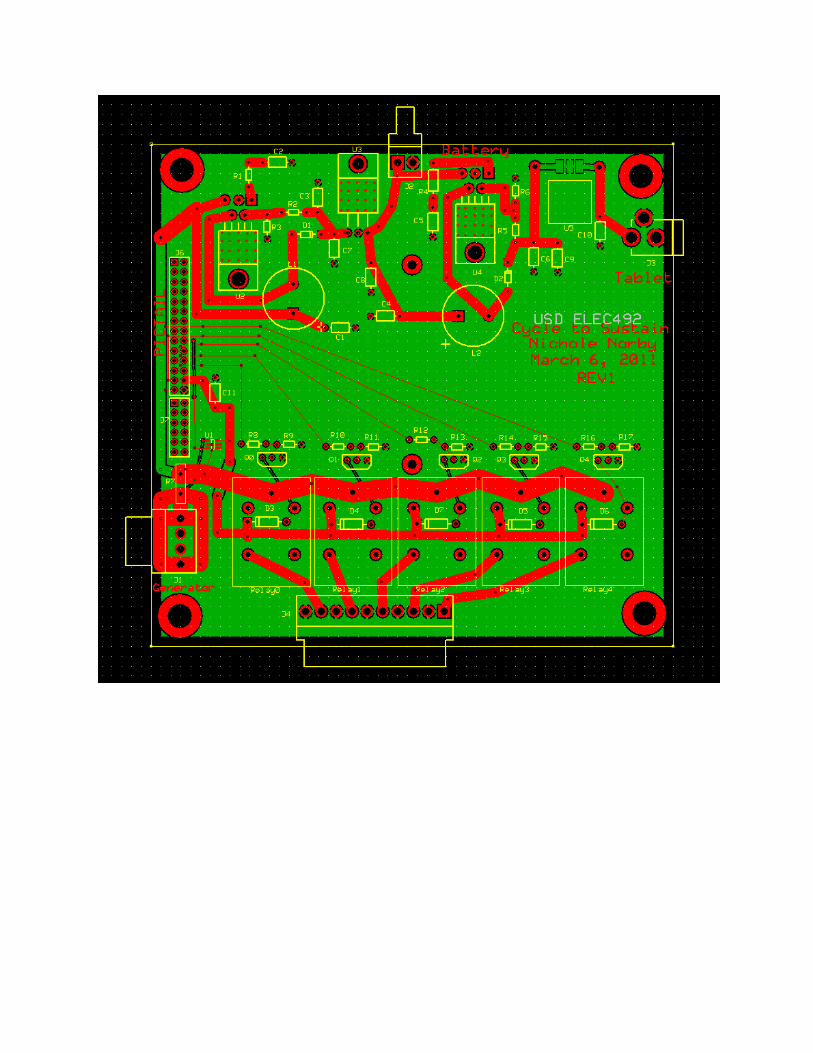
Electrical Engineer Nichole Norby is the owner of the PCB design subsystem. This subsystem includes the PCB that will regulate 12V into the battery and tablet PC and will allow for the monitoring of the power output of the rider that will be displayed on the tablet PC. The PCB design has been through one revision and is currently in the process of being tested for accuracy and ways that it can be improved. The soldering is complete on the first board of Rev1; this involved the assistance of Dr. Pateros and his colleagues at ViaSat. The changes that will be going into Rev2 that have been discovered thus far are; the holes for the inductor and diode (1N5821) need to be bigger, the ground plane’s clearance needs to be increased, the battery connection needs to be changed for a 2 pin to 3 pin connection, right now those are the changes that need to be altered, however as testing continues more improvements will be assessed. The PCB involves three subsystems; one regulates the input voltage to ensure that 12V is distributed to the tablet PC and battery pack, the second is the relay circuit, this involves changing the load that the rider feels to simulate how difficult it is to power household appliances. Lastly, the circuit uses the ADM4073 current sensor to evaluate the power output of the rider; this is then displayed on the tablet PC. Appendix C.2 provides the schematic and PCB design of REV1. This offers an illustration of the layout of the current design and how it functions. The PCB file displays how thick the traces need to be to accommodate the amount of power the cyclist will generate. Another feature of the board is the amount of connections it has to various loads; the battery, the tablet PC, the power resistors and the generator which is the input to the PCB. Concerns that were evident in the technical deliverable have now been assessed and our complete. The 28 pin PICTAIL connection that fits to our PIC Development board fits properly and the connection that will connect the PCB to the tablet PC has also progressed and the next step in finalizing that connection will be to fabricate a cable to attach the two. After evaluating the necessity of displaying the RPM signal for the rider and what value it would add to the project, it was decided to eliminate it. This choice was made in that the interface would be difficult to construct and it holds no value for other calculations. The final concern is attaching the power resistors to the relay circuit. This concept has not been fully developed at this time because of the time constraint of completing the CDR and demonstration. This however is an important component of our design because it further provides the rider with the physical understanding of energy consumption.
Cycle to Sustain
15
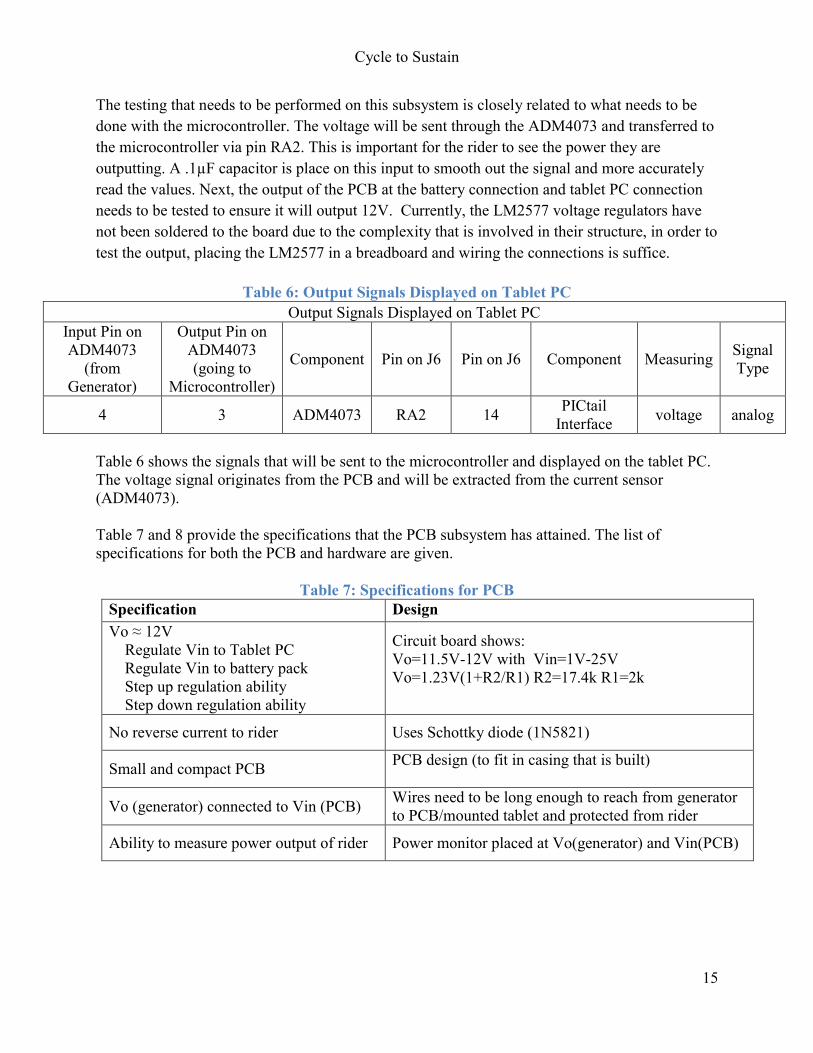
The testing that needs to be performed on this subsystem is closely related to what needs to be done with the microcontroller. The voltage will be sent through the ADM4073 and transferred to the microcontroller via pin RA2. This is important for the rider to see the power they are outputting. A .1µF capacitor is place on this input to smooth out the signal and more accurately read the values. Next, the output of the PCB at the battery connection and tablet PC connection needs to be tested to ensure it will output 12V. Currently, the LM2577 voltage regulators have not been soldered to the board due to the complexity that is involved in their structure, in order to test the output, placing the LM2577 in a breadboard and wiring the connections is suffice.
Table 6: Output Signals Displayed on Tablet PC
Output Signals Displayed on Tablet PC Input Pin on ADM4073
(from Generator)
Output Pin on ADM4073 (going to
Microcontroller)
Component Pin on J6 Pin on J6 Component Measuring Signal Type
4 3 ADM4073 RA2 14 PICtail Interface voltage analog
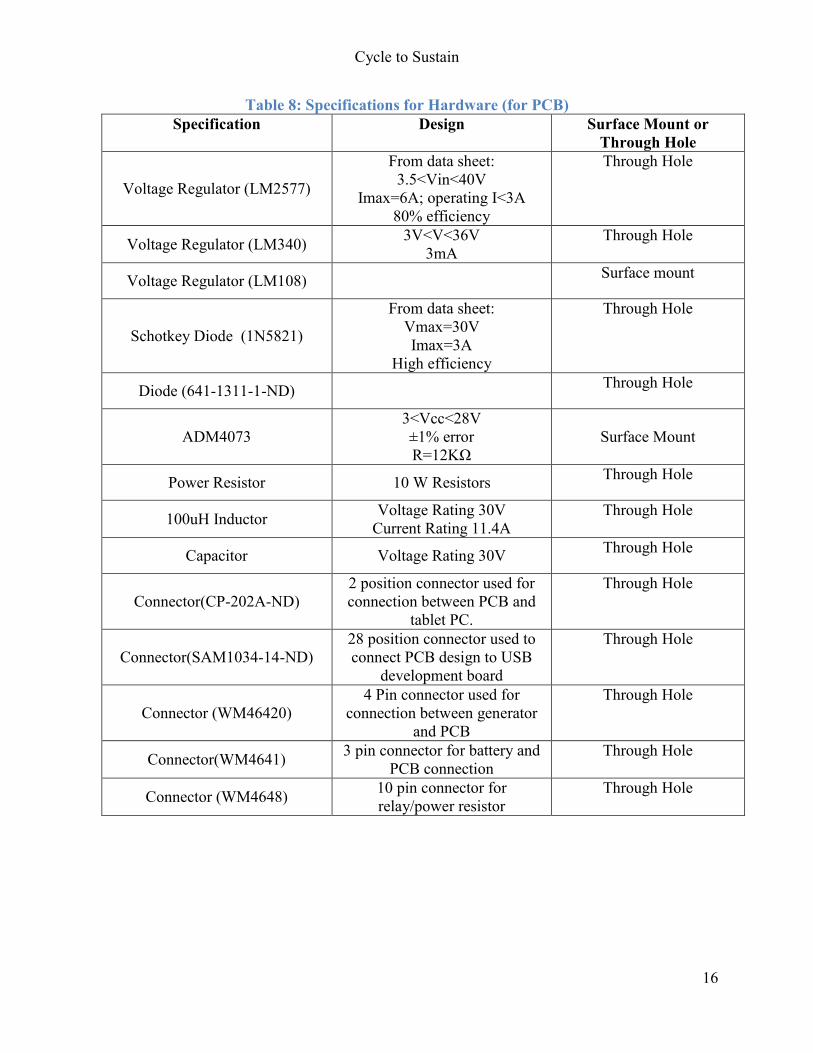
Table 6 shows the signals that will be sent to the microcontroller and displayed on the tablet PC. The voltage signal originates from the PCB and will be extracted from the current sensor (ADM4073). Table 7 and 8 provide the specifications that the PCB subsystem has attained. The list of specifications for both the PCB and hardware are given.
Table 7: Specifications for PCB
Specification Design Vo ≈ 12V Regulate Vin to Tablet PC Regulate Vin to battery pack Step up regulation ability Step down regulation ability
Circuit board shows: Vo=11.5V-12V with Vin=1V-25V Vo=1.23V(1+R2/R1) R2=17.4k R1=2k
No reverse current to rider Uses Schottky diode (1N5821)
Small and compact PCB PCB design (to fit in casing that is built)
Vo (generator) connected to Vin (PCB) Wires need to be long enough to reach from generator to PCB/mounted tablet and protected from rider
Ability to measure power output of rider Power monitor placed at Vo(generator) and Vin(PCB)
Cycle to Sustain
16
Table 8: Specifications for Hardware (for PCB) Specification Design Surface Mount or
Through Hole
Voltage Regulator (LM2577)
From data sheet: 3.5<Vin<40V
Imax=6A; operating I<3A 80% efficiency
Through Hole
Voltage Regulator (LM340) 3V<V<36V 3mA
Through Hole
Voltage Regulator (LM108) Surface mount
Schotkey Diode (1N5821)
From data sheet: Vmax=30V Imax=3A
High efficiency
Through Hole
Diode (641-1311-1-ND) Through Hole
ADM4073 3<Vcc<28V ±1% error R=12KΩ
Surface Mount
Power Resistor 10 W Resistors Through Hole
100uH Inductor Voltage Rating 30V Current Rating 11.4A
Through Hole
Capacitor Voltage Rating 30V Through Hole
Connector(CP-202A-ND) 2 position connector used for connection between PCB and
tablet PC.
Through Hole
Connector(SAM1034-14-ND) 28 position connector used to connect PCB design to USB
development board
Through Hole
Connector (WM46420) 4 Pin connector used for
connection between generator and PCB
Through Hole
Connector(WM4641) 3 pin connector for battery and PCB connection
Through Hole
Connector (WM4648) 10 pin connector for relay/power resistor
Through Hole
Cycle to Sustain
17
2.2.4. Microprocessor and Screen
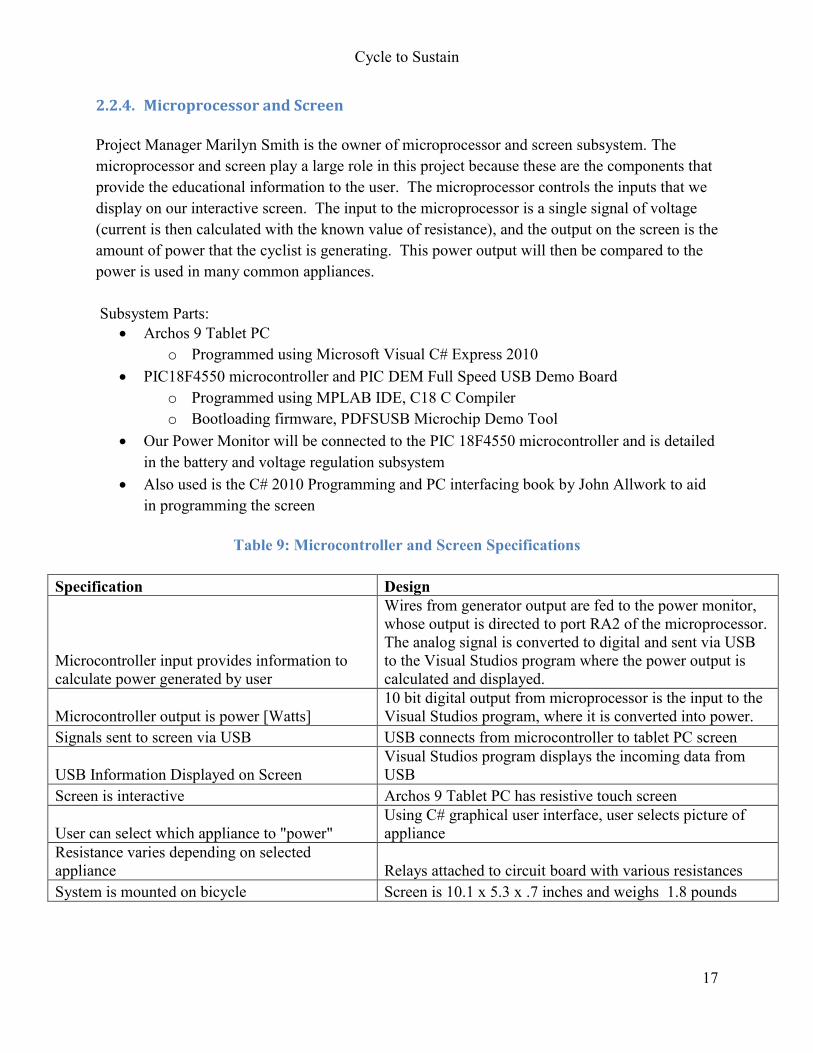
Project Manager Marilyn Smith is the owner of microprocessor and screen subsystem. The microprocessor and screen play a large role in this project because these are the components that provide the educational information to the user. The microprocessor controls the inputs that we display on our interactive screen. The input to the microprocessor is a single signal of voltage (current is then calculated with the known value of resistance), and the output on the screen is the amount of power that the cyclist is generating. This power output will then be compared to the power is used in many common appliances. Subsystem Parts:
Archos 9 Tablet PC o Programmed using Microsoft Visual C# Express 2010
PIC18F4550 microcontroller and PIC DEM Full Speed USB Demo Board o Programmed using MPLAB IDE, C18 C Compiler o Bootloading firmware, PDFSUSB Microchip Demo Tool
Our Power Monitor will be connected to the PIC 18F4550 microcontroller and is detailed in the battery and voltage regulation subsystem
Also used is the C# 2010 Programming and PC interfacing book by John Allwork to aid in programming the screen
Table 9: Microcontroller and Screen Specifications
Specification Design
Microcontroller input provides information to calculate power generated by user
Wires from generator output are fed to the power monitor, whose output is directed to port RA2 of the microprocessor. The analog signal is converted to digital and sent via USB to the Visual Studios program where the power output is calculated and displayed.
Microcontroller output is power [Watts] 10 bit digital output from microprocessor is the input to the Visual Studios program, where it is converted into power.
Signals sent to screen via USB USB connects from microcontroller to tablet PC screen
USB Information Displayed on Screen Visual Studios program displays the incoming data from USB
Screen is interactive Archos 9 Tablet PC has resistive touch screen
User can select which appliance to "power" Using C# graphical user interface, user selects picture of appliance
Resistance varies depending on selected appliance Relays attached to circuit board with various resistances System is mounted on bicycle Screen is 10.1 x 5.3 x .7 inches and weighs 1.8 pounds
Cycle to Sustain
18
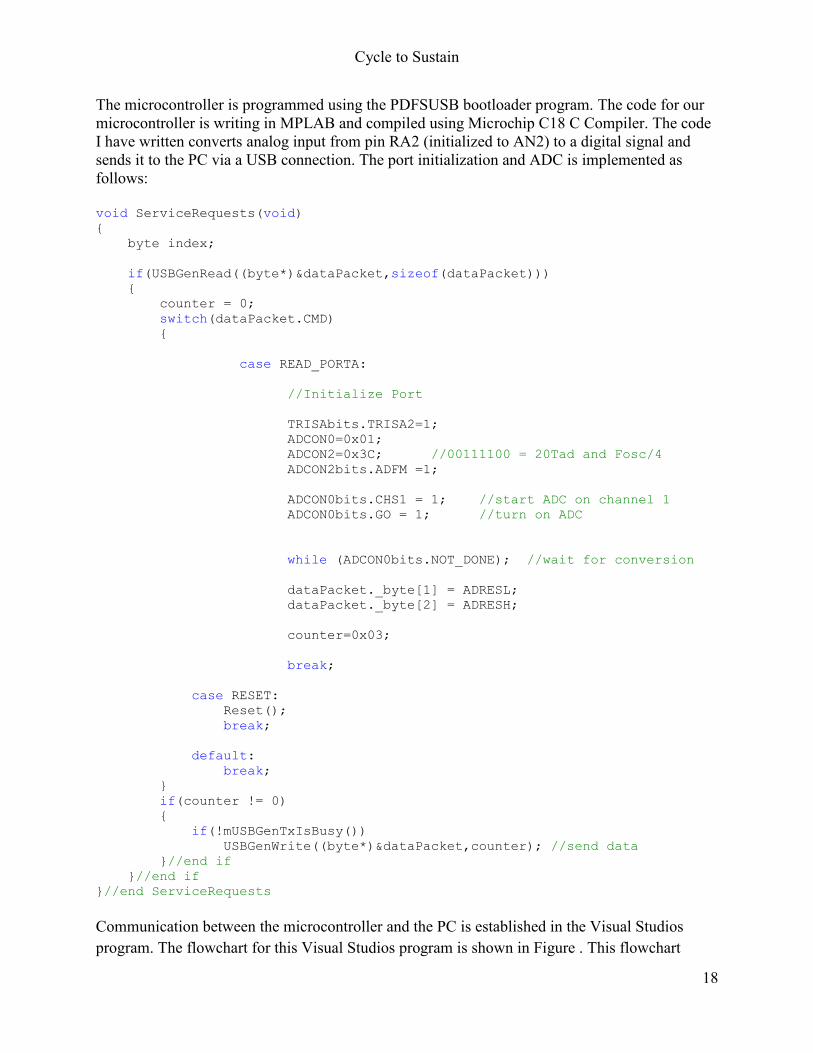
The microcontroller is programmed using the PDFSUSB bootloader program. The code for our microcontroller is writing in MPLAB and compiled using Microchip C18 C Compiler. The code I have written converts analog input from pin RA2 (initialized to AN2) to a digital signal and sends it to the PC via a USB connection. The port initialization and ADC is implemented as follows: void ServiceRequests(void)
{
byte index;
if(USBGenRead((byte*)&dataPacket,sizeof(dataPacket)))
{
counter = 0;
switch(dataPacket.CMD)
{
case READ_PORTA:
//Initialize Port
TRISAbits.TRISA2=1;
ADCON0=0x01;
ADCON2=0x3C; //00111100 = 20Tad and Fosc/4
ADCON2bits.ADFM =1;
ADCON0bits.CHS1 = 1; //start ADC on channel 1
ADCON0bits.GO = 1; //turn on ADC
while (ADCON0bits.NOT_DONE); //wait for conversion
dataPacket._byte[1] = ADRESL;
dataPacket._byte[2] = ADRESH;
counter=0x03;
break;
case RESET:
Reset();
break;
default:
break;
}
if(counter != 0)
{
if(!mUSBGenTxIsBusy())
USBGenWrite((byte*)&dataPacket,counter); //send data
}//end if
}//end if
}//end ServiceRequests Communication between the microcontroller and the PC is established in the Visual Studios program. The flowchart for this Visual Studios program is shown in Figure . This flowchart
Cycle to Sustain
19
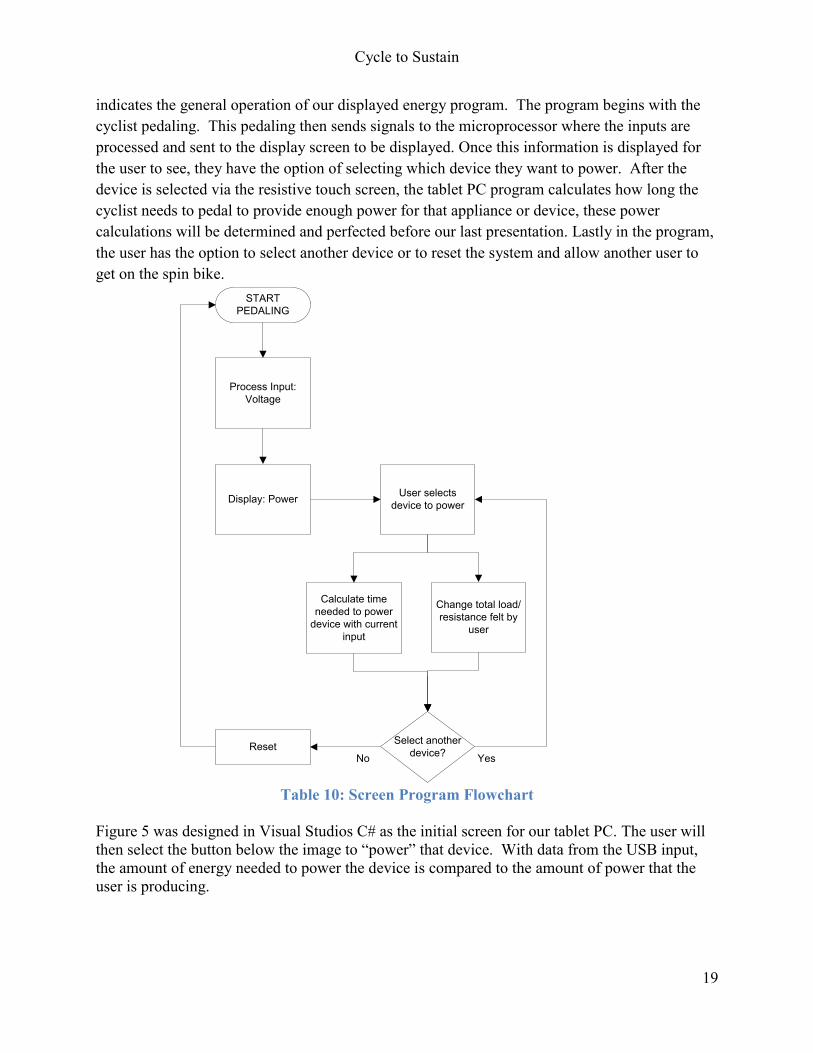
indicates the general operation of our displayed energy program. The program begins with the cyclist pedaling. This pedaling then sends signals to the microprocessor where the inputs are processed and sent to the display screen to be displayed. Once this information is displayed for the user to see, they have the option of selecting which device they want to power. After the device is selected via the resistive touch screen, the tablet PC program calculates how long the cyclist needs to pedal to provide enough power for that appliance or device, these power calculations will be determined and perfected before our last presentation. Lastly in the program, the user has the option to select another device or to reset the system and allow another user to get on the spin bike.
START PEDALING
Process Input:Voltage
Display: Power
Select another device?
User selects device to power
Calculate time needed to power
device with current input
ResetYesNo
Change total load/ resistance felt by
user
Table 10: Screen Program Flowchart
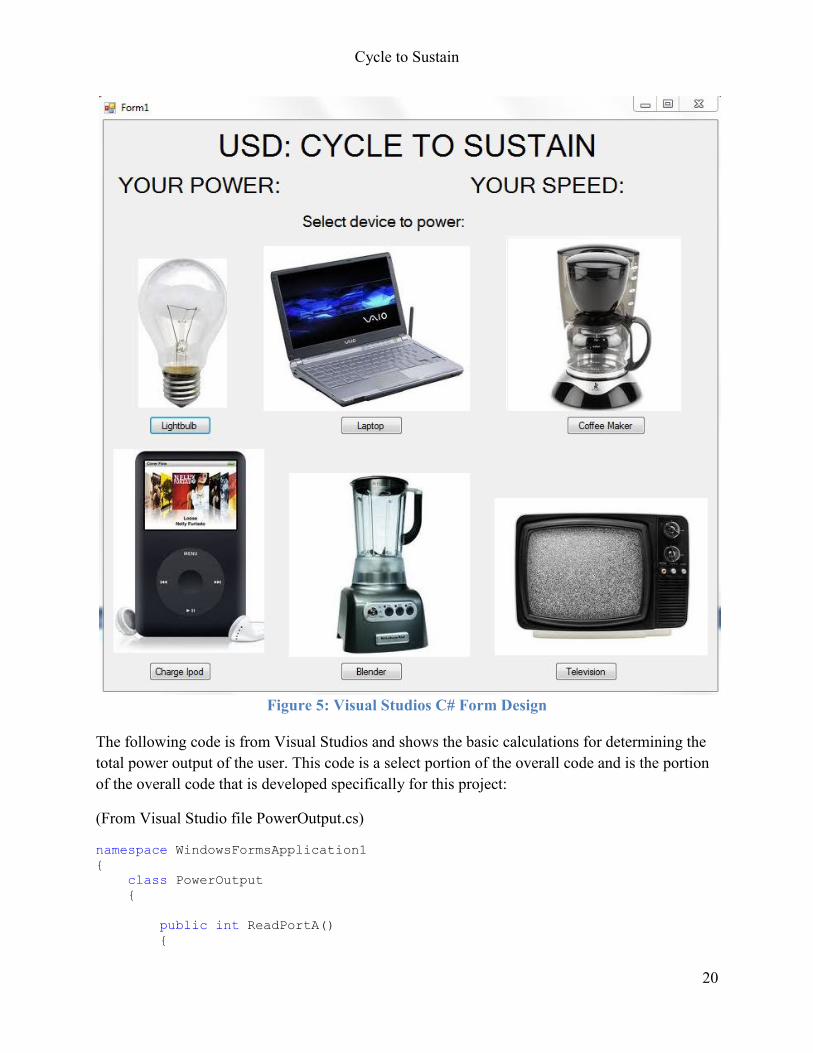
Figure 5 was designed in Visual Studios C# as the initial screen for our tablet PC. The user will then select the button below the image to “power” that device. With data from the USB input, the amount of energy needed to power the device is compared to the amount of power that the user is producing.
Cycle to Sustain
20
Figure 5: Visual Studios C# Form Design
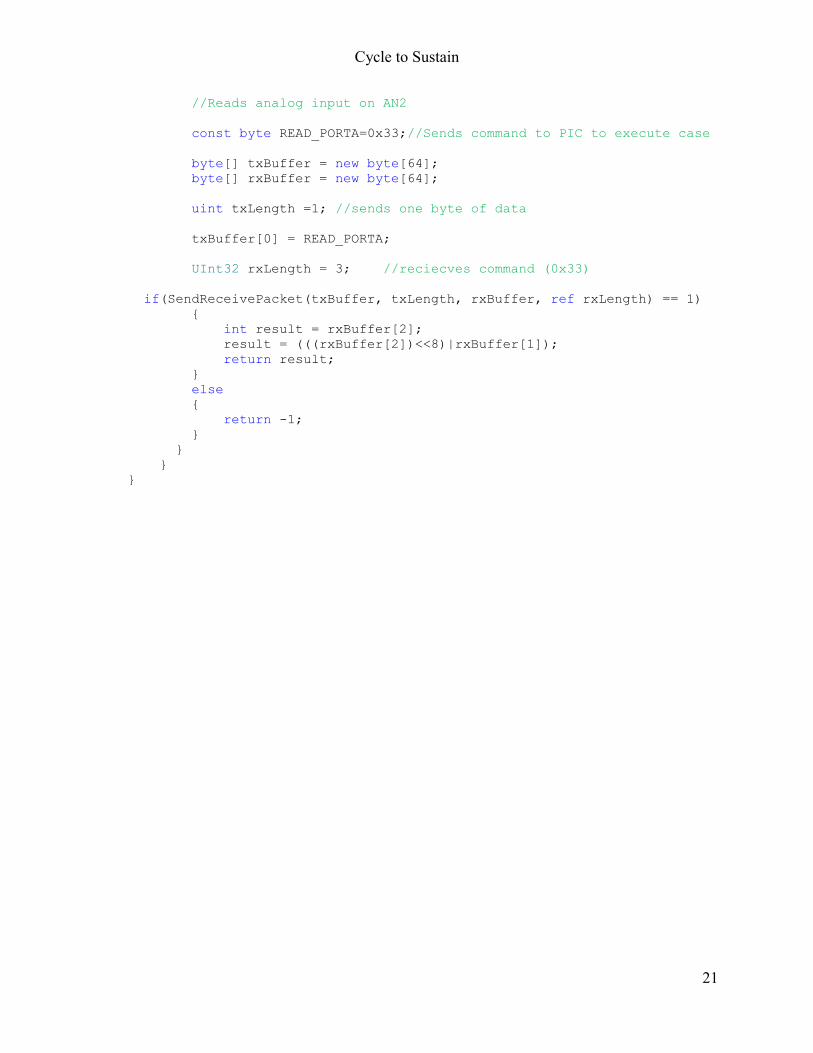
The following code is from Visual Studios and shows the basic calculations for determining the total power output of the user. This code is a select portion of the overall code and is the portion of the overall code that is developed specifically for this project:
(From Visual Studio file PowerOutput.cs)
namespace WindowsFormsApplication1
{
class PowerOutput
{
public int ReadPortA()
{
Cycle to Sustain
21
//Reads analog input on AN2
const byte READ_PORTA=0x33;//Sends command to PIC to execute case
byte[] txBuffer = new byte[64];
byte[] rxBuffer = new byte[64];
uint txLength =1; //sends one byte of data
txBuffer[0] = READ_PORTA;
UInt32 rxLength = 3; //reciecves command (0x33)
if(SendReceivePacket(txBuffer, txLength, rxBuffer, ref rxLength) == 1)
{
int result = rxBuffer[2];
result = (((rxBuffer[2])<<8)|rxBuffer[1]);
return result;
}
else
{
return -1;
}
}
}
}
Cycle to Sustain
22
3. Appendices
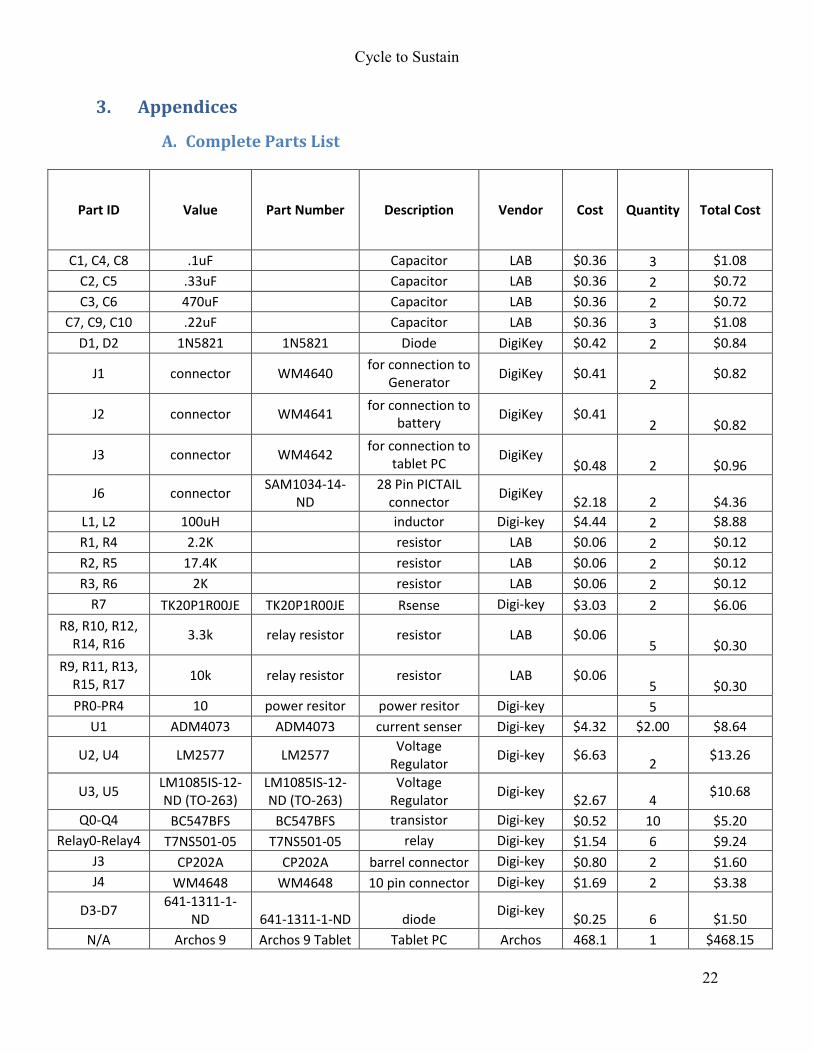
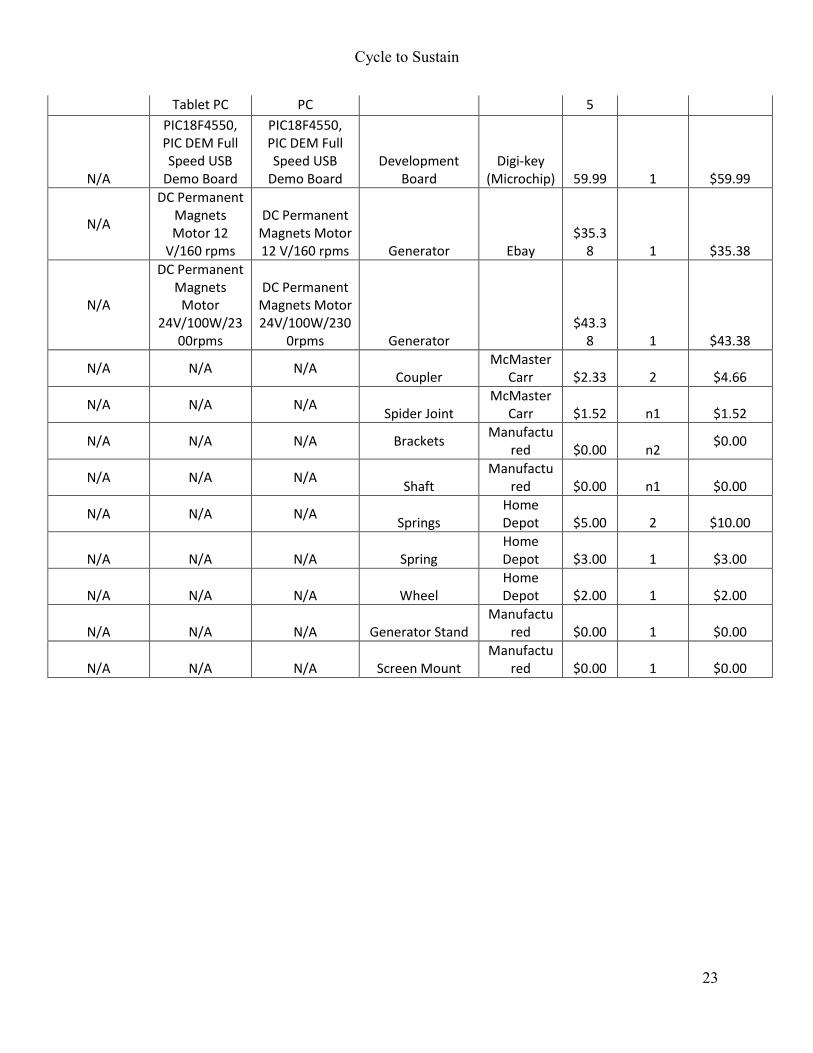
A. Complete Parts List
Part ID Value Part Number Description Vendor Cost Quantity Total Cost
C1, C4, C8 .1uF Capacitor LAB $0.36 3 $1.08
C2, C5 .33uF Capacitor LAB $0.36 2 $0.72
C3, C6 470uF Capacitor LAB $0.36 2 $0.72
C7, C9, C10 .22uF Capacitor LAB $0.36 3 $1.08
D1, D2 1N5821 1N5821 Diode DigiKey $0.42 2 $0.84
J1 connector WM4640 for connection to
Generator DigiKey $0.41
2 $0.82
J2 connector WM4641 for connection to
battery DigiKey $0.41
2 $0.82
J3 connector WM4642 for connection to
tablet PC DigiKey
$0.48 2 $0.96
J6 connector SAM1034-14-
ND 28 Pin PICTAIL
connector DigiKey
$2.18 2 $4.36
L1, L2 100uH inductor Digi-key $4.44 2 $8.88
R1, R4 2.2K resistor LAB $0.06 2 $0.12
R2, R5 17.4K resistor LAB $0.06 2 $0.12
R3, R6 2K resistor LAB $0.06 2 $0.12
R7 TK20P1R00JE TK20P1R00JE Rsense Digi-key $3.03 2 $6.06
R8, R10, R12, R14, R16
3.3k relay resistor resistor LAB $0.06 5 $0.30
R9, R11, R13, R15, R17
10k relay resistor resistor LAB $0.06 5 $0.30
PR0-PR4 10 power resitor power resitor Digi-key 5
U1 ADM4073 ADM4073 current senser Digi-key $4.32 $2.00 $8.64
U2, U4 LM2577 LM2577 Voltage
Regulator Digi-key $6.63
2 $13.26
U3, U5 LM1085IS-12-ND (TO-263)
LM1085IS-12-ND (TO-263)
Voltage Regulator
Digi-key $2.67 4
$10.68
Q0-Q4 BC547BFS BC547BFS transistor Digi-key $0.52 10 $5.20
Relay0-Relay4 T7NS501-05 T7NS501-05 relay Digi-key $1.54 6 $9.24
J3 CP202A CP202A barrel connector Digi-key $0.80 2 $1.60
J4 WM4648 WM4648 10 pin connector Digi-key $1.69 2 $3.38
D3-D7 641-1311-1-
ND 641-1311-1-ND diode Digi-key
$0.25 6 $1.50
N/A Archos 9 Archos 9 Tablet Tablet PC Archos 468.1 1 $468.15
Cycle to Sustain
23
Tablet PC PC 5
N/A
PIC18F4550, PIC DEM Full Speed USB
Demo Board
PIC18F4550, PIC DEM Full Speed USB
Demo Board Development
Board Digi-key
(Microchip) 59.99 1 $59.99
N/A
DC Permanent Magnets Motor 12
V/160 rpms
DC Permanent Magnets Motor 12 V/160 rpms Generator Ebay
$35.38 1 $35.38
N/A
DC Permanent Magnets
Motor 24V/100W/23
00rpms
DC Permanent Magnets Motor 24V/100W/230
0rpms Generator $43.3
8 1 $43.38
N/A N/A N/A Coupler
McMaster Carr $2.33 2 $4.66
N/A N/A N/A Spider Joint
McMaster Carr $1.52 n1 $1.52
N/A N/A N/A Brackets Manufactu
red $0.00 n2 $0.00
N/A N/A N/A Shaft
Manufactured $0.00 n1 $0.00
N/A N/A N/A Springs
Home Depot $5.00 2 $10.00
N/A N/A N/A Spring Home Depot $3.00 1 $3.00
N/A N/A N/A Wheel Home Depot $2.00 1 $2.00
N/A N/A N/A Generator Stand Manufactu
red $0.00 1 $0.00
N/A N/A N/A Screen Mount Manufactu
red $0.00 1 $0.00

Cycle to Sustain
24
B. Team Member Information Marilyn Smith (Project Manager)
Electrical Engineer Responsible for microprocessor and LCD Screen Subsystem Qualifications and Experience:
o Computer programming (Assembly, C, C++) o Introduction to Microcomputers: Built, soldered and programmed a Solarbotics
Sumovore Robot. This was accomplished using a PIC16F877A processor and programmed using HiTechC development tool.
o Digital Logic Design: programmed using VHDL, Xilinx and Chipscope. David Leyva (Chief Editor)
Mechanical Engineer Responsible for Mechanical Connection Qualifications and Experience:
o Designed, built, and programmed a robot able to interact with its environment. o Designed and built an air engine and a guitar in a machine shop. o Designed and analyzed a four bar mechanism able to lift a dumpster safely into
the bed of a standard pick-up truck Javier Flamarique
Industrial Engineer, Mechanical Specialization Responsible for Generator Subsystem Qualifications and Experience:
o Electric Machines o Machines Design o Combustion Motors o Electric circuits theory o Materials resistance and behavior
Nichole Norby Electrical Engineer Responsible for voltage regulator and battery subsystem Qualifications and Experience:
o Electronics I and II o Electrical Circuits o Power o Has taken courses in analog circuit design and the communication between
electronic and mechanical systems that provide evidence of my knowledge and competence in successfully implementing the regulator and energy storage subsystem.
Cycle to Sustain
25
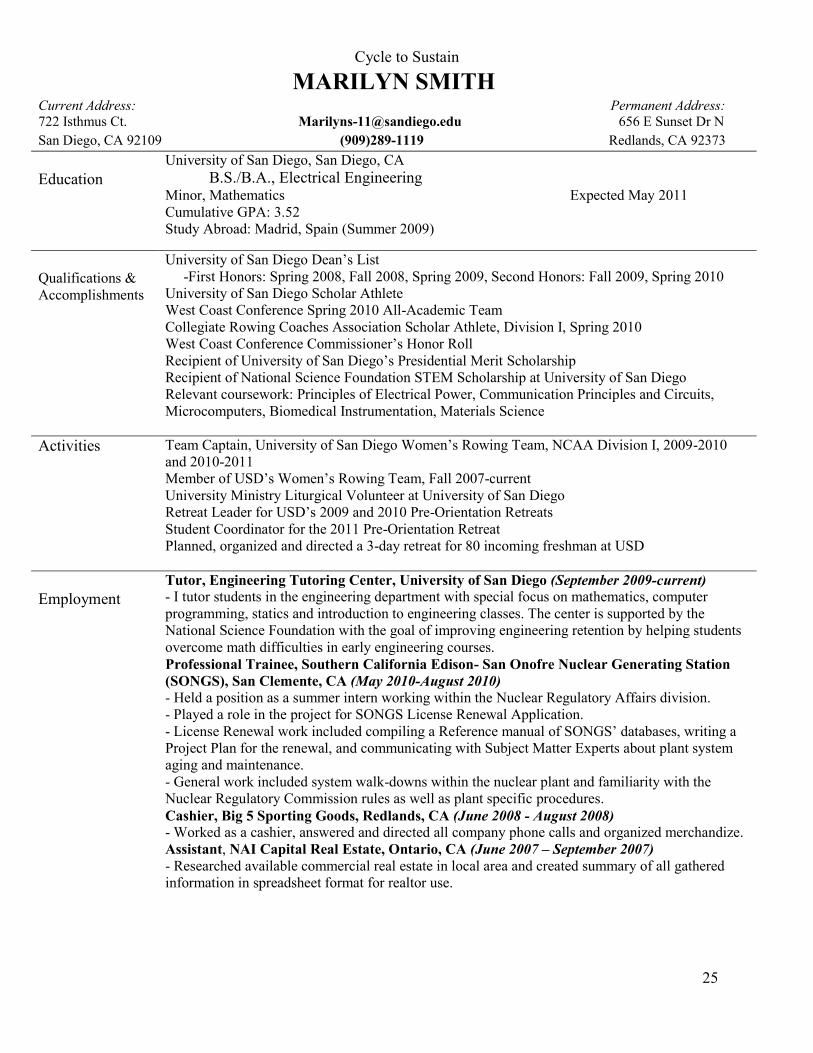
MARILYN SMITH
Current Address: Permanent Address: 722 Isthmus Ct. [email protected] 656 E Sunset Dr N San Diego, CA 92109 (909)289-1119 Redlands, CA 92373 Education
University of San Diego, San Diego, CA B.S./B.A., Electrical Engineering Minor, Mathematics Expected May 2011 Cumulative GPA: 3.52 Study Abroad: Madrid, Spain (Summer 2009)
Qualifications & Accomplishments
University of San Diego Dean’s List -First Honors: Spring 2008, Fall 2008, Spring 2009, Second Honors: Fall 2009, Spring 2010 University of San Diego Scholar Athlete West Coast Conference Spring 2010 All-Academic Team Collegiate Rowing Coaches Association Scholar Athlete, Division I, Spring 2010 West Coast Conference Commissioner’s Honor Roll Recipient of University of San Diego’s Presidential Merit Scholarship Recipient of National Science Foundation STEM Scholarship at University of San Diego Relevant coursework: Principles of Electrical Power, Communication Principles and Circuits, Microcomputers, Biomedical Instrumentation, Materials Science
Activities Team Captain, University of San Diego Women’s Rowing Team, NCAA Division I, 2009-2010 and 2010-2011 Member of USD’s Women’s Rowing Team, Fall 2007-current University Ministry Liturgical Volunteer at University of San Diego Retreat Leader for USD’s 2009 and 2010 Pre-Orientation Retreats Student Coordinator for the 2011 Pre-Orientation Retreat Planned, organized and directed a 3-day retreat for 80 incoming freshman at USD
Employment
Tutor, Engineering Tutoring Center, University of San Diego (September 2009-current) - I tutor students in the engineering department with special focus on mathematics, computer programming, statics and introduction to engineering classes. The center is supported by the National Science Foundation with the goal of improving engineering retention by helping students overcome math difficulties in early engineering courses. Professional Trainee, Southern California Edison- San Onofre Nuclear Generating Station (SONGS), San Clemente, CA (May 2010-August 2010) - Held a position as a summer intern working within the Nuclear Regulatory Affairs division. - Played a role in the project for SONGS License Renewal Application. - License Renewal work included compiling a Reference manual of SONGS’ databases, writing a Project Plan for the renewal, and communicating with Subject Matter Experts about plant system aging and maintenance. - General work included system walk-downs within the nuclear plant and familiarity with the Nuclear Regulatory Commission rules as well as plant specific procedures. Cashier, Big 5 Sporting Goods, Redlands, CA (June 2008 - August 2008) - Worked as a cashier, answered and directed all company phone calls and organized merchandize. Assistant, NAI Capital Real Estate, Ontario, CA (June 2007 – September 2007) - Researched available commercial real estate in local area and created summary of all gathered information in spreadsheet format for realtor use.
Cycle to Sustain
26
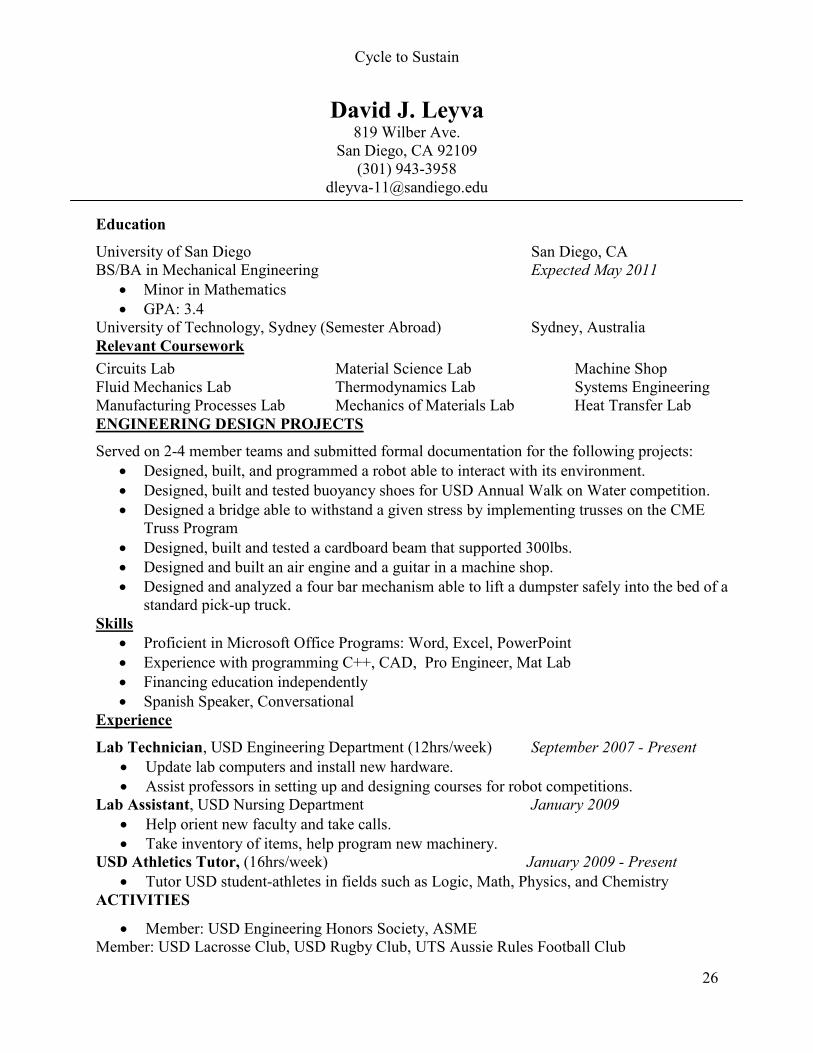
David J. Leyva 819 Wilber Ave.
San Diego, CA 92109 (301) 943-3958
Education
University of San Diego San Diego, CA BS/BA in Mechanical Engineering Expected May 2011
Minor in Mathematics GPA: 3.4
University of Technology, Sydney (Semester Abroad) Sydney, Australia Relevant Coursework
Circuits Lab Material Science Lab Machine Shop Fluid Mechanics Lab Thermodynamics Lab Systems Engineering Manufacturing Processes Lab Mechanics of Materials Lab Heat Transfer Lab ENGINEERING DESIGN PROJECTS
Served on 2-4 member teams and submitted formal documentation for the following projects: Designed, built, and programmed a robot able to interact with its environment. Designed, built and tested buoyancy shoes for USD Annual Walk on Water competition. Designed a bridge able to withstand a given stress by implementing trusses on the CME
Truss Program Designed, built and tested a cardboard beam that supported 300lbs. Designed and built an air engine and a guitar in a machine shop. Designed and analyzed a four bar mechanism able to lift a dumpster safely into the bed of a
standard pick-up truck. Skills
Proficient in Microsoft Office Programs: Word, Excel, PowerPoint Experience with programming C++, CAD, Pro Engineer, Mat Lab Financing education independently Spanish Speaker, Conversational
Experience
Lab Technician, USD Engineering Department (12hrs/week) September 2007 - Present Update lab computers and install new hardware. Assist professors in setting up and designing courses for robot competitions.
Lab Assistant, USD Nursing Department January 2009 Help orient new faculty and take calls. Take inventory of items, help program new machinery.
USD Athletics Tutor, (16hrs/week) January 2009 - Present Tutor USD student-athletes in fields such as Logic, Math, Physics, and Chemistry
ACTIVITIES
Member: USD Engineering Honors Society, ASME Member: USD Lacrosse Club, USD Rugby Club, UTS Aussie Rules Football Club
Cycle to Sustain
27
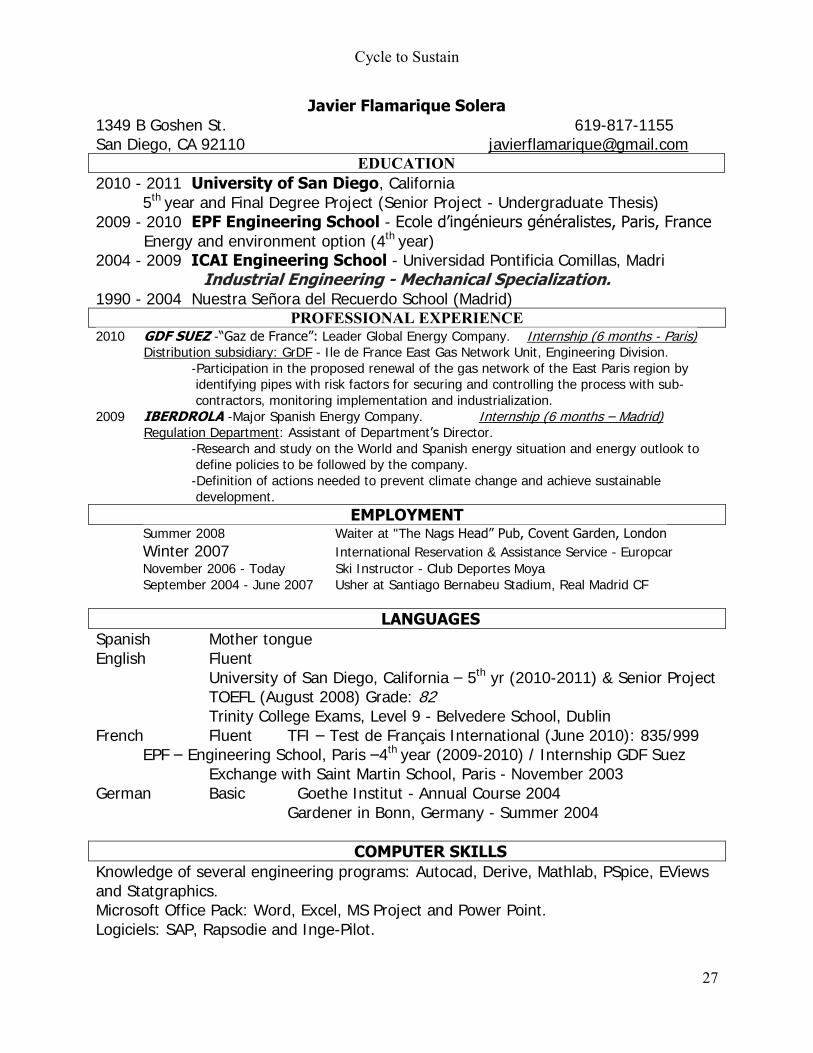
Javier Flamarique Solera 1349 B Goshen St. 619-817-1155 San Diego, CA 92110 [email protected]
EDUCATION 2010 - 2011 University of San Diego, California
5th year and Final Degree Project (Senior Project - Undergraduate Thesis) 2009 - 2010 EPF Engineering School - Ecole d’ingénieurs généralistes, Paris, France
Energy and environment option (4th year) 2004 - 2009 ICAI Engineering School - Universidad Pontificia Comillas, Madri Industrial Engineering - Mechanical Specialization. 1990 - 2004 Nuestra Señora del Recuerdo School (Madrid)
PROFESSIONAL EXPERIENCE 2010 GDF SUEZ -“Gaz de France”: Leader Global Energy Company. Internship (6 months - Paris) Distribution subsidiary: GrDF - Ile de France East Gas Network Unit, Engineering Division. -Participation in the proposed renewal of the gas network of the East Paris region by identifying pipes with risk factors for securing and controlling the process with sub-
contractors, monitoring implementation and industrialization. 2009 IBERDROLA -Major Spanish Energy Company. Internship (6 months – Madrid) Regulation Department: Assistant of Department’s Director. -Research and study on the World and Spanish energy situation and energy outlook to define policies to be followed by the company.
-Definition of actions needed to prevent climate change and achieve sustainable
development.
EMPLOYMENT Summer 2008 Waiter at "The Nags Head” Pub, Covent Garden, London Winter 2007 International Reservation & Assistance Service - Europcar November 2006 - Today Ski Instructor - Club Deportes Moya September 2004 - June 2007 Usher at Santiago Bernabeu Stadium, Real Madrid CF
LANGUAGES
Spanish Mother tongue English Fluent University of San Diego, California – 5th yr (2010-2011) & Senior Project TOEFL (August 2008) Grade: 82 Trinity College Exams, Level 9 - Belvedere School, Dublin French Fluent TFI – Test de Français International (June 2010): 835/999
EPF – Engineering School, Paris –4th year (2009-2010) / Internship GDF Suez Exchange with Saint Martin School, Paris - November 2003
German Basic Goethe Institut - Annual Course 2004 Gardener in Bonn, Germany - Summer 2004
COMPUTER SKILLS
Knowledge of several engineering programs: Autocad, Derive, Mathlab, PSpice, EViews and Statgraphics. Microsoft Office Pack: Word, Excel, MS Project and Power Point. Logiciels: SAP, Rapsodie and Inge-Pilot.

Cycle to Sustain
28
Nichole Norby (218) 234-6882 ▪ [email protected]
Campus Address Permanent Address 722 Isthmus Ct 1718 East Shore Dr San Diego, CA 92109 Detroit Lakes, MN 56501
EDUCATION
BS/BA in Electrical Engineering Minor: Mathematics GPA: 3.28/4.0 University of San Diego, San Diego, CA Expected May 2011
Institute of Electrical and Electronics Engineers (IEEE), Society of Women Engineers (SWE) Study abroad in Madrid, Spain (Summer 2009)
Relevant Courses Senior Design Electrical Power Microcomputers (PIC-based) Electromagnetism Material Science Probability and Statistics Biomedical Instrumentation Digital Design (w/ VHDL) Control Systems Programming (C/C++) Electronics I and II Digital Communications ENGINEERING EXPERIENCE
Goodrich Sensors and Integrated Systems Burnsville, MN Intern for Air Data Software Summer 2010
Developed software scripts using DXL and Visual Basic programming language Composed tool qualification documents for FAA certification Performed troubleshooting on hardware test equipment Presented completed work to coworkers Composed PowerPoint for Continuous Improvement presentation
TEAM PROJECTS
Maze Solving Robot – programmed a PIC16F877 microcontroller using HiTech-C based on distance and optical sensors and as project manager composed a formal written and oral report Senior Design - designed and constructed a power generating bicycle using the integration of both electrical and mechanical engineering to promote sustainability TECHNICAL SKILLS
Microsoft Office, C++, C, PIC Assembly and C programming, MultiSim, Visual Basic, DXL programming
ADDITIONAL EXPERIENCE
University of San Diego Department of Mathematics Spring 2010 - Present Graded tests for Math 310: Applied Mathematics for Engineers & Scientists, and Algebra II
Norby’s Department Store, Detroit Lakes, MN Seasonal 2002 - Present Design online web and eBay pages
Detroit Lakes Community & Cultural Center, Detroit Lakes, MN Fall 2007 & Summer 2007 Instructor: Led exercise programs and taught children the importance of nutrition Lifeguard: Enforced pool rules to ensure patron safety; opened and closed the pool
ATHLETIC ACCOMPLISHMENTS
University of San Diego Division I Rowing Team Devoted an average of 30 hours per week to training, practices, meetings, travel, and
competitions while completing a challenging Engineering degree West Coast Conference Honor Roll 2008, Most Dedicated (2008), West Coast Conference
Champion (2010), Western Intercollegiate Rowing Association Champion and Second-All-Tournament Team (2010)
COMMUNITY SERVICE
Actively involved in USD University Ministry: Students for Life, Word Minister Volunteer at youth sports camps and clinics, Special Olympics
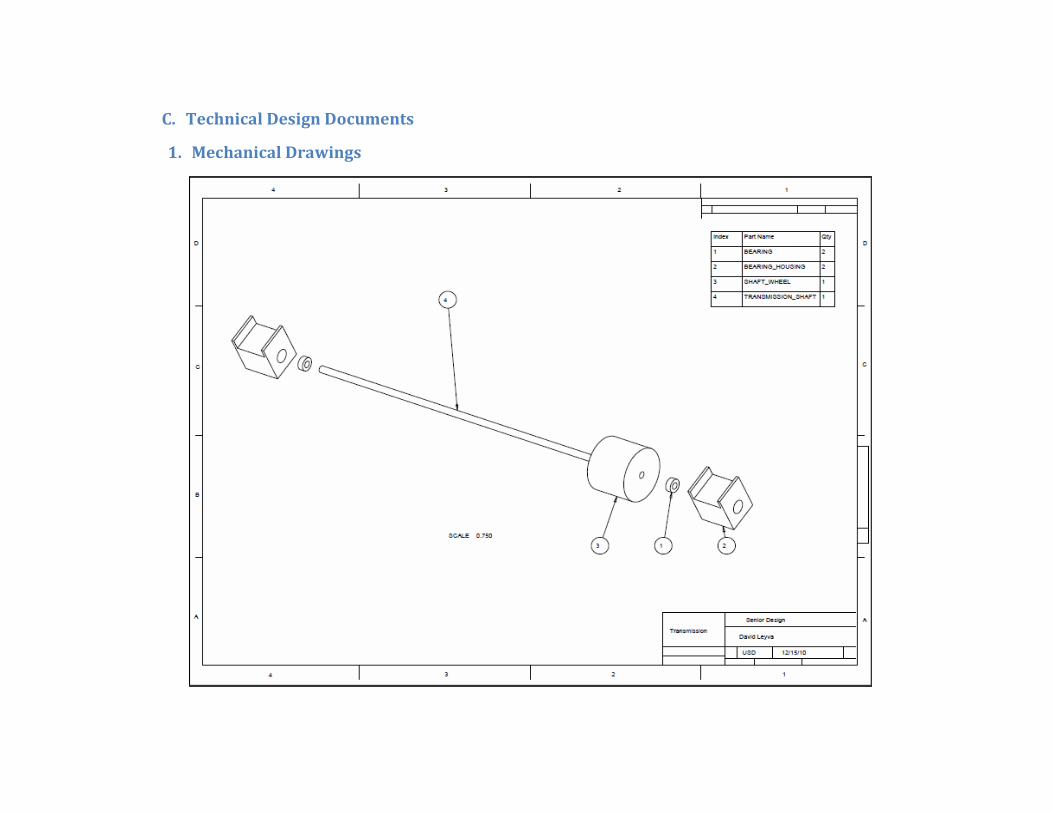
C. Technical Design Documents
1. Mechanical Drawings
Cycle to Sustain
30
Cycle to Sustain
31
Cycle to Sustain
32
Cycle to Sustain
33
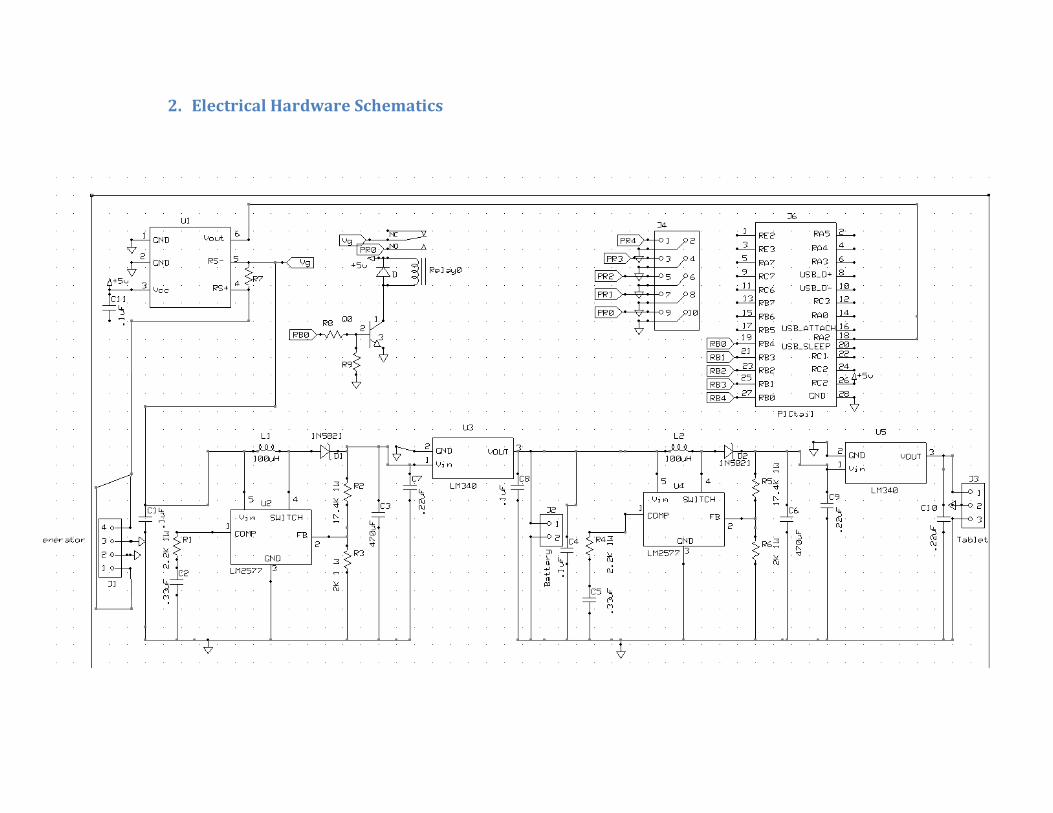
2. Electrical Hardware Schematics
Recommended