CRITERIA OF ACCEPTANCE FOR CONSTANT RATE OF STRAIN
CONSOLIDATION TEST FOR COHESIVE SOIL
LAM CHEE SIANG
UNIVERSITI TEKNOOGI MALAYSIA

iii
To my beloved mother, father and Boon Yaa

iv
ACKNOWLEDGEMENT
In the whole process of preparing this thesis, I would like to express my
sincere appreciation to my supervisor Assoc. Prof Dr. Khairul Anuar Kassim for his
supervision, advice, guidance, and useful comments. Without his continued support
and interest, this thesis would not have been the same as presented here. This
research is funded by the Intensification Research of Priority Area (IRPA) Grant
Coded 74110 lead by Assoc. Prof Dr. Khairul Anuar Kassim. Thanks also for the
assistance of technicians in the Geotechnics Laboratory Faculty of Civil Engineering,
Universiti Technologi Malaysia (UTM), Skudai.
Beside that, I would like to say thank you to my parents and my girlfriend for
their support and encouragement. Their encouragements provide the energy for me
to concentrate on my Master study.
Lastly I would like to say thank you also to those party I did not mention
above that had help me direct or indirectly in my research works. Although their
contributions are just little and simple work, but I am sure that I will meet a lot of
difficulties without their contributions.

v
ABSTRACT
Constant rate of strain (CRS) consolidation test is a new method of
consolidation testing in Malaysia. Although it had been widely used as an alternative
for standard consolidation test in other countries such as Sweden and the USA, there
is still no standard equipment for it. The selection of the suitable strain rate for the
CRS test is still a major hurdle for the geotechnical engineers. The CRS
consolidation test has some advantages over the standard consolidation test where
the time needed for the test is reduced from two weeks to few hours and the ability
to apply high effective pressure at larger sample size. Various guidelines and criteria
of acceptance for the CRS consolidation test had been introduced by many
researchers. The aim of this research is to establish new criteria of acceptance for the
CRS consolidation test. A new developed CRS equipment has been designed and
named Rapid Consolidation Equipment (RACE). The equipment was developed
using the concept of continuous consolidation test procedure. The criteria of
acceptance for the CRS test were based on the normalized strain rate, β introduced
by Lee (1981) and the ratio of excess pore pressure to applied pressure, (ua/σv). It
was also established that the maximum β to achieve acceptable data is 0.1. The
research showed that the minimum value for the β and ua/σv are 0.005 and 0.01
respectively. Another criterion of acceptance for the CRS test which takes into
account the clay fraction (CF) effects was also introduced. The clay fraction is used
to modify the normalized strain rate β, into β/CF. Results show that for soil with
clay fraction more than 50%, the maximum β / CF is 0.001. The maximum β / CF
for soil with CF lower than 50% is 0.008.

vi
ABSTRAK
Ujian pengukuhan berketerikan malar (CRS) merupakan salah satu ujian
pengukuhan yang baru di Malaysia. Walaupun ujian pengukuhan ini telah biasa
digunakan sebagai ujian pengukuhan utama di luar negara seperti USA dan Sweden,
namun masih tiada peralatan yang piawai. Pemilihan kadar terikan yang sesuai
untuk ujian pengukuhan berterikan malar (CRS) merupakan salah satu masalah
kepada jurutera geoteknik. Ujian CRS mempunyai beberapa kelebihan berbanding
dengan ujian oedometer kerana dapat mengurangkan masa ujian pengukuhan
daripada dua minggu kepada beberapa jam dan juga boleh dijalankan sehingga
tegasan berkesan yang tinggi pada sampel tanah yang lebih besar. Terdapat beberapa
kriteria penerimaan dan panduan untuk ujian CRS telah dikemukakan oleh para
penyelidik. Tujuan utama bagi penyelidikan ini adalah mencadangkan kriteria
penerimaam yang baru untuk ujian pengukuhan berketerikan malar. Satu alat ujikaji
CRS yang baru telah direkabentuk dengan menggunakan konsep ujian pengukuhan
berterusan yang dikenali sebagai Rapid Consolidation Equipment (RACE). Kriteria
penerimaan bagi ujian pengukuhan CRS adalah merupakan kadar keterikan
ternormal, β yang diperkenalkan oleh Lee (1981) dan nisbah tekanan air liang
lebihan terhadap tekanan yang dikenakan, (ua/σv). Maksimum β yang memberikan
data yang baik daripada ujian pengukuhan berterusan ialah 0.1. Penyelidikan ini
menunjukan bahawa nilai minimum bagi kadar keterikan ternormal, β dan nisbah
tekanan air liang lebihan dan tekanan yang dikenankan, (ue/σv) adalah 0.005 and
0.01. Satu lagi kriteria penerimaan untuk ujian CRS telah dicadangkan dimana
peratus melepasi lingkungan tanah liat (CF) telah diambil kira. Peratus lepasan
lingkungan telah digunakan untuk menukarkan kadar keterikan ternormal kepada β /
CF. Keputusan menunjukkan bahawa β / CF maksimum bagi tanah dengan peratus
tanah liat melebihi 50% adalah 0.001. Tanah dengan peratus tanah liat kurang
daripada 50% memberikan nilai β / CF maksimum sebanyak 0.008.

vii
TABLE OF CONTENTS
CHAPTER TITLE PAGE
DECLARATION ii
DEDICATION iii
ACKNOWLEDGEMENT iv
ABSTRACT v
ABSTRAK vi
TABLE OF CONTENTS vii
LIST OF TABLES xii
LIST OF FIGURE xiv
LIST OF SYMBOLS xix
LIST OF APPENDICES xxii
1 INTRODUCTION 1
1.1 Introduction 1
1.2 Statement of the Problem 2
1.3 Objectives 4
1.4 Scope of the Study 4
1.5 Significant of Research 5
2 LITERATURE REVIEW 6
2.1 Consolidation Theory 6
2.1.1 Principle of Consolidation 6
viii
2.1.2 Spring and Piston Analogy 7
2.1.3 Consolidation of the Soils 8
2.1.4 Terzaghi’s theory of Consolidation 9
2.1.5 Coefficient of Rate of Consolidation 12
2.1.5.1 Square-Root-Time Method 12
2.1.5.2 Log-Time Method 13
2.1.6 Coefficients of Compressibility 14
2.1.6.1 Coefficient of Compressibility (av) 14
2.1.6.2 Coefficient of Volume
Compressibility (mv) 15
2.1.6.3 Compression Index (cc) 16
2.1.7 Permeability 18
2.2 Standard Conventional Oedometer Test 19
2.3 Constant Rate of Strain Consolidation Test 20
2.3.1 Smith and Wahls procedure (1969) 21
2.3.2 Wissa method (1971) 23
2.3.3 Umehara and Zen Method (1980) 26
2.3.4 Lee method (1981) 27
2.4 Estimation of Strain Rate 29
2.4.1 Liquid Limit 29
2.4.2 Maximum Allowable Ratio of Excess and
Applied Pore Pressure Pressure (ua/σv) 30
2.4.3 Dimensionless Normalized Strain Rate, β 31
2.5 Tabulation of CRS Data 31
2.6 Criteria of acceptance of constant rate of strain
consolidation test 35
3 RESEARCH METHODOLOGY 37
3.1 Introduction 37
3.2 Classification Tests 37
3.2.1 Particle Size Distribution 38
3.2.2 Atterberg Limits 38
3.2.3 Specific Gravity 38
ix
3.2.4 Compaction Test 39
3.3 Preparation of Soil Sample 39
3.4 Design of CRS Equipment 42
3.5 Setting Up for the CRS Test and Other
Additional Apparatus 44
3.6 System Calibration of CRS Equipment 49
3.6.1 Calibration of the Measurement Instrument 50
3.6.1.1 Linear Displacement Transducer
(LVDT) Calibration 50
3.6.1.2 Load Cell Calibration 52
3.6.1.3 Pressure Transducer Calibration 53
3.6.2 System Calibration of the Equipment 54
3.7 Saturation of the CRS Soil Specimen 56
3.8 Strain Rate Estimation 57
4 CONTROL TEST RESULTS AND ANALYSIS 59
4.1 Introduction 59
4.2 Classification Test 59
4.2.1 Particle Size Distribution 59
4.2.2 Atterberg Limits Test 61
4.2.3 Specific Gravity Test 61
4.2.4 Compaction Test 62
4.2.5 Soil Classification 62
4.3 Conventional Oedometer Tests 63
4.3.1 Void Ratio versus Effective Stress 64
4.3.2 Coefficient of Consolidation versus Effective
Stress 67
x
5 CONSTANT RATE OF STRAIN CONSOLIDATION 71
TEST RESULT AND ANALYSIS
5.1 Introduction 71
5.2 Void Ratio and the Normalized Void Ratio Curve 72
5.2.1 100 kPa Remoulded Sample 72
5.2.2 200 kPa Remoulded Sample 78
5.2.3 300 kPa Remoulded Sample 85
5.3 Coefficient of Consolidation, cv 92
5.3.1 100 kPa Remoulded Sample 92
5.3.2 200 kPa Remoulded Sample 96
5.3.3 300 kPa Remoulded Sample 101
5.4 Normalized strain rate (β) 106
5.4.1 Air Papan Soil 106
5.4.2 Gemas Soil 109
5.4.3 Kaolin 111
5.4.4 Kluang Soil 112
5.4.5 Summarize of Normalized Strain Rate, β
and Modified Normalized Strain Rate, β / CF 115
5.4.6 CRS Test Using Normalized Strain Rate On
Clay Friction, β / CF 116
5.5 Maximum Ratio of Excess Pore Pressure and 118
Applied Pressure (ua/σv)
5.5.1 Air papan Soil 118
5.5.2 Gemas Soil 120
5.5.3 Kaolin 122
5.5.4 Kluang Soil 123
5.5.5 Summary on the Maximum Ratio of
Excess Pore Pressure and the Applied
Pressure (ua/σv) 125
xi
6 CONCLUSIONS AND RECOMMENDATIONS 126
6.1 Conclusions 126
6.1.1 Comparison of Oedometer Test and CRS
Test Results 127
6.1.2 Criteria of Acceptance for Constant Rate of
Strain Consolidation Test 128
6.2 Recommendations for Future Development 129
REFERENCES 131
APPENDICES 134

xii
LIST OF TABLES
TABLE NO. TITLE PAGE
2.1 Time Factors for One-Dimensional Consolidation 11
2.2 Some Typical Values of Coefficient of Volume 16 Compressibility
2.3 Classification of Soil according to Permeability 18
2.4 Suggested Rates of Strain for CRS Consolidation Test
(ASTM D4186-82) 29 2.5 Maximum allowable ratio of excess pore pressure
and applied pressure, (ua/σv) 30 3.1 Remoulded Sample Prepared for Conventional
Oedometer and CRS Test 41 3.2 Kaolin 100 kPa pre-consolidation Strain Rate Calculation 57 3.3 Maximum and Minimum Range of Strain Rate Estimation
for All Specimens 58 4.1 Percentage of the Clay, Silt and Sand for Soil Sample 60 4.2 Liquid Limit, Plastic Limit and Plastic Index for the
Soil Sample 61 4.3 Specific Gravity for the Soil Sample 61 4.4 Compaction Test Results 62 4.5 Soil Sample Classification 62

xiii
TABLE NO. TITLE PAGE
4.6 Compression Index (cc) for Kaolin, Gemas, Air Papan and
Kluang Soil 67 5.1 Summary of Compression Index for 100 kPa
Pre-Consolidation Pressure CRS test 78 5.2 Summary of Compression Index for 200 kPa
Pre-Consolidation Pressure CRS test 85 5.3 Summary of Compression Index for 300 kPa
Pre-Consolidation Pressure CRS test 91 5.4 Acceptable β Tabulation Range for Air Papan Sample 108 5.5 Normalized Strain Rate, β / CF for Air Papan Sample 108 5.6 Acceptable β Tabulation Range for Gemas Sample 110 5.7 Modified Normalized Strain Rate, β / CF for Gemas Sample 110 5.8 Acceptable β Tabulation Range for Kaolin Sample 112 5.9 Modified Normalized Strain Rate, β / CF for Kaolin Sample 112 5.10 Acceptable β Tabulation Range for Kluang Sample 114 5.11 Modified Normalized Strain Rate, β / CF for Kluang Sample 114 5.12 Maximum and Minimum Modified Normalized
Strain Rate, β / CF 115
5.13 Strain Rate Calculation by Modified Normalized Strain Rate 116 5.14 Maximum and Minimum Ratio of ua/σv for Air Papan Sample 120 5.15 Maximum and Minimum Ratio of ua/σv for Gemas Sample 121 5.16 Maximum and Minimum Ratio of ua/σv for Kaolin Sample 123 5.17 Maximum and Minimum Ratio of ua/σv for Kluang Sample 124
xiv
LIST OF FIGURE
FIGURE NO. TITLE PAGE
1.1 Conventional Oedometer 3 1.2 Study Area of the Research 5 2.1 Spring and Piston Analogy Illustrating the Principle 8
of Consolidation 2.2 Analysis of Square-Root-Time/Settlement Curve 12 2.3 Analysis of Log -Time/Settlement Curve 13 2.4 Void Ratio versus Pressure Curve (e-σ’) 15 2.5 Void Ratio versus Pressure Curve (e- log σ’) 17 2.6 Example of Loading and Unloading Stage for Standard
Oedometer Test 19 2.7 Representation of Loading Patterns for Constant Rate of Strain Consolidation Test 20
3.1 Schematic Diagram of Remoulded Sampler Preparation
Equipment 39 3.2 Photo of Remoulded Sampler 40 3.3 Step Loading Procedures for Remoulded Sampler Preparation 42 3.4 Schematic Diagram of the Constant Rate of Strain 43
Consolidation Test Equipment (Rapid Consolidation Cell Equipment, RACE)
xv
FIGURE NO. TITLE PAGE
3.5 Photo of the Constant Rate of Strain Consolidation Test Equipment (Rapid Consolidation Cell Equipment, RACE) 44 3.6 Mechanical Loading Frame for the CRS test 45 3.7 50 mm Linear Variable Displacement Transducer (LVDT) 46 3.8 1500 kPa Pressure Transducer 46 3.9 907 kilogram S- Type Load Cell 47 3.10 MPX 3000 Data Acquisition Unit (ADU) 48 3.11 Main Page of the Winhost Programme for Collecting
Data System 48 3.12 Schematic Arrangement of Control System for Constant
Rate of Strain Consolidation Tests 49 3.13 Channel Configuration for the Compression and Pressure
Calibrated with ADU and Winhost Programme 51 3.14 Channel Configuration Scaling for the Compression and
Pressure 51 3.15 Linear Variable Displacement Transducer (LVDT)
Calibration Process 52 3.16 Schematic Arrangement for the Load Cell Calibration on
Loading Frame 53 3.17 Displacement Calibration Curve for the CRS Testing System 54 3.18 Loading Pressure Calibration Curve for the CRS 55 Testing System 4.1 Particle Size Curve for All Soil Sample 60 4.2 Plasticity Chart for Soil Classification 63 4.3 Void Ratio versus Effective Pressure Curve for Kaolin Soil 65 4.4 Void Ratio versus Effective Pressure Curve for Gemas Soil 65 4.5 Void Ratio versus Effective Stress Curve for Air Papan Soil 66 4.6 Void Ratio versus Effective Pressure Curve for Kluang Soil 66

xvi
FIGURE NO. TITLE PAGE 4.7 Coefficient of Consolidation (cv) for Kaolin Remoulded Soil 69 4.8 Coefficeint of Consolidation (cv) for Gemas Remoulded Soil 69 4.9 Coefficient of Consolidation (cv) for Air Papan Remoulded Soil 70 4.10 Coefficient of Consolidation (cv) for Kluang Remoulded Soil 70 5.1 Void Ratio Comparison Curve for Air Papan 100 kPa Sample 73 5.2 e/ei Comparison Curve for Air Papan 100 kPa Sample 73 5.3 Void Ratio Comparison Curve for Gemas 100 kPa Sample 74 5.4 e/ei Comparison Curve for Gemas 100 kPa Sample 75 5.5 Void Ratio Comparison Curve for Kaolin 100 kPa Sample 75 5.6 e/ei Comparison Curve for Kaolin 100 kPa Sample 76 5.7 Void Ratio Comparison Curve for Kluang 100 kPa Sample 77 5.8 e/ei Comparison Curve for Kluang 100 kPa Sample 77 5.9 Void Ratio Comparison Curve for Air Papan 200 kPa Sample 79 5.10 e/ei Comparison Curve for Air Papan 200 kPa Sample 80 5.11 Void Ratio Comparison Curve for Gemas 200 kPa Sample 81 5.12 e/ei Comparison Curve for Gemas 200 kPa Sample 81 5.13 Void Ratio Comparison Curve for Kaolin 200 kPa Sample 82 5.14 e/ei Comparison Curve for Kaolin 200 kPa Sample 83 5.15 Void Ratio Comparison Curve for Kluang 200 kPa Sample 83 5.16 e/ei Comparison Curve for Kluang 200 kPa Sample 84 5.17 Void Ratio Comparison Curve for Air Papan 300 kPa Sample 86 5.18 e/ei Comparison Curve for Air Papan 300 kPa Sample 86 5.19 Void Ratio Comparison Curve for Gemas 300 kPa Sample 87 5.20 e/ei Comparison Curve for Gemas 300 kPa Sample 88

xvii
FIGURE NO. TITLE PAGE
5.21 Void Ratio Comparison Curve for Kaolin 300 kPa Sample 89 5.22 e/ei Comparison Curve for Kaolin 300 kPa Sample 89 5.23 Void Ratio Comparison Curve for Kluang 300 kPa Sample 90 5.24 e/ei Comparison Curve for Kluang 300 kPa Sample 91 5.25 cv Comparison Curve for Air Papan 100 kPa Sample 93 5.26 Excess Pore Pressure for 0.0125 mm/min CRS test 93 5.27 cv Comparison curve for Gemas 100 kPa Sample 94 5.28 Low Excess Pore Pressure for 0.03 mm/min CRS test 95 5.29 cv Comparison Curve for Kaolin 100 kPa Sample 95 5.30 cv Comparison Curve for Kluang 100 kPa Sample 96 5.31 cv Comparison curve for Air Papan 200 kPa Sample 97 5.32 Excess Pore Pressure for 0.02125 and 0.0325 mm/min CRS
Test 97 5.33 cv Comparison Curve for Gemas 200 kPa Sample 98 5.34 cv Comparison Curve for Kaolin 200 kPa Sample 99 5.35 Excess Pore Pressure for 0.094 mm/min CRS test. 99 5.36 cv Comparison Curve for Kluang 200 kPa Sample 100 5.37 Excess Pore Pressure for 0.0216 and 0.01425 mm/min CRS
Test 100 5.38 cv Comparison Curve for Air Papan 300 kPa Sample 101 5.39 Excess Pore Pressure for 0.0325 and 0.015 mm/min CRS
Test 102 5.40 cv Comparison Curve for Gemas 300 kPa Sample 102 5.41 cv Comparison Curve for Kaolin 300 kPa Sample 103 5.42 Excess Pore Pressure for 0.05 and 0.1 mm/min CRS test. 104

xviii
FIGURE NO. TITLE PAGE
5.43 cv Comparison Curve for Kluang 300 kPa Sample 105 5.44 Excess Pore Pressure for 0.0185 mm/min CRS test 105 5.45 Normalized strain rate, β tabulation for Air Papan Sample 107 5.46 Normalized strain rate, β tabulation for Gemas Sample 109 5.47 Normalized strain rate, β tabulation for Kaolin Sample 111 5.48 Normalized strain rate, β tabulation for Kluang Sample 113 5.49 Void ratio versus effective stress for UTM laterit soil 117 5.50 e/ei comparison graph for UTM laterit soil 117 5.51 cv comparison curve for UTM laterit soil 118 5.52 Ratio of excess pore pressure and applied pressure (ua/σv) for
Air Papan Sample 119 5.53 Ratio of excess pore pressure and applied pressure (ua/σv) for
Gemas Sample 121 5.54 Ratio of excess pore pressure and applied pressure (ua/σv) for
Kaolin Sample 122 5.55 Ratio of excess pore pressure and applied pressure (ua/σv) for
Kluang Sample 124

xix
LIST OF SYMBOLS
ADU - Data acquisition unit av - coefficient of compressibility cc - compression index CF - clay fraction CH - clay of high plasticity soil CI - clay of intermediate plasticity CRS - constant rate of strain consolidation test cv - coefficient of consolidation cv d - drained coefficient of consolidation cv ud - undrained coefficient of consolidation D - constrained modulus e - void ratio ef - final void ratio ei - initial void ratio eo - void ratio at start of test e1 - void ratio at starting effective stress e2 - void ratio at ending effective stress ē - average void ratio Gs - specific gravity

xx
ho - height at starting test H - length of the maximum drainage path Hi - initial height k - coefficient of permeability LL - liquid limit LVDT - linear displacement transducer M - tangent modulus MI - silt of intermediate plasticity mf - final moisture content mo - moisture content mv - coefficient of volume compressibility n - porosity p - vertical load pb - back pressure r - strain rate RACE - Rapid Consolidation Equipment t - time Tv - time factor t90 - time corresponding to 90% of primary consolidation ua - excess pore pressure ub - initial back pressure uu - pore pressure ε - strain εave - average strain σ - total stress
xxi
σ’ - effective stress σ’0 - effective stress for starting range σ’1 - effective stress for ending range σv - vertical applied pressure σ’v - vertical effective stress σ'ave - average effective stress σv’(bottom) - bottom effective stress σv’(top) - top effective stress β - Normalized strain rate βd - normalized strain rate at drained face βu - normalized strain rate at undrained face β / CF - Normalized strain rate on clay friction ∆e - changes in void ratio ∆H - Displacement ρd - dry density ρw - water density δe - change in voids ratio δp - increment pressure
xxii
LIST OF APPENDICES
APPENDIX TITLE PAGE
A Measurement Instrument Calibration Report 134 B Average cv Value Calculation for Strain Rate Estimation 141 C CRS Strain Rate Estimation 145 D Liquid Limit and Plastic Limit 151 E Particle Size Distribution 159 F Specific Gravity 167 G Compaction Test 169 H Example Standard Oedometer Test for Kaolin Soil 177 I Example Standard Oedometer Test for Gemas Soil 179 J Example Standard Oedometer Test for Air Papan Soil 181 K Example Standard Oedometer Test for Kluang Soil 183 L Example CRS test results and analysis 185

1
CHAPTER 1
INTRODUCTION
1.1 Introduction
Since Terzaghi formulated his consolidation theory in 1923, many extensions
had been made continuously to solve many of the unrealistic assumptions made in
original theory. Today, consolidation theory had reached an advanced development
that solutions are available for most practical problems. Some researcher refines
Terzaghi’s theory by solving a more generalized form of the differential equation of
consolidation (Sheahan and Watters, 1997). Others established new governing
consolidation equations based on realistic stress-strain-time models to yield
compression-time and pore pressure-time relationships (Znidarcic and Schiffman,
1981). Numerous techniques to measure the compressibility of the soil were
introduced after the conventional oedometer test is standardized. These new
techniques include constant rate of strain consolidation test, constant rate of load
consolidation test, constant pore pressure gradient, constant pressure ratio, restricted
flow consolidation and back pressure control.
Constant rate of strain consolidation test is one of the new developments
suggested by many researchers to suit the market nowadays. Constant rate of strain
consolidation test can reduce the time needed for consolidation test using standard
oedometer test from almost two weeks time to few hours. The constant rate of strain
2
consolidation test also has been used as the standard consolidation test in Sweden,
Norway, The United States and France.
The Criteria acceptance for the constant rate of strain consolidation test is the
objective of the research because the CRS is not a standard consolidation test in
Malaysia. The results of the constant rate of strain consolidation test (CRS) depends
on the strain rate used in CRS test, so it is important to compare the results for the
different strain rate of CRS test with the conventional oedometer test. The criteria of
acceptance for the CRS test were developed for future improvements on
consolidation test.
Previous researcher suggested few criteria to accept the CRS test result upon
comparing the CRS test results with the conventional oedometer. These criteria of
the acceptance for the CRS test were based on the comparison of void ratio curve (e
against effective stress), coefficient of consolidation (cv), normalized strain rate (β)
and ratio of excess pore pressure to applied total stress (u/σv).
1.2 Statement of the Problem
Since 1950’s, the standard compressibility test has been used to measure the
soil compression characteristic is the one-dimensional Compression Test
(Oedometer Test) based on Terzaghi theory. This one-dimensional oedometer test is
one of the simplest forms of soil loading test which the soil sample is placed in a
stiff metal cylinder so that radial strains equal to zero. Porous discs at the top and
bottom to provide drainage of excess pore water (Figure 1.1).

3
Figure 1.1: Conventional Oedometer.
Conventional oedometer test based on Terzaghi’s theory is a step loading
tests which took around two weeks for one complete test with loading and unloading
stages. The test is also limited to low to medium loading for a sample size of 75 mm
diameter. Beside that, pore pressure at the bottom of the soil sample is not usually
measured.
Many researchers have introduced other methods to measure the
compressibility characteristics of the soil. One of the new developments is the CRS
test. Through the CRS test, the testing time for a completed test can be reduced from
around two weeks to few hours. The compression test can be conducted until a very
high pressure.
The main problem of the CRS test is to determine the proper strain rate used
in the test. The selection of the test rate is still a major hurdle in CRS test although
many researchers had done various studies on this. Many recommendations had
been offered by researchers (Lee, Choa, Lee and Quek, 1993) for the selection of
test rate but these recommendations are empirical and vary with clay type.
This research is aimed at finding a criterion on the strain rate used in CRS
test for various types of clay obtained in Johor. Modifications on the available strain
rate selection method for CRS test is recommended.
σa , εa
εr = 0
ut = 0
ut = 0

4
1.3 Objectives
The following objectives are set forth to achieve the aim of the research:
i. To develop consolidation equipment that could be used to run rapid
consolidation using constant rate of strain consolidation method.
ii. To compare the result of the compression characteristic of the soil,
coefficient of consolidation (cv) and compression index (cc) obtained
from CRS test to the results of conventional oedometer test.
ii. To establish the new criteria of acceptance for Constant Rate of Strain
consolidation test.
1.4 Scope of the Study
The soil samples for the study are remoulded from disturbed samples
obtained from different sites in Malaysia. The interpretation of the research of the
study is limited to:
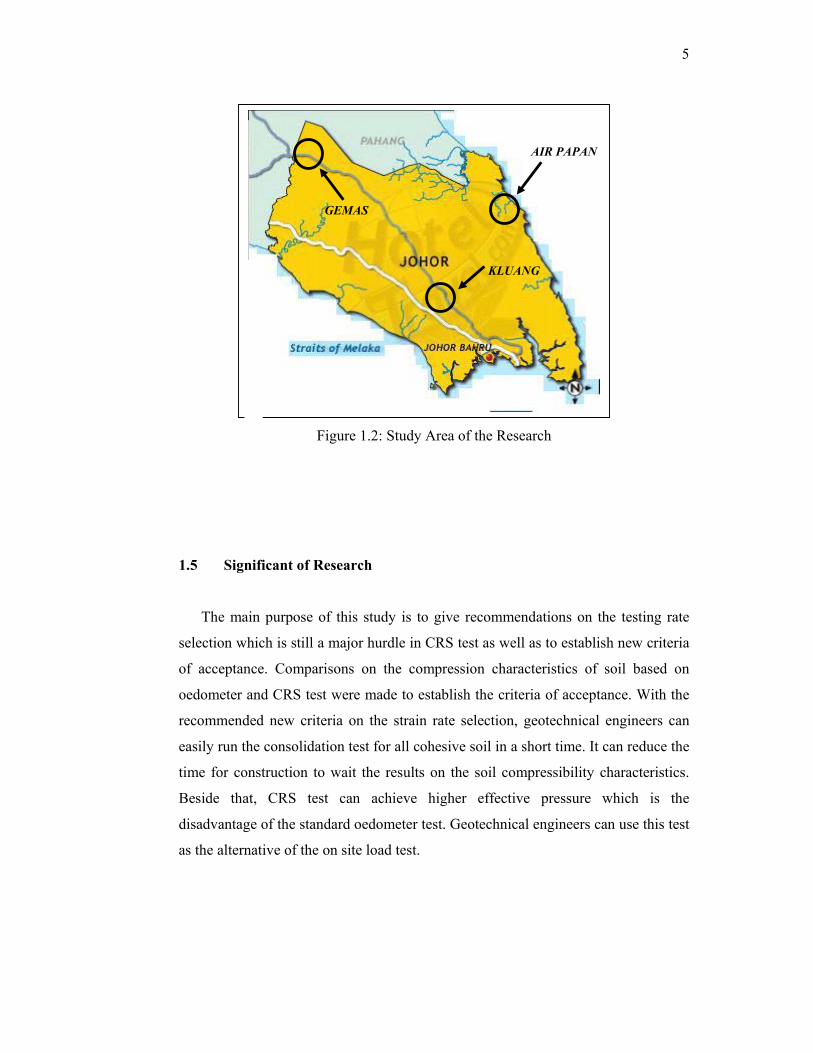
i. Disturbed samples are collected from Kluang, Gemas and Air Papan,
Johor (Figure 1.2). Kaolin soil was used as the control sample for the
study.
ii. The specimens used for the study is remoulded sample. In the case all the
disturbed soil samples were dried and grinded into powder and
remoulded from slurry under 100, 200 and 300 kPa pre-consolidation
pressure using self made remoulded sampler equipment.
iii Conventional oedometer test and the Constant Rate of Strain
consolidation test will be conducted to a maximum of 8.5 kN and 1100
kPa vertical pressure respectively.
5
Figure 1.2: Study Area of the Research
1.5 Significant of Research
The main purpose of this study is to give recommendations on the testing rate
selection which is still a major hurdle in CRS test as well as to establish new criteria
of acceptance. Comparisons on the compression characteristics of soil based on
oedometer and CRS test were made to establish the criteria of acceptance. With the
recommended new criteria on the strain rate selection, geotechnical engineers can
easily run the consolidation test for all cohesive soil in a short time. It can reduce the
time for construction to wait the results on the soil compressibility characteristics.
Beside that, CRS test can achieve higher effective pressure which is the
disadvantage of the standard oedometer test. Geotechnical engineers can use this test
as the alternative of the on site load test.
AIR PAPAN
GEMAS
KLUANG
Recommended