MQP-BIO-DSA-5836
CREATION, INDUCTION, AND PURIFICATION OF
HIS-TAGGED AND FLAG-TAGGED OXR2
A Major Qualifying Project Report
Submitted to the Faculty of the
WORCESTER POLYTECHNIC INSTITUTE
in partial fulfillment of the requirements for the
Degree of Bachelor of Science
in
Biology and Biotechnology
by
_________________________
Tommy Tashjian
April 30, 2009
APPROVED:
_________________________ _________________________
Michael Volkert, Ph.D. David Adams, Ph.D.
Molecular Genetics and Microbiology Biology and Biotechnology
UMass Medical Center WPI Project Advisor
Major Advisor
2
ABSTRACT
Reactive oxygen species (ROS) are reduced forms of oxygen created as byproducts of
cellular metabolic processes. ROS cause oxidative damage to many organic molecules within
the cell, especially to DNA. OXR2 provides cells with protection against this damage, but its
biochemical and functional properties have not yet been studied in depth. The purpose of this
project was to create and purify a His-tagged version of human OXR2 and to induce a FLAG-
tagged OXR2 in E. coli. These tagged proteins will be used in studies of this protein and its
mechanism.
3
TABLE OF CONTENTS
Signature Page ………………………………………………………………………. 1
Abstract ……………………………………………………………………………… 2
Table of Contents ……………………………………………………………….…… 3
Acknowledgements ………………………………………………………………….. 4
Background ………………………………………………………………………….. 5
Project Purpose ………………………………………………………………………. 21
Methods ……………………………………………………………………………… 22
Results ……………………………………………………………………………….. 28
Discussion …………………………………………………………………………… 39
Works Cited ….……………………………………………………………………… 42
4
ACKNOWLEDGMENTS
First, I would like to thank Dr. Michael Volkert for allowing me to become involved in
the research of his laboratory and for working with me throughout the course of the project. I
would also like to thank Lijian Yu, Anita Fenton, and Jagamya Vijayaraghavan for assisting me
with lab procedures that were new to me. I would like to acknowledge Dr. Kenan Murphy for
his contribution of his Q cells to my project, thank you very much. Finally, I would like to thank
Dr. David Adams for initiating this project, for assisting with lab trouble-shooting, and for draft
editing during the project.

5
BACKGROUND
REACTIVE OXYGEN SPECIES AND OXIDATIVE DA
Reactive oxygen species (ROS)
are created as byproducts of the metabolic reactions that naturally occur in the cell
Reactive oxygen species include superoxide (O
radicals (OH.; See Figure 1).
Figure 1: The Steps of Reduction of Molecular Oxygen to Water
include O2-., H2O2, and OH
. (Imlay, 2003)
While molecular oxygen is a poor oxidant, reactive oxygen species are far better electron
acceptors and are therefore better oxidants
reactive of these species. It is so reactiv
the cell (Imlay, 2003). The hydroxyl radical reacts with the first molecule with which it
interacts. Hydrogen peroxide is a slightly
that reduces its reactivity (Imlay, 2003)
molecule’s negative charge inhibits it from accepting electrons from other negatively charged
molecules (Imlay, 2003). Oxidation by reactive oxygen species leads to a wide range of damage
to biomolecules, such as nucleic acids, proteins, and lipids
BACKGROUND
IES AND OXIDATIVE DAMAGE
Reactive oxygen species (ROS) are partially reduced species of molecular oxygen
are created as byproducts of the metabolic reactions that naturally occur in the cell (Imlay, 2003)
Reactive oxygen species include superoxide (O2-.), hydrogen peroxide (H2O2), and hydroxide
: The Steps of Reduction of Molecular Oxygen to Water. Note that ROS molecules
(Imlay, 2003).
While molecular oxygen is a poor oxidant, reactive oxygen species are far better electron
acceptors and are therefore better oxidants (Imlay, 2003). The hydroxyl radical is the most
It is so reactive that it is only inhibited by the rate of diffusion within
he hydroxyl radical reacts with the first molecule with which it
Hydrogen peroxide is a slightly less reactive oxidant. It contains a stable O-O bond
(Imlay, 2003). Superoxide is also slightly less reactive. The
molecule’s negative charge inhibits it from accepting electrons from other negatively charged
Oxidation by reactive oxygen species leads to a wide range of damage
to biomolecules, such as nucleic acids, proteins, and lipids (Croteau & Bohr, 1997).
ar oxygen. They
(Imlay, 2003).
), and hydroxide
Note that ROS molecules
While molecular oxygen is a poor oxidant, reactive oxygen species are far better electron
radical is the most
e that it is only inhibited by the rate of diffusion within
he hydroxyl radical reacts with the first molecule with which it
O bond
molecule’s negative charge inhibits it from accepting electrons from other negatively charged
Oxidation by reactive oxygen species leads to a wide range of damage
6
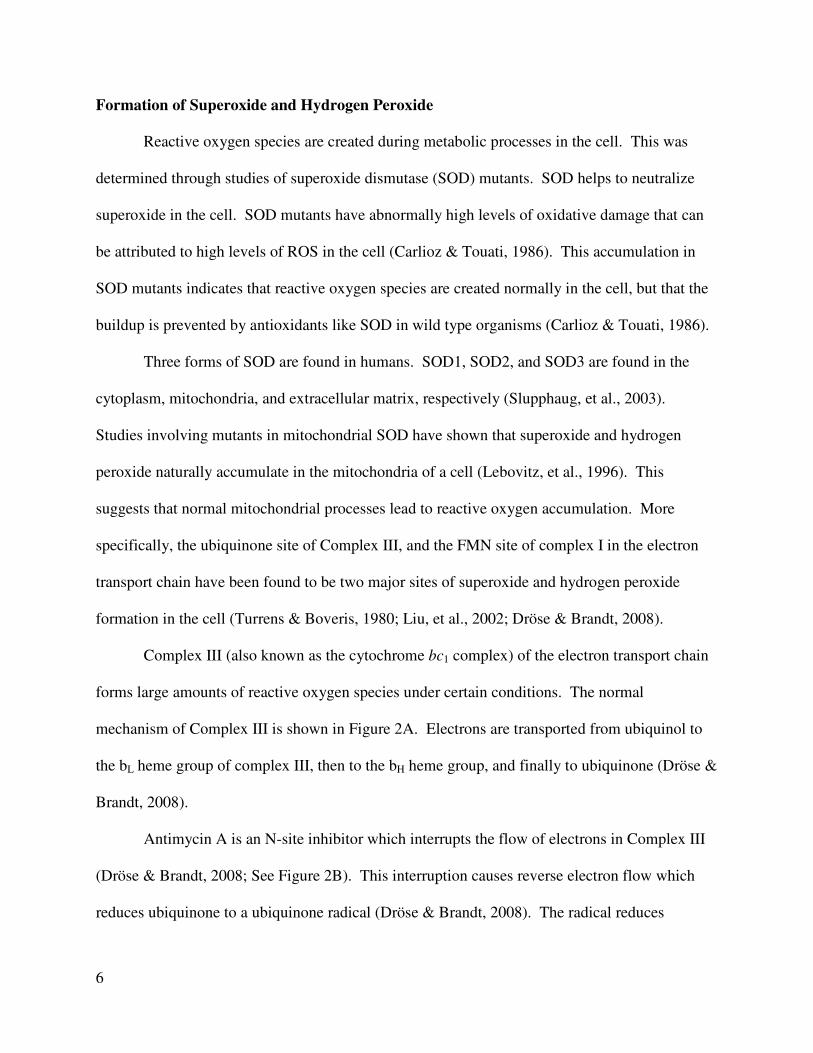
Formation of Superoxide and Hydrogen Peroxide
Reactive oxygen species are created during metabolic processes in the cell. This was
determined through studies of superoxide dismutase (SOD) mutants. SOD helps to neutralize
superoxide in the cell. SOD mutants have abnormally high levels of oxidative damage that can
be attributed to high levels of ROS in the cell (Carlioz & Touati, 1986). This accumulation in
SOD mutants indicates that reactive oxygen species are created normally in the cell, but that the
buildup is prevented by antioxidants like SOD in wild type organisms (Carlioz & Touati, 1986).
Three forms of SOD are found in humans. SOD1, SOD2, and SOD3 are found in the
cytoplasm, mitochondria, and extracellular matrix, respectively (Slupphaug, et al., 2003).
Studies involving mutants in mitochondrial SOD have shown that superoxide and hydrogen
peroxide naturally accumulate in the mitochondria of a cell (Lebovitz, et al., 1996). This
suggests that normal mitochondrial processes lead to reactive oxygen accumulation. More
specifically, the ubiquinone site of Complex III, and the FMN site of complex I in the electron
transport chain have been found to be two major sites of superoxide and hydrogen peroxide
formation in the cell (Turrens & Boveris, 1980; Liu, et al., 2002; Dröse & Brandt, 2008).
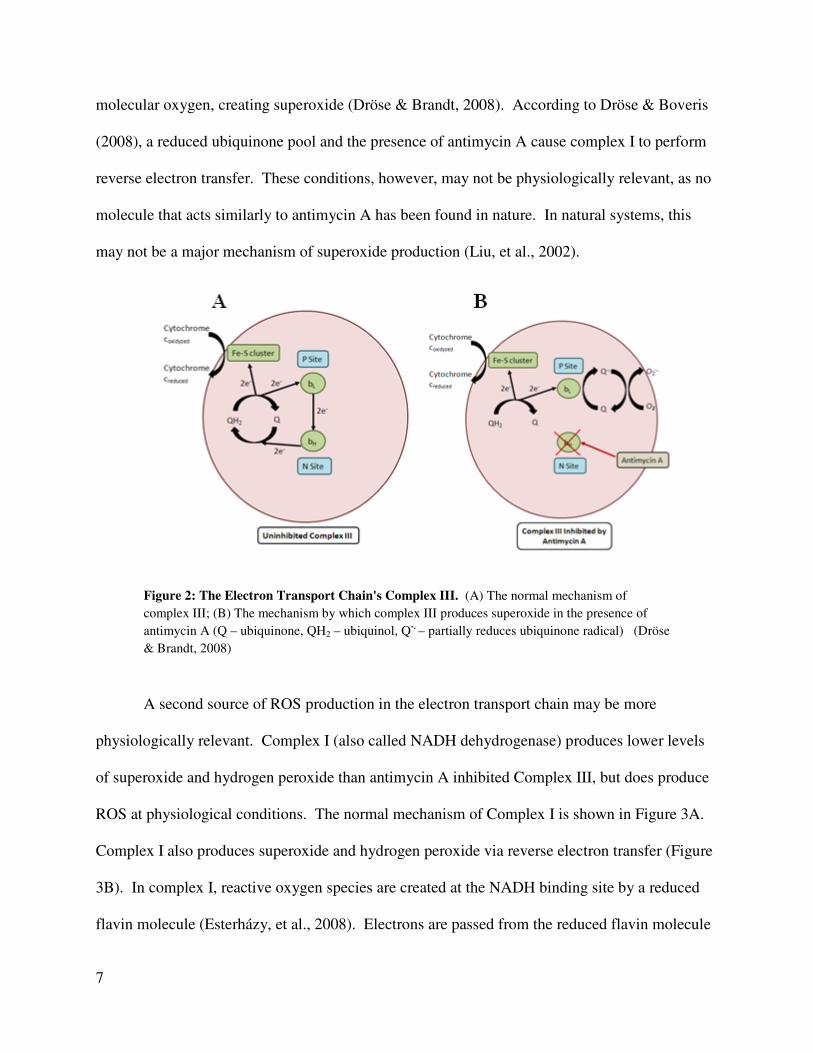
Complex III (also known as the cytochrome bc1 complex) of the electron transport chain
forms large amounts of reactive oxygen species under certain conditions. The normal
mechanism of Complex III is shown in Figure 2A. Electrons are transported from ubiquinol to
the bL heme group of complex III, then to the bH heme group, and finally to ubiquinone (Dröse &
Brandt, 2008).
Antimycin A is an N-site inhibitor which interrupts the flow of electrons in Complex III
(Dröse & Brandt, 2008; See Figure 2B). This interruption causes reverse electron flow which
reduces ubiquinone to a ubiquinone radical (Dröse & Brandt, 2008). The radical reduces
7
molecular oxygen, creating superoxide (Dröse & Brandt, 2008). According to Dröse & Boveris
(2008), a reduced ubiquinone pool and the presence of antimycin A cause complex I to perform
reverse electron transfer. These conditions, however, may not be physiologically relevant, as no
molecule that acts similarly to antimycin A has been found in nature. In natural systems, this
may not be a major mechanism of superoxide production (Liu, et al., 2002).
Figure 2: The Electron Transport Chain's Complex III. (A) The normal mechanism of
complex III; (B) The mechanism by which complex III produces superoxide in the presence of
antimycin A (Q – ubiquinone, QH2 – ubiquinol, Q-.
– partially reduces ubiquinone radical) (Dröse
& Brandt, 2008)
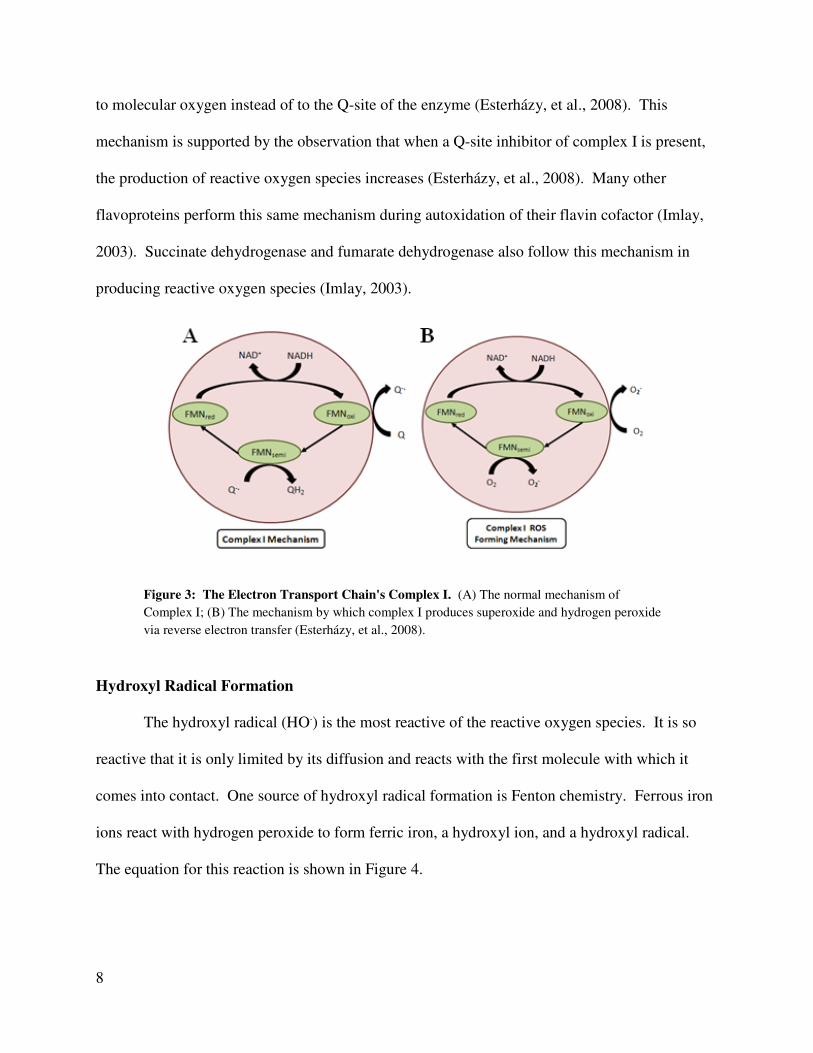
A second source of ROS production in the electron transport chain may be more
physiologically relevant. Complex I (also called NADH dehydrogenase) produces lower levels
of superoxide and hydrogen peroxide than antimycin A inhibited Complex III, but does produce
ROS at physiological conditions. The normal mechanism of Complex I is shown in Figure 3A.
Complex I also produces superoxide and hydrogen peroxide via reverse electron transfer (Figure
3B). In complex I, reactive oxygen species are created at the NADH binding site by a reduced
flavin molecule (Esterházy, et al., 2008). Electrons are passed from the reduced flavin molecule
8
to molecular oxygen instead of to the Q-site of the enzyme (Esterházy, et al., 2008). This
mechanism is supported by the observation that when a Q-site inhibitor of complex I is present,
the production of reactive oxygen species increases (Esterházy, et al., 2008). Many other
flavoproteins perform this same mechanism during autoxidation of their flavin cofactor (Imlay,
2003). Succinate dehydrogenase and fumarate dehydrogenase also follow this mechanism in
producing reactive oxygen species (Imlay, 2003).
Figure 3: The Electron Transport Chain's Complex I. (A) The normal mechanism of
Complex I; (B) The mechanism by which complex I produces superoxide and hydrogen peroxide
via reverse electron transfer (Esterházy, et al., 2008).
Hydroxyl Radical Formation
The hydroxyl radical (HO.) is the most reactive of the reactive oxygen species. It is so
reactive that it is only limited by its diffusion and reacts with the first molecule with which it
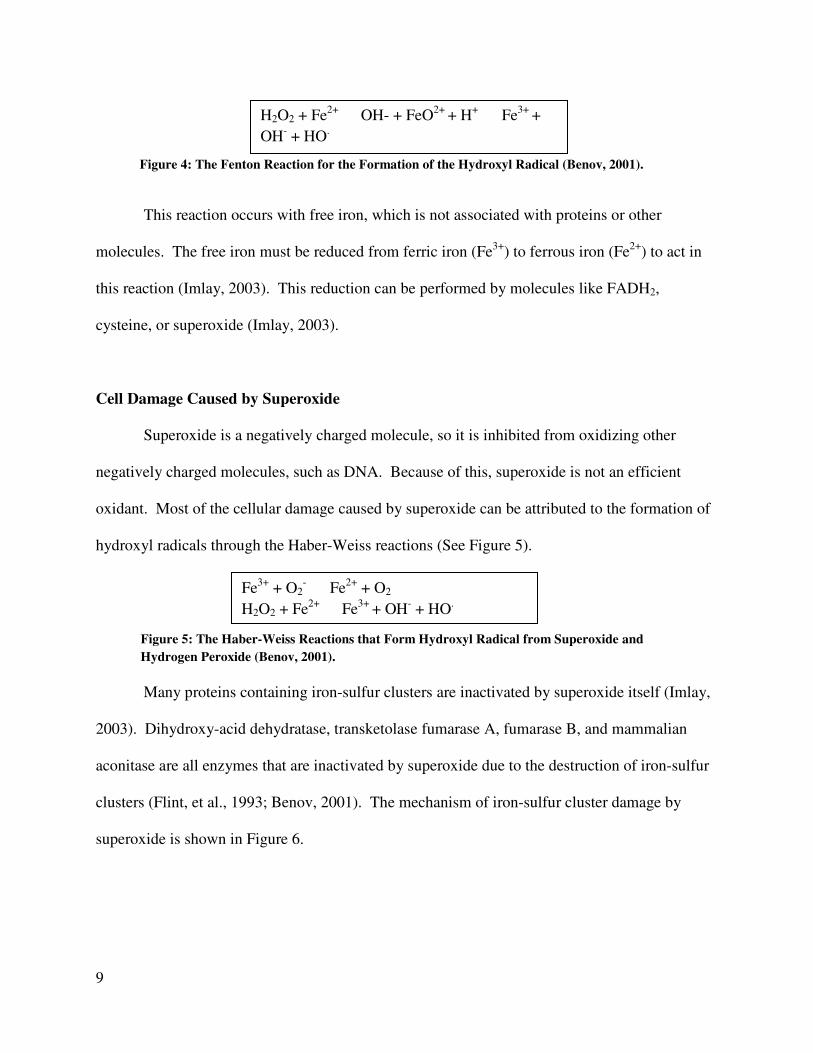
comes into contact. One source of hydroxyl radical formation is Fenton chemistry. Ferrous iron
ions react with hydrogen peroxide to form ferric iron, a hydroxyl ion, and a hydroxyl radical.
The equation for this reaction is shown in Figure 4.
9
This reaction occurs with free iron, which is not associated with proteins or other
molecules. The free iron must be reduced from ferric iron (Fe3+
) to ferrous iron (Fe2+
) to act in
this reaction (Imlay, 2003). This reduction can be performed by molecules like FADH2,
cysteine, or superoxide (Imlay, 2003).
Cell Damage Caused by Superoxide
Superoxide is a negatively charged molecule, so it is inhibited from oxidizing other
negatively charged molecules, such as DNA. Because of this, superoxide is not an efficient
oxidant. Most of the cellular damage caused by superoxide can be attributed to the formation of
hydroxyl radicals through the Haber-Weiss reactions (See Figure 5).
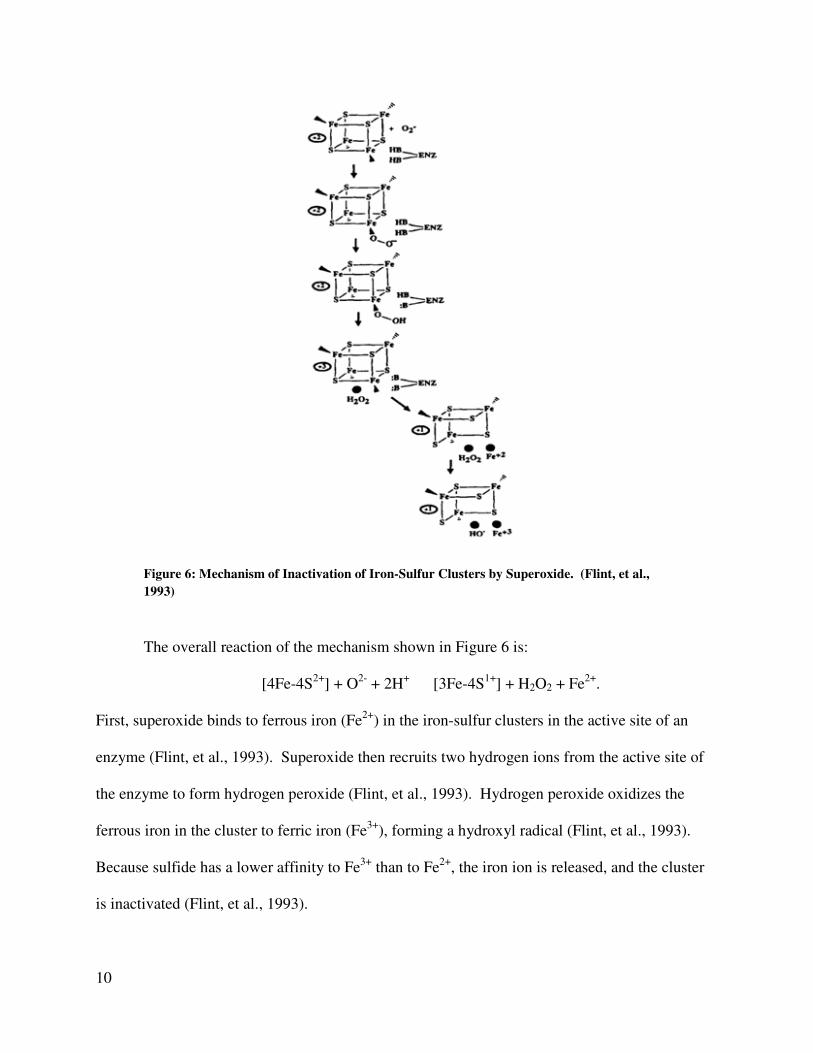
Many proteins containing iron-sulfur clusters are inactivated by superoxide itself (Imlay,
2003). Dihydroxy-acid dehydratase, transketolase fumarase A, fumarase B, and mammalian
aconitase are all enzymes that are inactivated by superoxide due to the destruction of iron-sulfur
clusters (Flint, et al., 1993; Benov, 2001). The mechanism of iron-sulfur cluster damage by
superoxide is shown in Figure 6.
H2O2 + Fe2+ à OH- + FeO
2+ + H
+ à Fe
3+ +
OH- + HO
.
Figure 4: The Fenton Reaction for the Formation of the Hydroxyl Radical (Benov, 2001).
Fe3+
+ O2- à Fe
2+ + O2
H2O2 + Fe2+ à Fe
3+ + OH
- + HO
.
Figure 5: The Haber-Weiss Reactions that Form Hydroxyl Radical from Superoxide and
Hydrogen Peroxide (Benov, 2001).
10
Figure 6: Mechanism of Inactivation of Iron-Sulfur Clusters by Superoxide. (Flint, et al.,
1993)
The overall reaction of the mechanism shown in Figure 6 is:
[4Fe-4S2+
] + O2-
+ 2H+ à [3Fe-4S
1+] + H2O2 + Fe
2+.
First, superoxide binds to ferrous iron (Fe2+
) in the iron-sulfur clusters in the active site of an
enzyme (Flint, et al., 1993). Superoxide then recruits two hydrogen ions from the active site of
the enzyme to form hydrogen peroxide (Flint, et al., 1993). Hydrogen peroxide oxidizes the
ferrous iron in the cluster to ferric iron (Fe3+
), forming a hydroxyl radical (Flint, et al., 1993).
Because sulfide has a lower affinity to Fe3+
than to Fe2+
, the iron ion is released, and the cluster
is inactivated (Flint, et al., 1993).

11
Cell Damage Caused by Hydrogen Peroxide
Hydrogen peroxide is another oxidant of biomolecules in the cell. Like superoxide, much
of the damage from hydrogen peroxide in the cell can be attributed to the formation of hydroxyl
radicals via the Haber-Weiss reactions (See Figure 5). Hydrogen peroxide can, however, oxidize
methionine residues, cysteine residues, ferric iron, and iron sulfur clusters (Imlay, 2003).
A major target for hydrogen peroxide-induced damage is sulfur atoms. Hydrogen
peroxide can oxidize sulfur atoms in cysteine residues of amino acids (Imlay, 2003). This can be
drastic to proteins with catalytic cysteine residues. Denu & Tanner (1998) studied tyrosine
phosphatases’ inactivation in the presence of hydrogen peroxide. The catalytic cysteine residues
of these enzymes are inactivated when oxidized by hydrogen peroxide. This same inactivation
has been seen in Recombinant Human α1-antitrypsin and glutathione transferase (Shen, et al.,
1993; Griffiths, et al., 2002). The oxidation of these residues to sulfenic acid residues can cause
disulfide bridges within a protein. Sulfenic acid residues can also be reduced further to sulfinic
acid residues. These alterations can ruin catalytic cysteine residues, or severely alter the
structure of proteins.
Cell Damage by Hydroxyl Radical
A wide range of damage can occur in the cell in the presence of the hydroxyl radical.
Two targets of the hydroxyl radical that can lead to the most drastic damage in the cell are
membrane lipids and nucleic acids. Polyunsaturated fatty acids that are found in membrane
phospholipids are a huge target of hydroxyl radical oxidation (Marnett, 2000). There are
methylene groups between the cis double bonds of these unsaturated fatty acids, which react with
the hydroxyl radical and form carbon centered radicals (Marnett, 1999). The effects of this
12
oxidation can be drastic. Because there are so many lipid molecules packed tightly together in a
membrane, a chain reaction of lipid peroxidation can lead to the oxidation of a large number of
molecules from a single hydroxyl radical. This can severely damage the membrane.
The products of lipid peroxidation are very diverse. There are several pathways of
reconciliation of the carbon centered radicals that are formed during the reaction of methylene
groups and hydroxyl radicals. In addition to membrane damage, lipid peroxidation creates
products that can damage the cell in other ways. One such molecule is 4-hydroxynonenal
(HNE). HNE causes a wide range of damage within the cell. It modifies cysteine, histidine, and
lysine residues of amino acids (Catalá, 2009). These modifications can inactivate important
proteins, leading to alterations in DNA and protein synthesis and gene regulation (Catalá, 2009).
These effects can be extremely damaging to the cell.
Malondialdehyde (MDA) is another product of lipid peroxidation that can cause severe
cell damage. MDA reacts very well with DNA, more specifically dG, dA, and dC residues
(Marnett, 2000). Exposure of DNA to MDA results most commonly in G to T transversions
(Marnett, 1999). It can also result in C to T and A to G transitions, and more rarely frameshift
addition of nucleotides (Marnett, 1999).
As discussed above, hydroxyl radicals are created through Fenton chemistry with iron
ions. Iron ions bind very well with DNA molecules, and the close proximity to DNA during
formation makes DNA a huge target of hydroxyl radical oxidation (Imlay, 2003). A common
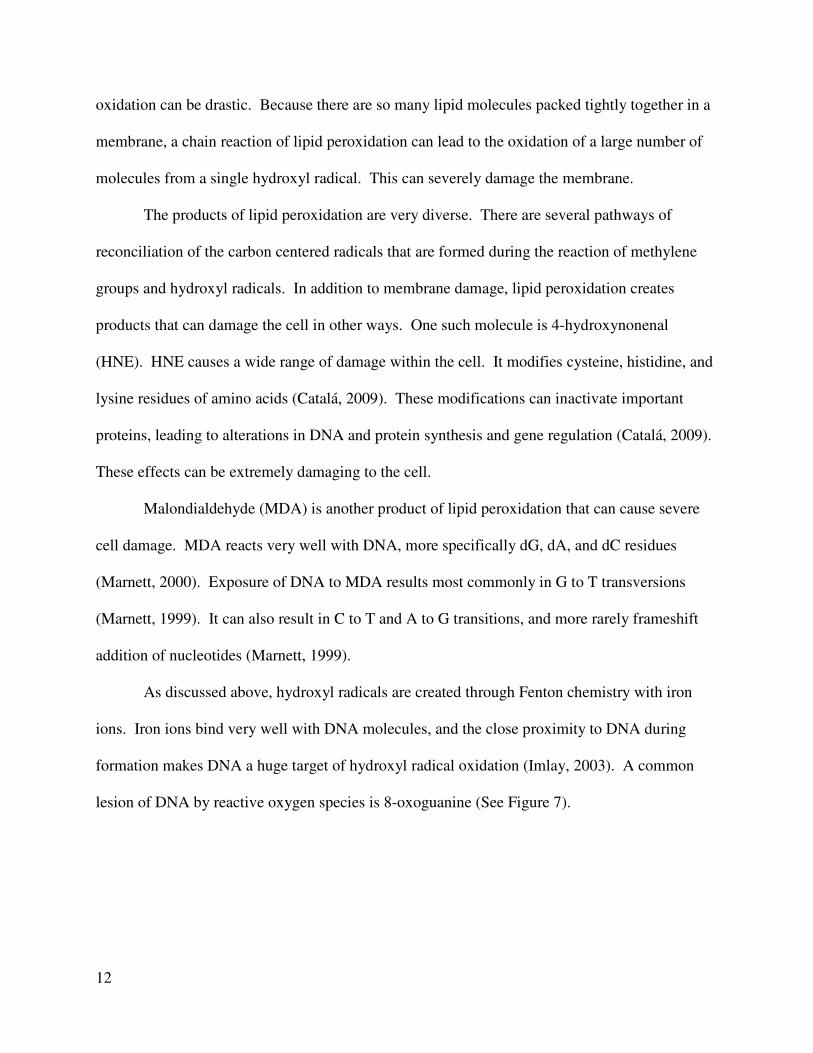
lesion of DNA by reactive oxygen species is 8-oxoguanine (See Figure 7).
13
Figure 7: Diagram of 8-oxoguanine, a Common Lesion in DNA Induced by ROS. (A)
Guanine; (B) 8-oxoguanine induced by ROS (Marnett, 2000)
Oxidative damage to DNA is possibly the most severe form of damage that is induced by
ROS. When nucleotide bases are oxidized, transversions and frameshift mutations can
accumulate in the cell. This can lead to nonfunctional proteins, or changes in gene regulation
and the cell cycle. Oxidative damage to DNA is linked to aging, cancer, and many other forms
of human pathogenesis.
OXIDATIVE DAMAGE PREVENTION AND REPAIR
Because reactive oxygen species incur so much damage to cells, they have developed
complex mechanisms of oxidative damage prevention and repair. The mechanisms that cells use
to prevent this damage include enzymes that convert reactive oxygen species to harmless
molecules of water and oxygen. Because damage occurs even with these preventative enzymes,
complex mechanisms of DNA, lipid, and protein repair exist. These mechanisms will be
described in more detail in this section.
Oxidative Damage Prevention
Because vital processes, such as the mitochondrial electron transport chain, are constantly
creating reactive oxygen species in the cell, they have developed mechanisms to keep the cellular
14
levels to a minimum. Antioxidant enzymes break down these dangerous oxidants into harmless
molecules of water and oxygen. To eliminate superoxide from the cell, human cells have three
forms of the enzyme superoxide dismutase. This enzyme breaks superoxide into oxygen and less
reactive hydrogen peroxide by the following reaction:
2O2- + 2H
+ à O2 + H2O2 (Slupphaug, et al., 2003).
The second protection enzyme in most cells is catalase. This enzyme converts hydrogen
peroxide into water and oxygen in the following reactions:
2H2O2 à 2H2O + O2 (Slupphaug, et al., 2003).
Selenium-dependant GSH peroxidase performs a similar reaction of converting hydrogen
peroxide to harmless water and oxygen (Fang, et al., 2002).
Vitamins can also act as antioxidants. Vitamin E can reduce peroxyl radicals in
polyunsaturated fatty acids in phospholipids (Fang, et al., 2002). When these radicals are located
in a membrane, this will stop the chain reaction of lipid peroxidation and prevent further damage.
Vitamin C has been shown to protect DNA from oxidative damage, and B vitamins are thought
to protect from amino acid oxidation (Fang, et al., 2002). These mechanisms have not been well
established (Fang, et al., 2002).
Oxidative DNA Damage Repair
Even with the preventative measures described above, cells are still damaged by reactive
oxygen species. One of the most severe forms of damage that the cell can sustain is DNA
damage. DNA damage can lead to mutations within important genes, leading to mutated gene
products. It can also lead to the misregulation of genes. The consequences of oxidative DNA
damage are extremely wide, and range from harmless to fatal.
15
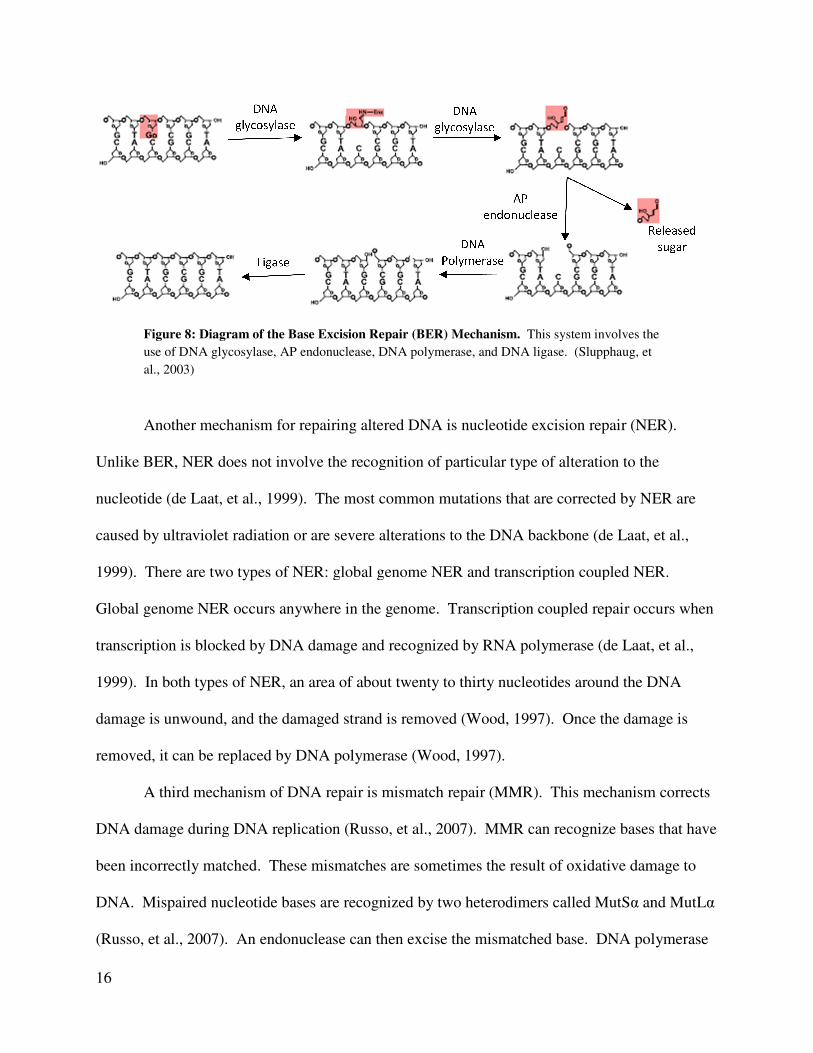
One mechanism of repair of an oxidized DNA is base excision repair (BER). In BER an
oxidized nucleotide base is recognized, removed, and replaced with a normal nucleotide. First, a
DNA glycosylase recognizes a damaged base and removes it, forming an abasic site (AP site)
(Slupphaug, et al., 2003). There are two types of DNA glycosylase. Monofunctional
glycosylases stop at this stage, leaving the DNA backbone intact (Lu, et al., 2001). All of the
known glycosylases that recognize oxidized bases are bifunctional (Lu, et al., 2001). These
enzymes also create a nick in the DNA backbone at the 3’ side of the AP site (Lu, et al., 2001).
There are many DNA glycosylases, and all recognize a specific type of DNA damage.
After a damaged base has been removed, and the backbone has been nicked, an AP
endonuclease will cleave the DNA backbone on the 5’ side of the AP site (Slupphaug, et al.,
2003). This releases the deoxyribose molecule that was bound to the oxidized base. This step
differs if a NEIL family glycosylase recognizes and excises the mutated base. These
glycosylases leave a 3’ phosphate terminus when the base is removed (Wiederhold, et al., 2004).
This is a poor substrate for AP endonucleases, so a polynucleotide kinsase removes the
phosphate, creating the same type of product as the AP endonuclease reaction (Wiederhold, et
al., 2004). DNA polymerase can then replace the missing nucleotide, and ligase seals the nicks
in the backbone (Slupphaug, et al., 2003). Figure 8 shows a diagram of this process.
16
Figure 8: Diagram of the Base Excision Repair
use of DNA glycosylase, AP endonuclease, DNA polymerase, and DNA ligase
al., 2003)
Another mechanism for repairing altered DNA is nucleotide excision repair (NER)
Unlike BER, NER does not involve the recognitio
nucleotide (de Laat, et al., 1999). The most common mutations that are corrected by NER are
caused by ultraviolet radiation or are severe alterations to the DNA backbone (de Laat, et al.,
1999). There are two types of NER: global genome NER and transcription coupled NER
Global genome NER occurs anywhere in the genome
transcription is blocked by DNA damage and recognized by RNA polymerase (de Laat, et al.,
1999). In both types of NER, an area of about twenty to thirty nucleotides around the DNA
damage is unwound, and the damaged strand is removed
removed, it can be replaced by DNA polymerase
A third mechanism of DNA repair is mismatch repair (MMR)
DNA damage during DNA replication (Russo, et al., 2007)
been incorrectly matched. These mismatches are someti
DNA. Mispaired nucleotide bases are recognized by two heterodimers called MutS
(Russo, et al., 2007). An endonuclease can then excise the mismatched base
: Diagram of the Base Excision Repair (BER) Mechanism. This system involves the
use of DNA glycosylase, AP endonuclease, DNA polymerase, and DNA ligase. (Slupphaug, et
Another mechanism for repairing altered DNA is nucleotide excision repair (NER)
Unlike BER, NER does not involve the recognition of particular type of alteration to the
The most common mutations that are corrected by NER are
caused by ultraviolet radiation or are severe alterations to the DNA backbone (de Laat, et al.,
es of NER: global genome NER and transcription coupled NER
Global genome NER occurs anywhere in the genome. Transcription coupled repair occurs when
transcription is blocked by DNA damage and recognized by RNA polymerase (de Laat, et al.,
h types of NER, an area of about twenty to thirty nucleotides around the DNA
damage is unwound, and the damaged strand is removed (Wood, 1997). Once the damage is
removed, it can be replaced by DNA polymerase (Wood, 1997).
A third mechanism of DNA repair is mismatch repair (MMR). This mechanism corrects
DNA damage during DNA replication (Russo, et al., 2007). MMR can recognize bases that have
These mismatches are sometimes the result of oxidative damage to
paired nucleotide bases are recognized by two heterodimers called MutSα and MutL
An endonuclease can then excise the mismatched base. DNA polymerase
This system involves the
(Slupphaug, et
Another mechanism for repairing altered DNA is nucleotide excision repair (NER).
n of particular type of alteration to the
The most common mutations that are corrected by NER are
caused by ultraviolet radiation or are severe alterations to the DNA backbone (de Laat, et al.,
es of NER: global genome NER and transcription coupled NER.
Transcription coupled repair occurs when
transcription is blocked by DNA damage and recognized by RNA polymerase (de Laat, et al.,
h types of NER, an area of about twenty to thirty nucleotides around the DNA
Once the damage is
This mechanism corrects
MMR can recognize bases that have
damage to
α and MutLα
DNA polymerase
17
and ligase can then insert the new base and seal the DNA backbone. This type of DNA repair is
generally performed on extreme legions that distort the DNA backbone. A large segment of
DNA is excised and resynthesized.
OXIDATIVE RESISTANCE GENES
In addition to the prevention and repair mechanisms for oxidative damage described
above, eukaryotic cells contain a group of proteins called oxidative resistance proteins. The
mechanisms of these proteins are not well known, but studies have shown that they can protect
cells from the oxidative damage of reactive oxygen species.
OXR1
OXR1 is a gene encoding an oxidative resistance protein. It was discovered in a screen
for human genes that conferred oxidative resistance to a repair-defective spontaneous mutator
strain of E. coli (Volkert, et al., 2000). Several genes were found that conferred oxidative
damage resistance, including one that was named OXR1. Homologues of this gene are found in
many eukaryotes, including yeast (Volkert, et al., 2000). Yeasts deficient in OXR1 are very
vulnerable to damage by hydrogen peroxide, and the gene is inducible by heat and oxidative
stress in yeast and humans (Volkert, et al., 2000; Elliott & Volkert, 2004).
There are a number of splice variants of OXR1. The gene has a total of sixteen exons
that can produce a 99.7 kDa protein (Durand, et al., 2007). The OXR1 protein is localized in the
mitochondria in human and yeast (Elliott & Volkert, 2004). This is probably due to the large
amount of reactive oxygen species that are created by metabolic reactions in the mitochondria.
18
OXR2
The sequence of the OXR1 gene was used to probe the rest of the human genome for
OXR1 paralogs. The searches yielded three major results, the most important of which was a
gene called NCOA7 (Nuclear Receptor Coactivator 7) (Durand, et al., 2007). This gene is also
referred to as OXR2 or ERAP140 (Estrogen Receptor-Associated Protein 140). Most exons of
OXR2 were found to be very similar to OXR1 (Durand, et al., 2007).
Human OXR2 has been found to protect E. coli from oxidative damage. Cells
transformed with OXR2 were protected from 99.9% of GCà TA transversions that were induced
by hydrogen peroxide when compared to wild type controls (Durand, et al., 2007). Because the
carboxyl-terminal end of the protein is so conserved, and the carboxyl-terminal exons of OXR1
were found to be sufficient to confer oxidative resistance in E. coli, studies of transformations
with amino-terminal deletions of the OXR2 gene were performed (Durand, et al., 2007). It was
found that only bases 657-942, the carboxyl-terminal end of the protein, is sufficient to protect E.
coli from 73% of oxidative damage (Durand, et al., 2007). This difference in efficiency in
conferring oxidative resistance between the full length and truncated protein is thought to be
caused by the greater stability of the full-length gene product in bacteria (Durand, et al., 2007).
OXR2 and OXR1 are not identical. OXR2 is localized in the nucleus and cytoplasm, but
not the mitochondria specifically (Durand, et al., 2007). This protein is not inducible by
oxidative damage, unlike OXR1, and is known to associate with an estrogen receptor (Durand, et
al., 2007).
Almost nothing is known about the mechanism of oxidative damage protection of OXR2.
Because the biochemical and functional properties of the protein are unknown, it is difficult to
determine an efficient way to purify this protein. Another method of purification must be used in
19
order to purify the protein to be used in studies of its function and properties. One method is
affinity tagging.
PROTEIN AFFINITY TAGGING
An affinity tag for proteins is an “exogenous amino acid (aa) sequence with a high
affinity for a specific biological or chemical ligand” (Arnau, et al., 2006). Currently, a vast
number of tagged-proteins are being studied and produced. In order to work with these proteins,
they must be purified. Before affinity tags, the biochemical properties of each protein had to be
studied, and a unique method of purification had to be determined. With affinity tags, a wide
range of proteins can be purified with a single method. This technique is especially helpful in
the early stages of research on a protein, when biochemical and functional studies have not yet
been performed (Arnau, et al., 2006). Affinity tagging can increase the yield of purification, and
can often stabilize a protein by protecting it from proteolysis (Arnau, et al., 2006).
However, there are some disadvantages to using affinity tags. The added amino acids of
some tags can change the conformation of certain proteins which can affect function (Arnau, et
al., 2006). They can also inhibit activity if they interfere with an enzyme’s active site, or
increase a protein’s toxicity (Arnau, et al., 2006).
His-Tagging
One of the most popular affinity tags is the His-tag. About 60% of protein structural
studies have been performed using this type of tag which consists of a series of about six
histidine residues (Arnau, et al., 2006). The residues can be placed on either the amino-terminus
or the carboxyl-terminus of the protein (Arnau, et al., 2006).

20
Immobilized metal ion affinity chromatography (IMAC) is performed to purify His-
tagged proteins (Waugh, 2005). This process involves running a cell extract through a nickel-
sepharose column. The histidine residues of the tag can bind to the immobilized nickel (Arnau,
et al., 2006). His-tags are very common due to the low cost of the purifying resin and the mild
conditions needed for protein elution (Waugh, 2005). Unfortunately, they should not be used on
proteins for which metal binding assays are required, due to the tag’s affinity for metal. Another
disadvantage of His-tags is the lower specificity in purification compared to some other affinity
tags.
FLAG-Tagging
A second common affinity tag is the FLAG-tag. This is a hydrophilic series of eight
amino acids: DDYKDDDK (Arnau, et al., 2006). Unlike the His-tag, it uses calcium-dependant
antibody purification (Arnau, et al., 2006). This purification has a higher specificity than IMAC,
although the resin is far more expensive (Waugh, 2005). The elution conditions of this tag are
also harsher, and may cause damage to some proteins (Waugh, 2005).

21
PROJECT PURPOSE
As discussed in the Background, reactive oxygen species (ROS) cause oxidative damage
to many organic molecules within the cell, especially to DNA. Human OXR2 is a protein that
provides cells with protection against this damage; however its properties have not yet been
studied in depth. Thus the main purpose of this project was to create and purify tagged versions
of OXR2 to be used in future studies of its mechanism.
The initial purpose of this project was to produce, induce, and purify a His-tagged version
of OXR2 (OXR2-his6), but in the process of completing this goal, several interesting
observations were made about the selection against cells containing this his-tagged protein and
the degradation of this protein in E. coli. So the initial goal was modified to include an addition
to this line of research, production of a FLAG-tagged version of OXR2 (OXR2-FLAG). Both of
the tagged proteins created in this project can be used in future research involving OXR2.
22
METHODS
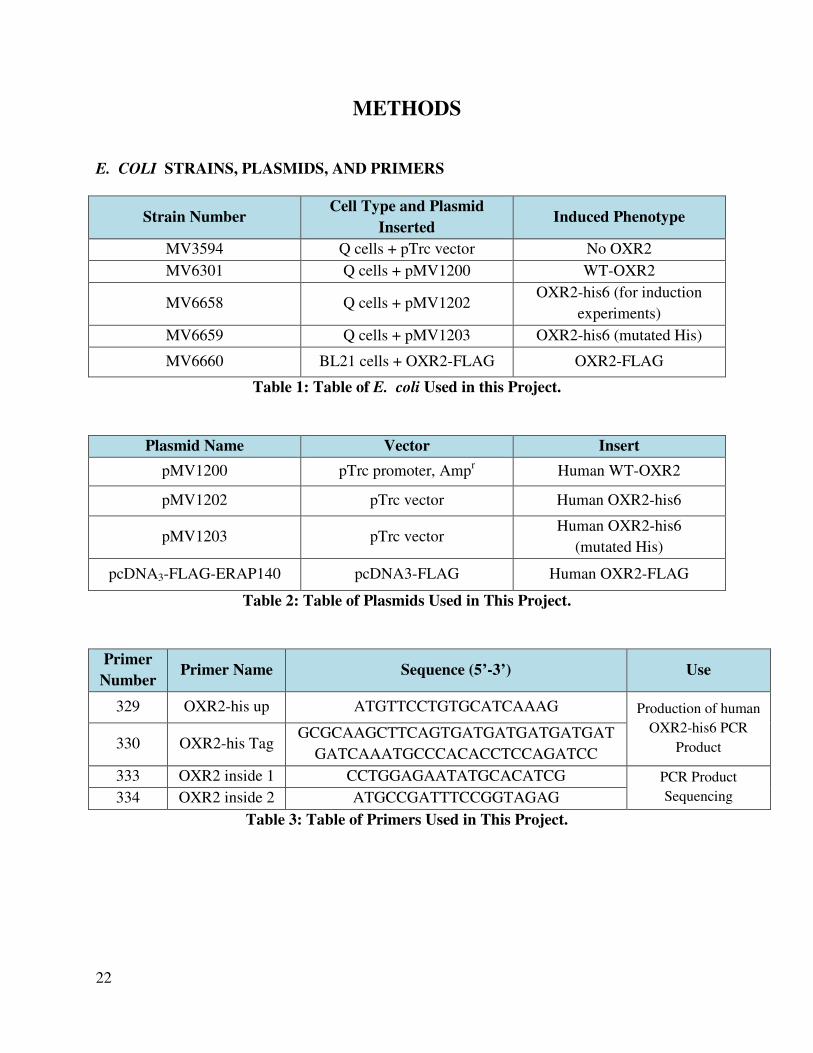
E. COLI STRAINS, PLASMIDS, AND PRIMERS
Strain Number Cell Type and Plasmid
Inserted Induced Phenotype
MV3594 Q cells + pTrc vector No OXR2
MV6301 Q cells + pMV1200 WT-OXR2
MV6658 Q cells + pMV1202 OXR2-his6 (for induction
experiments)
MV6659 Q cells + pMV1203 OXR2-his6 (mutated His)
MV6660 BL21 cells + OXR2-FLAG OXR2-FLAG
Table 1: Table of E. coli Used in this Project.
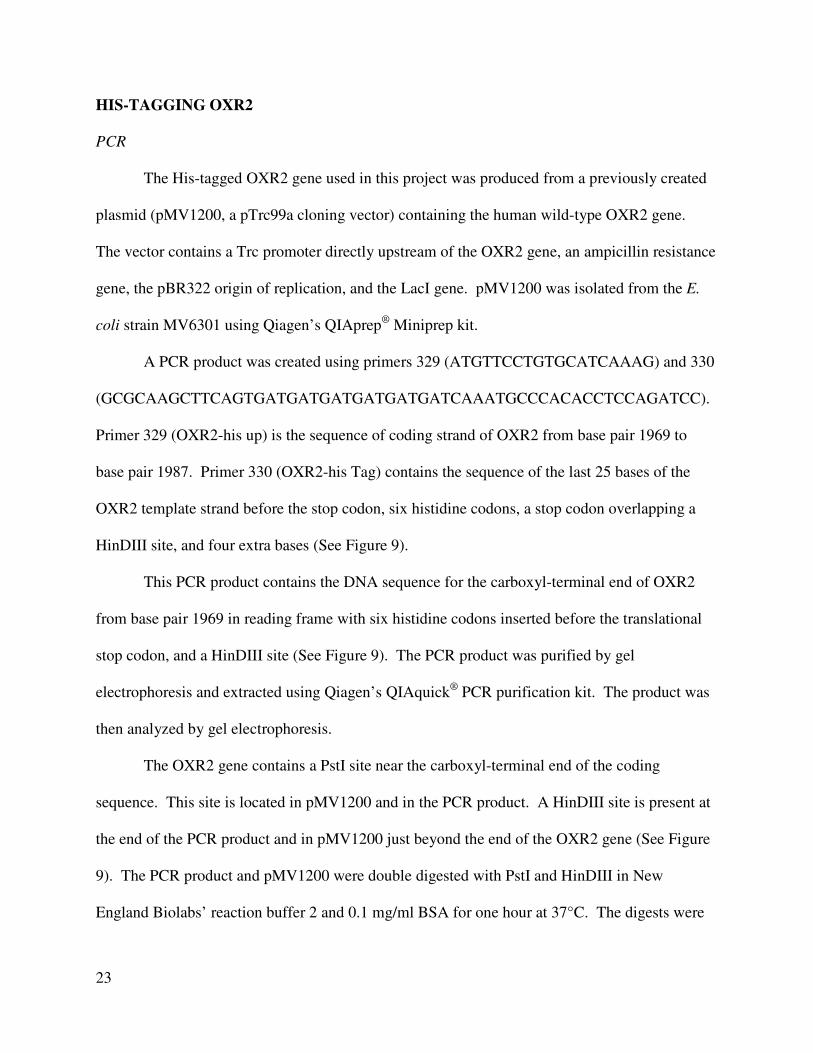
Plasmid Name Vector Insert
pMV1200 pTrc promoter, Ampr Human WT-OXR2
pMV1202 pTrc vector Human OXR2-his6
pMV1203 pTrc vector Human OXR2-his6
(mutated His)
pcDNA3-FLAG-ERAP140 pcDNA3-FLAG Human OXR2-FLAG
Table 2: Table of Plasmids Used in This Project.
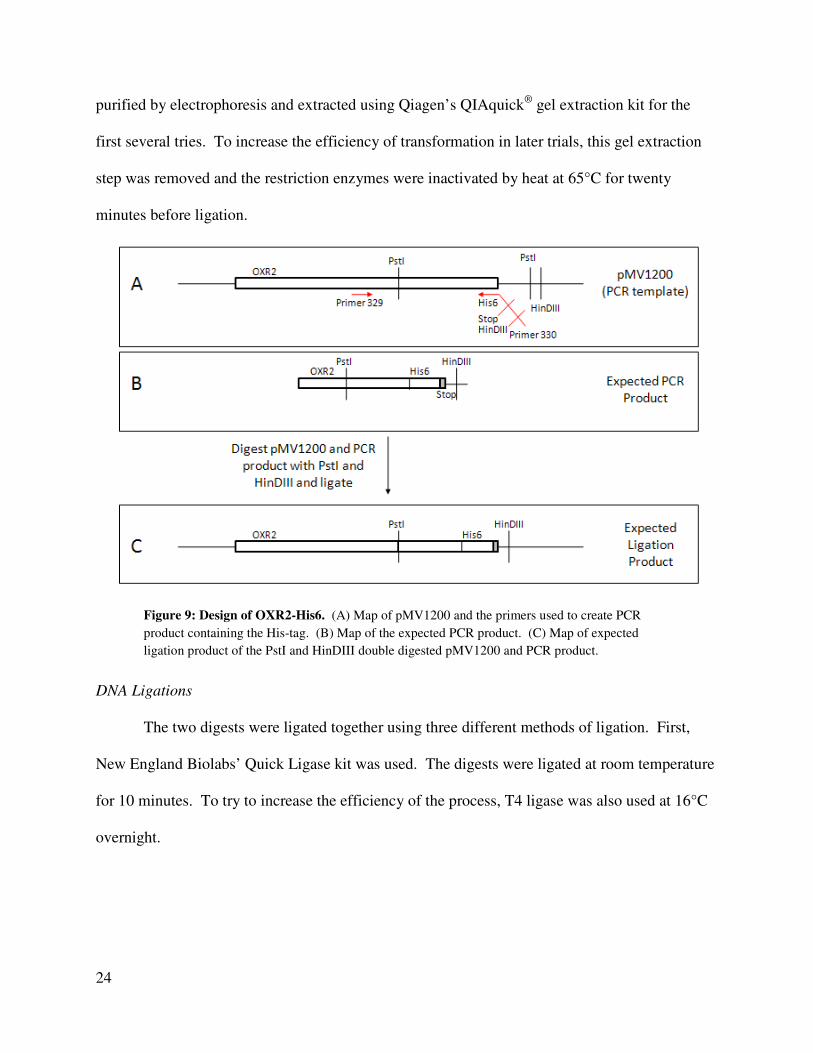
Primer
Number Primer Name Sequence (5’-3’) Use
329 OXR2-his up ATGTTCCTGTGCATCAAAG Production of human
OXR2-his6 PCR
Product 330 OXR2-his Tag GCGCAAGCTTCAGTGATGATGATGATGAT
GATCAAATGCCCACACCTCCAGATCC
333 OXR2 inside 1 CCTGGAGAATATGCACATCG PCR Product
Sequencing 334 OXR2 inside 2 ATGCCGATTTCCGGTAGAG
Table 3: Table of Primers Used in This Project.
23
HIS-TAGGING OXR2
PCR
The His-tagged OXR2 gene used in this project was produced from a previously created
plasmid (pMV1200, a pTrc99a cloning vector) containing the human wild-type OXR2 gene.
The vector contains a Trc promoter directly upstream of the OXR2 gene, an ampicillin resistance
gene, the pBR322 origin of replication, and the LacI gene. pMV1200 was isolated from the E.
coli strain MV6301 using Qiagen’s QIAprep® Miniprep kit.
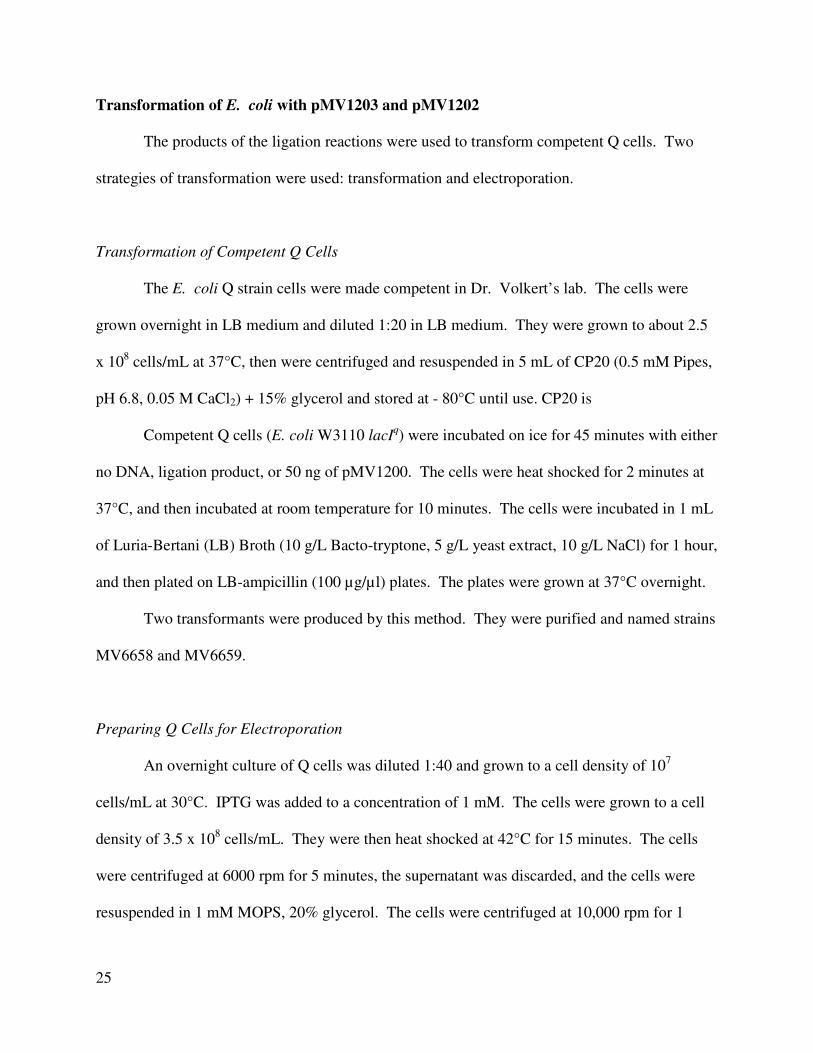
A PCR product was created using primers 329 (ATGTTCCTGTGCATCAAAG) and 330
(GCGCAAGCTTCAGTGATGATGATGATGATGATCAAATGCCCACACCTCCAGATCC).
Primer 329 (OXR2-his up) is the sequence of coding strand of OXR2 from base pair 1969 to
base pair 1987. Primer 330 (OXR2-his Tag) contains the sequence of the last 25 bases of the
OXR2 template strand before the stop codon, six histidine codons, a stop codon overlapping a
HinDIII site, and four extra bases (See Figure 9).
This PCR product contains the DNA sequence for the carboxyl-terminal end of OXR2
from base pair 1969 in reading frame with six histidine codons inserted before the translational
stop codon, and a HinDIII site (See Figure 9). The PCR product was purified by gel
electrophoresis and extracted using Qiagen’s QIAquick® PCR purification kit. The product was
then analyzed by gel electrophoresis.
The OXR2 gene contains a PstI site near the carboxyl-terminal end of the coding
sequence. This site is located in pMV1200 and in the PCR product. A HinDIII site is present at
the end of the PCR product and in pMV1200 just beyond the end of the OXR2 gene (See Figure
9). The PCR product and pMV1200 were double digested with PstI and HinDIII in New
England Biolabs’ reaction buffer 2 and 0.1 mg/ml BSA for one hour at 37°C. The digests were
24
purified by electrophoresis and extracted using Qiagen’s QIAquick® gel extraction kit for the
first several tries. To increase the efficiency of transformation in later trials, this gel extraction
step was removed and the restriction enzymes were inactivated by heat at 65°C for twenty
minutes before ligation.
Figure 9: Design of OXR2-His6. (A) Map of pMV1200 and the primers used to create PCR
product containing the His-tag. (B) Map of the expected PCR product. (C) Map of expected
ligation product of the PstI and HinDIII double digested pMV1200 and PCR product.
DNA Ligations
The two digests were ligated together using three different methods of ligation. First,
New England Biolabs’ Quick Ligase kit was used. The digests were ligated at room temperature
for 10 minutes. To try to increase the efficiency of the process, T4 ligase was also used at 16°C
overnight.
25
Transformation of E. coli with pMV1203 and pMV1202
The products of the ligation reactions were used to transform competent Q cells. Two
strategies of transformation were used: transformation and electroporation.
Transformation of Competent Q Cells
The E. coli Q strain cells were made competent in Dr. Volkert’s lab. The cells were
grown overnight in LB medium and diluted 1:20 in LB medium. They were grown to about 2.5
x 108 cells/mL at 37°C, then were centrifuged and resuspended in 5 mL of CP20 (0.5 mM Pipes,
pH 6.8, 0.05 M CaCl2) + 15% glycerol and stored at - 80°C until use. CP20 is
Competent Q cells (E. coli W3110 lacIq) were incubated on ice for 45 minutes with either
no DNA, ligation product, or 50 ng of pMV1200. The cells were heat shocked for 2 minutes at
37°C, and then incubated at room temperature for 10 minutes. The cells were incubated in 1 mL
of Luria-Bertani (LB) Broth (10 g/L Bacto-tryptone, 5 g/L yeast extract, 10 g/L NaCl) for 1 hour,
and then plated on LB-ampicillin (100 µg/µl) plates. The plates were grown at 37°C overnight.
Two transformants were produced by this method. They were purified and named strains
MV6658 and MV6659.
Preparing Q Cells for Electroporation
An overnight culture of Q cells was diluted 1:40 and grown to a cell density of 107
cells/mL at 30°C. IPTG was added to a concentration of 1 mM. The cells were grown to a cell
density of 3.5 x 10⁸ cells/mL. They were then heat shocked at 42°C for 15 minutes. The cells
were centrifuged at 6000 rpm for 5 minutes, the supernatant was discarded, and the cells were
resuspended in 1 mM MOPS, 20% glycerol. The cells were centrifuged at 10,000 rpm for 1
26
minute, the supernatant was discarded, and the cells resuspended in 1 mL of 1.0 mM MOPS,
20% glycerol twice. Finally the cells were centrifuged at 10,000 rpm a last time, the supernatant
was discarded and were resuspended in 100 µL 1.0 mM MOPS, 20% glycerol.
Electroporation of Q Cells
The Q cells that were made competent for electroporation were chilled in cuvettes with
either no DNA, ligation product, or pMV1200. The air was tapped out of the cuvettes, and they
were placed in the electroporation machine. The cells were shocked for 1 second with 2000
volts, and 300 µL of LB was added to the cuvettes. The cells were removed from the cuvette,
suspended in 3 mL of LB, and incubated at 37°C for one hour. They were then plated on LB-
ampicillin plates and grown overnight at 37°C.
Induction of His-Tagged OXR2
The induction of OXR2-his6 was performed on strains: MV6658 and MV6659. Because
the plasmid from strain MV6658 was found to be mutant by sequencing from Sequegen, only the
results from the induction and purification of strain MV6659 are discussed in this report. For
each induction, there were two controls. One was uninduced transformant strain MV6659. The
second control was an IPTG induced strain MV3594, which is identical to MV6659, but contains
a vector control plasmid pTrc99A with no OXR2 insert.
Two overnight cultures of the transformant strain and one overnight culture of strain
MV3594 were diluted 1:50, then grown at 37°C for 1 hour. IPTG was added to cultures of
MV3594 culture and MV6659 to a final concentration of 2 mM, and the cells were grown for 3
hours at 37°C. Samples of the cells were taken at the point of IPTG addition, and also at

27
subsequent time points of 1 hour, 2 hours, and 3 hours. The induction of OXR2 was analyzed by
Coomassie staining of an SDS-PAGE gel and by Western blot.
Purification of His-Tagged OXR2
His-tagged OXR2 was purified from a culture of MV6659 cells that were induced with
IPTG and grown for three hours. The cells were lysed by freeze-thawing and by treatment with
lysozyme. A His-spin protein miniprep kit from Zymo Research was used to purify the His-
tagged protein from the cell extract. The purification was analyzed by Coomassie staining of an
SDS-PAGE gel and by Western blot.
FLAG-TAGGING OXR2
Induction of FLAG-tagged OXR2
A strain of BL21 cells that had been transformed in the manner described above with a
pcDNA3-OXR2-FLAG plasmid was obtained from Dr. Volkert’s lab. This strain was induced
in the same manner described above. The only exception in this case was that strain MV3594
was not used as a control.
28
RESULTS
HIS-TAGGING OXR2
The initial purpose of this project was to design, construct, and express in E. coli a
plasmid containing a gene for human OXR2 fused with a His-tag.
Creation of Plasmid Encoding His-Tagged OXR2
A PCR product was created using primers 329 and 330, and plasmid pMV1200 as
template, which encodes the wild type version of human OXR2. These primers were designed to
produce DNA encoding the carboxyl-terminal end of the OXR2 protein with the addition of six
histidine residues, a stop codon, and a HinDIII site (See Figure 9). In order to produce a full
length, His-tagged form of OXR2, pMV1200 (which contains full length OXR2) was digested
with HinDIII and PstI, and the smaller fragment was replaced with the PCR product that had also
been digested by HinDIII and PstI. The product was a full length OXR2-his6 in a pTrc vector
(See Figure 9).
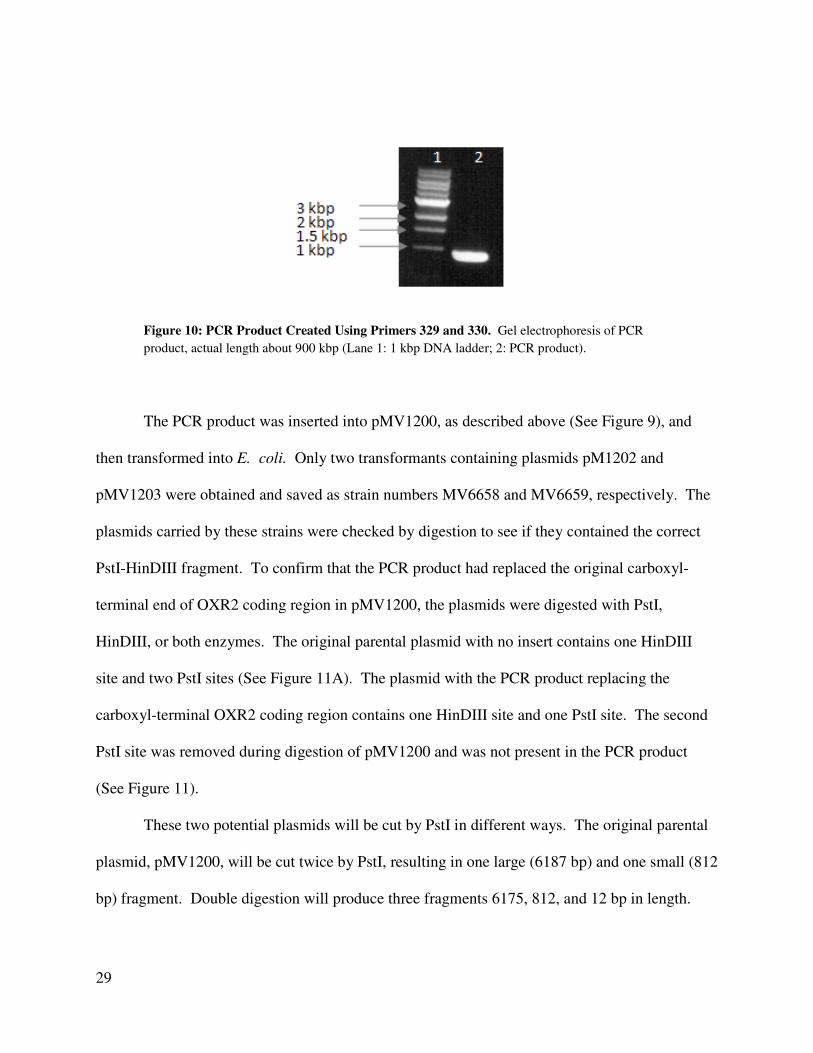
The predicted PCR product is 891 bp in length. The PCR reaction was analyzed by gel
electrophoresis (See Figure 10). The results of this gel demonstrate that the PCR product
obtained was approximately the correct size, and in great enough quantity to continue the cloning
process (lane 2, Figure 10). Sequencing of the PCR product was performed by Sequegen, using
overlapping primers reading outward from the center of the PCR product and found to be correct
(data not shown).
29
Figure 10: PCR Product Created Using Primers 329 and 330. Gel electrophoresis of PCR
product, actual length about 900 kbp (Lane 1: 1 kbp DNA ladder; 2: PCR product).
The PCR product was inserted into pMV1200, as described above (See Figure 9), and
then transformed into E. coli. Only two transformants containing plasmids pM1202 and
pMV1203 were obtained and saved as strain numbers MV6658 and MV6659, respectively. The
plasmids carried by these strains were checked by digestion to see if they contained the correct
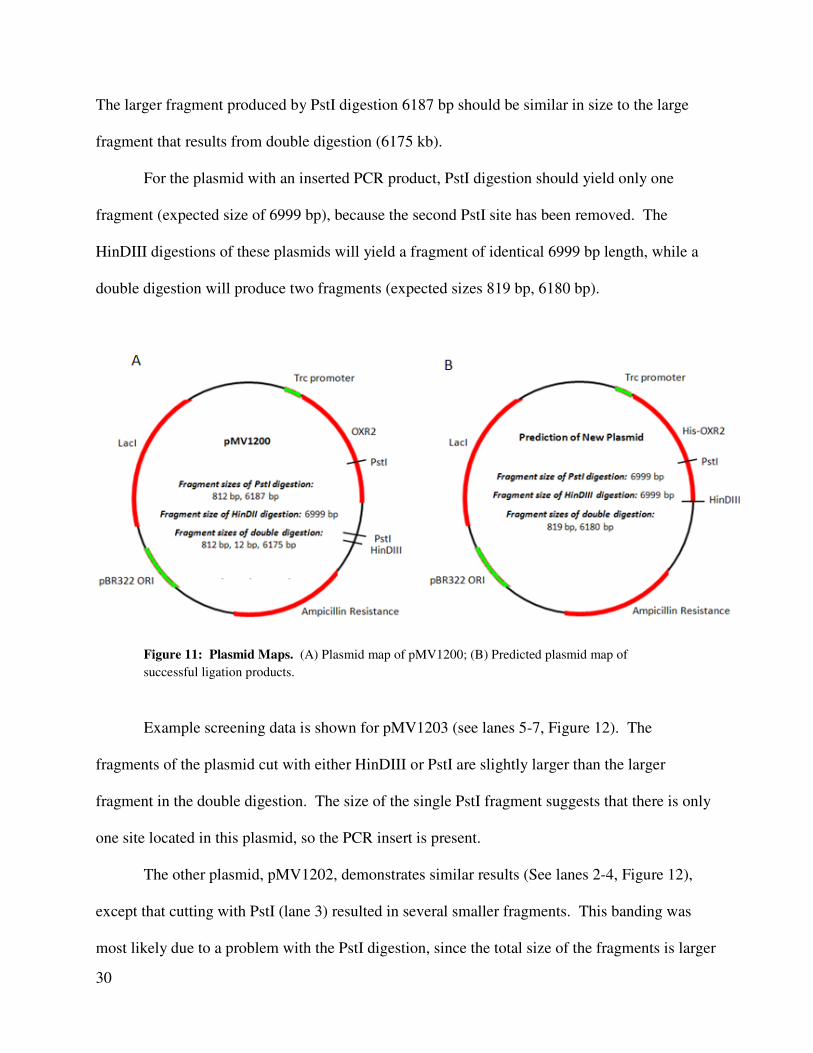
PstI-HinDIII fragment. To confirm that the PCR product had replaced the original carboxyl-
terminal end of OXR2 coding region in pMV1200, the plasmids were digested with PstI,
HinDIII, or both enzymes. The original parental plasmid with no insert contains one HinDIII
site and two PstI sites (See Figure 11A). The plasmid with the PCR product replacing the
carboxyl-terminal OXR2 coding region contains one HinDIII site and one PstI site. The second
PstI site was removed during digestion of pMV1200 and was not present in the PCR product
(See Figure 11).
These two potential plasmids will be cut by PstI in different ways. The original parental
plasmid, pMV1200, will be cut twice by PstI, resulting in one large (6187 bp) and one small (812
bp) fragment. Double digestion will produce three fragments 6175, 812, and 12 bp in length.
30
The larger fragment produced by PstI digestion 6187 bp should be similar in size to the large
fragment that results from double digestion (6175 kb).
For the plasmid with an inserted PCR product, PstI digestion should yield only one
fragment (expected size of 6999 bp), because the second PstI site has been removed. The
HinDIII digestions of these plasmids will yield a fragment of identical 6999 bp length, while a
double digestion will produce two fragments (expected sizes 819 bp, 6180 bp).
Figure 11: Plasmid Maps. (A) Plasmid map of pMV1200; (B) Predicted plasmid map of
successful ligation products.
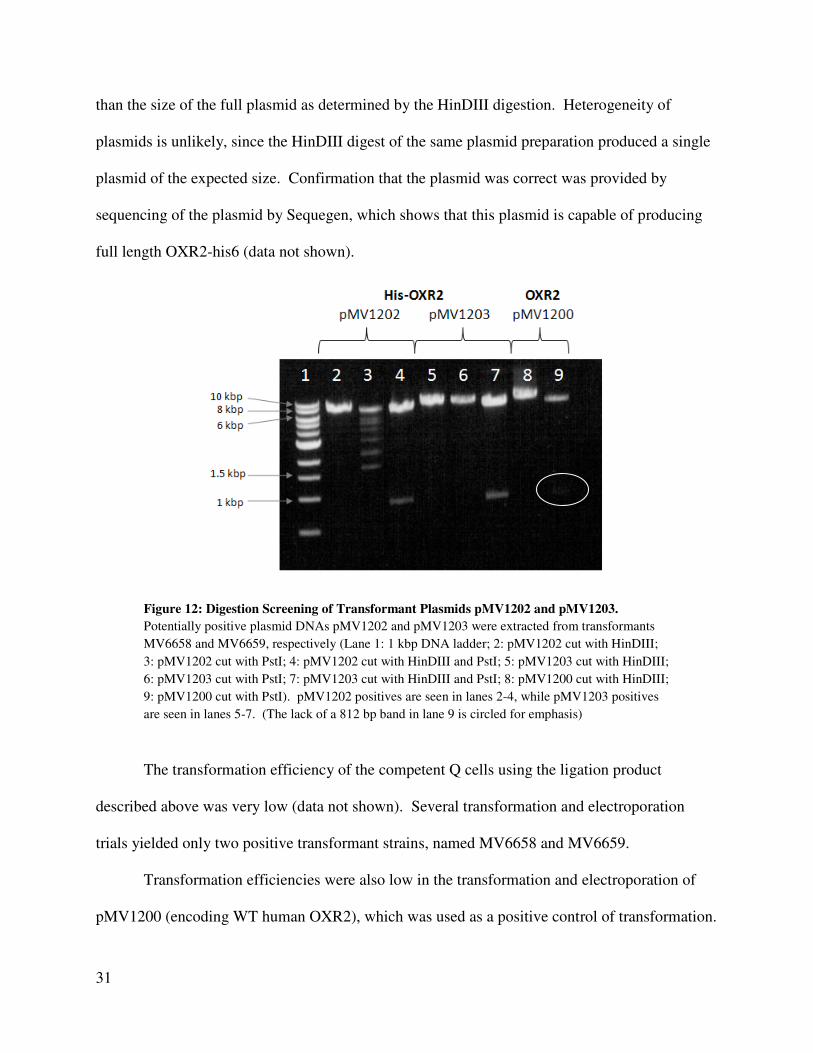
Example screening data is shown for pMV1203 (see lanes 5-7, Figure 12). The
fragments of the plasmid cut with either HinDIII or PstI are slightly larger than the larger
fragment in the double digestion. The size of the single PstI fragment suggests that there is only
one site located in this plasmid, so the PCR insert is present.
The other plasmid, pMV1202, demonstrates similar results (See lanes 2-4, Figure 12),
except that cutting with PstI (lane 3) resulted in several smaller fragments. This banding was
most likely due to a problem with the PstI digestion, since the total size of the fragments is larger
31
than the size of the full plasmid as determined by the HinDIII digestion. Heterogeneity of
plasmids is unlikely, since the HinDIII digest of the same plasmid preparation produced a single
plasmid of the expected size. Confirmation that the plasmid was correct was provided by
sequencing of the plasmid by Sequegen, which shows that this plasmid is capable of producing
full length OXR2-his6 (data not shown).
Figure 12: Digestion Screening of Transformant Plasmids pMV1202 and pMV1203.
Potentially positive plasmid DNAs pMV1202 and pMV1203 were extracted from transformants
MV6658 and MV6659, respectively (Lane 1: 1 kbp DNA ladder; 2: pMV1202 cut with HinDIII;
3: pMV1202 cut with PstI; 4: pMV1202 cut with HinDIII and PstI; 5: pMV1203 cut with HinDIII;
6: pMV1203 cut with PstI; 7: pMV1203 cut with HinDIII and PstI; 8: pMV1200 cut with HinDIII;
9: pMV1200 cut with PstI). pMV1202 positives are seen in lanes 2-4, while pMV1203 positives
are seen in lanes 5-7. (The lack of a 812 bp band in lane 9 is circled for emphasis)
The transformation efficiency of the competent Q cells using the ligation product
described above was very low (data not shown). Several transformation and electroporation
trials yielded only two positive transformant strains, named MV6658 and MV6659.
Transformation efficiencies were also low in the transformation and electroporation of
pMV1200 (encoding WT human OXR2), which was used as a positive control of transformation.
32
It is possible that this poor transformation efficiency was due to a strong selection against the
wild type plasmid in the cell. To test this, pMV1200 and ligation product were transformed into
competent Q cells and grown at 30°C overnight instead of 37°C. These conditions improve
results when transforming cells with plasmids that encode toxic proteins. The transformation
efficiency of this transformation was much greater than the other transformations (data not
shown), supporting the hypothesis of a selection against the wild type plasmid. In addition, a
pTrc99A vector control plasmid was also used in this transformation. This plasmid does not
express OXR2, and should not be as toxic to the cells. The transformation efficiency using this
plasmid was much higher than the efficiency when using the ligation product. This also supports
the claim of selection against the OXR2-expressing plasmid. Due to time constraints, these
pTrc/OXR2-his6 plasmids were not used in subsequent induction experiments in this project, but
were donated to Dr. Volkert’s laboratory for use in future experiments.
Induction of His-Tagged OXR2
The cloned OXR2-his6 was expressed in E. coli. Because OXR2-his6 was cloned into a
vector just downstream of a Trc promoter that is controlled by a lacI operator site, the gene was
induced with IPTG. When using strain MV6659, no protein bound the His-antibody used in the
Western blotting (data not shown). Sequencing by Sequegen determined that this was due to a
point mutation in the His-tag (data not shown). Thus no further experiments were performed
with strain MV6659, and instead strain MV6658 was used in the induction and purification
experiments.
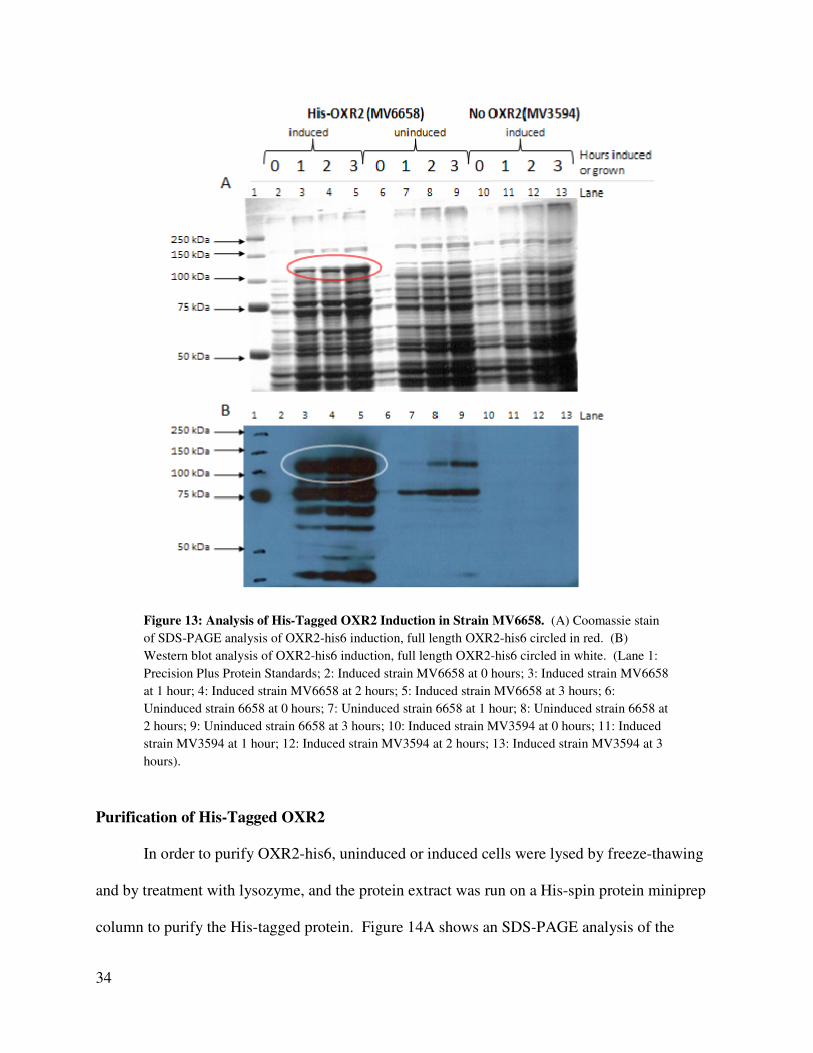
The induction of MV6658 was analyzed by Coomassie stained SDS-PAGE and Western
blot (See Figure 13). Lanes 2 - 5 of the SDS-PAGE (Figure 13A) show cell extracts from IPTG-
33
induced MV6658 at 0, 1, 2, and 3 hours, respectively. A clear increase of a band at
approximately the 106.9 kDa can be seen in these rows. This is the expected size of OXR2-his6.
This increase is seen to be weaker in rows 6 – 9 containing protein extract from uninduced
MV6658 at 0, 1, 2, and 3 hours, and is absent in rows 10 – 13 containing protein extract from
IPTG induced MV3594 (no OXR2). Several other lower molecular weight bands also show an
increase in the induced MV6658, but not in induced MV3594 (no OXR2), or in uninduced
MV6658. These bands are located at slightly greater than 75 kDa and slightly less than 75 kDa.
A Western blot was performed (Figure 13B) to determine whether the induced bands of
interest from Figure 13A had an intact His-tag. A band at about 106.9 kDa, presumably
representing full-length OXR2-his6 is seen in the induced cells (Lanes 2-5, Figure 13B). These
bands are weaker in uninduced cells (Lanes 6-9, Figure 13B) and absent in the induced vector
control (Lanes 10-13, Figure 13B). There are also several smaller proteins that contain a His-tag
in induced MV6658 and in uninduced MV6658 that are not found in the parent strain MV3594.
These smaller proteins may be degradation products of OXR2-his6.
34
Figure 13: Analysis of His-Tagged OXR2 Induction in Strain MV6658. (A) Coomassie stain
of SDS-PAGE analysis of OXR2-his6 induction, full length OXR2-his6 circled in red. (B)
Western blot analysis of OXR2-his6 induction, full length OXR2-his6 circled in white. (Lane 1:
Precision Plus Protein Standards; 2: Induced strain MV6658 at 0 hours; 3: Induced strain MV6658
at 1 hour; 4: Induced strain MV6658 at 2 hours; 5: Induced strain MV6658 at 3 hours; 6:
Uninduced strain 6658 at 0 hours; 7: Uninduced strain 6658 at 1 hour; 8: Uninduced strain 6658 at
2 hours; 9: Uninduced strain 6658 at 3 hours; 10: Induced strain MV3594 at 0 hours; 11: Induced
strain MV3594 at 1 hour; 12: Induced strain MV3594 at 2 hours; 13: Induced strain MV3594 at 3
hours).
Purification of His-Tagged OXR2
In order to purify OXR2-his6, uninduced or induced cells were lysed by freeze-thawing
and by treatment with lysozyme, and the protein extract was run on a His-spin protein miniprep
column to purify the His-tagged protein. Figure 14A shows an SDS-PAGE analysis of the
35
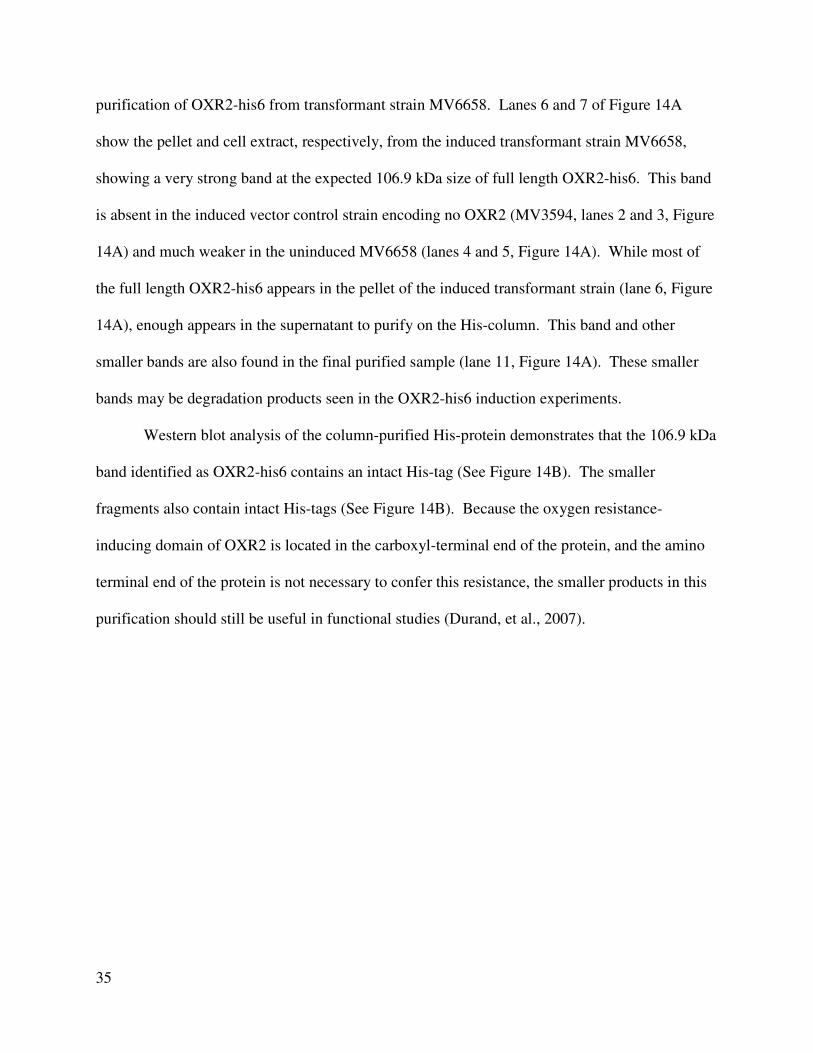
purification of OXR2-his6 from transformant strain MV6658. Lanes 6 and 7 of Figure 14A
show the pellet and cell extract, respectively, from the induced transformant strain MV6658,
showing a very strong band at the expected 106.9 kDa size of full length OXR2-his6. This band
is absent in the induced vector control strain encoding no OXR2 (MV3594, lanes 2 and 3, Figure
14A) and much weaker in the uninduced MV6658 (lanes 4 and 5, Figure 14A). While most of
the full length OXR2-his6 appears in the pellet of the induced transformant strain (lane 6, Figure
14A), enough appears in the supernatant to purify on the His-column. This band and other
smaller bands are also found in the final purified sample (lane 11, Figure 14A). These smaller
bands may be degradation products seen in the OXR2-his6 induction experiments.
Western blot analysis of the column-purified His-protein demonstrates that the 106.9 kDa
band identified as OXR2-his6 contains an intact His-tag (See Figure 14B). The smaller
fragments also contain intact His-tags (See Figure 14B). Because the oxygen resistance-
inducing domain of OXR2 is located in the carboxyl-terminal end of the protein, and the amino
terminal end of the protein is not necessary to confer this resistance, the smaller products in this
purification should still be useful in functional studies (Durand, et al., 2007).
36
Figure 14: Analysis of His-Tagged OXR2 Purification in Strain MV6658. (A) Coomassie
stain of SDS-PAGE analysis of OXR2-his6 purification, full length OXR2-his6 circled in red. (B)
Western blot analysis of OXR2-his6 purification, full length OXR2-his6 circled in white. (Lane 1:
Precision Plus Protein Standards; 2: Induced MV3594 pellet; 3: Induced MV3594 supernatant; 4:
Uninduced MV6658 pellet; 5: Uninduced MV6658 supernatant; 6: Induced MV6658 pellet; 7:
Induced MV6658 supernatant; 8: His-spin protein miniprep flow-through; 9: His-spin protein
miniprep wash 1; 10: His-spin protein miniprep wash 2; 11: His-spin protein miniprep purified
protein).
FLAG-TAGGING OXR2
A secondary goal of this project was to also express FLAG-tagged OXR2. This tagged
protein would be especially useful for metal-binding studies, since the His portion of OXR2-his6
would directly bind metals. An inducible E. coli strain (MV6660) for producing this protein
was previously constructed.
37
Induction of FLAG-Tagged OXR2
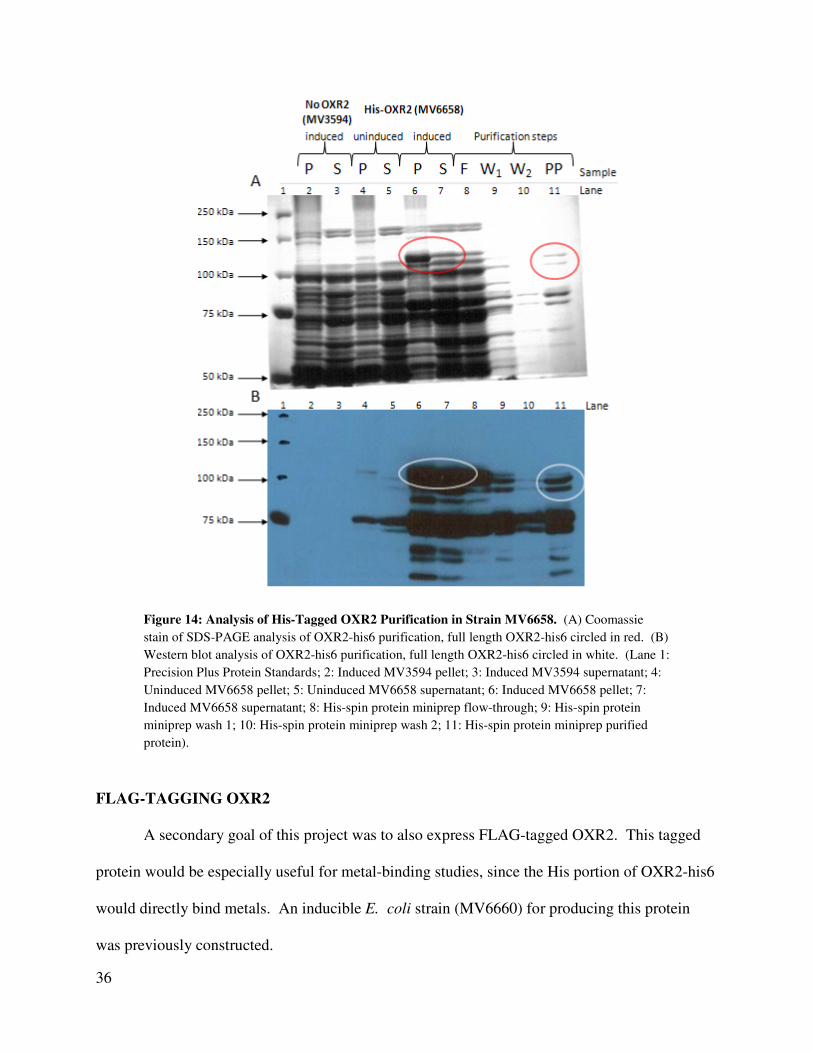
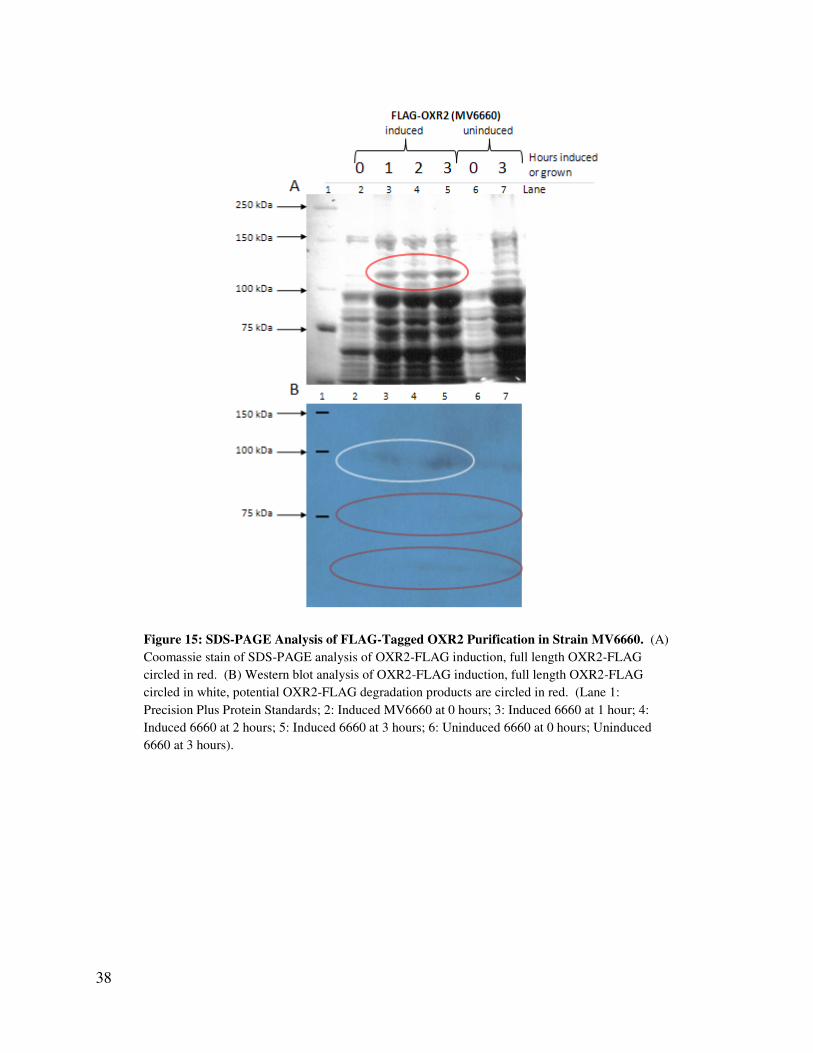
The results of the induction of the OXR2-FLAG (Figure 15) were similar to those of the
OXR2-his6 induction. A band at the 106.9 kDa expected length of full length OXR2 is found in
the SDS-PAGE analysis of induced strain MV6660 (Lanes 2-5, Figure 15A) that is weaker in the
uninduced MV6660 (Lanes 6 and 7, Figure 15A). Unlike in the OXR2-his6 induction, no
smaller bands are noticeable that are darker in the induced relative to the uninduced. Thus, full
length OXR2-FLAG appears to be induced.
The Western blot analysis (Figure 15B) also supports this finding. A clear band of
FLAG-tagged protein is found in greater quantity in the induced strain than in the uninduced
strain. The marker bands in the first lane of this gel were very light, and after transfer, were also
difficult to read, so this may explain the slight discrepancy between the sizes in the Western blot
versus the SDS-PAGE gel. Two, very faint, smaller bands are also present on the Western blot
(circled for emphasis in Figure 15B). These bands were easily observed in the original film from
this Western blot, but are difficult to see in the reproduction of the film in this paper. These
bands may be degradation product of OXR2-FLAG. They are not readily visible in the SDS-
PAGE analysis, as the OXR2-his6 fragments were, so they are present in far less quantity. Thus,
OXR2-FLAG may be more stable in the cell than OXR2-his6.
38
Figure 15: SDS-PAGE Analysis of FLAG-Tagged OXR2 Purification in Strain MV6660. (A)
Coomassie stain of SDS-PAGE analysis of OXR2-FLAG induction, full length OXR2-FLAG
circled in red. (B) Western blot analysis of OXR2-FLAG induction, full length OXR2-FLAG
circled in white, potential OXR2-FLAG degradation products are circled in red. (Lane 1:
Precision Plus Protein Standards; 2: Induced MV6660 at 0 hours; 3: Induced 6660 at 1 hour; 4:
Induced 6660 at 2 hours; 5: Induced 6660 at 3 hours; 6: Uninduced 6660 at 0 hours; Uninduced
6660 at 3 hours).
39
DISCUSSION
HIS-TAGGING OXR2
The main goal of this project was to tag human OXR2 to assist its purification to allow
subsequent functional studies. This goal was accomplished, as a His-tagging and purification
system was used to purify OXR2. The data showed a band of the 106.9 kDa expected size of full
length human OXR2 strongly induced by IPTG by 3 hrs post-induction. The band was clearly
visible on Coomassie stained SDS-PAGE and His-immunoblot analyses of cell lysates, in the
pellet fraction of induced cells, and in the final purified supernatant. However, full length OXR2
was not the only, or even the major product purified. The two major products of the purification
were slightly larger than 75 kDa and slightly smaller than 75 kDa. These proteins were found in
the induced transformant strain, but not in the vector control strain (See Figures 13 and 14),
which suggests that these are fragments of OXR2-his6. And since they are recognized by the
anti-His antibody, they contain the His-tag, and must represent fragments of the in-frame
carboxyl-terminal end of the protein.
Previous studies have determined that a fragment of OXR2 extending from amino acids
657 – 942 (a 34.06 kDa fragment of the protein) is sufficient to protect a cell from oxidative
damage (Durand, et al., 2007). The fragments in the His purification in this project, are larger
than this minimum functional requirement, which suggests the major products of the His
purification process should be functional.
Sequencing of the OXR2-his6 containing plasmid pMV1202 demonstrated that the
plasmid is capable of producing a full length OXR2-his6 (data not shown). The mixture of full
length and truncated His-tagged OXR2 fragments in the final purification and induction could be
explained in several ways. One likely explanation is that the full length protein is being partially
40
degraded in E. coli or by proteases after cell lysis during cell extract preparation. This would
explain why the His-tag is still in frame in these protein fragments. Another possible explanation
for the fragmented product is that when the transformant strain MV6658 is grown and induced,
there is a strong selection against the plasmid encoding full length protein. The selection would
not support maintenance of the plasmid in the cell, and mutations would accumulate, leading to a
mixture of mutated plasmids in the strain and a mixture of protein products in the cell that
initiate translation at methionine codons that are in frame with the His-tag. A topic for future
research should include determining which of these two scenarios, if either, is responsible for the
smaller protein fragments during induction. But overall, the His-Tag purification yielded several
OXR2 species that can be used in future studies.
FLAG-TAGGING OXR2
The second goal of this project was to produce a FLAG-tagged OXR2 as an alternative
source of OXR2 for metal binding assays, since the His portion of OXR2-his6 would directly
bind metals. This OXR2-FLAG strain of E. coli was obtained from Myles Brown and
coworkers (Durand, et al., 2007), and in this project produced a full length product with minimal
degradation.
TOPICS FOR FUTURE STUDIES
There is much to learn about OXR2. The tagged OXR2 purified in this project can now
be used to perform biochemical and functional studies. For example, an OXR2-FLAG molecule
could be used to study OXR2’s metal binding properties. The growth of yeast strains containing
OXR1, which is homologous to human OXR2, is enhanced by the addition of metal ions (Anita
41
Fenton, personal communication). An OXR2-his6 could be used to find other types of cofactors,
such as flavin, that are required for OXR2 function. Both tagged proteins can be used in other
structural and functional studies of OXR2. A greater knowledge of the mechanism of oxidative
protection of OXR2 could lead to greater insight into prevention of human disorders caused by
oxidative cell damage.
42
WORKS CITED
Arnau, J., Lauritzen, C., Petersen, G., & Pedersen, J. (2006). Current strategies for the use of
affinity tags and tag removal for the purification of recombinant proteins. Protein Expr.
Purif. , 48, 1-13.
Benov, L. (2001). How superoxide damages the cell. Protoplasma , 217, 33-36.
Carlioz, A., & Touati, D. (1986). Isolation of superoxide dismutase mutants in escerichia coli: Is
superoxide dismutase necessary for aerobic life? EMBO J. , 5 (3), 623-630.
Catalá, A. (2009). Lipid peroxidation of membrane phospholipids generates hydroxy-alkenals
and oxidized phospholipids active in physiological and/or pathological conditions. Chem.
Phys. Lipids , 157, 1-11.
Croteau, D. L., & Bohr, V. A. (1997). Repair of oxidative damage to nulcear and mitochondrial
DNA in mammalian cells. J. Biol. Chem. , 272 (41), 25409-25412.
de Laat, W., Jaspers, N., & Hoeijmakers, J. (1999). Molecuar mechnisms of nucleotide excision
repair. Genes Dev. , 13, 768-785.
Dröse, S., & Brandt, U. (2008). The mechanism of mitochondrial superoxide production by the
cytochrome bc1 complex. J. Biol. Chem. , 283 (31), 21649-21654.
Durand, M., Kolpak, A., Farrell, T., Elliott, N., Shoa, W., Brown, M., et al. (2007). The OXR
domani defines a conserved family of eukaryotic oxidation resistance proteins. BMC Cell
Biol. , 8 (13).
Elliott, N., & Volkert, M. (2004). Stress induction and mitochondrial localization of Oxr1
proteins in yeast and humans. Mol. Cell. Biol. , 24 (8), 3180-3187.
Esterházy, D., King, M., Yakovlev, G., & Hirst, J. (2008). Production of Reactive Oxygen
Species by Complex I (NADH:Ubiquinone Oxidoreductase) from Escherichia coli and
Comparison to the Enzyme from Mitochondria. Biochemistry , 47 (12), 3964-3971.
Fang, Y., Yang, S., & Wu, G. (2002). Free Radicals, Antioxidants, and Nutrition. Nutrition , 18
(10), 872-879.
Flint, D., Tuminello, J., & Emptage, M. (1993). The Inactivation of Fe-S Cluster Containing
Hydro-lases by Superoxide. J. Biol. Chem. , 268 (30), 22369-22376.
43
Griffiths, S., King, J., & Cooney, C. (2002). The Reactivity and Oxidation Pathway of Cysteine
232 in Recombinant Human α1-Antitrypsin. J. Biol. Chem. , 277 (28), 25486-25492.
Imlay, J. (2003). Pathways of oxidative damage. Annu. Rev. Microbiol. , 57, 394-418.
Lebovitz, R., Zhang, H., Vogel, H., Cartwright, J., Dionne, L., Lu, N., et al. (1996).
Neurodegeneration, myocardial injury, and perinatal death in mitochondrial superoxide
dismutase-deficient mice. Proc. Natl. Acad. Sci. USA , 93, 9782-9787.
Liu, Y., Fiskum, G., & Schubert, D. (2002). Generation of reactive oxygen species by
mitochondrial eletron transport chain. J. Neurochem. , 80, 780-787.
Lu, A., Li, X., Gu, Y., Wright, P., & Chang, D. (2001). Repair of oxidative damage mechanisms
and functions. Cell Biochem Biophys , 35, 141-170.
Marnett, L. (1999). Lipid Peroxidation - DNA damage by malondialdehyde. Mutat. Res. , 424,
83-95.
Marnett, L. (2000). Oxyradicals and DNA damage. Carcinogenesis , 21 (3), 361-370.
Russo, M., De Luca, G., Degan, P., & Bignami, M. (2007). Different DNA repair strategies to
combat the threat from 8-oxoguanine. Mut. Res. , 614, 69-76.
Shen, H., Tsuchida, S., Tamai, K., & Sato, K. (1993). Identification of Cysteine Residues
Involved in Disufide Formation in the Activation od Glutathione Transferase P-form by
Hydrogen Peroxide. Arch. Biochem. Biophys. , 300 (1), 137-141.
Slupphaug, G., Kavli, B., & Krokan, H. (2003). The interacting pathways for prevention and
repair of oxidative DNA damage. Mut. Res. , 531, 231-251.
Turrens, J., & Boveris, A. (1980). Generation of superoxide anion by the NADH dehydrogenase
of bovine heart mitochondria. Biochem. J. , 191, 421-427.
Volkert, M., Elliott, N., & Housman, D. (2000). Functional genomics reveals a family of
eukaryotic oxidation protection genes. Proc. Natl. Acad. Sci. U.S.A. , 97 (26), 14530-
14535.
Waugh, D. (2005). Making the most of affinity tags. Trends Biotechnol. , 23 (6), 316-320.
Wiederhold, L., Leppard, J., Kedar, P., Karimi-Busheri, F., Rasouli-Nia, A., Weinfeld, M., et al.
(2004). AP Endonuclease-Independant DNA Base Excision Repair in Human Cells.
Mol.Cell , 15, 209-220.
44
Wood, R. (1997). Nucleotide excision repair in mammalian cells. J. Biol. Chem. , 272 (38),
23465-23468.
Recommended