Journal of Env. Geogr. Vol. III. No. 1-4. pp. 31-40
CREATING EXCESS WATER INUNDATION MAPS BY SUB-PIXEL CLASSIFICATION OF
MEDIUM RESOLUTION SATELLITE IMAGES
Mucsi, L.1 – Henits, L.
1
1Department of Physical Geography and Geoinformatics, University of Szeged, Hungary
Abstract
Excess water frequency factor, which indicates the number of inunda-
tions in the area under study within a certain period of time, is the most
dynamic variable among the parameters applied in the complex meth-odology of excess water hazard mapping. Creating excess water inun-
dation maps, representing the situation in the most realistic way, was
hitherto a critical moment in excess water hazard mapping. Instead of
field measurements, since the database of Landsat satellite images
became accessible in 2009, it is possible to process satellite images
taken from the year 1985, with using new, non-traditional methods different from the pixel-based classification. These methods are mainly
sub-pixel based classifications and they are applied principally on
images taken in periods of extended excess water inundation, under clear weather conditions. In our research project, medium-scale map-
ping was supported principally by hand-held or mounted multispectral
(the bands of visible and infrared light) digital aerial photography. The photo-taking process, depending on the actual meteorological condi-
tions, can be flexibly accomplished in the most extended inundation
period, thus it is possible to create excess water maps at the scale of 1:10000.
INTRODUCTION
Excess water frequency factor, which indicates the num-
ber of inundations in the area under study within a cer-
tain period of time, is the most dynamic variable among
the parameters applied in the complex methodology of
excess water hazard mapping (Pálfai et al., 2004). Creat-
ing excess water inundation maps, representing the situa-
tion in the most realistic way, was hitherto a critical
moment in excess water hazard mapping, since the crea-
tion of an excess water map via traditional methods and
field survey is time-consuming and contains several
possibilities for committing errors (Licskó B., 2009).
One of the major problems regarding field mapping is
that the determination of the shape of an extended excess
water area is uncertain from a close-to-surface point,
owing to the low angle of vision. It is also difficult to
determine the extension of the patches by walking round
their boundary using kinematic GPS. This method gives
particularly indefinite results, because there is a continu-
ous transition between the open water surface, the slight-
ly saturated soil and the dry soil, therefore their classifi-
cation is problematic.
While mapping excess water inundation, efforts
should be made to cover a large area, and to create large-
scale thematic maps in a cost effective way. This way,
not only the open water surfaces, but also the transitional
areas could be mapped. Large-scale mapping is support-
ed principally by hand-held or mounted multispectral
(the bands of visible and infrared light) digital aerial
photography. The photo-taking process, depending on
the actual meteorological conditions, can be flexibly
accomplished in the most extended inundation period,
thus it is possible to create excess water maps at the
scale of 1:10000 (Licskó B., 2009). However, the survey
of vast areas is expensive and requires considerable post-
processing.
The mapping of excess water inundation is more
economical if the inundation map derives from remote
sensing data covering vast areas. Excess water inunda-
tion maps based on satellite images have been created by
the Institute of Geodesy, Cartography and Remote Sens-
ing (FÖMI) since 1998. A significant number of maps
were created in the years 1999 and 2000, when the inun-
dation was very extended (Csornai G. et al., 2000). By
means of 0.1 ha resolution thematic excess water maps
derived from high-resolution satellite images, not only
the open excess water surfaces could be detected and
delineated, but also the vegetation in water and the high-
ly saturated soil, which is very destructive to agricultural
cultivation. During the pixel-based classification of sat-
ellite images taken by the sensors of the applied SPOT,
Landsat and IRS-1C/1D LISS-III satellites, the determi-
nation of the sample areas might run into difficulties as
the great number of the spectrally heterogeneous pixels
might cause inaccuracy concerning the classification of
the transitional areas.
In case of satellites revolving in a Sun-synchronous
orbit, optical satellite images are taken at a well-
determined point in time, however, in these spectral
bands cloud cover frequently inhibits image-taking.
Thus, the images of microwave imaging sensors (ENVI-
SAT, MERIS, ASAR, RADARSAT and ERS) are effec-
tively applicable for flood and excess water mapping, as
well as in operative works (Csekő Á., 2003). However,
by excess water maps based on radar data only the open
water surfaces and the saturated soil areas could be de-
lineated. Regarding the images of the year 2000, the
radar data by themselves were limitedly suitable for
high-resolution excess water mapping, however, they
complete the data derived from the optical systems well.
Since the Landsat image database became accessi-
ble in 2009, it is possible to process satellite images
taken from the year 1985, with using new, non-
traditional methods different from the pixel-based classi-
32 Mucsi, L. – Henits, L. JOEG III/1-4
fication. These methods are mainly sub-pixel based clas-
sifications and they are applied principally on images
taken in periods of extended excess water inundation,
under clear weather conditions.
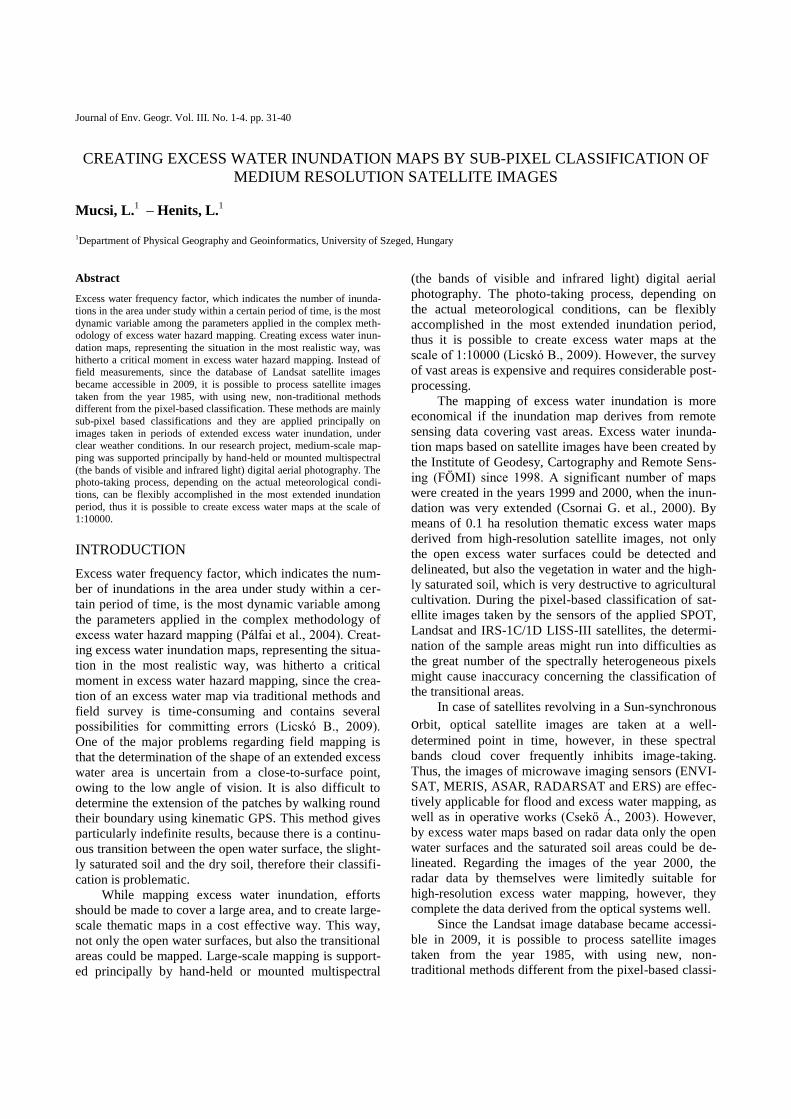
THE STUDY AREA
The area under study is situated in the south-eastern part
of the Great Hungarian Plain, in the vicinity of the set-
tlement Székkutas. Regarding land use, it is character-
ized by agricultural lands and protected areas belonging
to the Körös-Maros National Park. The designated study
area is 86 km2 and is on the boundary of Csongrád and
Békés counties. In terms of excess water hazard, it be-
longs to the ‘medium hazard’ category (Pálfai I. et al.,
2004). The relief differences are minimal; the elevation
values are between 81 m and 89 m.
DATA APPLIED AND THEIR PREPARATION
FOR PROCESSING
During the survey, two years characterised by excess
water inundation were chosen and one image taken in
each year respectively have been analysed. Excess water
inundation was considerable in the year 1986, while it
was extreme in the year 2000 (Pálfai I., 2006). In these
two years satellite images taken in early spring and early
summer were selected, which were not disturbed by
clouds. The time of the image-taking was as near to the
period of the largest excess water inundation as possible.
Data were downloaded from the web database
(http://glovis.usgs.gov) of the U. S. Geological Survey
(USGS). The area under study was also covered by the
medium resolution images of the satellites Landsat-5 and
Landsat-7, the catalogue numbers of which are 186/028
and 187/028. Thus, more images of the area became
available and their time resolution was not only 16 days,
but also 7 and 9 days.
A Landsat-5 TM image (row 187/coloumn 28) tak-
en on 16th
April 1986 and a Landsat-7 ETM+ image (row
186/coloumn 28) taken on 23rd
April 2000 were selected,
both of which were transformed to UTM projection
system (WGS 84, zone 34).
Via atmospheric correction, the intensity values of
the Landsat-5 TM and Landsat-7 ETM+ were trans-
formed to reflectance values using an ERDAS IMAG-
INE model (Chavez P. S., 1996; Chander G.-Markham
B. L., 2003).
To carry out accuracy estimation, the one-meter
resolution colour infrared aerial photographs taken on
23rd
April 2000 were available as reference data. In addi-
tion the digital database provided by the field survey of
the Directorate for Environmental Protection and Water
Management of Lower Tisza District (ATIKÖVIZIG)
was also applied, which includes the patches of excess
water in the inundated areas for the years characterized
by inundation.
METHODS
Spectral mixture analysis
The significant advantages of the medium resolution (30
m) TM and ETM+ images of Landsat satellites revolving
in a Sun-synchronous orbit are, that they are multi-
spectral images covering vast areas (185*185 km) and
they can be transformed with high accuracy to medium
scale (approx. 1:100000) land cover maps by traditional
pixel-based classification. However, their disadvantage
is, that if the reflectance features of the area change on a
greater scale in the space (the smallest elements, patches
of the landscape pattern are smaller), than the spatial
Fig. 1 The area under study
JOEG III/1-4 Creating excess water inundation maps by sub-pixel classification of medium resolution satellite images 33
resolution of the satellite image, numerous so-called
spectrally mixed pixels can be found in the image. One
of the basic problems of excess water mapping is that the
open water surfaces might be relatively small in area,
therefore these surfaces, as well as the soil surfaces in
the transitional areas and the areas covered by vegetation
are difficult to classify owing to the numerous spectrally
mixed pixels. For the classification of the spectrally
mixed pixels the so-called Spectral Mixture Analysis
method was developed (Roberts et al., 1998).
The aim of Spectral Mixture Analysis (SMA) is to
determine the spatial ratio of the spectrally homogeneous
land cover types, the so-called endmembers, within a
pixel. Each endmember specifies an unmixed, pure land
cover type. The Linear Spectral Mixture Analysis
(LSMA) is the improvement of the SMA method, by
which the ratio of land cover types can be determined by
using minimum two, in case of an LTM picture six,
endmembers. In order to be able to solve the linear sys-
tem of equations (1), the number of the endmembers has
to be less than the number of the spectral bands of the
image.
(1)
bbi
N
i
ib RfR
,
1
Rb: the reflectance value of the image in band b;
N: the number of endmembers;
fi: the ratio factor of endmember i;
Rib: the reflectance value of the ith
endmember in band b;
εb: residual error.
The sum of the ratio factors of the endmembers equals 1
in every pixel and fi ≥ 0.
(2)
11
,
n
k
kif
The suitability of the model can be determined on the
basis of the εb residual error or on the basis of the value
of the root mean square error (RMSE) for each band of
the image.
(3)
n
RMSE
n
i
i
1
2
The endmembers are usually selected from the different
bands of the satellite images or 2D scatter plots worked
out from the bands (Rashed T. et al., 2001). By Principal
Component Analysis (PCA), the endmembers are easier
to determine, since it assembles almost 90 % of the data
variance into the first two or three bands and reduces the
correlation between the bands to a minimum (Smith M.
O. et al., 1985). The other frequently applied transfor-
mation, which is also applied in this present research, is
the minimum noise fraction (MNF) method. It consists
of two main steps: (1) in the first step the noise fractions
of the database are decorrelated and rescaled on the basis
of an estimated noise covariance matrix and transformed
data is provided, in which the noise has unit variance and
there is no correlation between the bands; (2) in the se-
cond step a traditional PCA is carried out (Green A. A.
et al., 1988).
The Pixel Purity Index (PPI), that selects the spec-
trally most pure (extreme) pixels from multispectral or
hyperspectral images, was also applied to specify the
endmembers. Employing iterative methods, the PPI
creates N-dimensional spectral spaces on randomly cho-
sen unit vectors. This procedure determines the extreme
pixels (those that are at the end of the unit vector) in
each projection, and records how many times the given
pixel was specified as extreme. The value of each pixel
in the resulting image is equal to this number (Broadman
J. W. et al., 1994).
In the first step, MNF images were created for the
Landsat TM image taken on 16th
April 1986, which re-
sulted in another 6 bands. The information content of the
images is continuously decreasing after one another, thus
the first three bands contain 89.5% of the total infor-
mation content. The last bands predominantly contain
only noise. The MNF images were used as input data for
the PPI calculation, during which process the extreme
pixels were defined by the algorithm after 1000 repeti-
tion.
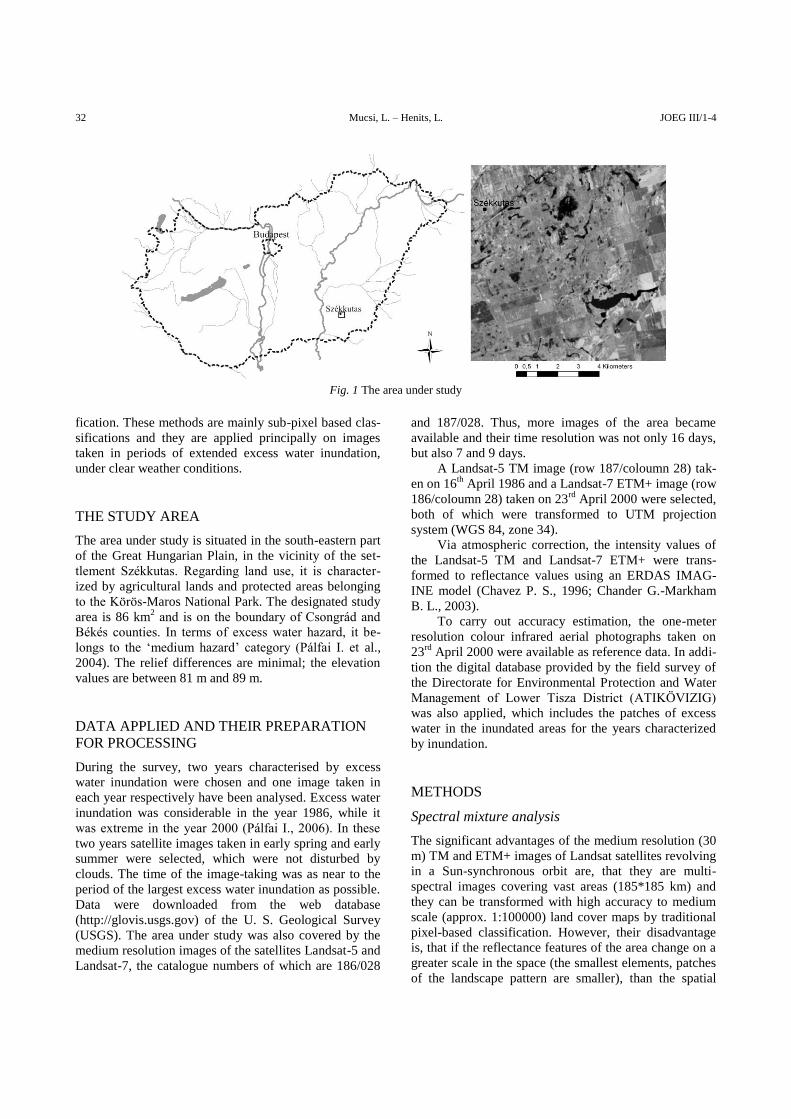
On the basis of the first three MNF images and the
resulting image of the PPI, three endmembers were de-
fined for the linear spectral mixture: (1) the water sur-
faces, (2) the vegetation, and (3) the soil. These
endmembers were pointed out in the spectral space
formed by the first three MNF-bands and were detected
at the margins and peaks of the 2D scatter plot.
Fig. 2 The reflectance curves of soil, vegetation and water
surfaces
34 Mucsi, L. – Henits, L. JOEG III/1-4
DEFINING THE LAND COVER RATIO OF THE
PIXELS
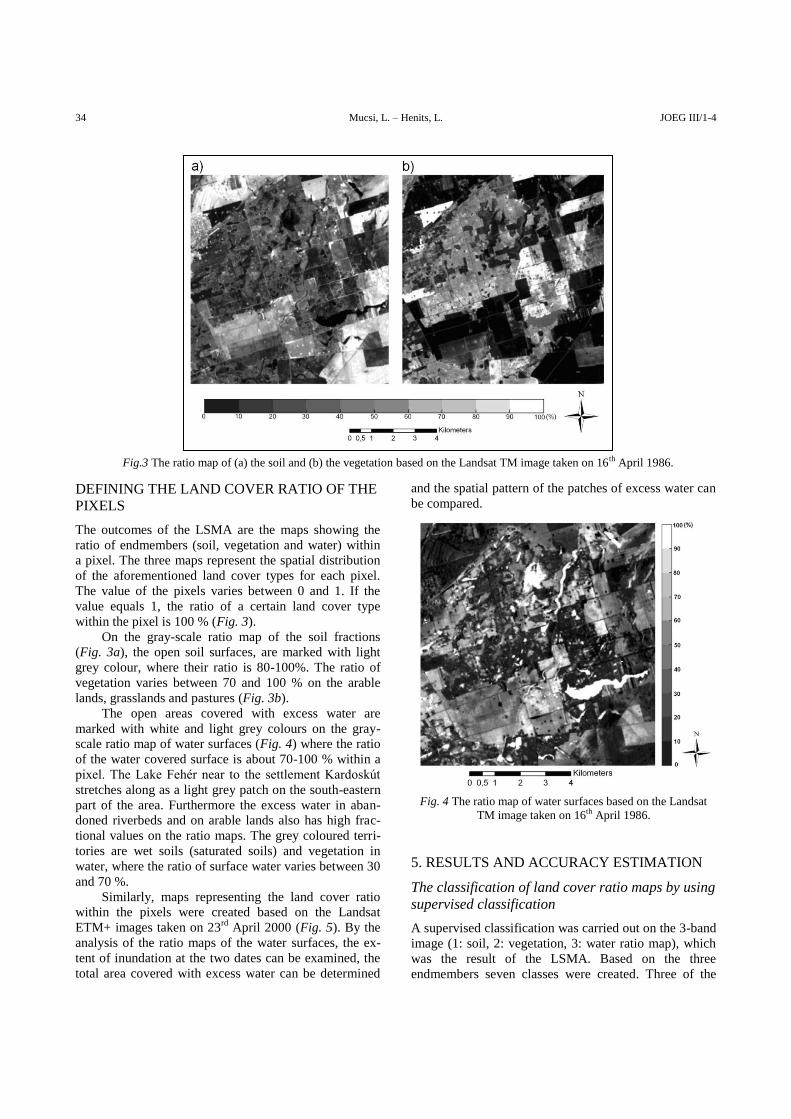
The outcomes of the LSMA are the maps showing the
ratio of endmembers (soil, vegetation and water) within
a pixel. The three maps represent the spatial distribution
of the aforementioned land cover types for each pixel.
The value of the pixels varies between 0 and 1. If the
value equals 1, the ratio of a certain land cover type
within the pixel is 100 % (Fig. 3).
On the gray-scale ratio map of the soil fractions
(Fig. 3a), the open soil surfaces, are marked with light
grey colour, where their ratio is 80-100%. The ratio of
vegetation varies between 70 and 100 % on the arable
lands, grasslands and pastures (Fig. 3b).
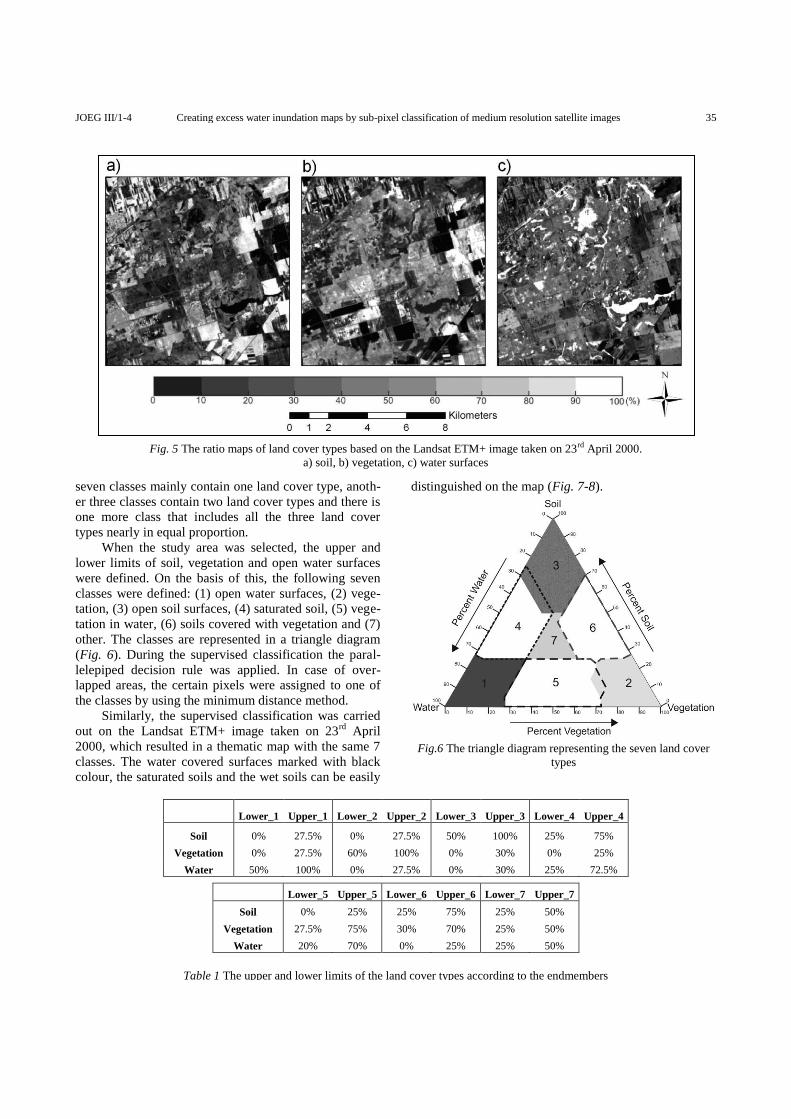
The open areas covered with excess water are
marked with white and light grey colours on the gray-
scale ratio map of water surfaces (Fig. 4) where the ratio
of the water covered surface is about 70-100 % within a
pixel. The Lake Fehér near to the settlement Kardoskút
stretches along as a light grey patch on the south-eastern
part of the area. Furthermore the excess water in aban-
doned riverbeds and on arable lands also has high frac-
tional values on the ratio maps. The grey coloured terri-
tories are wet soils (saturated soils) and vegetation in
water, where the ratio of surface water varies between 30
and 70 %.
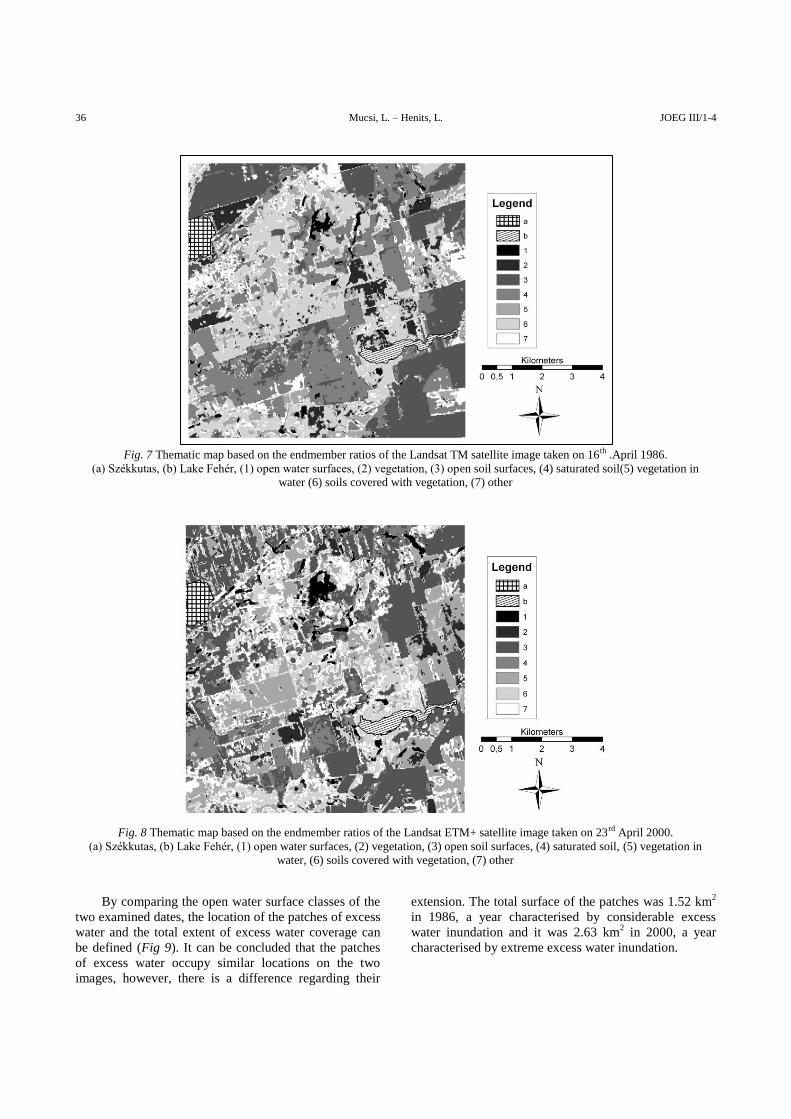
Similarly, maps representing the land cover ratio
within the pixels were created based on the Landsat
ETM+ images taken on 23rd
April 2000 (Fig. 5). By the
analysis of the ratio maps of the water surfaces, the ex-
tent of inundation at the two dates can be examined, the
total area covered with excess water can be determined
and the spatial pattern of the patches of excess water can
be compared.
Fig. 4 The ratio map of water surfaces based on the Landsat
TM image taken on 16th April 1986.
5. RESULTS AND ACCURACY ESTIMATION
The classification of land cover ratio maps by using
supervised classification
A supervised classification was carried out on the 3-band
image (1: soil, 2: vegetation, 3: water ratio map), which
was the result of the LSMA. Based on the three
endmembers seven classes were created. Three of the
Fig.3 The ratio map of (a) the soil and (b) the vegetation based on the Landsat TM image taken on 16th April 1986.
JOEG III/1-4 Creating excess water inundation maps by sub-pixel classification of medium resolution satellite images 35
seven classes mainly contain one land cover type, anoth-
er three classes contain two land cover types and there is
one more class that includes all the three land cover
types nearly in equal proportion.
When the study area was selected, the upper and
lower limits of soil, vegetation and open water surfaces
were defined. On the basis of this, the following seven
classes were defined: (1) open water surfaces, (2) vege-
tation, (3) open soil surfaces, (4) saturated soil, (5) vege-
tation in water, (6) soils covered with vegetation and (7)
other. The classes are represented in a triangle diagram
(Fig. 6). During the supervised classification the paral-
lelepiped decision rule was applied. In case of over-
lapped areas, the certain pixels were assigned to one of
the classes by using the minimum distance method.
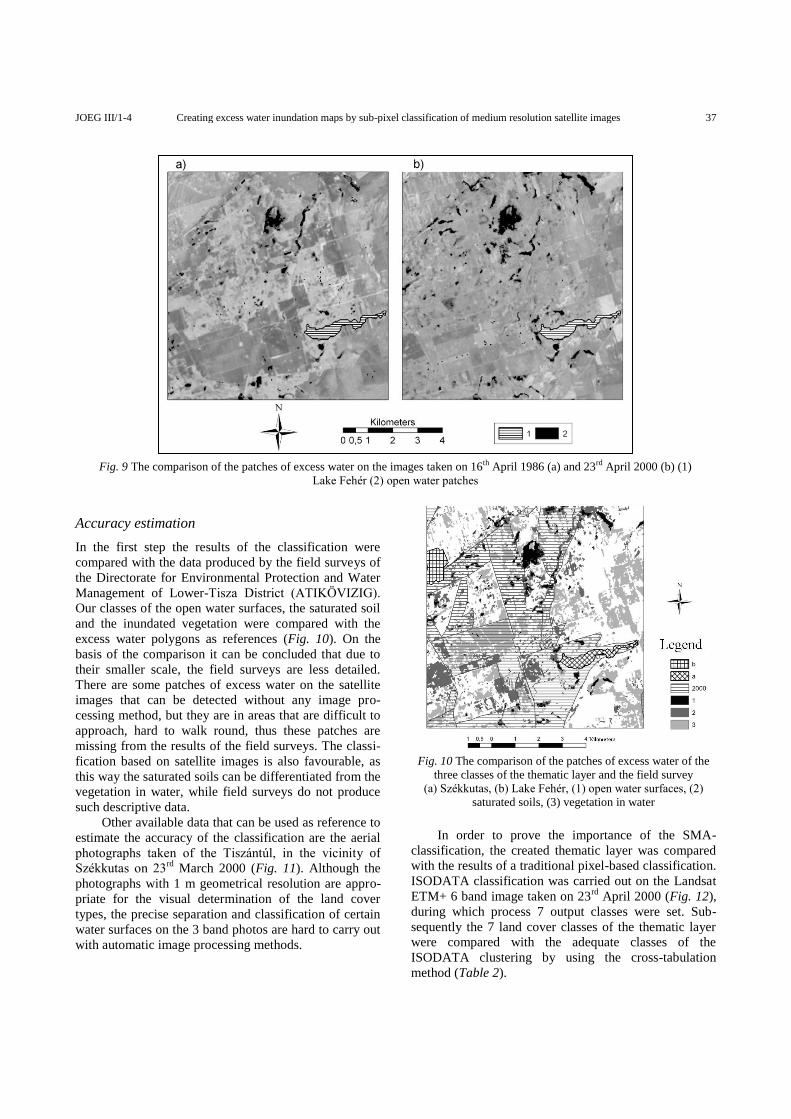
Similarly, the supervised classification was carried
out on the Landsat ETM+ image taken on 23rd
April
2000, which resulted in a thematic map with the same 7
classes. The water covered surfaces marked with black
colour, the saturated soils and the wet soils can be easily
distinguished on the map (Fig. 7-8).
Fig.6 The triangle diagram representing the seven land cover
types
Fig. 5 The ratio maps of land cover types based on the Landsat ETM+ image taken on 23rd April 2000.
a) soil, b) vegetation, c) water surfaces
Lower_1 Upper_1 Lower_2 Upper_2 Lower_3 Upper_3 Lower_4 Upper_4
Soil 0% 27.5% 0% 27.5% 50% 100% 25% 75%
Vegetation 0% 27.5% 60% 100% 0% 30% 0% 25%
Water 50% 100% 0% 27.5% 0% 30% 25% 72.5%
Lower_5 Upper_5 Lower_6 Upper_6 Lower_7 Upper_7
Soil 0% 25% 25% 75% 25% 50%
Vegetation 27.5% 75% 30% 70% 25% 50%
Water 20% 70% 0% 25% 25% 50%
Table 1 The upper and lower limits of the land cover types according to the endmembers
36 Mucsi, L. – Henits, L. JOEG III/1-4
By comparing the open water surface classes of the
two examined dates, the location of the patches of excess
water and the total extent of excess water coverage can
be defined (Fig 9). It can be concluded that the patches
of excess water occupy similar locations on the two
images, however, there is a difference regarding their
extension. The total surface of the patches was 1.52 km2
in 1986, a year characterised by considerable excess
water inundation and it was 2.63 km2 in 2000, a year
characterised by extreme excess water inundation.
Fig. 7 Thematic map based on the endmember ratios of the Landsat TM satellite image taken on 16th .April 1986.
(a) Székkutas, (b) Lake Fehér, (1) open water surfaces, (2) vegetation, (3) open soil surfaces, (4) saturated soil(5) vegetation in
water (6) soils covered with vegetation, (7) other
Fig. 8 Thematic map based on the endmember ratios of the Landsat ETM+ satellite image taken on 23rd April 2000.
(a) Székkutas, (b) Lake Fehér, (1) open water surfaces, (2) vegetation, (3) open soil surfaces, (4) saturated soil, (5) vegetation in
water, (6) soils covered with vegetation, (7) other
JOEG III/1-4 Creating excess water inundation maps by sub-pixel classification of medium resolution satellite images 37
Accuracy estimation
In the first step the results of the classification were
compared with the data produced by the field surveys of
the Directorate for Environmental Protection and Water
Management of Lower-Tisza District (ATIKÖVIZIG).
Our classes of the open water surfaces, the saturated soil
and the inundated vegetation were compared with the
excess water polygons as references (Fig. 10). On the
basis of the comparison it can be concluded that due to
their smaller scale, the field surveys are less detailed.
There are some patches of excess water on the satellite
images that can be detected without any image pro-
cessing method, but they are in areas that are difficult to
approach, hard to walk round, thus these patches are
missing from the results of the field surveys. The classi-
fication based on satellite images is also favourable, as
this way the saturated soils can be differentiated from the
vegetation in water, while field surveys do not produce
such descriptive data.
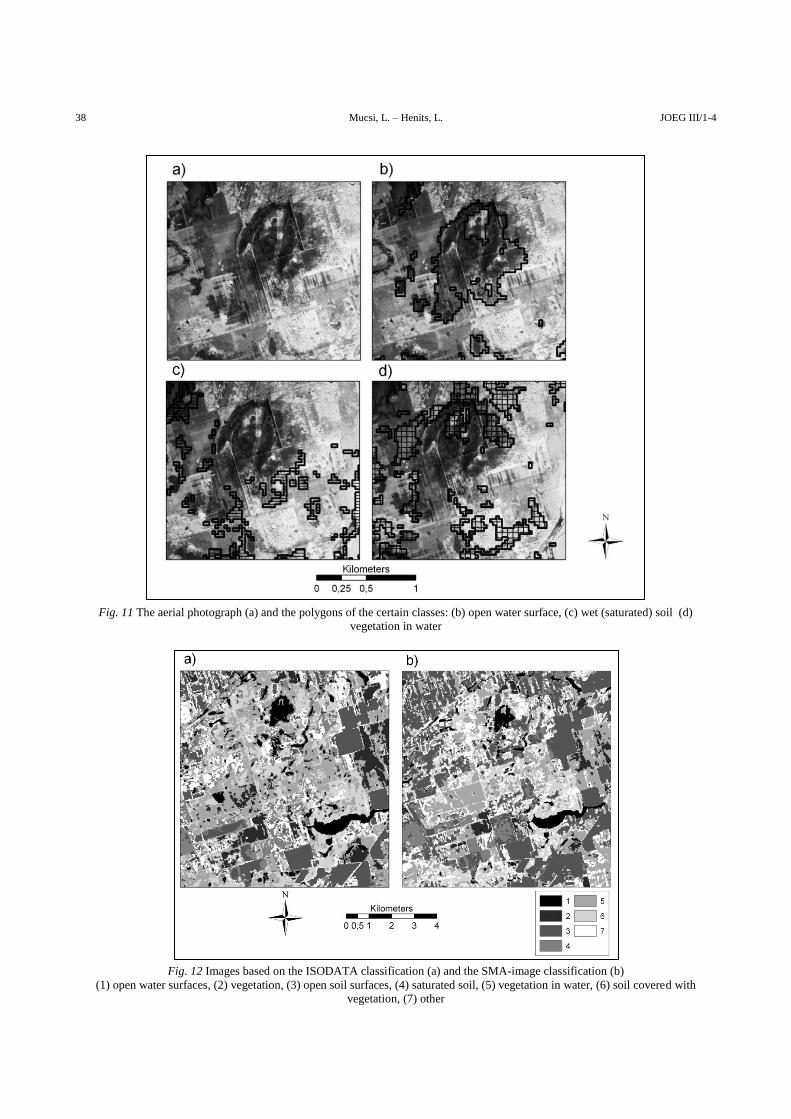
Other available data that can be used as reference to
estimate the accuracy of the classification are the aerial
photographs taken of the Tiszántúl, in the vicinity of
Székkutas on 23rd
March 2000 (Fig. 11). Although the
photographs with 1 m geometrical resolution are appro-
priate for the visual determination of the land cover
types, the precise separation and classification of certain
water surfaces on the 3 band photos are hard to carry out
with automatic image processing methods.
Fig. 10 The comparison of the patches of excess water of the
three classes of the thematic layer and the field survey
(a) Székkutas, (b) Lake Fehér, (1) open water surfaces, (2)
saturated soils, (3) vegetation in water
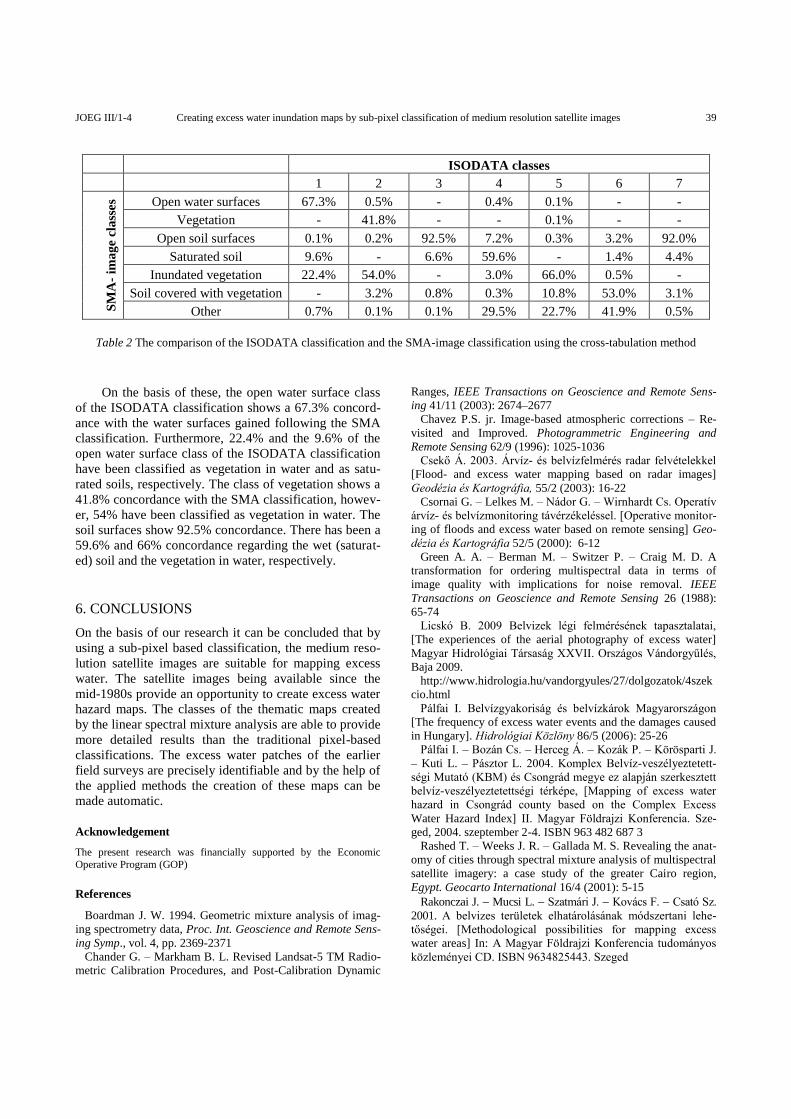
In order to prove the importance of the SMA-
classification, the created thematic layer was compared
with the results of a traditional pixel-based classification.
ISODATA classification was carried out on the Landsat
ETM+ 6 band image taken on 23rd
April 2000 (Fig. 12),
during which process 7 output classes were set. Sub-
sequently the 7 land cover classes of the thematic layer
were compared with the adequate classes of the
ISODATA clustering by using the cross-tabulation
method (Table 2).
Fig. 9 The comparison of the patches of excess water on the images taken on 16th April 1986 (a) and 23rd April 2000 (b) (1)
Lake Fehér (2) open water patches
38 Mucsi, L. – Henits, L. JOEG III/1-4
Fig. 11 The aerial photograph (a) and the polygons of the certain classes: (b) open water surface, (c) wet (saturated) soil (d)
vegetation in water
Fig. 12 Images based on the ISODATA classification (a) and the SMA-image classification (b)
(1) open water surfaces, (2) vegetation, (3) open soil surfaces, (4) saturated soil, (5) vegetation in water, (6) soil covered with
vegetation, (7) other
JOEG III/1-4 Creating excess water inundation maps by sub-pixel classification of medium resolution satellite images 39
On the basis of these, the open water surface class
of the ISODATA classification shows a 67.3% concord-
ance with the water surfaces gained following the SMA
classification. Furthermore, 22.4% and the 9.6% of the
open water surface class of the ISODATA classification
have been classified as vegetation in water and as satu-
rated soils, respectively. The class of vegetation shows a
41.8% concordance with the SMA classification, howev-
er, 54% have been classified as vegetation in water. The
soil surfaces show 92.5% concordance. There has been a
59.6% and 66% concordance regarding the wet (saturat-
ed) soil and the vegetation in water, respectively.
6. CONCLUSIONS
On the basis of our research it can be concluded that by
using a sub-pixel based classification, the medium reso-
lution satellite images are suitable for mapping excess
water. The satellite images being available since the
mid-1980s provide an opportunity to create excess water
hazard maps. The classes of the thematic maps created
by the linear spectral mixture analysis are able to provide
more detailed results than the traditional pixel-based
classifications. The excess water patches of the earlier
field surveys are precisely identifiable and by the help of
the applied methods the creation of these maps can be
made automatic.
Acknowledgement
The present research was financially supported by the Economic
Operative Program (GOP)
References
Boardman J. W. 1994. Geometric mixture analysis of imag-
ing spectrometry data, Proc. Int. Geoscience and Remote Sens-
ing Symp., vol. 4, pp. 2369-2371
Chander G. – Markham B. L. Revised Landsat-5 TM Radio-
metric Calibration Procedures, and Post-Calibration Dynamic
Ranges, IEEE Transactions on Geoscience and Remote Sens-
ing 41/11 (2003): 2674–2677
Chavez P.S. jr. Image-based atmospheric corrections – Re-
visited and Improved. Photogrammetric Engineering and
Remote Sensing 62/9 (1996): 1025-1036
Csekő Á. 2003. Árvíz- és belvízfelmérés radar felvételekkel
[Flood- and excess water mapping based on radar images]
Geodézia és Kartográfia, 55/2 (2003): 16-22
Csornai G. – Lelkes M. – Nádor G. – Wirnhardt Cs. Operatív
árvíz- és belvízmonitoring távérzékeléssel. [Operative monitor-
ing of floods and excess water based on remote sensing] Geo-
dézia és Kartográfia 52/5 (2000): 6-12
Green A. A. – Berman M. – Switzer P. – Craig M. D. A
transformation for ordering multispectral data in terms of
image quality with implications for noise removal. IEEE
Transactions on Geoscience and Remote Sensing 26 (1988):
65-74
Licskó B. 2009 Belvizek légi felmérésének tapasztalatai,
[The experiences of the aerial photography of excess water]
Magyar Hidrológiai Társaság XXVII. Országos Vándorgyűlés,
Baja 2009.
http://www.hidrologia.hu/vandorgyules/27/dolgozatok/4szek
cio.html
Pálfai I. Belvízgyakoriság és belvízkárok Magyarországon
[The frequency of excess water events and the damages caused
in Hungary]. Hidrológiai Közlöny 86/5 (2006): 25-26
Pálfai I. – Bozán Cs. – Herceg Á. – Kozák P. – Körösparti J.
– Kuti L. – Pásztor L. 2004. Komplex Belvíz-veszélyeztetett-
ségi Mutató (KBM) és Csongrád megye ez alapján szerkesztett
belvíz-veszélyeztetettségi térképe, [Mapping of excess water
hazard in Csongrád county based on the Complex Excess
Water Hazard Index] II. Magyar Földrajzi Konferencia. Sze-
ged, 2004. szeptember 2-4. ISBN 963 482 687 3
Rashed T. – Weeks J. R. – Gallada M. S. Revealing the anat-
omy of cities through spectral mixture analysis of multispectral
satellite imagery: a case study of the greater Cairo region,
Egypt. Geocarto International 16/4 (2001): 5-15
Rakonczai J. Mucsi L. Szatmári J. Kovács F. Csató Sz.
2001. A belvizes területek elhatárolásának módszertani lehe-
tőségei. [Methodological possibilities for mapping excess
water areas] In: A Magyar Földrajzi Konferencia tudományos
közleményei CD. ISBN 9634825443. Szeged
ISODATA classes
1 2 3 4 5 6 7
SM
A-
ima
ge
cla
sses Open water surfaces 67.3% 0.5% - 0.4% 0.1% - -
Vegetation - 41.8% - - 0.1% - -
Open soil surfaces 0.1% 0.2% 92.5% 7.2% 0.3% 3.2% 92.0%
Saturated soil 9.6% - 6.6% 59.6% - 1.4% 4.4%
Inundated vegetation 22.4% 54.0% - 3.0% 66.0% 0.5% -
Soil covered with vegetation - 3.2% 0.8% 0.3% 10.8% 53.0% 3.1%
Other 0.7% 0.1% 0.1% 29.5% 22.7% 41.9% 0.5%
Table 2 The comparison of the ISODATA classification and the SMA-image classification using the cross-tabulation method

40 Mucsi, L. – Henits, L. JOEG III/1-4
Roberts D. A. − Gardner M. − Church R. − Ustin S. − Scheer
G. − Green R. O. Mapping chaparral in the Santa Monica
Mountains using multiple endmember spectral mixture models,
Remote Sensing of Environment 65 (1998): 267–279
Smith M. O. – Johnson P. E. – Adams J. J. 1985. Quantita-
tive determination of mineral types and abundances from re-
flectance spectra using principal components analysis, Journal
of Geophysical Research 90. C797–C804
Recommended