CPPR- Centre for Comparative Studies
ANALYSIS OF THE KERALA ASSEMBLY ELECTIONS, MAY 2016
Centre for Public Policy Research 'Anitha',1st floor, S.A. Road, Elamkulam
Kochi, Kerala, India-682020 Email: [email protected]
July 2016, © Copyrights Reserved

www.cppr.in
1 Analysis of the Kerala Assembly Elections, May 2016
Contents
1. Introduction……………………………………………………………………………………………………………………………2
2. Background of the study……………………………………………………………………………………………………….2
3. Proposed study……………………………………………………………………………………………………………………….4
3.1. Objectives……………………………………………………………………………………………………………………….4
3.2. Research methodology……………………………………………………………………………………………………5
4. Findings and Inferences…………………………………………………………………………………………………………5
4.1. Interest in elections……………………………………………………………………………………………………….6
4.2. Factors deciding vote…………………………………………………………………………………………………….8
4.3. Respondents’ opinions of UDF and LDF……………………………………………………………………….10
4.4. Respondents’ opinion of NDA……………………………………………………………………………………….12
4.5. UDF’s loss and LDF’s manifesto……………………………………………………………………………………14
5. Conclusion…………………………………………………………………………………………………………………………….15
6. Limitations……………………………………………………………………………………………………………………………16
7. Notes/Bibliography………………………………………………………………………………………………………………17
8. Annexure I…………………………………………………………………………………………………………………………….19
www.cppr.in
2 Analysis of the Kerala Assembly Elections, May 2016
Analysis of the Kerala Assembly Elections, May 2016
1. Introduction
Kerala was one of the earliest elected Communist governments in the world. Since then, the
state has been a ‘political laboratory’ (Gopakumar 2014: 317) and largely an exception to the
national political processes. Left Democratic Front (LDF – alliance led by the CPI (M)) and
United Democratic Front (UDF – alliance led by the Congress) governments have been
alternatively in power in Kerala since 1982. The 2016 Assembly Election saw the LDF come to
power in the same pattern. This study attempts to understand people’s perceptions and their
understanding approaching the 2016 assembly elections and how it influenced the voting pattern
and behaviour while exercising their right to vote. The study focused on the various alliances,
observed continuities and change in the support base of parties during the campaign phase
leading to the poll conducted on May 19, 2016.
2. Background of the study
Exit Poll predictions for the Kerala Assembly elections were in largely in line with the history of
voting out the incumbent party for four decades. One of the critical components contributing to
the anti-incumbency factor against the ruling UDF was that of the UDF faced many corruption
cases, ranging from controversial land deals to ministers quitting over allegations of bribery.
The CM, Oommen Chandy was accused of having connections with a fake solar energy company;
the opposition had urged him many times to resign from CM post taking the moral responsibility
of the charges levelled against him and his ministerial colleagues.
A feature of the party system in Kerala is that stable social alliances are present underneath
political coalition; there exists a high polarization on caste-religion lines. (Gopakumar 1999) The
UDF is dependent on the backing from Christians and Muslims, who form 45% of the population.
Christian votes are gained through the Christian party leaders of Congress Party and the factions
of Kerala Congress party which have a Christian following. Muslims votes are channelised by the
Indian Union Muslim League. A small percentage of the Nairs (about 14 percent of the
This research paper is contributed by D Dhanuraj, Lekshmi R Nair & Sambhavi G
www.cppr.in
3 Analysis of the Kerala Assembly Elections, May 2016
population) and some Ezhavas (23 per cent) have been supporting the Congress, but the
minorities formed their support base (Mathew, 2016). A major section of the Ezhavas and Dalits
and a part of the minorities are the sources of support for the CPM. The alleged ‘minority
appeasement’ of the UDF was a rallying point for the BJP, which tried to consolidate the Hindu
vote by combining the Nair, Ezhava, Brahmin, and the SC votes (Thomas 2016). The BJP is allied
with the Bharat Dharma Jana Sena (BDJS), a party formed in late 2015 by the Sree Narayana
Dharma Paripalana (SNDP) Yogam, an Ezhava organization.
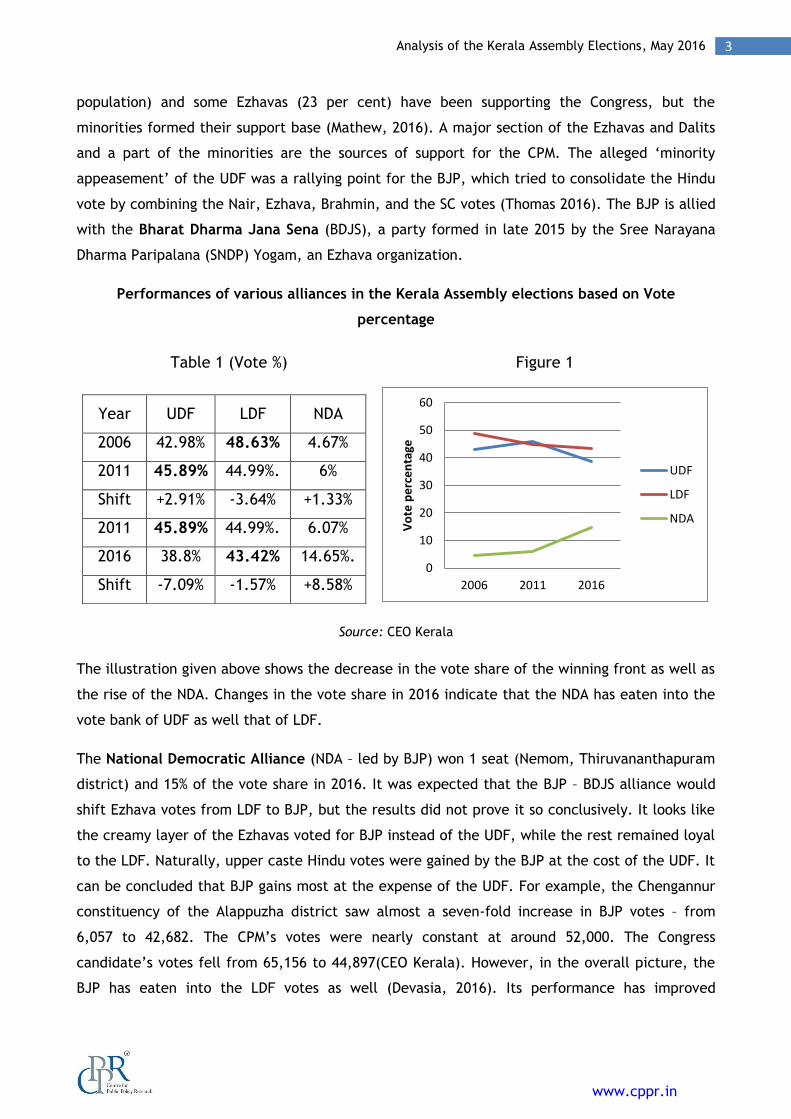
Performances of various alliances in the Kerala Assembly elections based on Vote
percentage
Source: CEO Kerala
The illustration given above shows the decrease in the vote share of the winning front as well as
the rise of the NDA. Changes in the vote share in 2016 indicate that the NDA has eaten into the
vote bank of UDF as well that of LDF.
The National Democratic Alliance (NDA – led by BJP) won 1 seat (Nemom, Thiruvananthapuram
district) and 15% of the vote share in 2016. It was expected that the BJP – BDJS alliance would
shift Ezhava votes from LDF to BJP, but the results did not prove it so conclusively. It looks like
the creamy layer of the Ezhavas voted for BJP instead of the UDF, while the rest remained loyal
to the LDF. Naturally, upper caste Hindu votes were gained by the BJP at the cost of the UDF. It
can be concluded that BJP gains most at the expense of the UDF. For example, the Chengannur
constituency of the Alappuzha district saw almost a seven-fold increase in BJP votes – from
6,057 to 42,682. The CPM’s votes were nearly constant at around 52,000. The Congress
candidate’s votes fell from 65,156 to 44,897(CEO Kerala). However, in the overall picture, the
BJP has eaten into the LDF votes as well (Devasia, 2016). Its performance has improved
Table 1 (Vote %)
Year UDF LDF NDA
2006 42.98% 48.63% 4.67%
2011 45.89% 44.99%. 6%
Shift +2.91% -3.64% +1.33%
2011 45.89% 44.99%. 6.07%
2016 38.8% 43.42% 14.65%.
Shift -7.09% -1.57% +8.58%
Figure 1
0
10
20
30
40
50
60
2006 2011 2016
Vo
te p
erc
en
tage
UDF
LDF
NDA

www.cppr.in
4 Analysis of the Kerala Assembly Elections, May 2016
considerably in as many as 50 constituencies (Sheth and Rajendran, 2016). Figure 1 given above
illustrates the rise of the BJP and the combined fall in the vote shares of the LDF and the UDF.
An important feature of Kerala’s political system is the media penetration among people.
Kerala’s two leading daily newspapers, Malayala Manorama and Mathrubhoomi, are among the
top 10 dailies in India, followed by Hindi, English, and Tamil dailies. However, Malayalam is the
9th most spoken the language in India (Indian Readership Survey, 2014). Kerala is known for its
high literacy rate (93.91%, against India’s 74.04% - Census 2011) and a correspondingly higher
percentage of newspaper readership. It was reported that social media played a significant role
in shaping up the victory in as many as 71 out of the 140 assembly constituencies of Kerala
(Deccan Chronicle, May 2016).
3. Proposed study
Based on preliminary research from secondary sources, a few hypotheses were listed as follows
for the proposed study:
1) There exists a high rate of political awareness among people
2) Caste/ religion remained to be significant factors in the mobilization of votes in 2016
3) The UDF lost primarily because of corruption
4) The LDF won because its vote base was largely undisturbed
5) The NDA has gained a secure footing in Kerala’s politics
3.1 Objectives
The study aims to understand the various sociological dimensions that provide a framework for
the electoral processes in Kerala. As the study background explains, factors like caste and
community have been important in deciding the political preferences of voters. Hence, it is
necessary to understand the nature and scale of caste/community influence among the people
in the current context to arrive at holistic conclusions.
The study also attempts to understand the media penetration among the survey participants.
Given the high rate of media penetration in the state, it becomes necessary to analyze the
influence of media to understand the people’s perceptions towards the elections and the major
parties.
The study aims to find out the people’s perceptions regarding the various fronts that
participated in the elections, namely the UDF, LDF and NDA, and the reasons for the UDF’s loss,

www.cppr.in
5 Analysis of the Kerala Assembly Elections, May 2016
LDF’s victory, and the NDA’s performance in the elections. It also intends to realise people’s
expectations from the victorious front, the LDF.
3.2 Research Methodology
The research methodology used for the survey was quantitative. A questionnaire was prepared
to understand the respondents’ interest in politics, their exposure to the media, their
community’s influence on their voting behaviour, and their opinions on the incumbent’s loss and
the various alliances that participated in the election. The Likert-type scale was used to
understand the respondents’ inclinations towards the LDF and the UDF; opinions of the NDA
were measured using the preference ranking method and by asking the respondents to choose
from opposing statements. The chi-square test of association was used to find out the
relationship between some variables. Surveys were taken from 100 respondents in the public
spaces of Ernakulam. The sampling was done in simple random methods at the major transit
points in Kochi city so that the respondents belonging to different parts of Kerala could be
interviewed.
4. Findings and Inferences
Participants in the survey – people from 53 Assembly constituencies in 12 districts (except
Kasargod and Kozhikode) participated in the survey.
Table 2: Age of respondents
Less than or
equal to 25
Between 26 and 45 Between 46 and 65 Above 65 Total
31 37 30 2 100
Table 3: Religious composition of respondents
Hindus Christians Muslims Others Total
Respondents 52 35 7 6 (no mention of
background)
100
Source: CPPR Field survey

www.cppr.in
6 Analysis of the Kerala Assembly Elections, May 2016
4.1 Interest in elections
The respondents’ interest in the election campaign
Figure 2: Respondents' interest in elections
Source: CPPR Field survey
The above graph shows that Kerala is politically charged, and the participation and the interest
in politics are very high. This finding could be checked with the poll percentage in the elections
(77.35%).
71% of our respondents were men, and 29% were women. This imbalance in gender is because,
during the survey, women were hesitant to respond and claimed that their opinions were the
same as their husband's. In some cases, the husbands themselves claimed their wives did not
know anything about politics. Even unaccompanied women largely refused to participate in the
survey. When seen through the gender lens, the rate of interest (scale of 1 to 3) between men
and women varied, as shown in the figure below.
Figure 3: Respondents' interest based on gender
Source: CPPR Field survey
56% 36%
7%
1%
Very interested
Some interest
No interest
Can't say
2.15
2.2
2.25
2.3
2.35
2.4
2.45
2.5
2.55
2.6
Male Female
Scal
e o
f in
tere
st (
1 t
o 3
)
Gender

www.cppr.in
7 Analysis of the Kerala Assembly Elections, May 2016
The media exposure of the respondents was measured by asking them if they followed
campaign-related articles, advertisements, etc. in the Newspapers, TV, Radio and the internet.
The study shows that 77% read the election-related items in the newspapers every day, and an
equal percentage of persons watched election-related matter on the TV every day. 65% read the
newspapers as well as watched TV every day. 51% browsed the internet for election-related
issues daily, and 16% listened to the radio every day.
Figure 4: Media access of respondents
Source: CPPR Field survey
Access to newspapers, TV, and radio did not differ significantly between males and females. At
the same time, males had significantly more access to the internet, which could be derived from
the chi-square test results given below.
1) Null hypothesis – no significant association between gender and newspaper access.
Pearson chi2(3) = 2.5099 P value = 0.473.
Null hypothesis accepted.
2) Null hypothesis – no significant association between gender and TV access.
Pearson chi2(3) = 0.5192 P value = 0.915.
Null hypothesis accepted.
3) Null hypothesis – no significant association between gender and radio access.
Pearson chi2(3) = 5.8447 P value = 0.119.
Null hypothesis accepted.
4) Null hypothesis – no significant association between gender and internet access.
Pearson chi2(3) = 21.7132 P value = 0.000.
Null hypothesis rejected.
0
10
20
30
40
50
60
70
80
90
Everyday Twice-thrice aweek
Once a week Less thanonce a week
Newspaper
TV
Radio
Internet

www.cppr.in
8 Analysis of the Kerala Assembly Elections, May 2016
Table 4: Internet access and gender
Gender Less than once a
week
Once a week Twice-thrice a
week
Everyday Total
Male 18
0 1 41 60
Female 3 3 6 12 24
Total 21 3 7 53 84
Source: CPPR Field survey
The rate of interest in elections, as well as participation in election analysis, differed among
males and females, despite equal access to TV, radio, and newspapers, almost equally high
literacy rates among men and women. Hence, our hypothesis on the high level of political
awareness stands true among people to a greater extent in favour of male voters.
4.2 Factors influenced vote
The factors deciding the respondents’ votes are given below
Figure 5: Factors influencing respondents' vote
Source: CPPR Field survey
82 % of the interviewees claimed in the inquiry that they were influenced by none on whom to
vote for in elections. Only 18% felt that their community/religious leader favoured a particular
political party. According to their opinion, 29.41% of the leaders supported the UDF, 58.8%
supported the LDF, and 11.7% supported the NDA. Out of the 18% (those who admitted that their
community leadership had strong vibes favouring a front/party), 52.9% people voted for the
same party as their community leader wanted, 35.2% people voted for the same party but not
because of the leader and 5.88% voted for another party (Figure 6). Out of the 11 Ezhavas that
participated in the survey, only 18.18% (2 out of 11) felt that their community leader supported
82%
6% 4%
2% 1% 1%
1% 3% I voted on my own
Family member
Local leader
Media
Spouse
Neighbour
Colleague
Can't say

www.cppr.in
9 Analysis of the Kerala Assembly Elections, May 2016
the NDA. In spite of open support to BJP by the Ezhava community leader Vellapally Natesan,
most respondents have refused to recognize it. It can be concluded that many people have not
considered community leaders as guides in an election. However, among the minimal number of
respondents whose leaders have supported a party, around half of them have voted for the same
party vouched by their leader.
Figure 6: Respondents who claimed their community leaders supported a party
Source: CPPR Field survey
Among the respondents, only sixteen of them were recent beneficiaries of a state government
scheme, twelve of them were satisfied, and three of them were somewhat satisfied. Most of
the recipients reported an improvement in their household condition. Out of them, seven each
had voted for the LDF and the UDF. The respondents’ vote seem independent from the welfare
benefits received.
86 of the interviewees had voted in the elections; out of the 14 who did not vote; one was not
interested, three names were not on the voter list, eight were travelling, one did not know the
reason and one said he hated politics.
On a question related to the time at which one has decided to vote for a particular
party/candidate – 57% stated that they had decided before the campaign, 17 % during the
campaign, and 6% just before voting, 20% did not know.
Figure 7: Time period when respondent decided candidate/party to vote for
Source: CPPR Field survey
52.94% 35.29%
5.88% 5.88% Voted for the same partybecause of the leader
Voted for the same partynot because of the leader
Voted for a different party
Don't know
57% 17%
6%
20%
Before thecampaign
During thecampaign

www.cppr.in
10 Analysis of the Kerala Assembly Elections, May 2016
One can relate the media penetration among respondents and their awareness on the various
political developments as key factors here. Since most of the respondents followed the news
regularly, they seem to have made up their minds not based on the campaign, but on a party’s
public image. According to our survey, people with more interest in elections and politics had
made up their mind much in advance which party to vote for. A higher rating on a scale of 1-3 (1
– decided before the campaign, 2 – during the campaign, 3 – just before voting) means a late
decision, and hence citizens with a lesser interest in elections seem to have made up their
minds much later than those who were interested.
Figure 8: Respondents' decision to vote based on their interest
Source: CPPR Field survey
4.3 Respondents’ opinion of UDF and LDF
The respondents seemed to have an overall positive outlook of the LDF. On a scale of 1 to 5 (1-
fully disagree and 5-fully agree), the average rating for the possibility of factions in CPI (M)
affecting governance was 2.85. Respondents also agreed with the statements that LDF has a
pragmatic approach towards the prohibition policy (3.15), the LDF is a secular front (3.29) and
that the LDF is more sombre about the protection of natural resources (3.28). The UDF
government was believed to be corrupt; the ratings for this statement were the most extreme
(3.39). However, the respondents did not think that the UDF was minority centric, albeit with a
small margin (2.86). They also believed that the UDF was pro-development than the LDF (3.17).
Community wise, both Hindus and Christians were slightly in favour of the statement that the
UDF was minority centric in equal measure (around 3.04). Muslims disagreed with the
statement, averaging the rate of 2.42. Figure 9.1 and 9.2 will illustrate our argument
0
0.2
0.4
0.6
0.8
1
1.2
1.4
1.6
1.8
Not interested Some interest Much interested
Scal
e o
f 1
to
3 (
tim
e o
f d
eci
din
g to
vo
te f
or
a p
arty
)
Interest level in politics

www.cppr.in
11 Analysis of the Kerala Assembly Elections, May 2016
Figure 9.1: Respondents' perceptions about the UDF
Figure 9.2: Respondents' perceptions about the LDF
Source: CPPR Field survey
An average of the LDF and UDF’s statements show that there was a greater ranking given to
UDF’s corruption (3.39) compared to LDF’s secular credentials (3.29), its apparent importance
accorded to natural resources (3.28) and its approach towards prohibition (3.15). Hence, it can
be concluded that people voted more against the UDF than for the LDF.
It is noteworthy that 64% of the respondents were neutral over the years. Only 16% were
traditional LDF supporters, 11% supported the UDF, 4% supported the NDA. The rest were not
unconditional supporters; they merely voted on the basis of their judgement, based on the
image and delivery of the parties.
2.7
2.8
2.9
3
3.1
3.2
3.3
3.4
3.5
UDF government wascorrupt
UDF was minoritycentric
UDF was prodevelopment
Re
spo
nd
en
ts' r
atin
g
Common perceptions about UDF
2.6
2.7
2.8
2.9
3
3.1
3.2
3.3
3.4
Factions wouldaffect governance
Pragmatic approachtowards prohibition
Secular front More serious aboutnatural resources
Re
spo
nd
en
ts' r
atin
g
General statements about the LDF

www.cppr.in
12 Analysis of the Kerala Assembly Elections, May 2016
4.4 Respondents’ opinion of NDA
According to the respondents, the main reason behind NDA gaining 15% vote share was that
people were fed up with the LDF UDF system. The Modi factor was the second most important
reason. However, for voters of the NDA, the Modi factor was only the 4th important factor out of
the 5 options given. Some people went beyond the options given and stated that O Rajagopal
won sympathy votes and that caste and religion were the important factors in NDA gaining
votes. LDF voters listed the Modi factor as the least possible reason why the NDA could have
gained 15% votes. Figures 10.1 to 10.4 show a party-wise split on why someone could have voted
for the NDA, as well as the average opinion of all the respondents. Here, a higher rating means
lesser importance as the scale used was 1 being most important and 5 being least important.
Figure 10.1: People's perception on why someone could have voted for NDA
Figure 10.2: LDF voters' perception on why someone could have voted for the NDA
0
0.5
1
1.5
2
2.5
3
3.5
Hindu communityis ignored by
parties
People are fed upwith UDF LDF
system
Centre and stateshould have the
same govt
No differencebetween UDF andLDF governance
Modi factor
Ran
kin
g
Popular perceptions
00.5
11.5
22.5
33.5
Hindu communityis ignored by
parties
People are fed upwith UDF LDF
system
Centre and stateshould have the
same govt
No differencebetween UDF andLDF governance
Modi factor
Ran
kin
g
Popular perceptions

www.cppr.in
13 Analysis of the Kerala Assembly Elections, May 2016
Figure 10.3: UDF voters' perception on why someone could have voted for the NDA
Figure 10.4: NDA voters' perception on why someone could have voted for the NDA
Source: CPPR Field survey
Total respondents’ views about the BJP-BDJS alliance are shown in fig. 11.1 to 11.4.
Figure 11.1 Figure 11.2
0
0.5
1
1.5
2
2.5
3
3.5
4
Hindu communityis ignored by
parties
People are fed upwith UDF LDF
system
Centre and stateshould have the
same govt
No differencebetween UDF andLDF governance
Modi factor
Ran
kin
g
Popular perceptions
0
0.5
1
1.5
2
2.5
3
3.5
Hindu communityis ignored by
parties
People are fed upwith UDF LDF
system
Centre and stateshould have the
same govt
No differencebetween UDF andLDF governance
Modi factor
Ran
kin
g
Popular perceptions
69% 15%
16%
BJP BDJS alliance
Would not lastlong
Would last for along time
Don't know
62%
13%
25%
BJP BDJS alliance
Benefitted theBJP more
Benefitted theNDJS more
Don't know

www.cppr.in
14 Analysis of the Kerala Assembly Elections, May 2016
Figure 11.3 Figure 11.4
Source: CPPR Field survey
4.5 UDF’s loss and LDF’s manifesto
Responses to the main reason for the UDF’s loss are shown in figure 12. As seen, corruption
seems to be the overriding reason behind the UDF’s loss.
Figure 12: Reasons for UDF loss
Source: CPPR Field survey
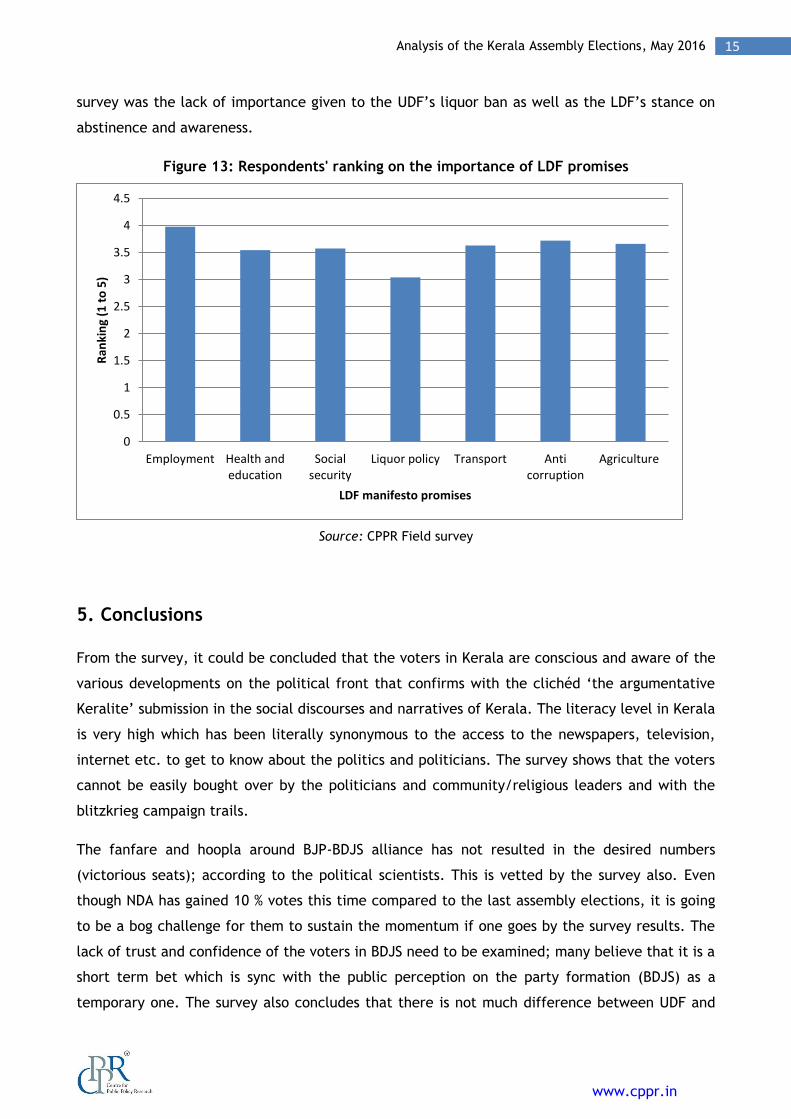
We selected some promises from the LDF manifesto and asked people about the importance and
the urgency of the promises, which included employment, health and education, social security,
liquor policy, transport, anti-corruption, and agriculture. Employment generation received the
highest expectation; according to reports, the unemployment rate in Kerala tops the country at
7.4, in contrast to the national average of 2.3% (The Hindu, 2016). The second preference was
given to anti-corruption measures. The UDF’s last two years in the office was marked by
corruption accusations, which has led the respondents to give importance to the anti-corruption
promises of the LDF. Liquor policy received the least importance. A significant outcome of the
18%
52%
30%
BJP BDJS alliance
Against uppercaste votes
Will consolidateHindu votes
Don't know
13%
70%
17%
BJP BDJS alliance
BDJS has itsown strengths
BJP helpedBDJS gain votes
Don't know
63% 12%
6%
5%
2% 2% 2%
8%
Corruption
Liquor prohibition policy
Combination
Minority centricappointmentsCaste
Anti incumbency
LDF's liquor abstinencepolicyDon't know
www.cppr.in
15 Analysis of the Kerala Assembly Elections, May 2016
survey was the lack of importance given to the UDF’s liquor ban as well as the LDF’s stance on
abstinence and awareness.
Figure 13: Respondents' ranking on the importance of LDF promises
Source: CPPR Field survey
5. Conclusions
From the survey, it could be concluded that the voters in Kerala are conscious and aware of the
various developments on the political front that confirms with the clichéd ‘the argumentative
Keralite’ submission in the social discourses and narratives of Kerala. The literacy level in Kerala
is very high which has been literally synonymous to the access to the newspapers, television,
internet etc. to get to know about the politics and politicians. The survey shows that the voters
cannot be easily bought over by the politicians and community/religious leaders and with the
blitzkrieg campaign trails.
The fanfare and hoopla around BJP-BDJS alliance has not resulted in the desired numbers
(victorious seats); according to the political scientists. This is vetted by the survey also. Even
though NDA has gained 10 % votes this time compared to the last assembly elections, it is going
to be a bog challenge for them to sustain the momentum if one goes by the survey results. The
lack of trust and confidence of the voters in BDJS need to be examined; many believe that it is a
short term bet which is sync with the public perception on the party formation (BDJS) as a
temporary one. The survey also concludes that there is not much difference between UDF and
0
0.5
1
1.5
2
2.5
3
3.5
4
4.5
Employment Health andeducation
Socialsecurity
Liquor policy Transport Anticorruption
Agriculture
Ran
kin
g (1
to
5)
LDF manifesto promises

www.cppr.in
16 Analysis of the Kerala Assembly Elections, May 2016
LDF though the replacement is based on the odds against the incumbent government. The
political nature of Kerala is such that the corruption, green policies, employment etc. are
treated on priority basis when it comes to the evaluation of the anti-incumbency trends which
are yet again proved in the last Assembly Elections.
Kerala is bestowed with unique coalition opportunities of the past. The study shows that the
trends will continue. Even though there is resentment against both the front, entry of a new
front into the Kerala scene could not be based on old equations that control both the existing
fronts. The caste and communities play a major role in the public life but not at the same level
on the election front. A malayalee voter cannot be easily won over as he has a rich and
profound understanding on the political developments around him. The study shows voters are
not easily amendable for a new front unless they are very much convinced for the political
reasons and not for the religious reasons.
6. Limitations of the Study
One limitation is that the survey is done among 100 respondents only in the public spaces of
Ernakulam though the respondents include people from different parts of Kerala. The survey,
however, is not done by travelling to different parts of the state.
The second limitation of the study is that there is a gender bias in the sample, with 71% of
respondents as men, and 29% were women .The gender bias, however, is due to the hesitance of
women in responding to the questions.

www.cppr.in
17 Analysis of the Kerala Assembly Elections, May 2016
7. Bibliography
Books
Gopa Kumar. ‘Changing Dimensions of Coalition Politics in Kerala’ in Sridharan, E. (ed.)
Coalition Politics in India, pp. 317 to 389. 2014. Academic Foundation: New Delhi
Articles
Gopa Kumar and CSDS. November 1999. ‘A race between traditional rivals’. Frontline. Volume
16 - Issue 23.
http://www.frontline.in/navigation/?type=static&page=flonnet&rdurl=fl1623/16230530.htm
Deccan Chronicle. 16th May 2016. ‘Kerala: Social media crucial in deciding 71 candidates’.
http://www.deccanchronicle.com/nation/politics/160516/kerala-social-media-crucial-in-
deciding-71-candidates.html
Devasia, TK. 20th May, 2016. ‘Kerala Assembly election results: A sign that BJP is emerging as
the third alternative’. Firstpost. http://m.firstpost.com/politics/kerala-assembly-election-
results-a-sign-that-bjp-is-emerging-as-the-third-alternative-2790912.html
Mathew, Liz. 15th May 2016. ‘Kerala polls: Caste and community leaders could hold the key this
time’. The New Indian Express. http://indianexpress.com/article/elections-2016/india/india-
news-india/kerala-elections-ldf-udf-cardinal-baselios-cleemis-panakkad-syed-hyderali-shihab-
thangal-g-sukumaran-nairvellappally-natesan-2801019/
Sheth, Anisha and Rajendran, Dhanya. 20th May 2016. ‘The BJP juggernaut has just begun to roll
in Kerala, these numbers are proof’. The News Minute.
http://www.thenewsminute.com/article/bjp-juggernaut-has-just-begun-roll-kerala-these-
numbers-are-proof-43566
Surya, Jisha. 20th May 2016. ‘Only 8 women elected to Kerala Assembly’. The Times of India.
http://timesofindia.indiatimes.com/elections-2016/kerala-elections-2016/news/Only-8-women-
elected-to-Kerala-Assembly/articleshow/52357981.cms
The Hindu. 12th February 2016. ‘Kerala tops in unemployment rates.’
http://www.thehindu.com/news/national/kerala/kerala-tops-in-unemployment-
rates/article8226139.ece
Thomas, K.V. 20th April, 2016. ‘The Voters' Dilemma in Kerala’. Verdict 2016. The Hindu Centre
for Politics and Public Policy. http://www.thehinducentre.com/verdict/article8493552.ece

www.cppr.in
18 Analysis of the Kerala Assembly Elections, May 2016
Websites
Legislative Assembly Election Kerala 2016. Chief Electoral Officer, Kerala.
<http://trend.kerala.gov.in/>
State of Literacy. Census of India Report, 2011. http://censusindia.gov.in/2011-prov-
results/data_files/india/Final_PPT_2011_chapter6.pdf
Indian Readership Survey, 2014. Nielsen. http://web.archive.org/web/20160323211813
/http://mruc.net/sites/default/files/IRS%202014%20Topline%20Findings_0.pdf

www.cppr.in
19 Analysis of the Kerala Assembly Elections, May 2016
8. Annexure I
Post Election Survey
Age –
Gender –
Community/ Religion –
Annual Income –
Constituency –
Address (with landmark) –
The data collected from the survey will only be used for research purpose and will not be put
in public domain. The identity of the respondents will not be disclosed to anybody.
Q1. How interested were you in the
campaign for the Kerala assembly elections
of 2016?
Q2. What were the media that you had access to?
Newspapers Less than
once a week
Once a week Twice – thrice a
week
Everyday
Television Less than
once a week
Once a week
Twice – thrice a
Week
Everyday
Radio Less than
once a week
Once a week
Twice – thrice a
week
Everyday
Internet /
social media
Less than
once a week
Once a week Twice – thrice a
week
Everyday
Q3. What/who mattered the most in deciding your support? – Party / local candidate / CM
candidate / present central government / past state government / don’t know
Not interested Some interest Very Interested
1 2 3

www.cppr.in
20 Analysis of the Kerala Assembly Elections, May 2016
Q4. Whose opinion mattered the most in deciding your vote? – Local leader / spouse / family
member / neighbour / colleague / caste or community member / media / I voted on my own /
can’t say
Q5. Did your community leader support a party? – Yes / No / maybe (If no, go to Q11)
Q5a. If yes, which party did they support? – UDF / LDF / NDA / Independent / Other
Q5b. Did you vote for the same party? – Yes, because of the leader / yes, but not because of
the leader / No, I did not
Q6. As compared to five years ago, has the economic condition in your household improved? –
Much worse / worse / same / better / much better / no opinion
Q7. Have you recently been the beneficiary of a state govt. scheme? – Yes / No (If no, go to
Q10)
Q7a. Are you satisfied with the scheme? – No / somewhat / Yes / don’t know
Q8. Did you vote in the recent Assembly elections? – Yes / No (If no, go to Q11)
Q8a. If yes, whom did you vote for? – LDF / UDF / NDA / Independent / Other / NOTA
Q8b. When did you decide to vote for this party? – Before the campaign / during the campaign
/ just before voting / can’t say
Q8c. If not, why didn’t you vote? – Not interested / name not on the voter list / travelling /
not a resident of Kerala / other _____________
Fully
disagree
Disagree Neutral Agree Fully
agree
1 2 3 4 5
1 2 3 4 5
1 2 3 4 5
1 2 3 4 5
www.cppr.in
21 Analysis of the Kerala Assembly Elections, May 2016
Q9. Please consider the following statements about the UDF and LDF and select the most
appropriate option that influenced your voting behaviour:
a. The UDF government was corrupt –
b. The UDF was minority centric –
c. UDF is pro - development (infrastructure projects) than LDF –
d. Factions in CPI (M) may hamper their governance –
e. The LDF has a pragmatic approach towards the prohibition policy –
f. LDF is a secular front–
g. LDF is more serious about the protection of environment and natural resources –
Q10. Did you support any party before the campaigns? – LDF supporter / UDF supporter / NDA
supporter / other supporter / neutral
Q11. Consider the following statements related to the NDA campaign. Which of these
statements do you strongly believe in? Rate them preferentially on a scale of 1 (most important)
to 5 (least important).
a. Majority Hindu community is ignored by parties.
b. People are fed up with two fronts (UDF & LDF) system in Kerala.
c. Centre and State should have same governments.
d. There is not much difference between UDF and LDF in governance.
e. The Modi factor and faith in PM in delivering the promises.
1 2 3 4 5
1 2 3 4 5
1 2 3 4 5

www.cppr.in
22 Analysis of the Kerala Assembly Elections, May 2016
Q12. Please select one of the options (‘a’ or ‘b’) in the following four opposing statements:
The BJP-BDJS alliance-
a. is an alliance of convenience with short term
goals
b. will be a long term alliance
a. benefitted the BJP more b. benefitted the BDJS more
a. is against the interests of upper caste voters b. will consolidate Hindu votes
a. BDJS has its own strengths b. BDJS was helped by BJP’s resources (man
and money)
Q13. According to you, what was the most important factor in the UDF’s loss? – Corruption /
minority centric appointments / liquor prohibition policy / LDF’s liquor abstinence policy
Q14. The following are some important promises made in the LDF manifesto. Please rate the
urgency and importance of the following on a scale of 1 (lowest) to 5 (highest).
a. Employment - 25 lakh jobs in 5 years, jobs for NRI returnees
b. Health & education - Upgrading 1000 government schools; spending 5% of the state GSDP for
health
c. Social security - a Hunger-free state with assured one meal, welfare pensions, and an
increase in minimum daily wage
d. Liquor policy - Awareness programs for liquor abstinence, de-addiction centres
e. Transport - High-speed corridor in railways; 4-line National Highways and reconstruction of
other roads.
f. Anti corruption - Transparency in governance – social audits of government offices
g. Agriculture – income assurance, govt department for traditional agro-based industries
h. Other – (please mention)

Recommended