1
PATTERNS OF DRINKING
ABSTAINERS (15+ years), 2005
Males Females Total
Lifetime abstainers
No information availableFormer drinkers
Abstainers*
* Persons who did not drink in the past 12 months.
DRINKERS ONLY
Adult (15+ years) per capita consumption*, total —
Adult (15+ years) per capita consumption*, males —
Adult (15+ years) per capita consumption*, females —
Heavy episodic drinkers** (15–85+ years), males —
Heavy episodic drinkers** (15–85+ years), females —
* (Recorded + unrecorded – tourist) in litres of pure alcohol, average 2003–2005.** Had at least 60 grams or more of pure alcohol on at least one occasion weekly.
PATTERNS OF DRINKING SCORE
Patterns of drinking score* LEAST RISKY 1 2 3 4 5 MOST RISKY
* Given the same level of consumption, the higher the patterns of drinking score, the greater the alcohol-attributable burden of disease for the country.
ALCOHOL POLICYExcise tax on beer / wine / spirits Yes / Yes / Yes
National legal minimum age for off-premise sales of alcoholic beverages (selling) (beer / wine / spirits) 18 / 18 / 18
National legal minimum age for on-premise sales of alcoholic beverages (serving) (beer / wine / spirits) 18 / 18 / 18
Restrictions for on-/off-premise sales of alcoholic beverages:Time (hours and days) / location (places and density) No / NoSpecifi c events / intoxicated persons / petrol stations No / No / No
National maximum legal blood alcohol concentration (BAC) when driving a vehicle (general / young / professional), in % 0.05 / 0.05 / 0.05
Legally binding regulations on alcohol advertising / product placement Yes / Yes
Legally binding regulations on alcohol sponsorship / sales promotion No / Yes
HEALTH CONSEQUENCES
MORBIDITY
Prevalence estimates (12-month prevalence for 2004): Males Females
Alcohol use disorders (15+ years) 2.72% 0.67%
ALL CAUSE MORTALITY
Age-standardized deaths rates, 15+ years (per 100,000 population)
2000 2001 2002 2003 2004 2005
M F M F M F M F M F M F
Liver cirrhosisNo information availableRoad traffi c
accidents (1)
Data source: WHO Mortality Database, data as reported by countries (1) refer to transport accidents.
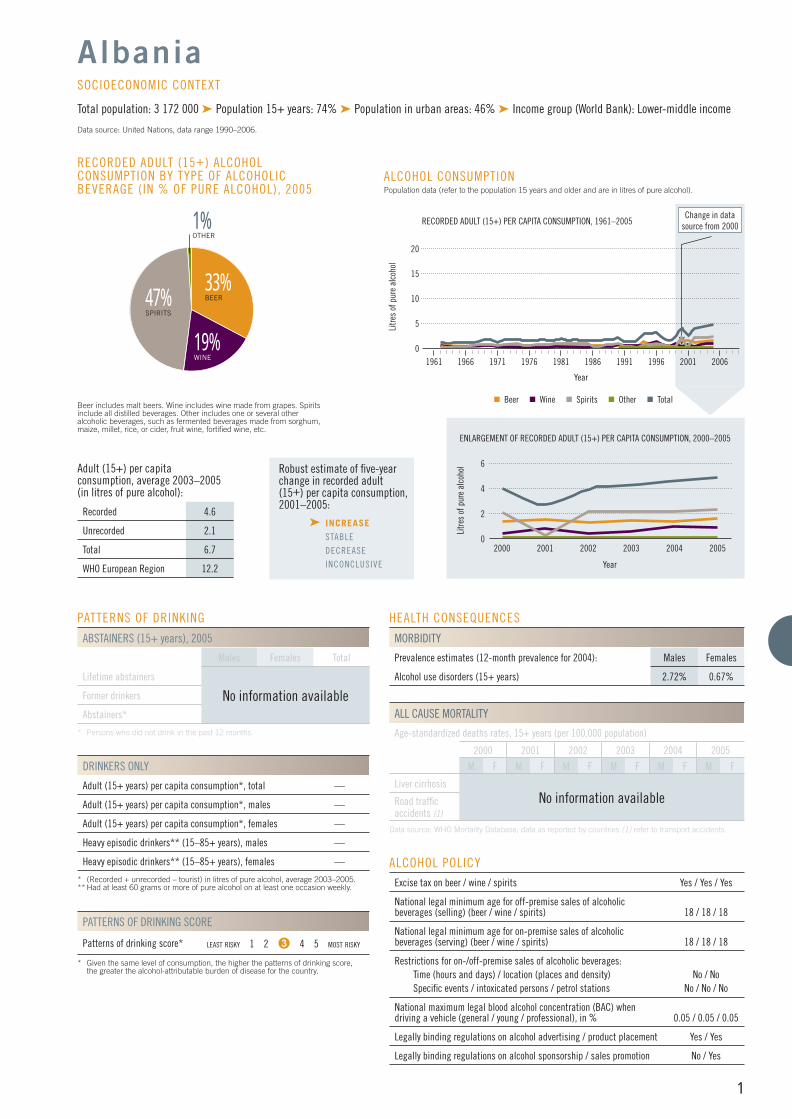
RECORDED ADULT (15+) ALCOHOL CONSUMPTION BY TYPE OF ALCOHOLIC BEVERAGE (IN % OF PURE ALCOHOL), 2005
Beer includes malt beers. Wine includes wine made from grapes. Spirits include all distilled beverages. Other includes one or several other alcoholic beverages, such as fermented beverages made from sorghum, maize, millet, rice, or cider, fruit wine, fortifi ed wine, etc.
Adult (15+) per capita consumption, average 2003–2005 (in litres of pure alcohol):
Recorded 4.6
Unrecorded 2.1
Total 6.7
WHO European Region 12.2
Albania
Total population: 3 172 000 ➤ Population 15+ years: 74% ➤ Population in urban areas: 46% ➤ Income group (World Bank): Lower-middle income
Data source: United Nations, data range 1990–2006.
SOCIOECONOMIC CONTEXT
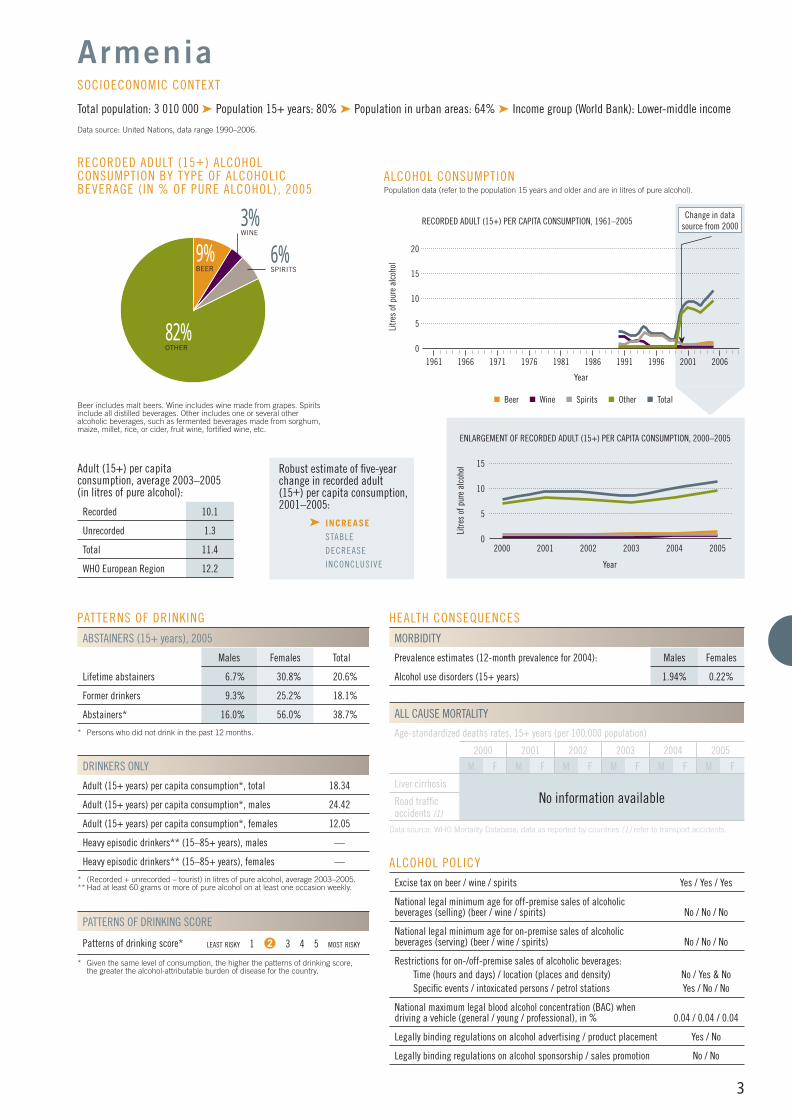
Robust estimate of fi ve-year change in recorded adult(15+) per capita consumption,2001–2005:
➤ INCREASE STABLE
DECREASE
INCONCLUSIVE
6
2000 2002
Litre
s of
pur
e al
coho
l
ENLARGEMENT OF RECORDED ADULT (15+) PER CAPITA CONSUMPTION, 2000–2005
Year
2003 20052001
ALCOHOL CONSUMPTION Population data (refer to the population 15 years and older and are in litres of pure alcohol).
1961 1966 1976
Litre
s of
pur
e al
coho
l
1991
RECORDED ADULT (15+) PER CAPITA CONSUMPTION, 1961–2005
Year
1971 1981 200119961986 2006
Change in data source from 2000
Beer Wine Spirits Other Total
15
5
10
20
2
2004
4
0
0
33%BEER
19%WINE
47%SPIRITS
1%OTHER

2
PATTERNS OF DRINKING
ABSTAINERS (15+ years), 2002
Males Females Total
Lifetime abstainers 17.2% 30.8% 23.5%
Former drinkers 14.8% 25.2% 20.0%
Abstainers* 32.0% 56.0% 43.5%
* Persons who did not drink in the past 12 months.
DRINKERS ONLY
Adult (15+ years) per capita consumption*, total 24.99
Adult (15+ years) per capita consumption*, males 27.71
Adult (15+ years) per capita consumption*, females 20.40
Heavy episodic drinkers** (15–85+ years), males —
Heavy episodic drinkers** (15–85+ years), females —
* (Recorded + unrecorded – tourist) in litres of pure alcohol, average 2003–2005.** Had at least 60 grams or more of pure alcohol on at least one occasion weekly.
PATTERNS OF DRINKING SCORE
Patterns of drinking score* LEAST RISKY 1 2 3 4 5 MOST RISKY
* Given the same level of consumption, the higher the patterns of drinking score, the greater the alcohol-attributable burden of disease for the country.
ALCOHOL POLICYExcise tax on beer / wine / spirits No / No / No
National legal minimum age for off-premise sales of alcoholic beverages (selling) (beer / wine / spirits) 18 / 18 / 18
National legal minimum age for on-premise sales of alcoholic beverages (serving) (beer / wine / spirits) 18 / 18 / 18
Restrictions for on-/off-premise sales of alcoholic beverages:Time (hours and days) / location (places and density) No / Yes & NoSpecifi c events / intoxicated persons / petrol stations Yes / Yes / No
National maximum legal blood alcohol concentration (BAC) when driving a vehicle (general / young / professional), in % 0.05 / 0.05 / 0.02
Legally binding regulations on alcohol advertising / product placement No / No
Legally binding regulations on alcohol sponsorship / sales promotion No / No
HEALTH CONSEQUENCES
MORBIDITY
Prevalence estimates (12-month prevalence for 2004): Males Females
Alcohol use disorders (15+ years) 4.25% 1.00%
ALL CAUSE MORTALITY
Age-standardized deaths rates, 15+ years (per 100,000 population)
2000 2001 2002 2003 2004 2005
M F M F M F M F M F M F
Liver cirrhosisNo information availableRoad traffi c
accidents (1)
Data source: WHO Mortality Database, data as reported by countries (1) refer to transport accidents.
31%BEER
44%WINE
25%SPIRITS
RECORDED ADULT (15+) ALCOHOL CONSUMPTION BY TYPE OF ALCOHOLIC BEVERAGE (IN % OF PURE ALCOHOL), 2005
Beer includes malt beers. Wine includes wine made from grapes. Spirits include all distilled beverages. Other includes one or several other alcoholic beverages, such as fermented beverages made from sorghum, maize, millet, rice, or cider, fruit wine, fortifi ed wine, etc.
Adult (15+) per capita consumption, average 2003–2005 (in litres of pure alcohol):
Recorded 14.1
Unrecorded 1.4
Total 15.5
WHO European Region 12.2
Andorra
Total population: 74 000 ➤ Population 15+ years: 86% ➤ Population in urban areas: 93% ➤ Income group (World Bank): High income
Data source: United Nations, data range 1990–2006.
SOCIOECONOMIC CONTEXT
Robust estimate of fi ve-year change in recorded adult(15+) per capita consumption,2001–2005:
INCREASE
STABLE
DECREASE
INCONCLUSIVE
No information available
20
2000 2002
Litre
s of
pur
e al
coho
lENLARGEMENT OF RECORDED ADULT (15+) PER CAPITA CONSUMPTION, 2000–2006
Year
2003 20062001
ALCOHOL CONSUMPTION Population data (refer to the population 15 years and older and are in litres of pure alcohol).
1961 1966 1976Li
tres
of p
ure
alco
hol
1991
RECORDED ADULT (15+) PER CAPITA CONSUMPTION, 1961–2006
Year
1971 1981 200119961986 2006
Beer Wine Spirits Total
15
5
10
20
2004
10
2005
15
5
0
0
3
PATTERNS OF DRINKING
ABSTAINERS (15+ years), 2005
Males Females Total
Lifetime abstainers 6.7% 30.8% 20.6%
Former drinkers 9.3% 25.2% 18.1%
Abstainers* 16.0% 56.0% 38.7%
* Persons who did not drink in the past 12 months.
DRINKERS ONLY
Adult (15+ years) per capita consumption*, total 18.34
Adult (15+ years) per capita consumption*, males 24.42
Adult (15+ years) per capita consumption*, females 12.05
Heavy episodic drinkers** (15–85+ years), males —
Heavy episodic drinkers** (15–85+ years), females —
* (Recorded + unrecorded – tourist) in litres of pure alcohol, average 2003–2005.** Had at least 60 grams or more of pure alcohol on at least one occasion weekly.
PATTERNS OF DRINKING SCORE
Patterns of drinking score* LEAST RISKY 1 2 3 4 5 MOST RISKY
* Given the same level of consumption, the higher the patterns of drinking score, the greater the alcohol-attributable burden of disease for the country.
ALCOHOL POLICYExcise tax on beer / wine / spirits Yes / Yes / Yes
National legal minimum age for off-premise sales of alcoholic beverages (selling) (beer / wine / spirits) No / No / No
National legal minimum age for on-premise sales of alcoholic beverages (serving) (beer / wine / spirits) No / No / No
Restrictions for on-/off-premise sales of alcoholic beverages:Time (hours and days) / location (places and density) No / Yes & NoSpecifi c events / intoxicated persons / petrol stations Yes / No / No
National maximum legal blood alcohol concentration (BAC) when driving a vehicle (general / young / professional), in % 0.04 / 0.04 / 0.04
Legally binding regulations on alcohol advertising / product placement Yes / No
Legally binding regulations on alcohol sponsorship / sales promotion No / No
HEALTH CONSEQUENCES
MORBIDITY
Prevalence estimates (12-month prevalence for 2004): Males Females
Alcohol use disorders (15+ years) 1.94% 0.22%
ALL CAUSE MORTALITY
Age-standardized deaths rates, 15+ years (per 100,000 population)
2000 2001 2002 2003 2004 2005
M F M F M F M F M F M F
Liver cirrhosisNo information availableRoad traffi c
accidents (1)
Data source: WHO Mortality Database, data as reported by countries (1) refer to transport accidents.
9%BEER
82%OTHER
6%SPIRITS
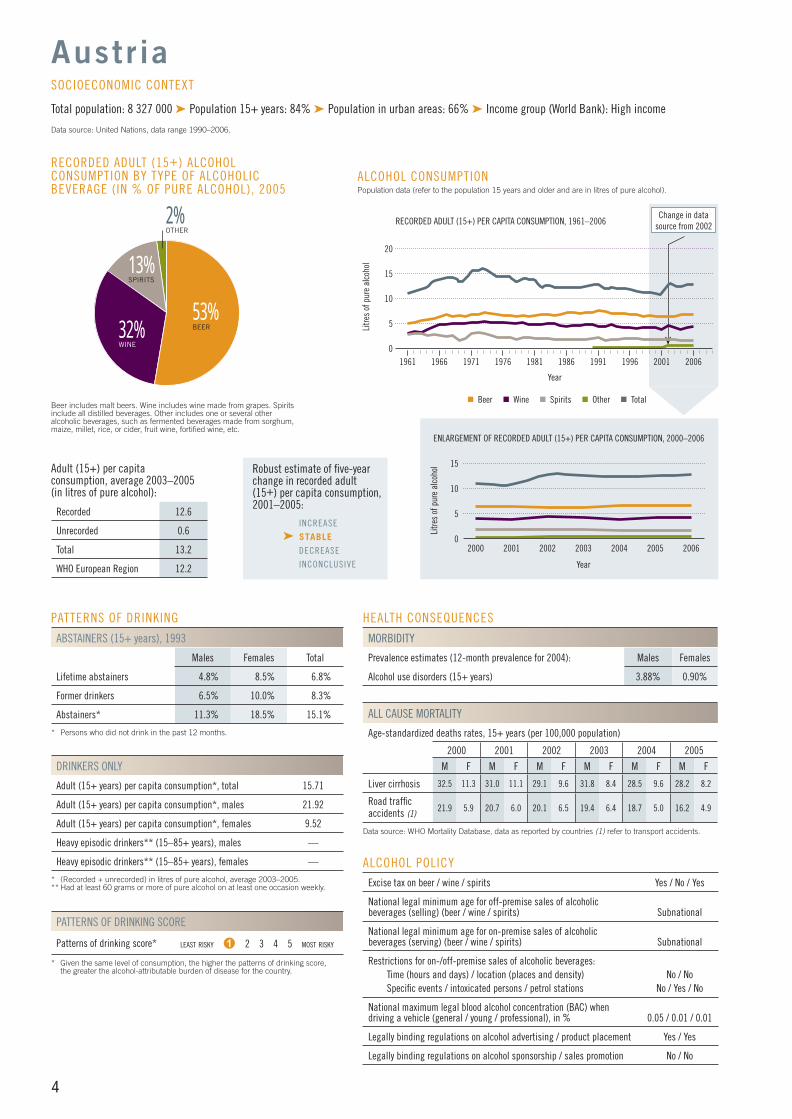
RECORDED ADULT (15+) ALCOHOL CONSUMPTION BY TYPE OF ALCOHOLIC BEVERAGE (IN % OF PURE ALCOHOL), 2005
Beer includes malt beers. Wine includes wine made from grapes. Spirits include all distilled beverages. Other includes one or several other alcoholic beverages, such as fermented beverages made from sorghum, maize, millet, rice, or cider, fruit wine, fortifi ed wine, etc.
Adult (15+) per capita consumption, average 2003–2005 (in litres of pure alcohol):
Recorded 10.1
Unrecorded 1.3
Total 11.4
WHO European Region 12.2
Armenia
Total population: 3 010 000 ➤ Population 15+ years: 80% ➤ Population in urban areas: 64% ➤ Income group (World Bank): Lower-middle income
Data source: United Nations, data range 1990–2006.
SOCIOECONOMIC CONTEXT
Robust estimate of fi ve-year change in recorded adult(15+) per capita consumption,2001–2005:
➤ INCREASE STABLE
DECREASE
INCONCLUSIVE
15
2000 2002
Litre
s of
pur
e al
coho
l
ENLARGEMENT OF RECORDED ADULT (15+) PER CAPITA CONSUMPTION, 2000–2005
Year
2003 20052001
ALCOHOL CONSUMPTION Population data (refer to the population 15 years and older and are in litres of pure alcohol).
1961 1966 1976
Litre
s of
pur
e al
coho
l
1991
RECORDED ADULT (15+) PER CAPITA CONSUMPTION, 1961–2005
Year
1971 1981 200119961986 2006
Change in data source from 2000
Beer Wine Spirits Other Total
15
5
10
20
10
2004
5
0
0
3%WINE
4
PATTERNS OF DRINKING
ABSTAINERS (15+ years), 1993
Males Females Total
Lifetime abstainers 4.8% 8.5% 6.8%
Former drinkers 6.5% 10.0% 8.3%
Abstainers* 11.3% 18.5% 15.1%
* Persons who did not drink in the past 12 months.
DRINKERS ONLY
Adult (15+ years) per capita consumption*, total 15.71
Adult (15+ years) per capita consumption*, males 21.92
Adult (15+ years) per capita consumption*, females 9.52
Heavy episodic drinkers** (15–85+ years), males —
Heavy episodic drinkers** (15–85+ years), females —
* (Recorded + unrecorded) in litres of pure alcohol, average 2003–2005.** Had at least 60 grams or more of pure alcohol on at least one occasion weekly.
PATTERNS OF DRINKING SCORE
Patterns of drinking score* LEAST RISKY 1 2 3 4 5 MOST RISKY
* Given the same level of consumption, the higher the patterns of drinking score, the greater the alcohol-attributable burden of disease for the country.
ALCOHOL POLICYExcise tax on beer / wine / spirits Yes / No / Yes
National legal minimum age for off-premise sales of alcoholic beverages (selling) (beer / wine / spirits) Subnational
National legal minimum age for on-premise sales of alcoholic beverages (serving) (beer / wine / spirits) Subnational
Restrictions for on-/off-premise sales of alcoholic beverages:Time (hours and days) / location (places and density) No / NoSpecifi c events / intoxicated persons / petrol stations No / Yes / No
National maximum legal blood alcohol concentration (BAC) when driving a vehicle (general / young / professional), in % 0.05 / 0.01 / 0.01
Legally binding regulations on alcohol advertising / product placement Yes / Yes
Legally binding regulations on alcohol sponsorship / sales promotion No / No
HEALTH CONSEQUENCES
MORBIDITY
Prevalence estimates (12-month prevalence for 2004): Males Females
Alcohol use disorders (15+ years) 3.88% 0.90%
ALL CAUSE MORTALITY
Age-standardized deaths rates, 15+ years (per 100,000 population)
2000 2001 2002 2003 2004 2005
M F M F M F M F M F M F
Liver cirrhosis 32.5 11.3 31.0 11.1 29.1 9.6 31.8 8.4 28.5 9.6 28.2 8.2
Road traffi c accidents (1)
21.9 5.9 20.7 6.0 20.1 6.5 19.4 6.4 18.7 5.0 16.2 4.9
Data source: WHO Mortality Database, data as reported by countries (1) refer to transport accidents.
53%BEER
13%SPIRITS
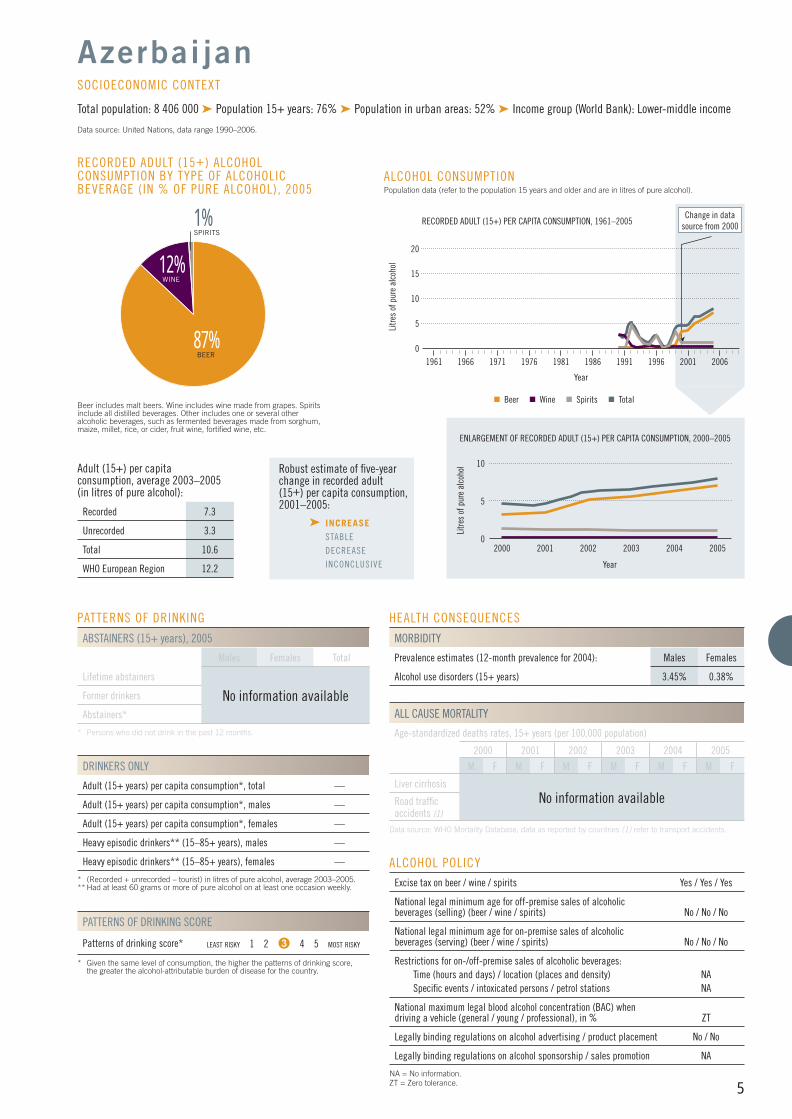
RECORDED ADULT (15+) ALCOHOL CONSUMPTION BY TYPE OF ALCOHOLIC BEVERAGE (IN % OF PURE ALCOHOL), 2005
Beer includes malt beers. Wine includes wine made from grapes. Spirits include all distilled beverages. Other includes one or several other alcoholic beverages, such as fermented beverages made from sorghum, maize, millet, rice, or cider, fruit wine, fortifi ed wine, etc.
Adult (15+) per capita consumption, average 2003–2005 (in litres of pure alcohol):
Recorded 12.6
Unrecorded 0.6
Total 13.2
WHO European Region 12.2
Austr ia
Total population: 8 327 000 ➤ Population 15+ years: 84% ➤ Population in urban areas: 66% ➤ Income group (World Bank): High income
Data source: United Nations, data range 1990–2006.
SOCIOECONOMIC CONTEXT
Robust estimate of fi ve-year change in recorded adult(15+) per capita consumption,2001–2005:
INCREASE
➤ STABLE DECREASE
INCONCLUSIVE
32%WINE
2000 2002 2004
Litre
s of
pur
e al
coho
lENLARGEMENT OF RECORDED ADULT (15+) PER CAPITA CONSUMPTION, 2000–2006
Year
2003 20062001
ALCOHOL CONSUMPTION Population data (refer to the population 15 years and older and are in litres of pure alcohol).
1961 1966 1976Li
tres
of p
ure
alco
hol
1991
RECORDED ADULT (15+) PER CAPITA CONSUMPTION, 1961–2006
Year
1971 1981 200119961986 2006
Change in data source from 2002
Beer Wine Spirits Other Total
15
5
10
20
15
10
5
20050
0
2%OTHER
5
PATTERNS OF DRINKING
ABSTAINERS (15+ years), 2005
Males Females Total
Lifetime abstainers
No information availableFormer drinkers
Abstainers*
* Persons who did not drink in the past 12 months.
DRINKERS ONLY
Adult (15+ years) per capita consumption*, total —
Adult (15+ years) per capita consumption*, males —
Adult (15+ years) per capita consumption*, females —
Heavy episodic drinkers** (15–85+ years), males —
Heavy episodic drinkers** (15–85+ years), females —
* (Recorded + unrecorded – tourist) in litres of pure alcohol, average 2003–2005.** Had at least 60 grams or more of pure alcohol on at least one occasion weekly.
PATTERNS OF DRINKING SCORE
Patterns of drinking score* LEAST RISKY 1 2 3 4 5 MOST RISKY
* Given the same level of consumption, the higher the patterns of drinking score, the greater the alcohol-attributable burden of disease for the country.
ALCOHOL POLICYExcise tax on beer / wine / spirits Yes / Yes / Yes
National legal minimum age for off-premise sales of alcoholic beverages (selling) (beer / wine / spirits) No / No / No
National legal minimum age for on-premise sales of alcoholic beverages (serving) (beer / wine / spirits) No / No / No
Restrictions for on-/off-premise sales of alcoholic beverages:Time (hours and days) / location (places and density) NASpecifi c events / intoxicated persons / petrol stations NA
National maximum legal blood alcohol concentration (BAC) when driving a vehicle (general / young / professional), in % ZT
Legally binding regulations on alcohol advertising / product placement No / No
Legally binding regulations on alcohol sponsorship / sales promotion NA
NA = No information.ZT = Zero tolerance.
HEALTH CONSEQUENCES
MORBIDITY
Prevalence estimates (12-month prevalence for 2004): Males Females
Alcohol use disorders (15+ years) 3.45% 0.38%
ALL CAUSE MORTALITY
Age-standardized deaths rates, 15+ years (per 100,000 population)
2000 2001 2002 2003 2004 2005
M F M F M F M F M F M F
Liver cirrhosisNo information availableRoad traffi c
accidents (1)
Data source: WHO Mortality Database, data as reported by countries (1) refer to transport accidents.
RECORDED ADULT (15+) ALCOHOL CONSUMPTION BY TYPE OF ALCOHOLIC BEVERAGE (IN % OF PURE ALCOHOL), 2005
Beer includes malt beers. Wine includes wine made from grapes. Spirits include all distilled beverages. Other includes one or several other alcoholic beverages, such as fermented beverages made from sorghum, maize, millet, rice, or cider, fruit wine, fortifi ed wine, etc.
Adult (15+) per capita consumption, average 2003–2005 (in litres of pure alcohol):
Recorded 7.3
Unrecorded 3.3
Total 10.6
WHO European Region 12.2
Azerbai jan
Total population: 8 406 000 ➤ Population 15+ years: 76% ➤ Population in urban areas: 52% ➤ Income group (World Bank): Lower-middle income
Data source: United Nations, data range 1990–2006.
SOCIOECONOMIC CONTEXT
Robust estimate of fi ve-year change in recorded adult(15+) per capita consumption,2001–2005:
➤ INCREASE STABLE
DECREASE
INCONCLUSIVE
87%BEER
10
2000 2002
Litre
s of
pur
e al
coho
l
ENLARGEMENT OF RECORDED ADULT (15+) PER CAPITA CONSUMPTION, 2000–2005
Year
2003 20052001
ALCOHOL CONSUMPTION Population data (refer to the population 15 years and older and are in litres of pure alcohol).
1961 1966 1976
Litre
s of
pur
e al
coho
l
1991
RECORDED ADULT (15+) PER CAPITA CONSUMPTION, 1961–2005
Year
1971 1981 200119961986 2006
Change in data source from 2000
Beer Wine Spirits Total
15
5
10
20
2004
5
0
0
1%SPIRITS
12%WINE

6
PATTERNS OF DRINKING
ABSTAINERS (15+ years), 2005
Males Females Total
Lifetime abstainers 4.7% 17.2% 11.6%
Former drinkers 6.3% 11.8% 9.4%
Abstainers* 11.0% 29.0% 21.0%
* Persons who did not drink in the past 12 months.
DRINKERS ONLY
Adult (15+ years) per capita consumption*, total 19.15
Adult (15+ years) per capita consumption*, males 27.95
Adult (15+ years) per capita consumption*, females 11.30
Heavy episodic drinkers** (15–85+ years), males —
Heavy episodic drinkers** (15–85+ years), females —
* (Recorded + unrecorded) in litres of pure alcohol, average 2003–2005.** Had at least 60 grams or more of pure alcohol on at least one occasion weekly.
PATTERNS OF DRINKING SCORE
Patterns of drinking score* LEAST RISKY 1 2 3 4 5 MOST RISKY
* Given the same level of consumption, the higher the patterns of drinking score, the greater the alcohol-attributable burden of disease for the country.
ALCOHOL POLICYExcise tax on beer / wine / spirits Yes / Yes / Yes
National legal minimum age for off-premise sales of alcoholic beverages (selling) (beer / wine / spirits) 18 / 18 / 18
National legal minimum age for on-premise sales of alcoholic beverages (serving) (beer / wine / spirits) 18 / 18 / 18
Restrictions for on-/off-premise sales of alcoholic beverages:Time (hours and days) / location (places and density) Yes & No / Yes & NoSpecifi c events / intoxicated persons / petrol stations Yes / No / No
National maximum legal blood alcohol concentration (BAC) when driving a vehicle (general / young / professional), in % 0.05 / 0.05 / 0.05
Legally binding regulations on alcohol advertising / product placement Yes / No
Legally binding regulations on alcohol sponsorship / sales promotion No / No
HEALTH CONSEQUENCES
MORBIDITY
Prevalence estimates (12-month prevalence for 2004): Males Females
Alcohol use disorders (15+ years) 11.43% 1.69%
ALL CAUSE MORTALITY
Age-standardized deaths rates, 15+ years (per 100,000 population)
2000 2001 2002 2003 2004 2005
M F M F M F M F M F M F
Liver cirrhosis 22.6 11.2 24.7 12.1 — — — — — — — —
Road traffi c accidents (1)
29.6 8.0 29.9 7.5 42.9 11.2 44.0 11.2 — — — —
Data source: WHO Mortality Database, data as reported by countries (1) refer to transport accidents.
20%BEER
RECORDED ADULT (15+) ALCOHOL CONSUMPTION BY TYPE OF ALCOHOLIC BEVERAGE (IN % OF PURE ALCOHOL), 2005
Beer includes malt beers. Wine includes wine made from grapes. Spirits include all distilled beverages. Other includes one or several other alcoholic beverages, such as fermented beverages made from sorghum, maize, millet, rice, or cider, fruit wine, fortifi ed wine, etc.
Adult (15+) per capita consumption, average 2003–2005 (in litres of pure alcohol):
Recorded 11.2
Unrecorded 3.9
Total 15.1
WHO European Region 12.2
Belarus
Total population: 9 742 000 ➤ Population 15+ years: 85% ➤ Population in urban areas: 73% ➤ Income group (World Bank): Upper-middle income
Data source: United Nations, data range 1990–2006.
SOCIOECONOMIC CONTEXT
Robust estimate of fi ve-year change in recorded adult(15+) per capita consumption,2001–2005:
INCREASE
➤ STABLE DECREASE
INCONCLUSIVE
43%SPIRITS
2000 2002 2004
Litre
s of
pur
e al
coho
lENLARGEMENT OF RECORDED ADULT (15+) PER CAPITA CONSUMPTION, 2000–2007
Year
2003 20072001
ALCOHOL CONSUMPTION Population data (refer to the population 15 years and older and are in litres of pure alcohol).
1961 1966 1976Li
tres
of p
ure
alco
hol
1991
RECORDED ADULT (15+) PER CAPITA CONSUMPTION, 1961–2007
Year
1971 1981 200119961986 2006
Change in data source from 2000
Beer Wine Spirits Other Total
15
5
10
20
15
10
5
2005 2006
0
0
28%OTHER 9%
WINE
7
PATTERNS OF DRINKING
ABSTAINERS (15+ years), 2003
Males Females Total
Lifetime abstainers 3.4% 12.5% 8.2%
Former drinkers 7.7% 7.6% 7.6%
Abstainers* 11.1% 20.1% 15.8%
* Persons who did not drink in the past 12 months.
DRINKERS ONLY
Adult (15+ years) per capita consumption*, total 12.79
Adult (15+ years) per capita consumption*, males 17.54
Adult (15+ years) per capita consumption*, females 7.83
Heavy episodic drinkers** (15–85+ years), males —
Heavy episodic drinkers** (15–85+ years), females —
* (Recorded + unrecorded – tourist) in litres of pure alcohol, average 2003–2005.** Had at least 60 grams or more of pure alcohol on at least one occasion weekly.
PATTERNS OF DRINKING SCORE
Patterns of drinking score* LEAST RISKY 1 2 3 4 5 MOST RISKY
* Given the same level of consumption, the higher the patterns of drinking score, the greater the alcohol-attributable burden of disease for the country.
ALCOHOL POLICYExcise tax on beer / wine / spirits Yes / Yes / Yes
National legal minimum age for off-premise sales of alcoholic beverages (selling) (beer / wine / spirits) No / No / 18
National legal minimum age for on-premise sales of alcoholic beverages (serving) (beer / wine / spirits) 16 / 16 / 18
Restrictions for on-/off-premise sales of alcoholic beverages:Time (hours and days) / location (places and density) Yes & No / Yes & NoSpecifi c events / intoxicated persons / petrol stations Yes / Yes / No
National maximum legal blood alcohol concentration (BAC) when driving a vehicle (general / young / professional), in % 0.05 / 0.05 / 0.05
Legally binding regulations on alcohol advertising / product placement Yes / No
Legally binding regulations on alcohol sponsorship / sales promotion No / No
HEALTH CONSEQUENCES
MORBIDITY
Prevalence estimates (12-month prevalence for 2004): Males Females
Alcohol use disorders (15+ years) 2.03% 0.84%
ALL CAUSE MORTALITY
Age-standardized deaths rates, 15+ years (per 100,000 population)
2000 2001 2002 2003 2004 2005
M F M F M F M F M F M F
Liver cirrhosisNo information availableRoad traffi c
accidents (1)
Data source: WHO Mortality Database, data as reported by countries (1) refer to transport accidents.
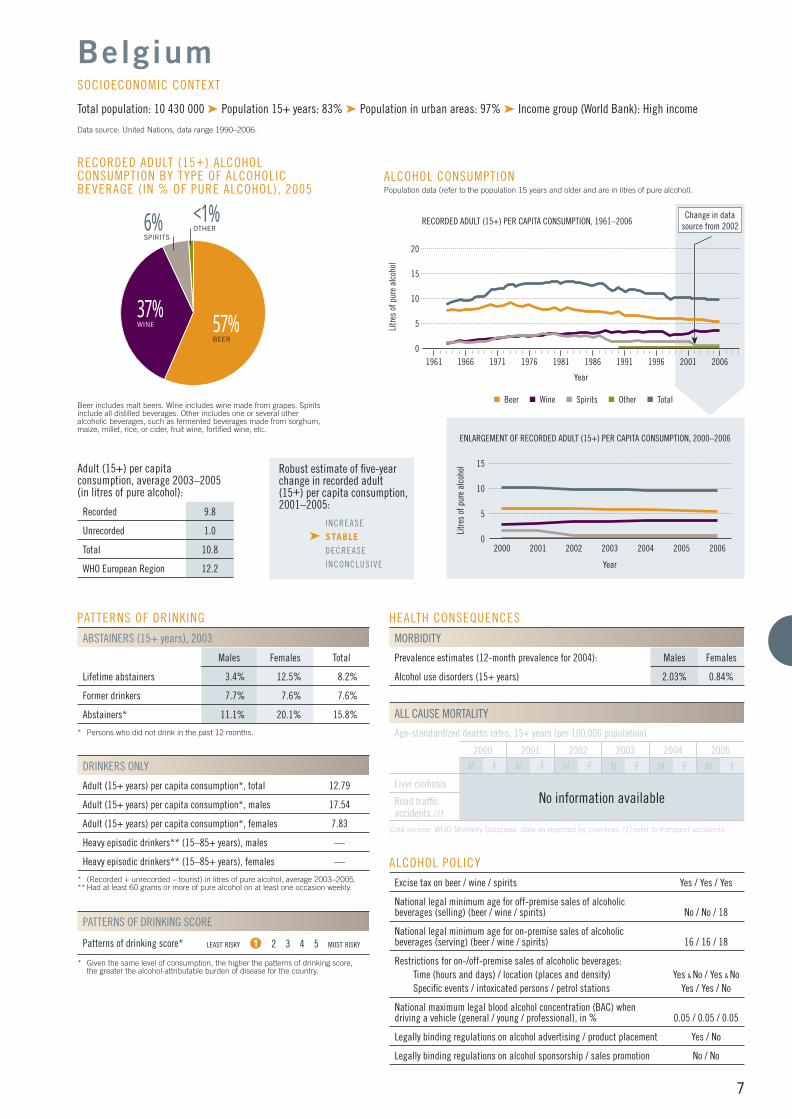
57%BEER
37%WINE
6%SPIRITS
RECORDED ADULT (15+) ALCOHOL CONSUMPTION BY TYPE OF ALCOHOLIC BEVERAGE (IN % OF PURE ALCOHOL), 2005
Beer includes malt beers. Wine includes wine made from grapes. Spirits include all distilled beverages. Other includes one or several other alcoholic beverages, such as fermented beverages made from sorghum, maize, millet, rice, or cider, fruit wine, fortifi ed wine, etc.
Adult (15+) per capita consumption, average 2003–2005 (in litres of pure alcohol):
Recorded 9.8
Unrecorded 1.0
Total 10.8
WHO European Region 12.2
Belgium
Total population: 10 430 000 ➤ Population 15+ years: 83% ➤ Population in urban areas: 97% ➤ Income group (World Bank): High income
Data source: United Nations, data range 1990–2006.
SOCIOECONOMIC CONTEXT
Robust estimate of fi ve-year change in recorded adult(15+) per capita consumption,2001–2005:
INCREASE
➤ STABLE DECREASE
INCONCLUSIVE
<1%OTHER
15
2000 2002
Litre
s of
pur
e al
coho
l
ENLARGEMENT OF RECORDED ADULT (15+) PER CAPITA CONSUMPTION, 2000–2006
Year
2003 20062001
ALCOHOL CONSUMPTION Population data (refer to the population 15 years and older and are in litres of pure alcohol).
1961 1966 1976
Litre
s of
pur
e al
coho
l
1991
RECORDED ADULT (15+) PER CAPITA CONSUMPTION, 1961–2006
Year
1971 1981 200119961986 2006
Change in data source from 2002
Beer Wine Spirits Other Total
15
5
10
20
10
2004
5
2005
0
0

8
PATTERNS OF DRINKING
ABSTAINERS (15+ years), 2003
Males Females Total
Lifetime abstainers 54.2% 84.9% 70.2%
Former drinkers 15.9% 9.6% 12.6%
Abstainers* 70.1% 94.5% 82.8%
* Persons who did not drink in the past 12 months.
DRINKERS ONLY
Adult (15+ years) per capita consumption*, total 55.99
Adult (15+ years) per capita consumption*, males 60.25
Adult (15+ years) per capita consumption*, females 32.98
Heavy episodic drinkers** (15–85+ years), males, 2003 7.1%
Heavy episodic drinkers** (15–85+ years), females, 2003 0.0%
* (Recorded + unrecorded) in litres of pure alcohol, average 2003–2005.** Had at least 60 grams or more of pure alcohol on at least one occasion weekly.
PATTERNS OF DRINKING SCORE
Patterns of drinking score* LEAST RISKY 1 2 3 4 5 MOST RISKY
* Given the same level of consumption, the higher the patterns of drinking score, the greater the alcohol-attributable burden of disease for the country.
ALCOHOL POLICYExcise tax on beer / wine / spirits NA
National legal minimum age for off-premise sales of alcoholic beverages (selling) (beer / wine / spirits) 16 / 16 / 16*
National legal minimum age for on-premise sales of alcoholic beverages (serving) (beer / wine / spirits) 16 / 16 / 16*
Restrictions for on-/off-premise sales of alcoholic beverages:Time (hours and days) / location (places and density) No* / NA / NASpecifi c events / intoxicated persons / petrol stations NA
National maximum legal blood alcohol concentration (BAC) when driving a vehicle (general / young / professional), in % 0.03 / 0.03 / 0.03*
Legally binding regulations on alcohol advertising / product placement Yes* / NA
Legally binding regulations on alcohol sponsorship / sales promotion NA
* Data refers to the Federation of Bosnia and HerzegovinaNA = No information.
HEALTH CONSEQUENCES
MORBIDITY
Prevalence estimates (12-month prevalence for 2004): Males Females
Alcohol use disorders (15+ years) 5.19% 1.23%
ALL CAUSE MORTALITY
Age-standardized deaths rates, 15+ years (per 100,000 population)
2000 2001 2002 2003 2004 2005
M F M F M F M F M F M F
Liver cirrhosisNo information availableRoad traffi c
accidents (1)
Data source: WHO Mortality Database, data as reported by countries (1) refer to transport accidents.
73% SPIRITS
RECORDED ADULT (15+) ALCOHOL CONSUMPTION BY TYPE OF ALCOHOLIC BEVERAGE (IN % OF PURE ALCOHOL), 2005
Beer includes malt beers. Wine includes wine made from grapes. Spirits include all distilled beverages. Other includes one or several other alcoholic beverages, such as fermented beverages made from sorghum, maize, millet, rice, or cider, fruit wine, fortifi ed wine, etc.
Adult (15+) per capita consumption, average 2003–2005 (in litres of pure alcohol):
Recorded 9.6
Unrecorded 0.0
Total 9.6
WHO European Region 12.2
Bosnia and Herzegovina
Total population: 3 926 000 ➤ Population 15+ years: 83% ➤ Population in urban areas: 46% ➤ Income group (World Bank): Lower-middle income
Data source: United Nations, data range 1990–2006.
SOCIOECONOMIC CONTEXT
Robust estimate of fi ve-year change in recorded adult(15+) per capita consumption,2001–2005:
INCREASE
➤ STABLE DECREASE
INCONCLUSIVE
15
2000 2002
Litre
s of
pur
e al
coho
lENLARGEMENT OF RECORDED ADULT (15+) PER CAPITA CONSUMPTION, 2000–2005
Year
2003 20052001
ALCOHOL CONSUMPTION Population data (refer to the population 15 years and older and are in litres of pure alcohol).
1961 1966 1976Li
tres
of p
ure
alco
hol
1991
RECORDED ADULT (15+) PER CAPITA CONSUMPTION, 1961–2005
Year
1971 1981 200119961986 2006
Beer Wine Spirits Total
15
5
10
20
2004
10
5
0
0
23%BEER
4%WINE

9
PATTERNS OF DRINKING
ABSTAINERS (15+ years), 2006
Males Females Total
Lifetime abstainers 8.5% 31.5% 20.5%
Former drinkers 5.7% 6.7% 6.3%
Abstainers* 14.2% 38.2% 26.8%
* Persons who did not drink in the past 12 months.
DRINKERS ONLY
Adult (15+ years) per capita consumption*, total 16.99
Adult (15+ years) per capita consumption*, males 22.87
Adult (15+ years) per capita consumption*, females 9.25
Heavy episodic drinkers** (15–85+ years), males —
Heavy episodic drinkers** (15–85+ years), females —
* (Recorded + unrecorded) in litres of pure alcohol, average 2003–2005.** Had at least 60 grams or more of pure alcohol on at least one occasion weekly.
PATTERNS OF DRINKING SCORE
Patterns of drinking score* LEAST RISKY 1 2 3 4 5 MOST RISKY
* Given the same level of consumption, the higher the patterns of drinking score, the greater the alcohol-attributable burden of disease for the country.
ALCOHOL POLICYExcise tax on beer / wine / spirits Yes / No / Yes
National legal minimum age for off-premise sales of alcoholic beverages (selling) (beer / wine / spirits) 18 / 18 / 18
National legal minimum age for on-premise sales of alcoholic beverages (serving) (beer / wine / spirits) 18 / 18 / 18
Restrictions for on-/off-premise sales of alcoholic beverages:Time (hours and days) / location (places and density) No / Yes & NoSpecifi c events / intoxicated persons / petrol stations Yes / Yes / No
National maximum legal blood alcohol concentration (BAC) when driving a vehicle (general / young / professional), in % 0.05 / 0.02 / 0.05
Legally binding regulations on alcohol advertising / product placement Yes / Yes
Legally binding regulations on alcohol sponsorship / sales promotion Yes / Yes
HEALTH CONSEQUENCES
MORBIDITY
Prevalence estimates (12-month prevalence for 2004): Males Females
Alcohol use disorders (15+ years) 3.87% 0.91%
ALL CAUSE MORTALITY
Age-standardized deaths rates, 15+ years (per 100,000 population)
2000 2001 2002 2003 2004 2005
M F M F M F M F M F M F
Liver cirrhosis 29.1 6.8 29.4 6.7 26.5 6.7 25.7 5.8 27.2 6.4 — —
Road traffi c accidents (1)
19.9 5.9 22.6 5.8 20.8 5.9 20.0 5.2 20.6 4.7 — —
Data source: WHO Mortality Database, data as reported by countries (1) refer to transport accidents.
32%BEER45%
SPIRITS
22%WINE
RECORDED ADULT (15+) ALCOHOL CONSUMPTION BY TYPE OF ALCOHOLIC BEVERAGE (IN % OF PURE ALCOHOL), 2005
Beer includes malt beers. Wine includes wine made from grapes. Spirits include all distilled beverages. Other includes one or several other alcoholic beverages, such as fermented beverages made from sorghum, maize, millet, rice, or cider, fruit wine, fortifi ed wine, etc.
Adult (15+) per capita consumption, average 2003–2005 (in litres of pure alcohol):
Recorded 11.2
Unrecorded 1.2
Total 12.4
WHO European Region 12.2
Bulgaria
Total population: 7 693 000 ➤ Population 15+ years: 86% ➤ Population in urban areas: 70% ➤ Income group (World Bank): Upper-middle income
Data source: United Nations, data range 1990–2006.
SOCIOECONOMIC CONTEXT
Robust estimate of fi ve-year change in recorded adult(15+) per capita consumption,2001–2005:
INCREASE
➤ STABLE DECREASE
INCONCLUSIVE
<1%OTHER
15
2000 2002
Litre
s of
pur
e al
coho
l
ENLARGEMENT OF RECORDED ADULT (15+) PER CAPITA CONSUMPTION, 2000–2005
Year
2003 20052001
ALCOHOL CONSUMPTION Population data (refer to the population 15 years and older and are in litres of pure alcohol).
1961 1966 1976
Litre
s of
pur
e al
coho
l
1991
RECORDED ADULT (15+) PER CAPITA CONSUMPTION, 1961–2005
Year
1971 1981 200119961986 2006
Change in data source from 2000
Beer Wine Spirits Other Total
15
5
10
20
2004
10
5
0
0
10
PATTERNS OF DRINKING
ABSTAINERS (15+ years), 2003
Males Females Total
Lifetime abstainers 11.7% 31.3% 22.1%
Former drinkers 18.3% 22.4% 20.5%
Abstainers* 30.0% 53.7% 42.6%
* Persons who did not drink in the past 12 months.
DRINKERS ONLY
Adult (15+ years) per capita consumption*, total 26.32
Adult (15+ years) per capita consumption*, males 31.98
Adult (15+ years) per capita consumption*, females 18.77
Heavy episodic drinkers** (15–85+ years), males, 2003 14.5%
Heavy episodic drinkers** (15–85+ years), females, 2003 0.8%
* (Recorded + unrecorded – tourist) in litres of pure alcohol, average 2003–2005.** Had at least 60 grams or more of pure alcohol on at least one occasion weekly.
PATTERNS OF DRINKING SCORE
Patterns of drinking score* LEAST RISKY 1 2 3 4 5 MOST RISKY
* Given the same level of consumption, the higher the patterns of drinking score, the greater the alcohol-attributable burden of disease for the country.
ALCOHOL POLICYExcise tax on beer / wine / spirits Yes / No / Yes
National legal minimum age for off-premise sales of alcoholic beverages (selling) (beer / wine / spirits) 18 / 18 / 18
National legal minimum age for on-premise sales of alcoholic beverages (serving) (beer / wine / spirits) 18 / 18 / 18
Restrictions for on-/off-premise sales of alcoholic beverages:Time (hours and days) / location (places and density) No / Yes & NoSpecifi c events / intoxicated persons / petrol stations Yes / Yes / No
National maximum legal blood alcohol concentration (BAC) when driving a vehicle (general / young / professional), in % 0.05 / ZT / ZT
Legally binding regulations on alcohol advertising / product placement Yes / No
Legally binding regulations on alcohol sponsorship / sales promotion No / No
ZT = Zero tolerance.
HEALTH CONSEQUENCES
MORBIDITY
Prevalence estimates (12-month prevalence for 2004): Males Females
Alcohol use disorders (15+ years) 4.88% 1.11%
ALL CAUSE MORTALITY
Age-standardized deaths rates, 15+ years (per 100,000 population)
2000 2001 2002 2003 2004 2005
M F M F M F M F M F M F
Liver cirrhosis 53.9 17.0 46.9 13.3 45.7 12.3 38.8 12.8 39.6 10.7 38.8 11.1
Road traffi c accidents (1)
26.9 5.2 23.6 5.6 25.2 5.2 29.2 6.9 27.2 5.9 25.6 6.0
Data source: WHO Mortality Database, data as reported by countries (1) refer to transport accidents.
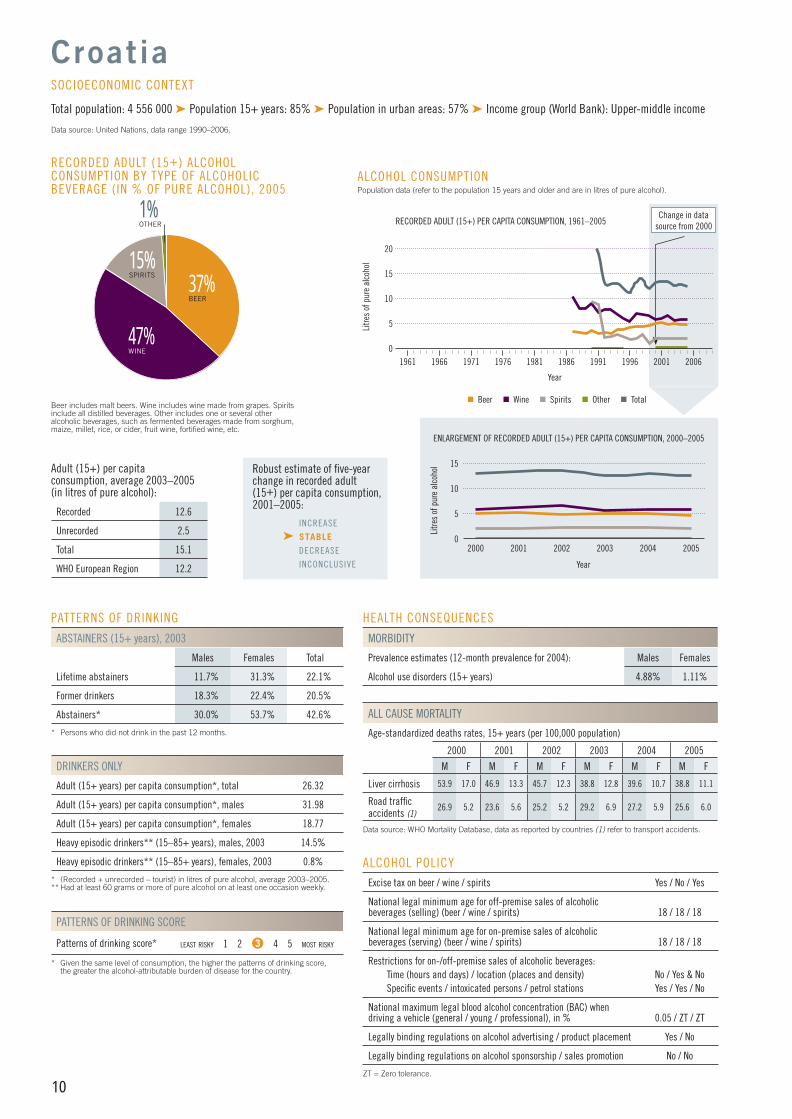
47%WINE
RECORDED ADULT (15+) ALCOHOL CONSUMPTION BY TYPE OF ALCOHOLIC BEVERAGE (IN % OF PURE ALCOHOL), 2005
Beer includes malt beers. Wine includes wine made from grapes. Spirits include all distilled beverages. Other includes one or several other alcoholic beverages, such as fermented beverages made from sorghum, maize, millet, rice, or cider, fruit wine, fortifi ed wine, etc.
Adult (15+) per capita consumption, average 2003–2005 (in litres of pure alcohol):
Recorded 12.6
Unrecorded 2.5
Total 15.1
WHO European Region 12.2
Croatia
Total population: 4 556 000 ➤ Population 15+ years: 85% ➤ Population in urban areas: 57% ➤ Income group (World Bank): Upper-middle income
Data source: United Nations, data range 1990–2006.
SOCIOECONOMIC CONTEXT
Robust estimate of fi ve-year change in recorded adult(15+) per capita consumption,2001–2005:
INCREASE
➤ STABLE DECREASE
INCONCLUSIVE
15
2000 2002
Litre
s of
pur
e al
coho
lENLARGEMENT OF RECORDED ADULT (15+) PER CAPITA CONSUMPTION, 2000–2005
Year
2003 20052001 2004
10
5
ALCOHOL CONSUMPTION Population data (refer to the population 15 years and older and are in litres of pure alcohol).
1961 1966 1976Li
tres
of p
ure
alco
hol
1991
RECORDED ADULT (15+) PER CAPITA CONSUMPTION, 1961–2005
Year
1971 1981 200119961986 2006
Change in data source from 2000
Beer Wine Spirits Other Total
15
5
10
20
0
0
1%OTHER
37%BEER
15%SPIRITS
11
PATTERNS OF DRINKING
ABSTAINERS (15+ years), 2005
Males Females Total
Lifetime abstainers
No information availableFormer drinkers
Abstainers*
* Persons who did not drink in the past 12 months.
DRINKERS ONLY
Adult (15+ years) per capita consumption*, total —
Adult (15+ years) per capita consumption*, males —
Adult (15+ years) per capita consumption*, females —
Heavy episodic drinkers** (15–85+ years), males —
Heavy episodic drinkers** (15–85+ years), females —
* (Recorded + unrecorded) in litres of pure alcohol, average 2003–2005.** Had at least 60 grams or more of pure alcohol on at least one occasion weekly.
PATTERNS OF DRINKING SCORE
Patterns of drinking score* LEAST RISKY 1 2 3 4 5 MOST RISKY
* Given the same level of consumption, the higher the patterns of drinking score, the greater the alcohol-attributable burden of disease for the country.
ALCOHOL POLICYExcise tax on beer / wine / spirits NA
National legal minimum age for off-premise sales of alcoholic beverages (selling) (beer / wine / spirits) 18 / 18 / 18
National legal minimum age for on-premise sales of alcoholic beverages (serving) (beer / wine / spirits) 18 / 18 / 18
Restrictions for on-/off-premise sales of alcoholic beverages:Time (hours and days) / location (places and density) NA / YesSpecifi c events / intoxicated persons / petrol stations NA / No / No
National maximum legal blood alcohol concentration (BAC) when driving a vehicle (general / young / professional), in % 0.05 / 0.05 / 0.05
Legally binding regulations on alcohol advertising / product placement Yes / No
Legally binding regulations on alcohol sponsorship / sales promotion No / No
NA = No information.
HEALTH CONSEQUENCES
MORBIDITY
Prevalence estimates (12-month prevalence for 2004): Males Females
Alcohol use disorders (15+ years) 2.90% 0.00%
ALL CAUSE MORTALITY
Age-standardized deaths rates, 15+ years (per 100,000 population)
2000 2001 2002 2003 2004 2005
M F M F M F M F M F M F
Liver cirrhosis — — — — — — — — 7.9 3.3 — —
Road traffi c accidents (1)
23.9 8.7 — — — — — — 30.3 4.9 — —
Data source: WHO Mortality Database, data as reported by countries (1) refer to transport accidents.
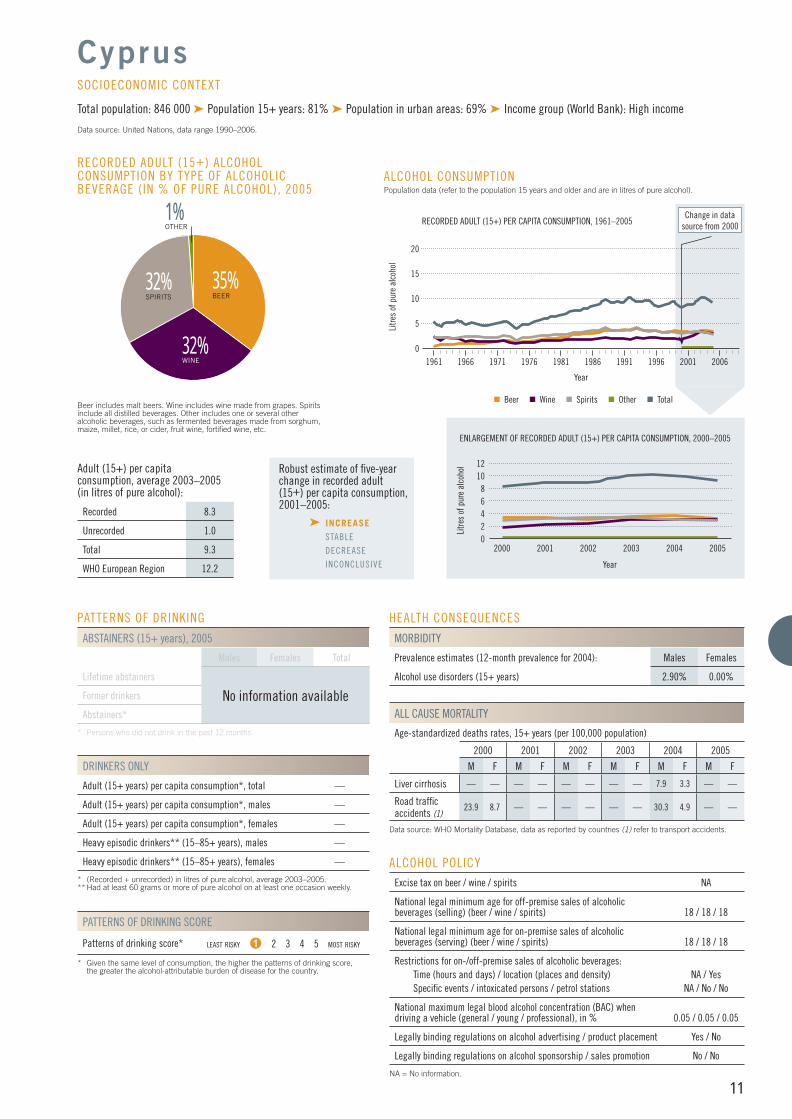
35%BEER
32%SPIRITS
RECORDED ADULT (15+) ALCOHOL CONSUMPTION BY TYPE OF ALCOHOLIC BEVERAGE (IN % OF PURE ALCOHOL), 2005
Beer includes malt beers. Wine includes wine made from grapes. Spirits include all distilled beverages. Other includes one or several other alcoholic beverages, such as fermented beverages made from sorghum, maize, millet, rice, or cider, fruit wine, fortifi ed wine, etc.
Adult (15+) per capita consumption, average 2003–2005 (in litres of pure alcohol):
Recorded 8.3
Unrecorded 1.0
Total 9.3
WHO European Region 12.2
Cyprus
Total population: 846 000 ➤ Population 15+ years: 81% ➤ Population in urban areas: 69% ➤ Income group (World Bank): High income
Data source: United Nations, data range 1990–2006.
SOCIOECONOMIC CONTEXT
Robust estimate of fi ve-year change in recorded adult(15+) per capita consumption,2001–2005:
➤ INCREASE STABLE
DECREASE
INCONCLUSIVE
32%WINE
12
2000 2002
Litre
s of
pur
e al
coho
l
ENLARGEMENT OF RECORDED ADULT (15+) PER CAPITA CONSUMPTION, 2000–2005
Year
2003 20052001
ALCOHOL CONSUMPTION Population data (refer to the population 15 years and older and are in litres of pure alcohol).
1961 1966 1976
Litre
s of
pur
e al
coho
l
1991
RECORDED ADULT (15+) PER CAPITA CONSUMPTION, 1961–2005
Year
1971 1981 200119961986 2006
Change in data source from 2000
Beer Wine Spirits Other Total
15
5
10
20
2004
42
86
10
0
0
1%OTHER
12
PATTERNS OF DRINKING
ABSTAINERS (15+ years), 2003
Males Females Total
Lifetime abstainers 2.8% 6.3% 4.6%
Former drinkers 7.9% 16.7% 12.4%
Abstainers* 10.7% 23.0% 17.0%
* Persons who did not drink in the past 12 months.
DRINKERS ONLY
Adult (15+ years) per capita consumption*, total 19.54
Adult (15+ years) per capita consumption*, males 26.59
Adult (15+ years) per capita consumption*, females 12.36
Heavy episodic drinkers** (15–85+ years), males, 2003 34.4%
Heavy episodic drinkers** (15–85+ years), females, 2003 6.0%
* (Recorded + unrecorded – tourist) in litres of pure alcohol, average 2003–2005.** Had at least 60 grams or more of pure alcohol on at least one occasion weekly.
PATTERNS OF DRINKING SCORE
Patterns of drinking score* LEAST RISKY 1 2 3 4 5 MOST RISKY
* Given the same level of consumption, the higher the patterns of drinking score, the greater the alcohol-attributable burden of disease for the country.
ALCOHOL POLICYExcise tax on beer / wine / spirits Yes / Yes / Yes
National legal minimum age for off-premise sales of alcoholic beverages (selling) (beer / wine / spirits) 18 / 18 / 18
National legal minimum age for on-premise sales of alcoholic beverages (serving) (beer / wine / spirits) 18 / 18 / 18
Restrictions for on-/off-premise sales of alcoholic beverages:Time (hours and days) / location (places and density) No / NoSpecifi c events / intoxicated persons / petrol stations Yes / Yes / No
National maximum legal blood alcohol concentration (BAC) when driving a vehicle (general / young / professional), in % ZT
Legally binding regulations on alcohol advertising / product placement Yes / No
Legally binding regulations on alcohol sponsorship / sales promotion No / No
ZT = Zero tolerance.
HEALTH CONSEQUENCES
MORBIDITY
Prevalence estimates (12-month prevalence for 2004): Males Females
Alcohol use disorders (15+ years) 4.44% 0.58%
ALL CAUSE MORTALITY
Age-standardized deaths rates, 15+ years (per 100,000 population)
2000 2001 2002 2003 2004 2005
M F M F M F M F M F M F
Liver cirrhosis 25.6 9.1 25.5 8.7 25.8 9.0 26.7 9.4 25.3 8.8 26.6 9.3
Road traffi c accidents (1)
18.8 5.6 16.9 5.4 17.9 5.7 17.1 5.2 16.1 5.0 15.0 4.4
Data source: WHO Mortality Database, data as reported by countries (1) refer to transport accidents.
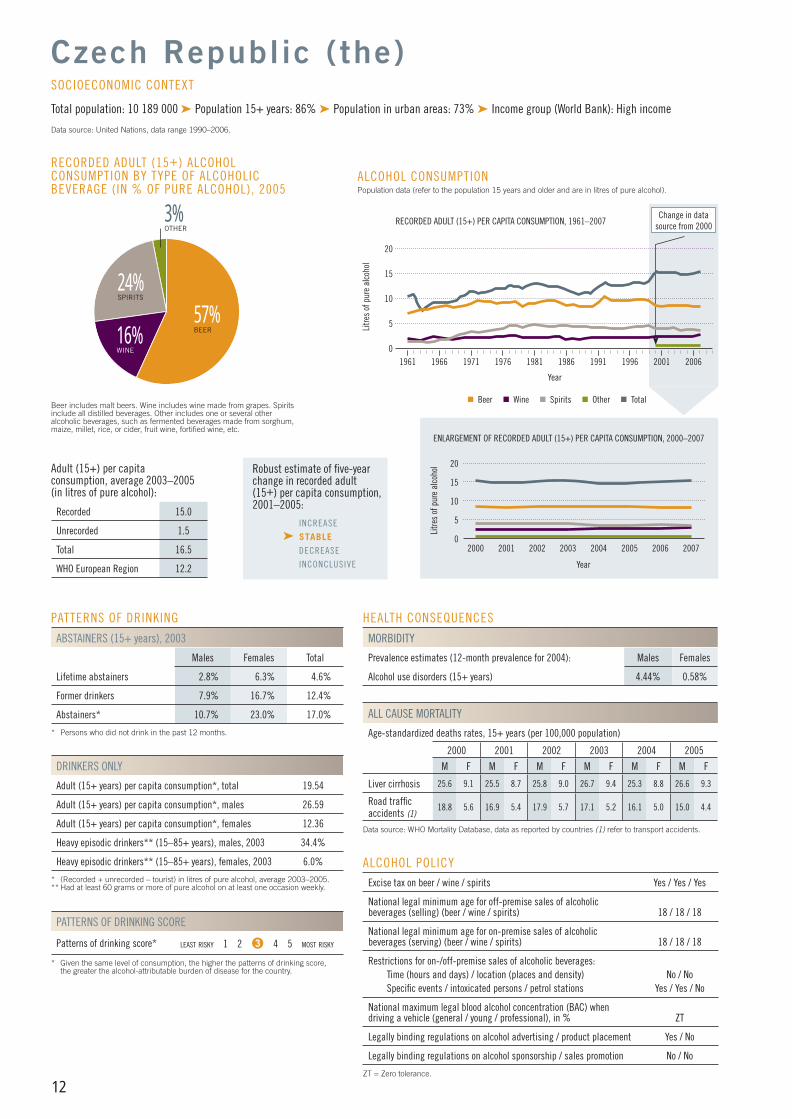
57%BEER
3%OTHER
RECORDED ADULT (15+) ALCOHOL CONSUMPTION BY TYPE OF ALCOHOLIC BEVERAGE (IN % OF PURE ALCOHOL), 2005
Beer includes malt beers. Wine includes wine made from grapes. Spirits include all distilled beverages. Other includes one or several other alcoholic beverages, such as fermented beverages made from sorghum, maize, millet, rice, or cider, fruit wine, fortifi ed wine, etc.
Adult (15+) per capita consumption, average 2003–2005 (in litres of pure alcohol):
Recorded 15.0
Unrecorded 1.5
Total 16.5
WHO European Region 12.2
Czech Republic (the)
Total population: 10 189 000 ➤ Population 15+ years: 86% ➤ Population in urban areas: 73% ➤ Income group (World Bank): High income
Data source: United Nations, data range 1990–2006.
SOCIOECONOMIC CONTEXT
Robust estimate of fi ve-year change in recorded adult(15+) per capita consumption,2001–2005:
INCREASE
➤ STABLE DECREASE
INCONCLUSIVE
24%SPIRITS
20
2000 2002
Litre
s of
pur
e al
coho
lENLARGEMENT OF RECORDED ADULT (15+) PER CAPITA CONSUMPTION, 2000–2007
Year
2003 20072001 2005
10
5
ALCOHOL CONSUMPTION Population data (refer to the population 15 years and older and are in litres of pure alcohol).
1961 1966 1976Li
tres
of p
ure
alco
hol
1991
RECORDED ADULT (15+) PER CAPITA CONSUMPTION, 1961–2007
Year
1971 1981 200119961986 2006
Change in data source from 2000
Beer Wine Spirits Other Total
15
5
10
20
20062004
15
0
016%WINE
13
PATTERNS OF DRINKING
ABSTAINERS (15+ years), 2003
Males Females Total
Lifetime abstainers 0.6% 0.9% 0.8%
Former drinkers 2.5% 7.0% 4.8%
Abstainers* 3.1% 7.9% 5.6%
* Persons who did not drink in the past 12 months.
DRINKERS ONLY
Adult (15+ years) per capita consumption*, total 14.38
Adult (15+ years) per capita consumption*, males 19.47
Adult (15+ years) per capita consumption*, females 8.42
Heavy episodic drinkers** (15–85+ years), males, 2003 13.5%
Heavy episodic drinkers** (15–85+ years), females, 2003 4.0%
* (Recorded + unrecorded) in litres of pure alcohol, average 2003–2005.** Had at least 60 grams or more of pure alcohol on at least one occasion weekly.
PATTERNS OF DRINKING SCORE
Patterns of drinking score* LEAST RISKY 1 2 3 4 5 MOST RISKY
* Given the same level of consumption, the higher the patterns of drinking score, the greater the alcohol-attributable burden of disease for the country.
ALCOHOL POLICYExcise tax on beer / wine / spirits Yes / Yes / Yes
National legal minimum age for off-premise sales of alcoholic beverages (selling) (beer / wine / spirits) 16 / 16 / 16
National legal minimum age for on-premise sales of alcoholic beverages (serving) (beer / wine / spirits) 18 / 18 / 18
Restrictions for on-/off-premise sales of alcoholic beverages:Time (hours and days) / location (places and density) Yes & No / YesSpecifi c events / intoxicated persons / petrol stations Yes / Yes / No
National maximum legal blood alcohol concentration (BAC) when driving a vehicle (general / young / professional), in % 0.05 / 0.05 / 0.05
Legally binding regulations on alcohol advertising / product placement Yes / Yes
Legally binding regulations on alcohol sponsorship / sales promotion No / No
HEALTH CONSEQUENCES
MORBIDITY
Prevalence estimates (12-month prevalence for 2004): Males Females
Alcohol use disorders (15+ years) 4.12% 0.98%
ALL CAUSE MORTALITY
Age-standardized deaths rates, 15+ years (per 100,000 population)
2000 2001 2002 2003 2004 2005
M F M F M F M F M F M F
Liver cirrhosis 22.1 8.2 20.9 9.2 — — — — — — — —
Road traffi c accidents (1)
14.7 5.9 13.9 4.8 — — — — — — — —
Data source: WHO Mortality Database, data as reported by countries (1) refer to transport accidents.
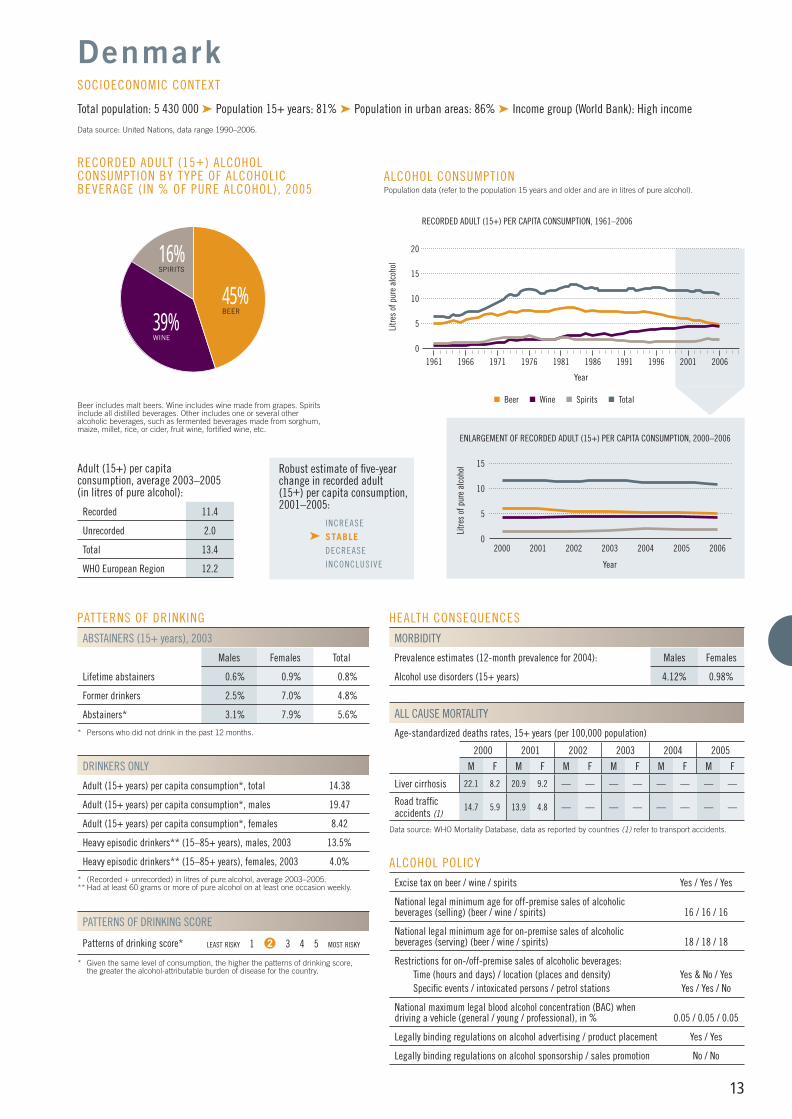
45%BEER
RECORDED ADULT (15+) ALCOHOL CONSUMPTION BY TYPE OF ALCOHOLIC BEVERAGE (IN % OF PURE ALCOHOL), 2005
Beer includes malt beers. Wine includes wine made from grapes. Spirits include all distilled beverages. Other includes one or several other alcoholic beverages, such as fermented beverages made from sorghum, maize, millet, rice, or cider, fruit wine, fortifi ed wine, etc.
Adult (15+) per capita consumption, average 2003–2005 (in litres of pure alcohol):
Recorded 11.4
Unrecorded 2.0
Total 13.4
WHO European Region 12.2
Denmark
Total population: 5 430 000 ➤ Population 15+ years: 81% ➤ Population in urban areas: 86% ➤ Income group (World Bank): High income
Data source: United Nations, data range 1990–2006.
SOCIOECONOMIC CONTEXT
Robust estimate of fi ve-year change in recorded adult(15+) per capita consumption,2001–2005:
INCREASE
➤ STABLE DECREASE
INCONCLUSIVE
15
2000 2002
Litre
s of
pur
e al
coho
l
ENLARGEMENT OF RECORDED ADULT (15+) PER CAPITA CONSUMPTION, 2000–2006
Year
2003 20062001
ALCOHOL CONSUMPTION Population data (refer to the population 15 years and older and are in litres of pure alcohol).
1961 1966 1976
Litre
s of
pur
e al
coho
l
1991
RECORDED ADULT (15+) PER CAPITA CONSUMPTION, 1961–2006
Year
1971 1981 200119961986 2006
Beer Wine Spirits Total
15
5
10
20
2004
5
10
2005
0
0
16%SPIRITS
39%WINE
14
PATTERNS OF DRINKING
ABSTAINERS (15+ years), 2003
Males Females Total
Lifetime abstainers 7.4% 13.6% 10.9%
Former drinkers 18.6% 17.9% 18.2%
Abstainers* 26.0% 31.5% 29.1%
* Persons who did not drink in the past 12 months.
DRINKERS ONLY
Adult (15+ years) per capita consumption*, total 21.96
Adult (15+ years) per capita consumption*, males 36.06
Adult (15+ years) per capita consumption*, females 12.15
Heavy episodic drinkers** (15–85+ years), males, 2003 21.2%
Heavy episodic drinkers** (15–85+ years), females, 2003 3.1%
* (Recorded + unrecorded – tourist) in litres of pure alcohol, average 2003–2005.** Had at least 60 grams or more of pure alcohol on at least one occasion weekly.
PATTERNS OF DRINKING SCORE
Patterns of drinking score* LEAST RISKY 1 2 3 4 5 MOST RISKY
* Given the same level of consumption, the higher the patterns of drinking score, the greater the alcohol-attributable burden of disease for the country.
ALCOHOL POLICYExcise tax on beer / wine / spirits Yes / Yes / Yes
National legal minimum age for off-premise sales of alcoholic beverages (selling) (beer / wine / spirits) 18 / 18 / 18
National legal minimum age for on-premise sales of alcoholic beverages (serving) (beer / wine / spirits) 18 / 18 / 18
Restrictions for on-/off-premise sales of alcoholic beverages:Time (hours and days) / location (places and density) Yes / Yes & NoSpecifi c events / intoxicated persons / petrol stations Yes / Yes / No
National maximum legal blood alcohol concentration (BAC) when driving a vehicle (general / young / professional), in % 0.02 / 0.02 / 0.02
Legally binding regulations on alcohol advertising / product placement Yes / Yes
Legally binding regulations on alcohol sponsorship / sales promotion Yes / Yes
HEALTH CONSEQUENCES
MORBIDITY
Prevalence estimates (12-month prevalence for 2004): Males Females
Alcohol use disorders (15+ years) 11.09% 1.62%
ALL CAUSE MORTALITY
Age-standardized deaths rates, 15+ years (per 100,000 population)
2000 2001 2002 2003 2004 2005
M F M F M F M F M F M F
Liver cirrhosis 30.1 12.0 30.9 18.2 34.5 15.3 29.5 15.8 32.3 14.6 35.3 15.0
Road traffi c accidents (1)
31.9 9.1 29.1 8.1 32.9 7.7 26.0 6.0 24.1 6.4 25.0 5.6
Data source: WHO Mortality Database, data as reported by countries (1) refer to transport accidents.
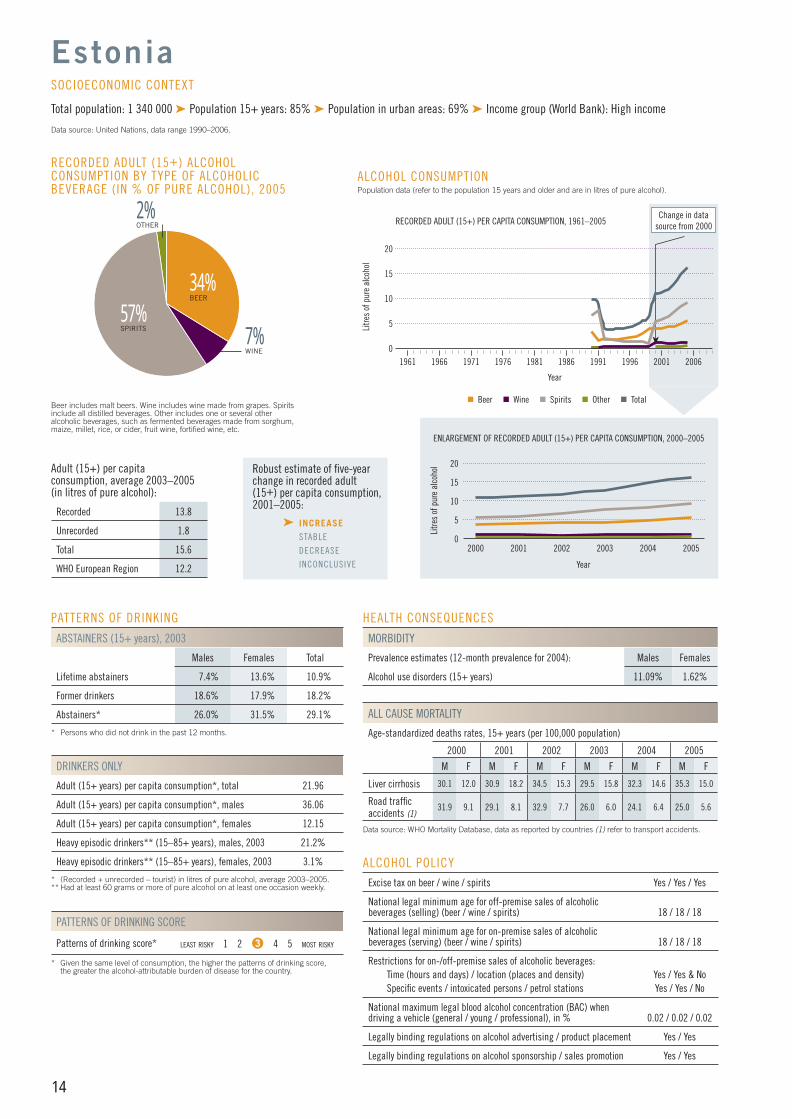
34%BEER
7%WINE
RECORDED ADULT (15+) ALCOHOL CONSUMPTION BY TYPE OF ALCOHOLIC BEVERAGE (IN % OF PURE ALCOHOL), 2005
Beer includes malt beers. Wine includes wine made from grapes. Spirits include all distilled beverages. Other includes one or several other alcoholic beverages, such as fermented beverages made from sorghum, maize, millet, rice, or cider, fruit wine, fortifi ed wine, etc.
Adult (15+) per capita consumption, average 2003–2005 (in litres of pure alcohol):
Recorded 13.8
Unrecorded 1.8
Total 15.6
WHO European Region 12.2
Estonia
Total population: 1 340 000 ➤ Population 15+ years: 85% ➤ Population in urban areas: 69% ➤ Income group (World Bank): High income
Data source: United Nations, data range 1990–2006.
SOCIOECONOMIC CONTEXT
Robust estimate of fi ve-year change in recorded adult(15+) per capita consumption,2001–2005:
➤ INCREASE STABLE
DECREASE
INCONCLUSIVE
2%OTHER
57%SPIRITS
20
2000 2002
Litre
s of
pur
e al
coho
lENLARGEMENT OF RECORDED ADULT (15+) PER CAPITA CONSUMPTION, 2000–2005
Year
2003 20052001
10
5
ALCOHOL CONSUMPTION Population data (refer to the population 15 years and older and are in litres of pure alcohol).
1961 1966 1976Li
tres
of p
ure
alco
hol
1991
RECORDED ADULT (15+) PER CAPITA CONSUMPTION, 1961–2005
Year
1971 1981 200119961986 2006
Change in data source from 2000
Beer Wine Spirits Other Total
15
5
10
20
2004
15
0
0

15
PATTERNS OF DRINKING
ABSTAINERS (15+ years), 2000
Males Females Total
Lifetime abstainers 3.3% 10.5% 7.1%
Former drinkers 5.8% 3.7% 4.7%
Abstainers* 9.1% 14.2% 11.8%
* Persons who did not drink in the past 12 months.
DRINKERS ONLY
Adult (15+ years) per capita consumption*, total 14.20
Adult (15+ years) per capita consumption*, males 20.55
Adult (15+ years) per capita consumption*, females 8.70
Heavy episodic drinkers** (15–85+ years), males, 2000 16.5%
Heavy episodic drinkers** (15–85+ years), females, 2000 3.7%
* (Recorded + unrecorded) in litres of pure alcohol, average 2003–2005.** Had at least 60 grams or more of pure alcohol on at least one occasion weekly.
PATTERNS OF DRINKING SCORE
Patterns of drinking score* LEAST RISKY 1 2 3 4 5 MOST RISKY
* Given the same level of consumption, the higher the patterns of drinking score, the greater the alcohol-attributable burden of disease for the country.
ALCOHOL POLICYExcise tax on beer / wine / spirits Yes / Yes / Yes
National legal minimum age for off-premise sales of alcoholic beverages (selling) (beer / wine / spirits) 18 / 18 / 20
National legal minimum age for on-premise sales of alcoholic beverages (serving) (beer / wine / spirits) 18 / 18 / 18
Restrictions for on-/off-premise sales of alcoholic beverages:Time (hours and days) / location (places and density) Yes / YesSpecifi c events / intoxicated persons / petrol stations Yes / Yes / No
National maximum legal blood alcohol concentration (BAC) when driving a vehicle (general / young / professional), in % 0.05 / 0.05 / 0.05
Legally binding regulations on alcohol advertising / product placement Yes / Yes
Legally binding regulations on alcohol sponsorship / sales promotion Yes / Yes
HEALTH CONSEQUENCES
MORBIDITY
Prevalence estimates (12-month prevalence for 2004): Males Females
Alcohol use disorders (15+ years) 6.39% 1.17%
ALL CAUSE MORTALITY
Age-standardized deaths rates, 15+ years (per 100,000 population)
2000 2001 2002 2003 2004 2005
M F M F M F M F M F M F
Liver cirrhosis 18.1 6.7 19.5 7.0 21.0 7.6 20.4 6.6 26.2 8.5 27.8 10.2
Road traffi c accidents (1)
12.2 5.1 14.7 5.2 14.2 4.5 12.0 4.7 12.1 4.8 12.1 3.6
Data source: WHO Mortality Database, data as reported by countries (1) refer to transport accidents.
23%WINE
3%OTHER
RECORDED ADULT (15+) ALCOHOL CONSUMPTION BY TYPE OF ALCOHOLIC BEVERAGE (IN % OF PURE ALCOHOL), 2005
Beer includes malt beers. Wine includes wine made from grapes. Spirits include all distilled beverages. Other includes one or several other alcoholic beverages, such as fermented beverages made from sorghum, maize, millet, rice, or cider, fruit wine, fortifi ed wine, etc.
Adult (15+) per capita consumption, average 2003–2005 (in litres of pure alcohol):
Recorded 9.7
Unrecorded 2.8
Total 12.5
WHO European Region 12.2
Finland
Total population: 5 261 000 ➤ Population 15+ years: 83% ➤ Population in urban areas: 61% ➤ Income group (World Bank): High income
Data source: United Nations, data range 1990–2006.
SOCIOECONOMIC CONTEXT
Robust estimate of fi ve-year change in recorded adult(15+) per capita consumption,2001–2005:
➤ INCREASE STABLE
DECREASE
INCONCLUSIVE
15
2000 2002
Litre
s of
pur
e al
coho
l
ENLARGEMENT OF RECORDED ADULT (15+) PER CAPITA CONSUMPTION, 2000–2007
Year
2003 20072001
ALCOHOL CONSUMPTION Population data (refer to the population 15 years and older and are in litres of pure alcohol).
1961 1966 1976
Litre
s of
pur
e al
coho
l
1991
RECORDED ADULT (15+) PER CAPITA CONSUMPTION, 1961–2007
Year
1971 1981 200119961986 2006
Beer Wine Spirits Other Total
15
5
10
20
2004
5
10
2005 2006
0
0
46%BEER
28%SPIRITS
16
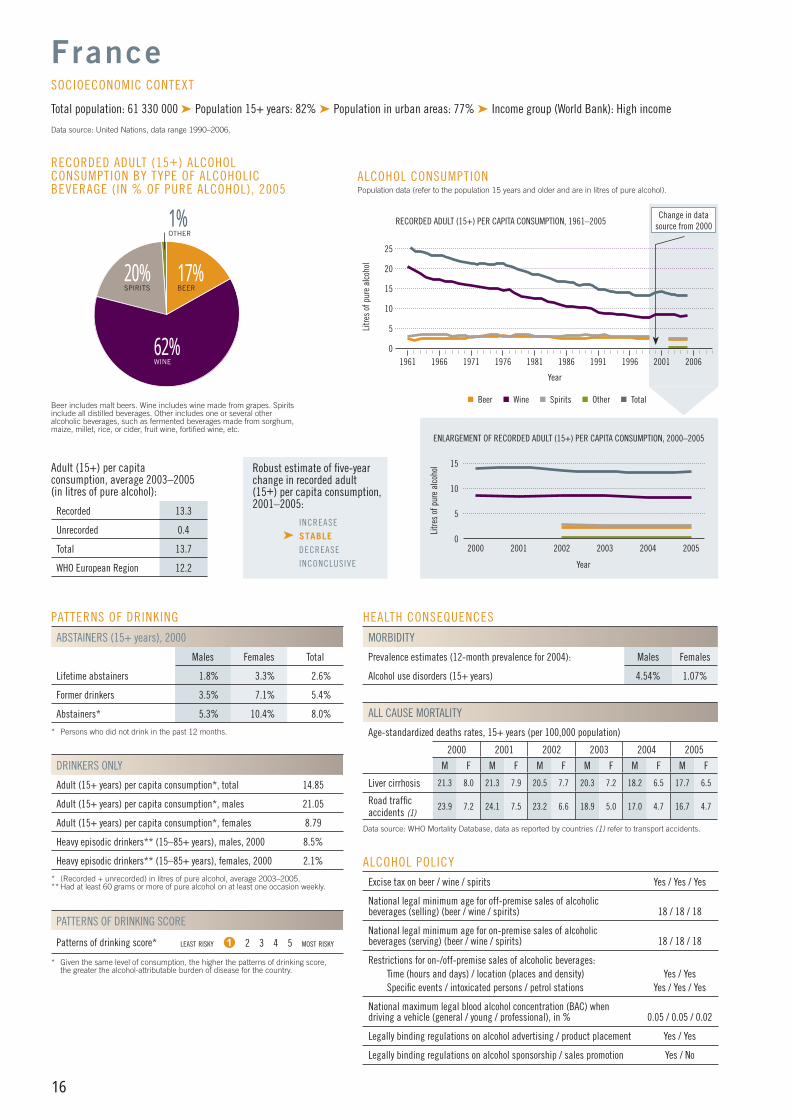
62%WINE
RECORDED ADULT (15+) ALCOHOL CONSUMPTION BY TYPE OF ALCOHOLIC BEVERAGE (IN % OF PURE ALCOHOL), 2005
Beer includes malt beers. Wine includes wine made from grapes. Spirits include all distilled beverages. Other includes one or several other alcoholic beverages, such as fermented beverages made from sorghum, maize, millet, rice, or cider, fruit wine, fortifi ed wine, etc.
France
Total population: 61 330 000 ➤ Population 15+ years: 82% ➤ Population in urban areas: 77% ➤ Income group (World Bank): High income
Data source: United Nations, data range 1990–2006.
SOCIOECONOMIC CONTEXT
PATTERNS OF DRINKING
ABSTAINERS (15+ years), 2000
Males Females Total
Lifetime abstainers 1.8% 3.3% 2.6%
Former drinkers 3.5% 7.1% 5.4%
Abstainers* 5.3% 10.4% 8.0%
* Persons who did not drink in the past 12 months.
DRINKERS ONLY
Adult (15+ years) per capita consumption*, total 14.85
Adult (15+ years) per capita consumption*, males 21.05
Adult (15+ years) per capita consumption*, females 8.79
Heavy episodic drinkers** (15–85+ years), males, 2000 8.5%
Heavy episodic drinkers** (15–85+ years), females, 2000 2.1%
* (Recorded + unrecorded) in litres of pure alcohol, average 2003–2005.** Had at least 60 grams or more of pure alcohol on at least one occasion weekly.
PATTERNS OF DRINKING SCORE
Patterns of drinking score* LEAST RISKY 1 2 3 4 5 MOST RISKY
* Given the same level of consumption, the higher the patterns of drinking score, the greater the alcohol-attributable burden of disease for the country.
ALCOHOL POLICYExcise tax on beer / wine / spirits Yes / Yes / Yes
National legal minimum age for off-premise sales of alcoholic beverages (selling) (beer / wine / spirits) 18 / 18 / 18
National legal minimum age for on-premise sales of alcoholic beverages (serving) (beer / wine / spirits) 18 / 18 / 18
Restrictions for on-/off-premise sales of alcoholic beverages:Time (hours and days) / location (places and density) Yes / YesSpecifi c events / intoxicated persons / petrol stations Yes / Yes / Yes
National maximum legal blood alcohol concentration (BAC) when driving a vehicle (general / young / professional), in % 0.05 / 0.05 / 0.02
Legally binding regulations on alcohol advertising / product placement Yes / Yes
Legally binding regulations on alcohol sponsorship / sales promotion Yes / No
HEALTH CONSEQUENCES
MORBIDITY
Prevalence estimates (12-month prevalence for 2004): Males Females
Alcohol use disorders (15+ years) 4.54% 1.07%
ALL CAUSE MORTALITY
Age-standardized deaths rates, 15+ years (per 100,000 population)
2000 2001 2002 2003 2004 2005
M F M F M F M F M F M F
Liver cirrhosis 21.3 8.0 21.3 7.9 20.5 7.7 20.3 7.2 18.2 6.5 17.7 6.5
Road traffi c accidents (1)
23.9 7.2 24.1 7.5 23.2 6.6 18.9 5.0 17.0 4.7 16.7 4.7
Data source: WHO Mortality Database, data as reported by countries (1) refer to transport accidents.
Adult (15+) per capita consumption, average 2003–2005 (in litres of pure alcohol):
Recorded 13.3
Unrecorded 0.4
Total 13.7
WHO European Region 12.2
Robust estimate of fi ve-year change in recorded adult(15+) per capita consumption,2001–2005:
INCREASE
➤ STABLE DECREASE
INCONCLUSIVE
15
2000 2002
Litre
s of
pur
e al
coho
lENLARGEMENT OF RECORDED ADULT (15+) PER CAPITA CONSUMPTION, 2000–2005
Year
2003 20052001
10
5
ALCOHOL CONSUMPTION Population data (refer to the population 15 years and older and are in litres of pure alcohol).
1961 1966 1976Li
tres
of p
ure
alco
hol
1991
RECORDED ADULT (15+) PER CAPITA CONSUMPTION, 1961–2005
Year
1971 1981 200119961986 2006
Change in data source from 2000
Beer Wine Spirits Other Total
15
5
10
25
2004
20
0
0
17%BEER
20%SPIRITS
1%OTHER

17
PATTERNS OF DRINKING
ABSTAINERS (15+ years), 2003
Males Females Total
Lifetime abstainers 10.4% 49.6% 31.7%
Former drinkers 18.3% 20.3% 19.4%
Abstainers* 28.7% 69.9% 51.1%
* Persons who did not drink in the past 12 months.
DRINKERS ONLY
Adult (15+ years) per capita consumption*, total 13.09
Adult (15+ years) per capita consumption*, males 14.81
Adult (15+ years) per capita consumption*, females 9.44
Heavy episodic drinkers** (15–85+ years), males, 2003 27.3%
Heavy episodic drinkers** (15–85+ years), females, 2003 4.0%
* (Recorded + unrecorded) in litres of pure alcohol, average 2003–2005.** Had at least 60 grams or more of pure alcohol on at least one occasion weekly.
PATTERNS OF DRINKING SCORE
Patterns of drinking score* LEAST RISKY 1 2 3 4 5 MOST RISKY
* Given the same level of consumption, the higher the patterns of drinking score, the greater the alcohol-attributable burden of disease for the country.
ALCOHOL POLICYExcise tax on beer / wine / spirits Yes / Yes / Yes
National legal minimum age for off-premise sales of alcoholic beverages (selling) (beer / wine / spirits) 18 / 18 / 18
National legal minimum age for on-premise sales of alcoholic beverages (serving) (beer / wine / spirits) 18 / 18 / 18
Restrictions for on-/off-premise sales of alcoholic beverages:Time (hours and days) / location (places and density) No / Yes & NoSpecifi c events / intoxicated persons / petrol stations No / No / No
National maximum legal blood alcohol concentration (BAC) when driving a vehicle (general / young / professional), in % 0.02 / 0.02 / 0.02
Legally binding regulations on alcohol advertising / product placement Yes / Yes
Legally binding regulations on alcohol sponsorship / sales promotion Yes / Yes
HEALTH CONSEQUENCES
MORBIDITY
Prevalence estimates (12-month prevalence for 2004): Males Females
Alcohol use disorders (15+ years) 7.44% 0.25%
ALL CAUSE MORTALITY
Age-standardized deaths rates, 15+ years (per 100,000 population)
2000 2001 2002 2003 2004 2005
M F M F M F M F M F M F
Liver cirrhosis 38.8 13.8 37.2 11.3 — — — — — — — —
Road traffi c accidents (1)
10.4 2.5 15.7 2.8 — — — — — — — —
Data source: WHO Mortality Database, data as reported by countries (1) refer to transport accidents.
18%BEER
62%SPIRITS
RECORDED ADULT (15+) ALCOHOL CONSUMPTION BY TYPE OF ALCOHOLIC BEVERAGE (IN % OF PURE ALCOHOL), 2005
Beer includes malt beers. Wine includes wine made from grapes. Spirits include all distilled beverages. Other includes one or several other alcoholic beverages, such as fermented beverages made from sorghum, maize, millet, rice, or cider, fruit wine, fortifi ed wine, etc.
Adult (15+) per capita consumption, average 2003–2005 (in litres of pure alcohol):
Recorded 3.9
Unrecorded 2.5
Total 6.4
WHO European Region 12.2
Georgia
Total population: 4 433 000 ➤ Population 15+ years: 82% ➤ Population in urban areas: 52% ➤ Income group (World Bank): Lower-middle income
Data source: United Nations, data range 1990–2006.
SOCIOECONOMIC CONTEXT
Robust estimate of fi ve-year change in recorded adult(15+) per capita consumption,2001–2005:
INCREASE
➤ STABLE DECREASE
INCONCLUSIVE
<1%OTHER
5
2000 2002
Litre
s of
pur
e al
coho
l
ENLARGEMENT OF RECORDED ADULT (15+) PER CAPITA CONSUMPTION, 2000–2005
Year
2003 20052001
ALCOHOL CONSUMPTION Population data (refer to the population 15 years and older and are in litres of pure alcohol).
1961 1966 1976
Litre
s of
pur
e al
coho
l
1991
RECORDED ADULT (15+) PER CAPITA CONSUMPTION, 1961–2005
Year
1971 1981 200119961986 2006
Change in data source from 2000
Beer Wine Spirits Other Total
15
5
10
20
2004
2
1
4
3
0
0
20%WINE

18
PATTERNS OF DRINKING
ABSTAINERS (15+ years), 2000
Males Females Total
Lifetime abstainers 1.3% 2.0% 1.7%
Former drinkers 2.6% 2.6% 2.6%
Abstainers* 3.9% 4.6% 4.3%
* Persons who did not drink in the past 12 months.
DRINKERS ONLY
Adult (15+ years) per capita consumption*, total 13.39
Adult (15+ years) per capita consumption*, males 19.54
Adult (15+ years) per capita consumption*, females 7.78
Heavy episodic drinkers** (15–85+ years), males, 2000 13.6%
Heavy episodic drinkers** (15–85+ years), females, 2000 2.2%
* (Recorded + unrecorded) in litres of pure alcohol, average 2003–2005.** Had at least 60 grams or more of pure alcohol on at least one occasion weekly.
PATTERNS OF DRINKING SCORE
Patterns of drinking score* LLEAST RISKY 1 2 3 4 5 MOST RISKY
* Given the same level of consumption, the higher the patterns of drinking score, the greater the alcohol-attributable burden of disease for the country.
ALCOHOL POLICYExcise tax on beer / wine / spirits Yes / Yes / Yes
National legal minimum age for off-premise sales of alcoholic beverages (selling) (beer / wine / spirits) 16 / 16 / 18
National legal minimum age for on-premise sales of alcoholic beverages (serving) (beer / wine / spirits) 16 / 16 / 18
Restrictions for on-/off-premise sales of alcoholic beverages:Time (hours and days) / location (places and density) No / NoSpecifi c events / intoxicated persons / petrol stations No / Yes / No
National maximum legal blood alcohol concentration (BAC) when driving a vehicle (general / young / professional), in % 0.05 / ZT / 0.05
Legally binding regulations on alcohol advertising / product placement Yes / Yes
Legally binding regulations on alcohol sponsorship / sales promotion No / No
ZT = Zero tolerance.
HEALTH CONSEQUENCES
MORBIDITY
Prevalence estimates (12-month prevalence for 2004): Males Females
Alcohol use disorders (15+ years) 4.51% 0.88%
ALL CAUSE MORTALITY
Age-standardized deaths rates, 15+ years (per 100,000 population)
2000 2001 2002 2003 2004 2005
M F M F M F M F M F M F
Liver cirrhosis 27.3 11.0 26.1 10.9 26.4 10.7 25.9 10.3 24.2 9.5 23.2 9.2
Road traffi c accidents (1)
17.2 5.6 15.7 5.1 15.5 5.0 14.8 4.4 12.9 4.0 11.5 3.6
Data source: WHO Mortality Database, data as reported by countries (1) refer to transport accidents.
53%BEER
RECORDED ADULT (15+) ALCOHOL CONSUMPTION BY TYPE OF ALCOHOLIC BEVERAGE (IN % OF PURE ALCOHOL), 2005
Beer includes malt beers. Wine includes wine made from grapes. Spirits include all distilled beverages. Other includes one or several other alcoholic beverages, such as fermented beverages made from sorghum, maize, millet, rice, or cider, fruit wine, fortifi ed wine, etc.
Adult (15+) per capita consumption, average 2003–2005 (in litres of pure alcohol):
Recorded 11.8
Unrecorded 1.0
Total 12.8
WHO European Region 12.2
Germany
Total population: 82 641 000 ➤ Population 15+ years: 86% ➤ Population in urban areas: 75% ➤ Income group (World Bank): High income
Data source: United Nations, data range 1990–2006.
SOCIOECONOMIC CONTEXT
Robust estimate of fi ve-year change in recorded adult(15+) per capita consumption,2001–2005:
INCREASE
➤ STABLE DECREASE
INCONCLUSIVE
27%WINE
15
2000 2002
Litre
s of
pur
e al
coho
lENLARGEMENT OF RECORDED ADULT (15+) PER CAPITA CONSUMPTION, 2000–2007
Year
2003 20072001
ALCOHOL CONSUMPTION Population data (refer to the population 15 years and older and are in litres of pure alcohol).
1961 1966 1976Li
tres
of p
ure
alco
hol
1991
RECORDED ADULT (15+) PER CAPITA CONSUMPTION, 1961–2007
Year
1971 1981 200119961986 2006
Beer Wine Spirits Total
15
5
10
20
2005
10
5
20062004
0
0
20%SPIRITS

19
PATTERNS OF DRINKING
ABSTAINERS (15+ years), 2000
Males Females Total
Lifetime abstainers 6.7% 21.0% 14.0%
Former drinkers 9.3% 19.0% 14.3%
Abstainers* 16.0% 40.0% 28.3%
* Persons who did not drink in the past 12 months.
DRINKERS ONLY
Adult (15+ years) per capita consumption*, total 14.99
Adult (15+ years) per capita consumption*, males 18.35
Adult (15+ years) per capita consumption*, females 10.82
Heavy episodic drinkers** (15–85+ years), males —
Heavy episodic drinkers** (15–85+ years), females —
* (Recorded + unrecorded) in litres of pure alcohol, average 2003–2005.** Had at least 60 grams or more of pure alcohol on at least one occasion weekly.
PATTERNS OF DRINKING SCORE
Patterns of drinking score* LEAST RISKY 1 2 3 4 5 MOST RISKY
* Given the same level of consumption, the higher the patterns of drinking score, the greater the alcohol-attributable burden of disease for the country.
ALCOHOL POLICYExcise tax on beer / wine / spirits NA
National legal minimum age for off-premise sales of alcoholic beverages (selling) (beer / wine / spirits) NA
National legal minimum age for on-premise sales of alcoholic beverages (serving) (beer / wine / spirits) NA
Restrictions for on-/off-premise sales of alcoholic beverages:Time (hours and days) / location (places and density) NA Specifi c events / intoxicated persons / petrol stations NA
National maximum legal blood alcohol concentration (BAC) when driving a vehicle (general / young / professional), in % 0.05 / 0.02 / 0.02
Legally binding regulations on alcohol advertising / product placement NA
Legally binding regulations on alcohol sponsorship / sales promotion NA
NA = No information.
HEALTH CONSEQUENCES
MORBIDITY
Prevalence estimates (12-month prevalence for 2004): Males Females
Alcohol use disorders (15+ years) 3.56% 0.84%
ALL CAUSE MORTALITY
Age-standardized deaths rates, 15+ years (per 100,000 population)
2000 2001 2002 2003 2004 2005
M F M F M F M F M F M F
Liver cirrhosis 7.9 2.9 8.7 2.2 7.9 2.1 8.1 2.2 7.8 2.3 8.6 2.4
Road traffi c accidents (1)
36.1 9.3 33.2 8.9 29.6 7.5 30.1 6.6 32.3 8.3 31.3 7.5
Data source: WHO Mortality Database, data as reported by countries (1) refer to transport accidents.
49%WINE
RECORDED ADULT (15+) ALCOHOL CONSUMPTION BY TYPE OF ALCOHOLIC BEVERAGE (IN % OF PURE ALCOHOL), 2005
Beer includes malt beers. Wine includes wine made from grapes. Spirits include all distilled beverages. Other includes one or several other alcoholic beverages, such as fermented beverages made from sorghum, maize, millet, rice, or cider, fruit wine, fortifi ed wine, etc.
Adult (15+) per capita consumption, average 2003–2005 (in litres of pure alcohol):
Recorded 9.0
Unrecorded 1.8
Total 10.8
WHO European Region 12.2
Greece
Total population: 11 123 000 ➤ Population 15+ years: 86% ➤ Population in urban areas: 59% ➤ Income group (World Bank): High income
Data source: United Nations, data range 1990–2006.
SOCIOECONOMIC CONTEXT
Robust estimate of fi ve-year change in recorded adult(15+) per capita consumption,2001–2005:
INCREASE
➤ STABLE DECREASE
INCONCLUSIVE
26%SPIRITS
1%OTHER
10
2000 2002
Litre
s of
pur
e al
coho
l
ENLARGEMENT OF RECORDED ADULT (15+) PER CAPITA CONSUMPTION, 2000–2005
Year
2003 20052001
ALCOHOL CONSUMPTION Population data (refer to the population 15 years and older and are in litres of pure alcohol).
1961 1966 1976
Litre
s of
pur
e al
coho
l
1991
RECORDED ADULT (15+) PER CAPITA CONSUMPTION, 1961–2005
Year
1971 1981 200119961986 2006
Change in data source from 2000
Beer Wine Spirits Other Total
15
5
10
20
2004
4
2
8
6
0
0
24%BEER

20
PATTERNS OF DRINKING
ABSTAINERS (15+ years), 2003
Males Females Total
Lifetime abstainers 3.6% 9.4% 6.7%
Former drinkers 11.0% 12.9% 12.0%
Abstainers* 14.6% 22.3% 18.7%
* Persons who did not drink in the past 12 months.
DRINKERS ONLY
Adult (15+ years) per capita consumption*, total 20.01
Adult (15+ years) per capita consumption*, males 29.45
Adult (15+ years) per capita consumption*, females 10.98
Heavy episodic drinkers** (15–85+ years), males, 2003 21.1%
Heavy episodic drinkers** (15–85+ years), females, 2003 2.3%
* (Recorded + unrecorded) in litres of pure alcohol, average 2003–2005.** Had at least 60 grams or more of pure alcohol on at least one occasion weekly.
PATTERNS OF DRINKING SCORE
Patterns of drinking score* LEAST RISKY 1 2 3 4 5 MOST RISKY
* Given the same level of consumption, the higher the patterns of drinking score, the greater the alcohol-attributable burden of disease for the country.
ALCOHOL POLICYExcise tax on beer / wine / spirits Yes / No / Yes
National legal minimum age for off-premise sales of alcoholic beverages (selling) (beer / wine / spirits) 18 / 18 / 18
National legal minimum age for on-premise sales of alcoholic beverages (serving) (beer / wine / spirits) 18 / 18 / 18
Restrictions for on-/off-premise sales of alcoholic beverages:Time (hours and days) / location (places and density) No / NoSpecifi c events / intoxicated persons / petrol stations Yes / Yes / No
National maximum legal blood alcohol concentration (BAC) when driving a vehicle (general / young / professional), in % ZT
Legally binding regulations on alcohol advertising / product placement Yes / Yes
Legally binding regulations on alcohol sponsorship / sales promotion Yes / No
ZT = Zero tolerance.
HEALTH CONSEQUENCES
MORBIDITY
Prevalence estimates (12-month prevalence for 2004): Males Females
Alcohol use disorders (15+ years) 15.29% 2.27%
ALL CAUSE MORTALITY
Age-standardized deaths rates, 15+ years (per 100,000 population)
2000 2001 2002 2003 2004 2005
M F M F M F M F M F M F
Liver cirrhosis 109.4 32.8 95.7 30.8 92.9 27.0 91.5 29.6 87.5 27.4 75.8 24.0
Road traffi c accidents (1)
22.8 6.4 23.7 6.5 28.3 8.0 27.3 6.9 27.2 6.9 26.4 7.3
Data source: WHO Mortality Database, data as reported by countries (1) refer to transport accidents.
35%BEER
1%OTHER
RECORDED ADULT (15+) ALCOHOL CONSUMPTION BY TYPE OF ALCOHOLIC BEVERAGE (IN % OF PURE ALCOHOL), 2005
Beer includes malt beers. Wine includes wine made from grapes. Spirits include all distilled beverages. Other includes one or several other alcoholic beverages, such as fermented beverages made from sorghum, maize, millet, rice, or cider, fruit wine, fortifi ed wine, etc.
Adult (15+) per capita consumption, average 2003–2005 (in litres of pure alcohol):
Recorded 12.3
Unrecorded 4.0
Total 16.3
WHO European Region 12.2
Hungary
Total population: 10 058 000 ➤ Population 15+ years: 85% ➤ Population in urban areas: 67% ➤ Income group (World Bank): High income
Data source: United Nations, data range 1990–2006.
SOCIOECONOMIC CONTEXT
Robust estimate of fi ve-year change in recorded adult(15+) per capita consumption,2001–2005:
INCREASE
➤ STABLE DECREASE
INCONCLUSIVE
15
2000 2002
Litre
s of
pur
e al
coho
lENLARGEMENT OF RECORDED ADULT (15+) PER CAPITA CONSUMPTION, 2000–2005
Year
2003 20052001
10
5
ALCOHOL CONSUMPTION Population data (refer to the population 15 years and older and are in litres of pure alcohol).
1961 1966 1976Li
tres
of p
ure
alco
hol
1991
RECORDED ADULT (15+) PER CAPITA CONSUMPTION, 1961–2005
Year
1971 1981 200119961986 2006
Change in data source from 2000
Beer Wine Spirits Other Total
15
5
10
20
20040
040%WINE
24%SPIRITS

21
PATTERNS OF DRINKING
ABSTAINERS (15+ years), 2001
Males Females Total
Lifetime abstainers 5.1% 12.8% 9.0%
Former drinkers 9.6% 7.5% 8.6%
Abstainers* 14.7% 20.3% 17.6%
* Persons who did not drink in the past 12 months.
DRINKERS ONLY
Adult (15+ years) per capita consumption*, total 7.66
Adult (15+ years) per capita consumption*, males 10.75
Adult (15+ years) per capita consumption*, females 4.96
Heavy episodic drinkers** (15–85+ years), males, 2001 13.2%
Heavy episodic drinkers** (15–85+ years), females, 2001 4.0%
* (Recorded + unrecorded) in litres of pure alcohol, average 2003–2005.** Had at least 60 grams or more of pure alcohol on at least one occasion weekly.
PATTERNS OF DRINKING SCORE
Patterns of drinking score* LEAST RISKY 1 2 3 4 5 MOST RISKY
* Given the same level of consumption, the higher the patterns of drinking score, the greater the alcohol-attributable burden of disease for the country.
ALCOHOL POLICYExcise tax on beer / wine / spirits Yes / Yes / Yes
National legal minimum age for off-premise sales of alcoholic beverages (selling) (beer / wine / spirits) 20 / 20 / 20
National legal minimum age for on-premise sales of alcoholic beverages (serving) (beer / wine / spirits) 20 / 20 / 20
Restrictions for on-/off-premise sales of alcoholic beverages:Time (hours and days) / location (places and density) Yes / YesSpecifi c events / intoxicated persons / petrol stations Yes / No / Yes
National maximum legal blood alcohol concentration (BAC) when driving a vehicle (general / young / professional), in % 0.05 / 0.05 / 0.05
Legally binding regulations on alcohol advertising / product placement Yes / Yes
Legally binding regulations on alcohol sponsorship / sales promotion Yes / Yes
HEALTH CONSEQUENCES
MORBIDITY
Prevalence estimates (12-month prevalence for 2004): Males Females
Alcohol use disorders (15+ years) 2.97% 0.73%
ALL CAUSE MORTALITY
Age-standardized deaths rates, 15+ years (per 100,000 population)
2000 2001 2002 2003 2004 2005
M F M F M F M F M F M F
Liver cirrhosisNo information availableRoad traffi c
accidents (1)
Data source: WHO Mortality Database, data as reported by countries (1) refer to transport accidents.
28%WINE
RECORDED ADULT (15+) ALCOHOL CONSUMPTION BY TYPE OF ALCOHOLIC BEVERAGE (IN % OF PURE ALCOHOL), 2005
Beer includes malt beers. Wine includes wine made from grapes. Spirits include all distilled beverages. Other includes one or several other alcoholic beverages, such as fermented beverages made from sorghum, maize, millet, rice, or cider, fruit wine, fortifi ed wine, etc.
Adult (15+) per capita consumption, average 2003–2005 (in litres of pure alcohol):
Recorded 5.9
Unrecorded 0.4
Total 6.3
WHO European Region 12.2
Total population: 298 000 ➤ Population 15+ years: 78% ➤ Population in urban areas: 93% ➤ Income group (World Bank): High income
Data source: United Nations, data range 1990–2006.
SOCIOECONOMIC CONTEXT
Robust estimate of fi ve-year change in recorded adult(15+) per capita consumption,2001–2005:
INCREASE
➤ STABLE DECREASE
INCONCLUSIVE
Iceland
8
2000 2002
Litre
s of
pur
e al
coho
l
ENLARGEMENT OF RECORDED ADULT (15+) PER CAPITA CONSUMPTION, 2000–2007
Year
2003 20072001
ALCOHOL CONSUMPTION Population data (refer to the population 15 years and older and are in litres of pure alcohol).
1961 1966 1976
Litre
s of
pur
e al
coho
l
1991
RECORDED ADULT (15+) PER CAPITA CONSUMPTION, 1961–2007
Year
1971 1981 200119961986 2006
Change in data source from 2000
Beer Wine Spirits Other Total
15
5
10
20
2005
4
2
6
20062004
0
0
1%OTHER
52%BEER
19%SPIRITS
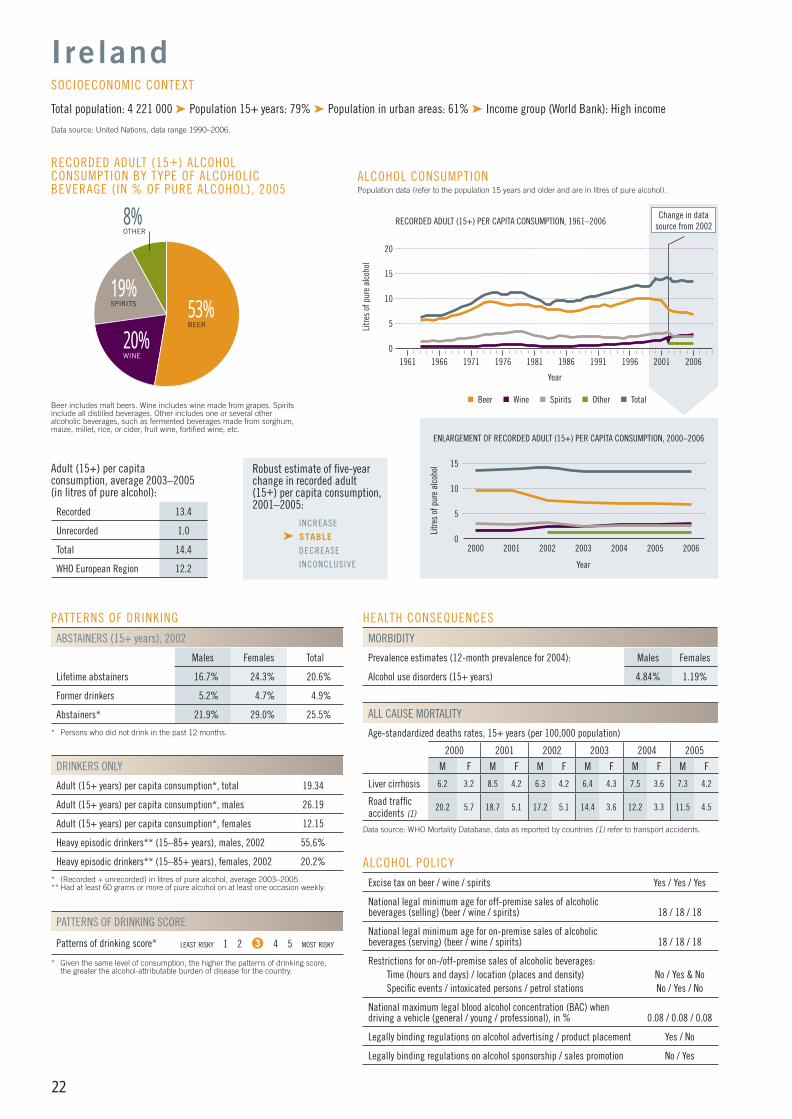
22
PATTERNS OF DRINKING
ABSTAINERS (15+ years), 2002
Males Females Total
Lifetime abstainers 16.7% 24.3% 20.6%
Former drinkers 5.2% 4.7% 4.9%
Abstainers* 21.9% 29.0% 25.5%
* Persons who did not drink in the past 12 months.
DRINKERS ONLY
Adult (15+ years) per capita consumption*, total 19.34
Adult (15+ years) per capita consumption*, males 26.19
Adult (15+ years) per capita consumption*, females 12.15
Heavy episodic drinkers** (15–85+ years), males, 2002 55.6%
Heavy episodic drinkers** (15–85+ years), females, 2002 20.2%
* (Recorded + unrecorded) in litres of pure alcohol, average 2003–2005.** Had at least 60 grams or more of pure alcohol on at least one occasion weekly.
PATTERNS OF DRINKING SCORE
Patterns of drinking score* LEAST RISKY 1 2 3 4 5 MOST RISKY
* Given the same level of consumption, the higher the patterns of drinking score, the greater the alcohol-attributable burden of disease for the country.
ALCOHOL POLICYExcise tax on beer / wine / spirits Yes / Yes / Yes
National legal minimum age for off-premise sales of alcoholic beverages (selling) (beer / wine / spirits) 18 / 18 / 18
National legal minimum age for on-premise sales of alcoholic beverages (serving) (beer / wine / spirits) 18 / 18 / 18
Restrictions for on-/off-premise sales of alcoholic beverages:Time (hours and days) / location (places and density) No / Yes & NoSpecifi c events / intoxicated persons / petrol stations No / Yes / No
National maximum legal blood alcohol concentration (BAC) when driving a vehicle (general / young / professional), in % 0.08 / 0.08 / 0.08
Legally binding regulations on alcohol advertising / product placement Yes / No
Legally binding regulations on alcohol sponsorship / sales promotion No / Yes
HEALTH CONSEQUENCES
MORBIDITY
Prevalence estimates (12-month prevalence for 2004): Males Females
Alcohol use disorders (15+ years) 4.84% 1.19%
ALL CAUSE MORTALITY
Age-standardized deaths rates, 15+ years (per 100,000 population)
2000 2001 2002 2003 2004 2005
M F M F M F M F M F M F
Liver cirrhosis 6.2 3.2 8.5 4.2 6.3 4.2 6.4 4.3 7.5 3.6 7.3 4.2
Road traffi c accidents (1)
20.2 5.7 18.7 5.1 17.2 5.1 14.4 3.6 12.2 3.3 11.5 4.5
Data source: WHO Mortality Database, data as reported by countries (1) refer to transport accidents.
53%BEER
8%OTHER
RECORDED ADULT (15+) ALCOHOL CONSUMPTION BY TYPE OF ALCOHOLIC BEVERAGE (IN % OF PURE ALCOHOL), 2005
Beer includes malt beers. Wine includes wine made from grapes. Spirits include all distilled beverages. Other includes one or several other alcoholic beverages, such as fermented beverages made from sorghum, maize, millet, rice, or cider, fruit wine, fortifi ed wine, etc.
Adult (15+) per capita consumption, average 2003–2005 (in litres of pure alcohol):
Recorded 13.4
Unrecorded 1.0
Total 14.4
WHO European Region 12.2
I reland
Total population: 4 221 000 ➤ Population 15+ years: 79% ➤ Population in urban areas: 61% ➤ Income group (World Bank): High income
Data source: United Nations, data range 1990–2006.
SOCIOECONOMIC CONTEXT
Robust estimate of fi ve-year change in recorded adult(15+) per capita consumption,2001–2005:
INCREASE
➤ STABLE DECREASE
INCONCLUSIVE
15
2000 2002
Litre
s of
pur
e al
coho
lENLARGEMENT OF RECORDED ADULT (15+) PER CAPITA CONSUMPTION, 2000–2006
Year
2003 20062001
10
5
ALCOHOL CONSUMPTION Population data (refer to the population 15 years and older and are in litres of pure alcohol).
1961 1966 1976Li
tres
of p
ure
alco
hol
1991
RECORDED ADULT (15+) PER CAPITA CONSUMPTION, 1961–2006
Year
1971 1981 200119961986 2006
Change in data source from 2002
Beer Wine Spirits Other Total
15
5
10
20
2004 20050
020%WINE
19%SPIRITS
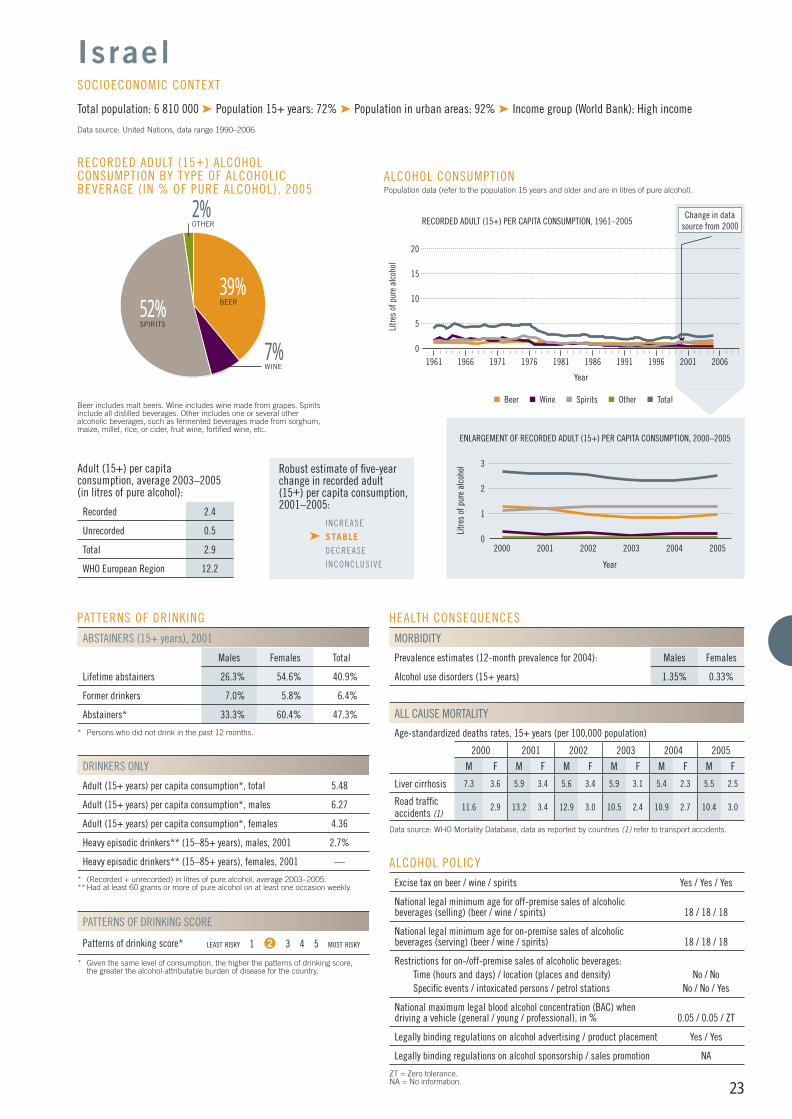
23
PATTERNS OF DRINKING
ABSTAINERS (15+ years), 2001
Males Females Total
Lifetime abstainers 26.3% 54.6% 40.9%
Former drinkers 7.0% 5.8% 6.4%
Abstainers* 33.3% 60.4% 47.3%
* Persons who did not drink in the past 12 months.
DRINKERS ONLY
Adult (15+ years) per capita consumption*, total 5.48
Adult (15+ years) per capita consumption*, males 6.27
Adult (15+ years) per capita consumption*, females 4.36
Heavy episodic drinkers** (15–85+ years), males, 2001 2.7%
Heavy episodic drinkers** (15–85+ years), females, 2001 —
* (Recorded + unrecorded) in litres of pure alcohol, average 2003–2005.** Had at least 60 grams or more of pure alcohol on at least one occasion weekly.
PATTERNS OF DRINKING SCORE
Patterns of drinking score* LEAST RISKY 1 2 3 4 5 MOST RISKY
* Given the same level of consumption, the higher the patterns of drinking score, the greater the alcohol-attributable burden of disease for the country.
ALCOHOL POLICYExcise tax on beer / wine / spirits Yes / Yes / Yes
National legal minimum age for off-premise sales of alcoholic beverages (selling) (beer / wine / spirits) 18 / 18 / 18
National legal minimum age for on-premise sales of alcoholic beverages (serving) (beer / wine / spirits) 18 / 18 / 18
Restrictions for on-/off-premise sales of alcoholic beverages:Time (hours and days) / location (places and density) No / NoSpecifi c events / intoxicated persons / petrol stations No / No / Yes
National maximum legal blood alcohol concentration (BAC) when driving a vehicle (general / young / professional), in % 0.05 / 0.05 / ZT
Legally binding regulations on alcohol advertising / product placement Yes / Yes
Legally binding regulations on alcohol sponsorship / sales promotion NA
ZT = Zero tolerance.NA = No information.
HEALTH CONSEQUENCES
MORBIDITY
Prevalence estimates (12-month prevalence for 2004): Males Females
Alcohol use disorders (15+ years) 1.35% 0.33%
ALL CAUSE MORTALITY
Age-standardized deaths rates, 15+ years (per 100,000 population)
2000 2001 2002 2003 2004 2005
M F M F M F M F M F M F
Liver cirrhosis 7.3 3.6 5.9 3.4 5.6 3.4 5.9 3.1 5.4 2.3 5.5 2.5
Road traffi c accidents (1)
11.6 2.9 13.2 3.4 12.9 3.0 10.5 2.4 10.9 2.7 10.4 3.0
Data source: WHO Mortality Database, data as reported by countries (1) refer to transport accidents.
39%BEER
2%OTHER
RECORDED ADULT (15+) ALCOHOL CONSUMPTION BY TYPE OF ALCOHOLIC BEVERAGE (IN % OF PURE ALCOHOL), 2005
Beer includes malt beers. Wine includes wine made from grapes. Spirits include all distilled beverages. Other includes one or several other alcoholic beverages, such as fermented beverages made from sorghum, maize, millet, rice, or cider, fruit wine, fortifi ed wine, etc.
Adult (15+) per capita consumption, average 2003–2005 (in litres of pure alcohol):
Recorded 2.4
Unrecorded 0.5
Total 2.9
WHO European Region 12.2
Israel
Total population: 6 810 000 ➤ Population 15+ years: 72% ➤ Population in urban areas: 92% ➤ Income group (World Bank): High income
Data source: United Nations, data range 1990–2006.
SOCIOECONOMIC CONTEXT
Robust estimate of fi ve-year change in recorded adult(15+) per capita consumption,2001–2005:
INCREASE
➤ STABLE DECREASE
INCONCLUSIVE
3
2000 2002
Litre
s of
pur
e al
coho
l
ENLARGEMENT OF RECORDED ADULT (15+) PER CAPITA CONSUMPTION, 2000–2005
Year
2003 20052001
ALCOHOL CONSUMPTION Population data (refer to the population 15 years and older and are in litres of pure alcohol).
1961 1966 1976
Litre
s of
pur
e al
coho
l
1991
RECORDED ADULT (15+) PER CAPITA CONSUMPTION, 1961–2005
Year
1971 1981 200119961986 2006
Change in data source from 2000
Beer Wine Spirits Other Total
15
5
10
20
2004
2
1
0
0
52%SPIRITS
7%WINE

24
PATTERNS OF DRINKING
ABSTAINERS (15+ years), 2000
Males Females Total
Lifetime abstainers 5.8% 19.4% 13.0%
Former drinkers 3.9% 6.0% 5.0%
Abstainers* 9.7% 25.4% 18.0%
* Persons who did not drink in the past 12 months.
DRINKERS ONLY
Adult (15+ years) per capita consumption*, total 13.02
Adult (15+ years) per capita consumption*, males 17.06
Adult (15+ years) per capita consumption*, females 8.15
Heavy episodic drinkers** (15–85+ years), males, 2000 12.3%
Heavy episodic drinkers** (15–85+ years), females, 2000 10.1%
* (Recorded + unrecorded) in litres of pure alcohol, average 2003–2005.** Had at least 60 grams or more of pure alcohol on at least one occasion weekly.
PATTERNS OF DRINKING SCORE
Patterns of drinking score* LEAST RISKY 1 2 3 4 5 MOST RISKY
* Given the same level of consumption, the higher the patterns of drinking score, the greater the alcohol-attributable burden of disease for the country.
ALCOHOL POLICYExcise tax on beer / wine / spirits Yes / No / Yes
National legal minimum age for off-premise sales of alcoholic beverages (selling) (beer / wine / spirits) No / No / No
National legal minimum age for on-premise sales of alcoholic beverages (serving) (beer / wine / spirits) 16 / 16 / 16
Restrictions for on-/off-premise sales of alcoholic beverages:Time (hours and days) / location (places and density) Yes & No / NoSpecifi c events / intoxicated persons / petrol stations Yes / Yes / Yes
National maximum legal blood alcohol concentration (BAC) when driving a vehicle (general / young / professional), in % 0.05 / 0.05 / 0.05
Legally binding regulations on alcohol advertising / product placement Yes / Yes
Legally binding regulations on alcohol sponsorship / sales promotion Yes / Yes
HEALTH CONSEQUENCES
MORBIDITY
Prevalence estimates (12-month prevalence for 2004): Males Females
Alcohol use disorders (15+ years) 0.50% 0.41%
ALL CAUSE MORTALITY
Age-standardized deaths rates, 15+ years (per 100,000 population)
2000 2001 2002 2003 2004 2005
M F M F M F M F M F M F
Liver cirrhosis 20.7 9.8 20.4 9.5 18.5 8.9 16.4 7.4 — — — —
Road traffi c accidents (1)
24.0 6.4 24.6 6.2 24.6 5.7 22.0 5.0 — — — —
Data source: WHO Mortality Database, data as reported by countries (1) refer to transport accidents.
22%BEER
RECORDED ADULT (15+) ALCOHOL CONSUMPTION BY TYPE OF ALCOHOLIC BEVERAGE (IN % OF PURE ALCOHOL), 2005
Beer includes malt beers. Wine includes wine made from grapes. Spirits include all distilled beverages. Other includes one or several other alcoholic beverages, such as fermented beverages made from sorghum, maize, millet, rice, or cider, fruit wine, fortifi ed wine, etc.
Adult (15+) per capita consumption, average 2003–2005 (in litres of pure alcohol):
Recorded 8.3
Unrecorded 2.4
Total 10.7
WHO European Region 12.2
I taly
Total population: 58 779 000 ➤ Population 15+ years: 86% ➤ Population in urban areas: 68% ➤ Income group (World Bank): High income
Data source: United Nations, data range 1990–2006.
SOCIOECONOMIC CONTEXT
Robust estimate of fi ve-year change in recorded adult(15+) per capita consumption,2001–2005:
INCREASE
➤ STABLE DECREASE
INCONCLUSIVE
5%SPIRITS
10
2000 2002
Litre
s of
pur
e al
coho
lENLARGEMENT OF RECORDED ADULT (15+) PER CAPITA CONSUMPTION, 2000–2006
Year
2003 20062001
5
ALCOHOL CONSUMPTION Population data (refer to the population 15 years and older and are in litres of pure alcohol).
1961 1966 1976Li
tres
of p
ure
alco
hol
1991
RECORDED ADULT (15+) PER CAPITA CONSUMPTION, 1961–2006
Year
1971 1981 200119961986 2006
Change in data source from 2002
Beer Wine Spirits Total
15
5
10
20
2004 20050
073%WINE

25
PATTERNS OF DRINKING
ABSTAINERS (15+ years), 2003
Males Females Total
Lifetime abstainers 32.4% 44.1% 38.6%
Former drinkers 10.4% 10.1% 10.3%
Abstainers* 42.8% 54.2% 48.9%
* Persons who did not drink in the past 12 months.
DRINKERS ONLY
Adult (15+ years) per capita consumption*, total 21.45
Adult (15+ years) per capita consumption*, males 29.77
Adult (15+ years) per capita consumption*, females 12.66
Heavy episodic drinkers** (15–85+ years), males, 2003 16.8%
Heavy episodic drinkers** (15–85+ years), females, 2003 5.0%
* (Recorded + unrecorded) in litres of pure alcohol, average 2003–2005.** Had at least 60 grams or more of pure alcohol on at least one occasion weekly.
PATTERNS OF DRINKING SCORE
Patterns of drinking score* LEAST RISKY 1 2 3 4 5 MOST RISKY
* Given the same level of consumption, the higher the patterns of drinking score, the greater the alcohol-attributable burden of disease for the country.
ALCOHOL POLICYExcise tax on beer / wine / spirits Yes / Yes / Yes
National legal minimum age for off-premise sales of alcoholic beverages (selling) (beer / wine / spirits) 18 / 18 / 18
National legal minimum age for on-premise sales of alcoholic beverages (serving) (beer / wine / spirits) 18 / 18 / 18
Restrictions for on-/off-premise sales of alcoholic beverages:Time (hours and days) / location (places and density) Yes / YesSpecifi c events / intoxicated persons / petrol stations NA
National maximum legal blood alcohol concentration (BAC) when driving a vehicle (general / young / professional), in % 0.05 / 0.05 / 0.05
Legally binding regulations on alcohol advertising / product placement Yes / NA
Legally binding regulations on alcohol sponsorship / sales promotion NA
NA = No information.
HEALTH CONSEQUENCES
MORBIDITY
Prevalence estimates (12-month prevalence for 2004): Males Females
Alcohol use disorders (15+ years) 9.53% 1.48%
ALL CAUSE MORTALITY
Age-standardized deaths rates, 15+ years (per 100,000 population)
2000 2001 2002 2003 2004 2005
M F M F M F M F M F M F
Liver cirrhosis 44.7 23.7 49.5 24.1 50.7 25.6 60.1 28.3 — — — —
Road traffi c accidents (1)
22.8 5.7 25.1 7.9 24.8 7.4 27.2 7.0 39.8 10.7 47.7 15.1
Data source: WHO Mortality Database, data as reported by countries (1) refer to transport accidents.
27%BEER
<1%OTHER
RECORDED ADULT (15+) ALCOHOL CONSUMPTION BY TYPE OF ALCOHOLIC BEVERAGE (IN % OF PURE ALCOHOL), 2005
Beer includes malt beers. Wine includes wine made from grapes. Spirits include all distilled beverages. Other includes one or several other alcoholic beverages, such as fermented beverages made from sorghum, maize, millet, rice, or cider, fruit wine, fortifi ed wine, etc.
Adult (15+) per capita consumption, average 2003–2005 (in litres of pure alcohol):
Recorded 6.1
Unrecorded 4.9
Total 11.0
WHO European Region 12.2
Kazakhstan
Total population: 15 314 000 ➤ Population 15+ years: 76% ➤ Population in urban areas: 58% ➤ Income group (World Bank): Upper-middle income
Data source: United Nations, data range 1990–2006.
SOCIOECONOMIC CONTEXT
Robust estimate of fi ve-year change in recorded adult(15+) per capita consumption,2001–2005:
➤ INCREASE STABLE
DECREASE
INCONCLUSIVE
5%WINE
8
2000 2002
Litre
s of
pur
e al
coho
l
ENLARGEMENT OF RECORDED ADULT (15+) PER CAPITA CONSUMPTION, 2000–2005
Year
2003 20052001
ALCOHOL CONSUMPTION Population data (refer to the population 15 years and older and are in litres of pure alcohol).
1961 1966 1976
Litre
s of
pur
e al
coho
l
1991
RECORDED ADULT (15+) PER CAPITA CONSUMPTION, 1961–2005
Year
1971 1981 200119961986 2006
Change in data source from 2000
Beer Wine Spirits Other Total
15
5
10
20
2004
4
2
6
0
0
68%SPIRITS
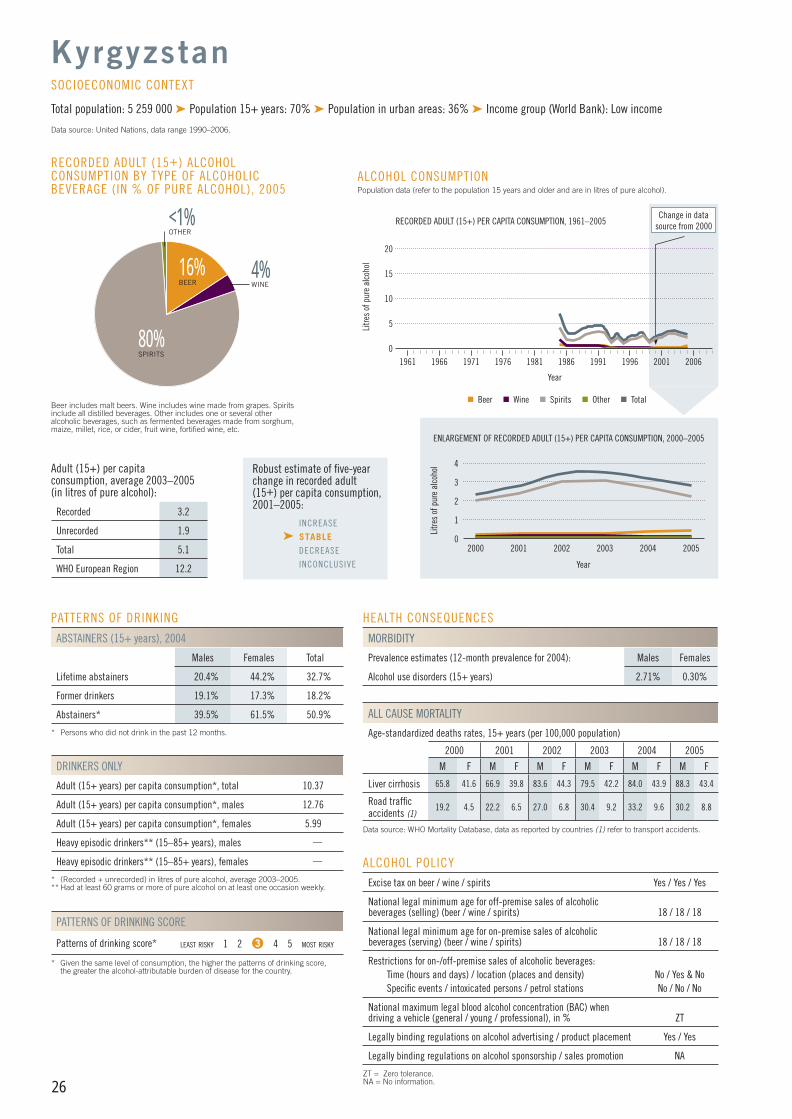
26
PATTERNS OF DRINKING
ABSTAINERS (15+ years), 2004
Males Females Total
Lifetime abstainers 20.4% 44.2% 32.7%
Former drinkers 19.1% 17.3% 18.2%
Abstainers* 39.5% 61.5% 50.9%
* Persons who did not drink in the past 12 months.
DRINKERS ONLY
Adult (15+ years) per capita consumption*, total 10.37
Adult (15+ years) per capita consumption*, males 12.76
Adult (15+ years) per capita consumption*, females 5.99
Heavy episodic drinkers** (15–85+ years), males —
Heavy episodic drinkers** (15–85+ years), females —
* (Recorded + unrecorded) in litres of pure alcohol, average 2003–2005.** Had at least 60 grams or more of pure alcohol on at least one occasion weekly.
PATTERNS OF DRINKING SCORE
Patterns of drinking score* LEAST RISKY 1 2 3 4 5 MOST RISKY
* Given the same level of consumption, the higher the patterns of drinking score, the greater the alcohol-attributable burden of disease for the country.
ALCOHOL POLICYExcise tax on beer / wine / spirits Yes / Yes / Yes
National legal minimum age for off-premise sales of alcoholic beverages (selling) (beer / wine / spirits) 18 / 18 / 18
National legal minimum age for on-premise sales of alcoholic beverages (serving) (beer / wine / spirits) 18 / 18 / 18
Restrictions for on-/off-premise sales of alcoholic beverages:Time (hours and days) / location (places and density) No / Yes & NoSpecifi c events / intoxicated persons / petrol stations No / No / No
National maximum legal blood alcohol concentration (BAC) when driving a vehicle (general / young / professional), in % ZT
Legally binding regulations on alcohol advertising / product placement Yes / Yes
Legally binding regulations on alcohol sponsorship / sales promotion NA
ZT = Zero tolerance.NA = No information.
HEALTH CONSEQUENCES
MORBIDITY
Prevalence estimates (12-month prevalence for 2004): Males Females
Alcohol use disorders (15+ years) 2.71% 0.30%
ALL CAUSE MORTALITY
Age-standardized deaths rates, 15+ years (per 100,000 population)
2000 2001 2002 2003 2004 2005
M F M F M F M F M F M F
Liver cirrhosis 65.8 41.6 66.9 39.8 83.6 44.3 79.5 42.2 84.0 43.9 88.3 43.4
Road traffi c accidents (1)
19.2 4.5 22.2 6.5 27.0 6.8 30.4 9.2 33.2 9.6 30.2 8.8
Data source: WHO Mortality Database, data as reported by countries (1) refer to transport accidents.
16%BEER
<1%OTHER
RECORDED ADULT (15+) ALCOHOL CONSUMPTION BY TYPE OF ALCOHOLIC BEVERAGE (IN % OF PURE ALCOHOL), 2005
Beer includes malt beers. Wine includes wine made from grapes. Spirits include all distilled beverages. Other includes one or several other alcoholic beverages, such as fermented beverages made from sorghum, maize, millet, rice, or cider, fruit wine, fortifi ed wine, etc.
Adult (15+) per capita consumption, average 2003–2005 (in litres of pure alcohol):
Recorded 3.2
Unrecorded 1.9
Total 5.1
WHO European Region 12.2
Kyrgyzstan
Total population: 5 259 000 ➤ Population 15+ years: 70% ➤ Population in urban areas: 36% ➤ Income group (World Bank): Low income
Data source: United Nations, data range 1990–2006.
SOCIOECONOMIC CONTEXT
Robust estimate of fi ve-year change in recorded adult(15+) per capita consumption,2001–2005:
INCREASE
➤ STABLE DECREASE
INCONCLUSIVE
4%WINE
4
2000 2002
Litre
s of
pur
e al
coho
lENLARGEMENT OF RECORDED ADULT (15+) PER CAPITA CONSUMPTION, 2000–2005
Year
2003 20052001
3
2
ALCOHOL CONSUMPTION Population data (refer to the population 15 years and older and are in litres of pure alcohol).
1961 1966 1976Li
tres
of p
ure
alco
hol
1991
RECORDED ADULT (15+) PER CAPITA CONSUMPTION, 1961–2005
Year
1971 1981 200119961986 2006
Change in data source from 2000
Beer Wine Spirits Other Total
15
5
10
20
2004
1
0
080%SPIRITS
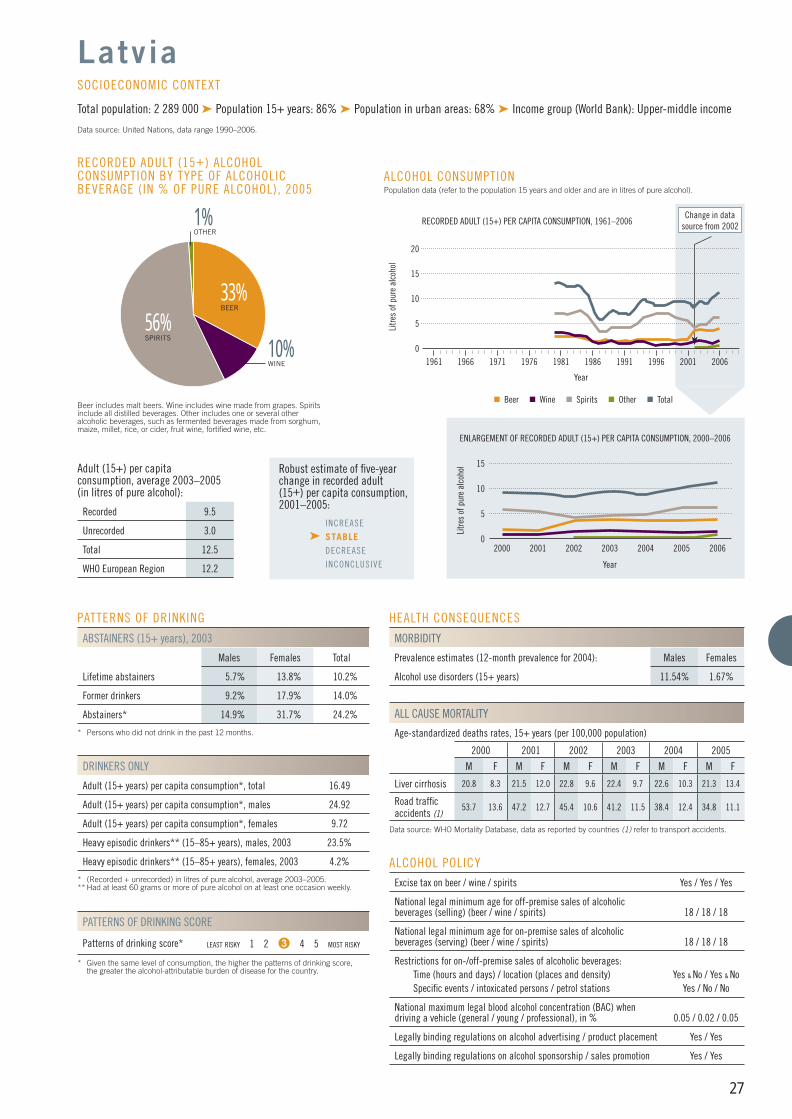
27
PATTERNS OF DRINKING
ABSTAINERS (15+ years), 2003
Males Females Total
Lifetime abstainers 5.7% 13.8% 10.2%
Former drinkers 9.2% 17.9% 14.0%
Abstainers* 14.9% 31.7% 24.2%
* Persons who did not drink in the past 12 months.
DRINKERS ONLY
Adult (15+ years) per capita consumption*, total 16.49
Adult (15+ years) per capita consumption*, males 24.92
Adult (15+ years) per capita consumption*, females 9.72
Heavy episodic drinkers** (15–85+ years), males, 2003 23.5%
Heavy episodic drinkers** (15–85+ years), females, 2003 4.2%
* (Recorded + unrecorded) in litres of pure alcohol, average 2003–2005.** Had at least 60 grams or more of pure alcohol on at least one occasion weekly.
PATTERNS OF DRINKING SCORE
Patterns of drinking score* LEAST RISKY 1 2 3 4 5 MOST RISKY
* Given the same level of consumption, the higher the patterns of drinking score, the greater the alcohol-attributable burden of disease for the country.
ALCOHOL POLICYExcise tax on beer / wine / spirits Yes / Yes / Yes
National legal minimum age for off-premise sales of alcoholic beverages (selling) (beer / wine / spirits) 18 / 18 / 18
National legal minimum age for on-premise sales of alcoholic beverages (serving) (beer / wine / spirits) 18 / 18 / 18
Restrictions for on-/off-premise sales of alcoholic beverages:Time (hours and days) / location (places and density) Yes & No / Yes & NoSpecifi c events / intoxicated persons / petrol stations Yes / No / No
National maximum legal blood alcohol concentration (BAC) when driving a vehicle (general / young / professional), in % 0.05 / 0.02 / 0.05
Legally binding regulations on alcohol advertising / product placement Yes / Yes
Legally binding regulations on alcohol sponsorship / sales promotion Yes / Yes
HEALTH CONSEQUENCES
MORBIDITY
Prevalence estimates (12-month prevalence for 2004): Males Females
Alcohol use disorders (15+ years) 11.54% 1.67%
ALL CAUSE MORTALITY
Age-standardized deaths rates, 15+ years (per 100,000 population)
2000 2001 2002 2003 2004 2005
M F M F M F M F M F M F
Liver cirrhosis 20.8 8.3 21.5 12.0 22.8 9.6 22.4 9.7 22.6 10.3 21.3 13.4
Road traffi c accidents (1)
53.7 13.6 47.2 12.7 45.4 10.6 41.2 11.5 38.4 12.4 34.8 11.1
Data source: WHO Mortality Database, data as reported by countries (1) refer to transport accidents.
33%BEER
1%OTHER
RECORDED ADULT (15+) ALCOHOL CONSUMPTION BY TYPE OF ALCOHOLIC BEVERAGE (IN % OF PURE ALCOHOL), 2005
Beer includes malt beers. Wine includes wine made from grapes. Spirits include all distilled beverages. Other includes one or several other alcoholic beverages, such as fermented beverages made from sorghum, maize, millet, rice, or cider, fruit wine, fortifi ed wine, etc.
Adult (15+) per capita consumption, average 2003–2005 (in litres of pure alcohol):
Recorded 9.5
Unrecorded 3.0
Total 12.5
WHO European Region 12.2
Latvia
Total population: 2 289 000 ➤ Population 15+ years: 86% ➤ Population in urban areas: 68% ➤ Income group (World Bank): Upper-middle income
Data source: United Nations, data range 1990–2006.
SOCIOECONOMIC CONTEXT
Robust estimate of fi ve-year change in recorded adult(15+) per capita consumption,2001–2005:
INCREASE
➤ STABLE DECREASE
INCONCLUSIVE
10%WINE
15
2000 2002
Litre
s of
pur
e al
coho
l
ENLARGEMENT OF RECORDED ADULT (15+) PER CAPITA CONSUMPTION, 2000–2006
Year
2003 20062001
ALCOHOL CONSUMPTION Population data (refer to the population 15 years and older and are in litres of pure alcohol).
1961 1966 1976
Litre
s of
pur
e al
coho
l
1991
RECORDED ADULT (15+) PER CAPITA CONSUMPTION, 1961–2006
Year
1971 1981 200119961986 2006
Change in data source from 2002
Beer Wine Spirits Other Total
15
5
10
20
2004
10
5
2005
0
0
56%SPIRITS
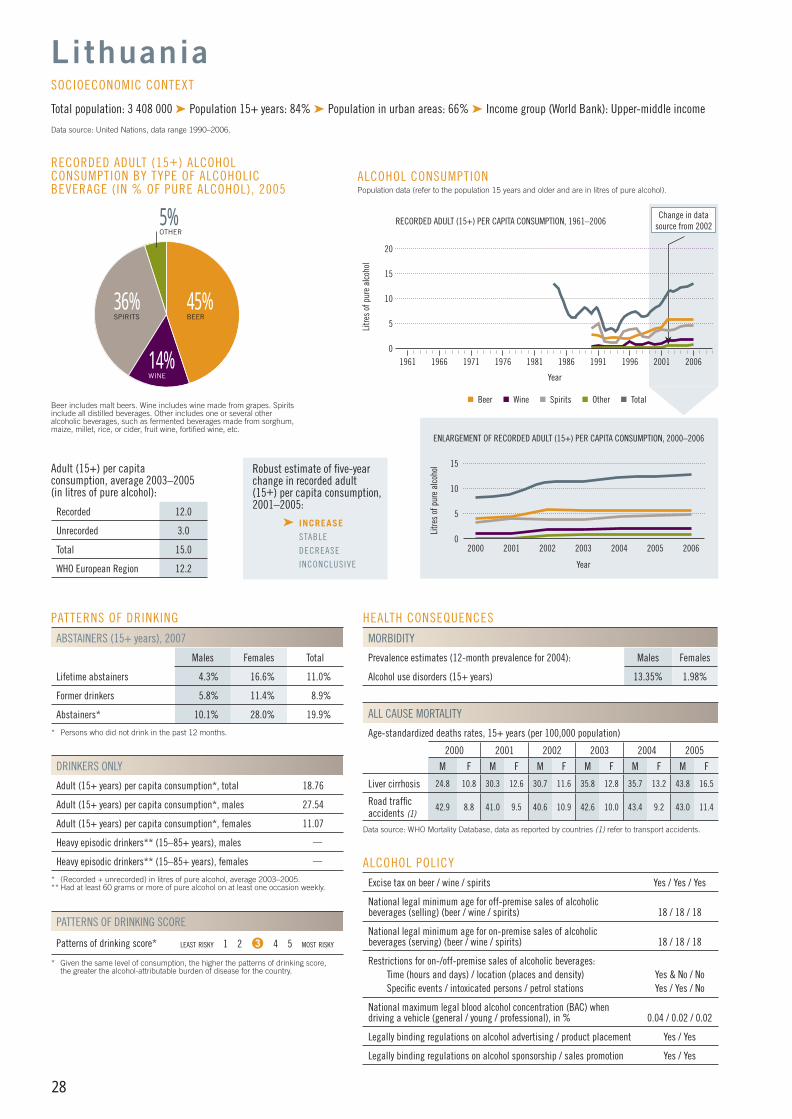
28
PATTERNS OF DRINKING
ABSTAINERS (15+ years), 2007
Males Females Total
Lifetime abstainers 4.3% 16.6% 11.0%
Former drinkers 5.8% 11.4% 8.9%
Abstainers* 10.1% 28.0% 19.9%
* Persons who did not drink in the past 12 months.
DRINKERS ONLY
Adult (15+ years) per capita consumption*, total 18.76
Adult (15+ years) per capita consumption*, males 27.54
Adult (15+ years) per capita consumption*, females 11.07
Heavy episodic drinkers** (15–85+ years), males —
Heavy episodic drinkers** (15–85+ years), females —
* (Recorded + unrecorded) in litres of pure alcohol, average 2003–2005.** Had at least 60 grams or more of pure alcohol on at least one occasion weekly.
PATTERNS OF DRINKING SCORE
Patterns of drinking score* LEAST RISKY 1 2 3 4 5 MOST RISKY
* Given the same level of consumption, the higher the patterns of drinking score, the greater the alcohol-attributable burden of disease for the country.
ALCOHOL POLICYExcise tax on beer / wine / spirits Yes / Yes / Yes
National legal minimum age for off-premise sales of alcoholic beverages (selling) (beer / wine / spirits) 18 / 18 / 18
National legal minimum age for on-premise sales of alcoholic beverages (serving) (beer / wine / spirits) 18 / 18 / 18
Restrictions for on-/off-premise sales of alcoholic beverages:Time (hours and days) / location (places and density) Yes & No / NoSpecifi c events / intoxicated persons / petrol stations Yes / Yes / No
National maximum legal blood alcohol concentration (BAC) when driving a vehicle (general / young / professional), in % 0.04 / 0.02 / 0.02
Legally binding regulations on alcohol advertising / product placement Yes / Yes
Legally binding regulations on alcohol sponsorship / sales promotion Yes / Yes
HEALTH CONSEQUENCES
MORBIDITY
Prevalence estimates (12-month prevalence for 2004): Males Females
Alcohol use disorders (15+ years) 13.35% 1.98%
ALL CAUSE MORTALITY
Age-standardized deaths rates, 15+ years (per 100,000 population)
2000 2001 2002 2003 2004 2005
M F M F M F M F M F M F
Liver cirrhosis 24.8 10.8 30.3 12.6 30.7 11.6 35.8 12.8 35.7 13.2 43.8 16.5
Road traffi c accidents (1)
42.9 8.8 41.0 9.5 40.6 10.9 42.6 10.0 43.4 9.2 43.0 11.4
Data source: WHO Mortality Database, data as reported by countries (1) refer to transport accidents.
45%BEER
5%OTHER
RECORDED ADULT (15+) ALCOHOL CONSUMPTION BY TYPE OF ALCOHOLIC BEVERAGE (IN % OF PURE ALCOHOL), 2005
Beer includes malt beers. Wine includes wine made from grapes. Spirits include all distilled beverages. Other includes one or several other alcoholic beverages, such as fermented beverages made from sorghum, maize, millet, rice, or cider, fruit wine, fortifi ed wine, etc.
Adult (15+) per capita consumption, average 2003–2005 (in litres of pure alcohol):
Recorded 12.0
Unrecorded 3.0
Total 15.0
WHO European Region 12.2
Lithuania
Total population: 3 408 000 ➤ Population 15+ years: 84% ➤ Population in urban areas: 66% ➤ Income group (World Bank): Upper-middle income
Data source: United Nations, data range 1990–2006.
SOCIOECONOMIC CONTEXT
Robust estimate of fi ve-year change in recorded adult(15+) per capita consumption,2001–2005:
➤ INCREASE STABLE
DECREASE
INCONCLUSIVE
15
2000 2002
Litre
s of
pur
e al
coho
lENLARGEMENT OF RECORDED ADULT (15+) PER CAPITA CONSUMPTION, 2000–2006
Year
2003 20062001
5
ALCOHOL CONSUMPTION Population data (refer to the population 15 years and older and are in litres of pure alcohol).
1961 1966 1976Li
tres
of p
ure
alco
hol
1991
RECORDED ADULT (15+) PER CAPITA CONSUMPTION, 1961–2006
Year
1971 1981 200119961986 2006
Change in data source from 2002
Beer Wine Spirits Other Total
15
5
10
20
2004 2005
10
0
0
36%SPIRITS
14%WINE
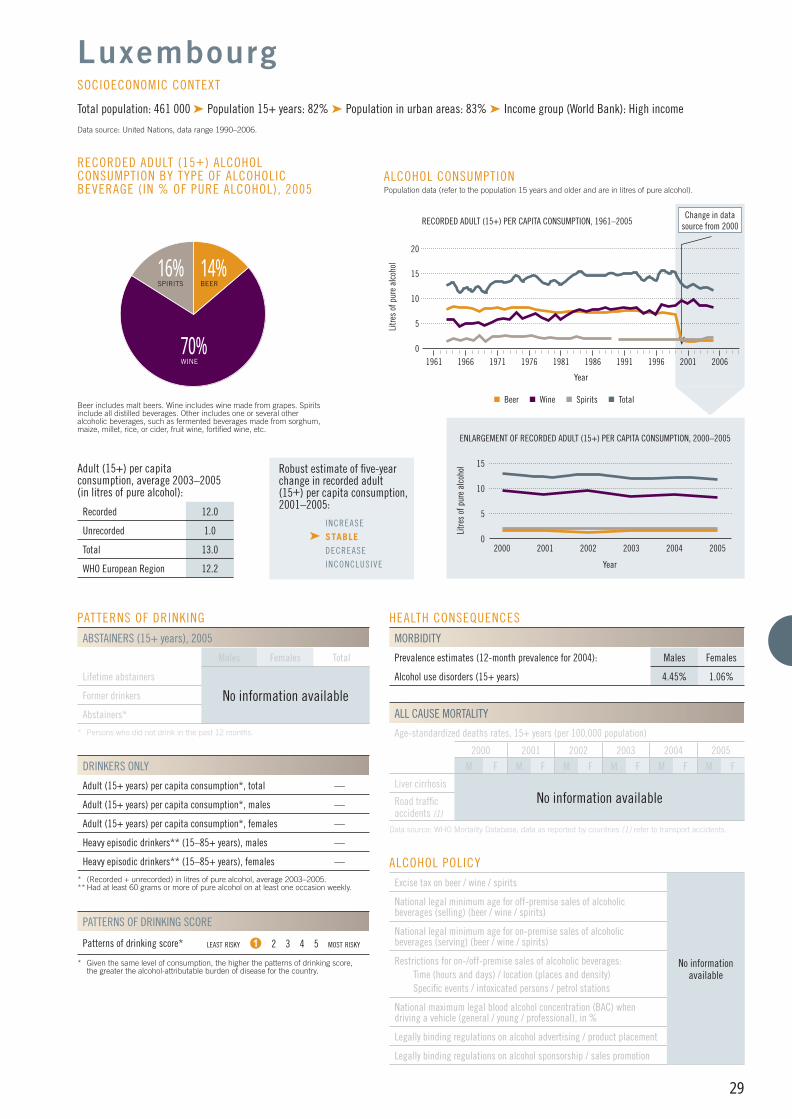
29
PATTERNS OF DRINKING
ABSTAINERS (15+ years), 2005
Males Females Total
Lifetime abstainers
No information availableFormer drinkers
Abstainers*
* Persons who did not drink in the past 12 months.
DRINKERS ONLY
Adult (15+ years) per capita consumption*, total —
Adult (15+ years) per capita consumption*, males —
Adult (15+ years) per capita consumption*, females —
Heavy episodic drinkers** (15–85+ years), males —
Heavy episodic drinkers** (15–85+ years), females —
* (Recorded + unrecorded) in litres of pure alcohol, average 2003–2005.** Had at least 60 grams or more of pure alcohol on at least one occasion weekly.
PATTERNS OF DRINKING SCORE
Patterns of drinking score* LEAST RISKY 1 2 3 4 5 MOST RISKY
* Given the same level of consumption, the higher the patterns of drinking score, the greater the alcohol-attributable burden of disease for the country.
HEALTH CONSEQUENCES
MORBIDITY
Prevalence estimates (12-month prevalence for 2004): Males Females
Alcohol use disorders (15+ years) 4.45% 1.06%
ALL CAUSE MORTALITY
Age-standardized deaths rates, 15+ years (per 100,000 population)
2000 2001 2002 2003 2004 2005
M F M F M F M F M F M F
Liver cirrhosisNo information availableRoad traffi c
accidents (1)
Data source: WHO Mortality Database, data as reported by countries (1) refer to transport accidents.
70%WINE
RECORDED ADULT (15+) ALCOHOL CONSUMPTION BY TYPE OF ALCOHOLIC BEVERAGE (IN % OF PURE ALCOHOL), 2005
Beer includes malt beers. Wine includes wine made from grapes. Spirits include all distilled beverages. Other includes one or several other alcoholic beverages, such as fermented beverages made from sorghum, maize, millet, rice, or cider, fruit wine, fortifi ed wine, etc.
Adult (15+) per capita consumption, average 2003–2005 (in litres of pure alcohol):
Recorded 12.0
Unrecorded 1.0
Total 13.0
WHO European Region 12.2
Luxembourg
Total population: 461 000 ➤ Population 15+ years: 82% ➤ Population in urban areas: 83% ➤ Income group (World Bank): High income
Data source: United Nations, data range 1990–2006.
SOCIOECONOMIC CONTEXT
15
2000 2002
Litre
s of
pur
e al
coho
l
ENLARGEMENT OF RECORDED ADULT (15+) PER CAPITA CONSUMPTION, 2000–2005
Year
2003 20052001
ALCOHOL CONSUMPTION Population data (refer to the population 15 years and older and are in litres of pure alcohol).
1961 1966 1976
Litre
s of
pur
e al
coho
l
1991
RECORDED ADULT (15+) PER CAPITA CONSUMPTION, 1961–2005
Year
1971 1981 200119961986 2006
Change in data source from 2000
Beer Wine Spirits Total
15
5
10
20
2004
10
5
0
0
14%BEER
16%SPIRITS
Robust estimate of fi ve-year change in recorded adult(15+) per capita consumption,2001–2005:
INCREASE
➤ STABLE DECREASE
INCONCLUSIVE
ALCOHOL POLICYExcise tax on beer / wine / spirits Yes / No / Yes
National legal minimum age for off-premise sales of alcoholic beverages (selling) (beer / wine / spirits) 16 / 16 / 18
National legal minimum age for on-premise sales of alcoholic beverages (serving) (beer / wine / spirits) 16 / 16 / 18
Restrictions for on-/off-premise sales of alcoholic beverages:Time (hours and days) / location (places and density) Yes / NoSpecifi c events / intoxicated persons / petrol stations Yes / No / No
National maximum legal blood alcohol concentration (BAC) when driving a vehicle (general / young / professional), in % 0.05 / 0.05 / 0.05
Legally binding regulations on alcohol advertising / product placement Yes / Yes
Legally binding regulations on alcohol sponsorship / sales promotion Yes / Yes
No information available

30
PATTERNS OF DRINKING
ABSTAINERS (15+ years), 2005
Males Females Total
Lifetime abstainers
No information availableFormer drinkers
Abstainers*
* Persons who did not drink in the past 12 months.
DRINKERS ONLY
Adult (15+ years) per capita consumption*, total —
Adult (15+ years) per capita consumption*, males —
Adult (15+ years) per capita consumption*, females —
Heavy episodic drinkers** (15–85+ years), males —
Heavy episodic drinkers** (15–85+ years), females —
* (Recorded + unrecorded) in litres of pure alcohol, average 2003–2005.** Had at least 60 grams or more of pure alcohol on at least one occasion weekly.
PATTERNS OF DRINKING SCORE
Patterns of drinking score* LEAST RISKY 1 2 3 4 5 MOST RISKY
* Given the same level of consumption, the higher the patterns of drinking score, the greater the alcohol-attributable burden of disease for the country.
ALCOHOL POLICYExcise tax on beer / wine / spirits Yes / No Yes
National legal minimum age for off-premise sales of alcoholic beverages (selling) (beer / wine / spirits) 17 / 17 / 17
National legal minimum age for on-premise sales of alcoholic beverages (serving) (beer / wine / spirits) 17 / 17 / 17
Restrictions for on-/off-premise sales of alcoholic beverages:Time (hours and days) / location (places and density) No / No Specifi c events / intoxicated persons / petrol stations Yes / Yes / NA
National maximum legal blood alcohol concentration (BAC) when driving a vehicle (general / young / professional), in % 0.08 / 0.08 / 0.08
Legally binding regulations on alcohol advertising / product placement Yes / Yes
Legally binding regulations on alcohol sponsorship / sales promotion Yes / No
NA = No information.
HEALTH CONSEQUENCES
MORBIDITY
Prevalence estimates (12-month prevalence for 2004): Males Females
Alcohol use disorders (15+ years) 2.55% 0.60%
ALL CAUSE MORTALITY
Age-standardized deaths rates, 15+ years (per 100,000 population)
2000 2001 2002 2003 2004 2005
M F M F M F M F M F M F
Liver cirrhosisNo information availableRoad traffi c
accidents (1)
Data source: WHO Mortality Database, data as reported by countries (1) refer to transport accidents.
34%BEER
5%OTHER
RECORDED ADULT (15+) ALCOHOL CONSUMPTION BY TYPE OF ALCOHOLIC BEVERAGE (IN % OF PURE ALCOHOL), 2005
Beer includes malt beers. Wine includes wine made from grapes. Spirits include all distilled beverages. Other includes one or several other alcoholic beverages, such as fermented beverages made from sorghum, maize, millet, rice, or cider, fruit wine, fortifi ed wine, etc.
Adult (15+) per capita consumption, average 2003–2005 (in litres of pure alcohol):
Recorded 3.9
Unrecorded 0.4
Total 4.3
WHO European Region 12.2
Malta
Total population: 405 000 ➤ Population 15+ years: 83% ➤ Population in urban areas: 96% ➤ Income group (World Bank): High income
Data source: United Nations, data range 1990–2006.
SOCIOECONOMIC CONTEXT
Robust estimate of fi ve-year change in recorded adult(15+) per capita consumption,2001–2005:
INCREASE
STABLE
➤ DECREASE INCONCLUSIVE
8
2000 2002
Litre
s of
pur
e al
coho
lENLARGEMENT OF RECORDED ADULT (15+) PER CAPITA CONSUMPTION, 2000–2005
Year
2003 20052001
ALCOHOL CONSUMPTION Population data (refer to the population 15 years and older and are in litres of pure alcohol).
1961 1966 1976Li
tres
of p
ure
alco
hol
1991
RECORDED ADULT (15+) PER CAPITA CONSUMPTION, 1961–2005
Year
1971 1981 200119961986 2006
Change in data source from 2000
Beer Wine Spirits Other Total
15
5
10
20
2004
4
2
6
0
0
35%SPIRITS
28%WINE

31
Monaco
Total population: 33 000 ➤ Population 15+ years: 82% ➤ Population in urban areas: 100% ➤ Income group (World Bank): High income
Data source: United Nations, data range 1990–2006.
SOCIOECONOMIC CONTEXT
PATTERNS OF DRINKING
ABSTAINERS (15+ years), 2005
Males Females Total
Lifetime abstainers
No information availableFormer drinkers
Abstainers*
* Persons who did not drink in the past 12 months.
DRINKERS ONLY
Adult (15+ years) per capita consumption*, total 13.42
Adult (15+ years) per capita consumption*, males 17.71
Adult (15+ years) per capita consumption*, females 8.43
Heavy episodic drinkers** (15–85+ years), males, 1997 5.0%
Heavy episodic drinkers** (15–85+ years), females, 1997 1.3%
* (Recorded + unrecorded – tourist) in litres of pure alcohol, average 2003–2005.** Had at least 60 grams or more of pure alcohol on at least one occasion weekly.
PATTERNS OF DRINKING SCORE
Patterns of drinking score* LEAST RISKY No information available MOST RISKY
* Given the same level of consumption, the higher the patterns of drinking score, the greater the alcohol-attributable burden of disease for the country.
ALCOHOL POLICYExcise tax on beer / wine / spirits Yes / No / Yes
National legal minimum age for off-premise sales of alcoholic beverages (selling) (beer / wine / spirits) 16 / 16 / 18
National legal minimum age for on-premise sales of alcoholic beverages (serving) (beer / wine / spirits) 16 / 16 / 18
Restrictions for on-/off-premise sales of alcoholic beverages:Time (hours and days) / location (places and density) Yes / NoSpecifi c events / intoxicated persons / petrol stations Yes / No / No
National maximum legal blood alcohol concentration (BAC) when driving a vehicle (general / young / professional), in % 0.05 / 0.05 / 0.05
Legally binding regulations on alcohol advertising / product placement Yes / Yes
Legally binding regulations on alcohol sponsorship / sales promotion Yes / Yes
ALL CAUSE MORTALITY
Age-standardized deaths rates, 15+ years (per 100,000 population)
2000 2001 2002 2003 2004 2005
M F M F M F M F M F M F
Liver cirrhosisNo information availableRoad traffi c
accidents (1)
Data source: WHO Mortality Database, data as reported by countries (1) refer to transport accidents.
RECORDED ADULT (15+) ALCOHOL CONSUMPTION BY TYPE OF ALCOHOLIC BEVERAGE (IN % OF PURE ALCOHOL), 2005
Beer includes malt beers. Wine includes wine made from grapes. Spirits include all distilled beverages. Other includes one or several other alcoholic beverages, such as fermented beverages made from sorghum, maize, millet, rice, or cider, fruit wine, fortifi ed wine, etc.
15
5
10
2000 2002 2004
Litre
s of
pur
e al
coho
l
2006
ENLARGEMENT OF RECORDED ADULT (15+) PER CAPITA CONSUMPTION, 2000–2007
Year
2003 2005 20070
2001
ALCOHOL CONSUMPTION Population data (refer to the population 15 years and older and are in litres of pure alcohol).
15
5
10
1961 1966 1976
Litre
s of
pur
e al
coho
l
1991
RECORDED ADULT (15+) PER CAPITA CONSUMPTION, 1961–2007
Year
1971 1981 20010
20
19961986 2006
No information available
No information available
No information available
Adult (15+) per capita consumption, average 2003–2005 (in litres of pure alcohol):
Recorded
Unrecorded
Total
WHO European Region
Robust estimate of fi ve-year change in recorded adult(15+) per capita consumption,2001–2005:
INCREASE
STABLE
DECREASE
INCONCLUSIVE
No information availableNo information available
No information available
Beer Wine Spirits Other Total
HEALTH CONSEQUENCES
MORBIDITY
Prevalence estimates (12-month prevalence for 2004): Males Females
Alcohol use disorders (15+ years) 4.11% 0.96%
No information available

32
Montenegro
Total population: 601 000 ➤ Population 15+ years: 81% ➤ Population in urban areas: 61% ➤ Income group (World Bank): Upper-middle income
Data source: United Nations, data range 1990–2006.
SOCIOECONOMIC CONTEXT
PATTERNS OF DRINKING
ABSTAINERS (15+ years), 2005
Males Females Total
Lifetime abstainers
No information availableFormer drinkers
Abstainers*
* Persons who did not drink in the past 12 months.
DRINKERS ONLY
Adult (15+ years) per capita consumption*, total 13.42
Adult (15+ years) per capita consumption*, males 17.71
Adult (15+ years) per capita consumption*, females 8.43
Heavy episodic drinkers** (15–85+ years), males, 1997 5.0%
Heavy episodic drinkers** (15–85+ years), females, 1997 1.3%
* (Recorded + unrecorded – tourist) in litres of pure alcohol, average 2003–2005.** Had at least 60 grams or more of pure alcohol on at least one occasion weekly.
PATTERNS OF DRINKING SCORE
Patterns of drinking score* LEAST RISKY No information available MOST RISKY
* Given the same level of consumption, the higher the patterns of drinking score, the greater the alcohol-attributable burden of disease for the country.
ALCOHOL POLICYExcise tax on beer / wine / spirits Yes / No / Yes
National legal minimum age for off-premise sales of alcoholic beverages (selling) (beer / wine / spirits) 16 / 16 / 18
National legal minimum age for on-premise sales of alcoholic beverages (serving) (beer / wine / spirits) 16 / 16 / 18
Restrictions for on-/off-premise sales of alcoholic beverages:Time (hours and days) / location (places and density) Yes / NoSpecifi c events / intoxicated persons / petrol stations Yes / No / No
National maximum legal blood alcohol concentration (BAC) when driving a vehicle (general / young / professional), in % 0.05 / 0.05 / 0.05
Legally binding regulations on alcohol advertising / product placement Yes / Yes
Legally binding regulations on alcohol sponsorship / sales promotion Yes / Yes
HEALTH CONSEQUENCES
MORBIDITY
Prevalence estimates (12-month prevalence for 2004): Males Females
Alcohol use disorders (15+ years) No information available
ALL CAUSE MORTALITY
Age-standardized deaths rates, 15+ years (per 100,000 population)
2000 2001 2002 2003 2004 2005
M F M F M F M F M F M F
Liver cirrhosisNo information availableRoad traffi c
accidents (1)
Data source: WHO Mortality Database, data as reported by countries (1) refer to transport accidents.
RECORDED ADULT (15+) ALCOHOL CONSUMPTION BY TYPE OF ALCOHOLIC BEVERAGE (IN % OF PURE ALCOHOL), 2005
Beer includes malt beers. Wine includes wine made from grapes. Spirits include all distilled beverages. Other includes one or several other alcoholic beverages, such as fermented beverages made from sorghum, maize, millet, rice, or cider, fruit wine, fortifi ed wine, etc.
15
5
10
2000 2002 2004
Litre
s of
pur
e al
coho
l
2006
ENLARGEMENT OF RECORDED ADULT (15+) PER CAPITA CONSUMPTION, 2000–2007
Year
2003 2005 20070
2001
ALCOHOL CONSUMPTION Population data (refer to the population 15 years and older and are in litres of pure alcohol).
15
5
10
1961 1966 1976Li
tres
of p
ure
alco
hol
1991
RECORDED ADULT (15+) PER CAPITA CONSUMPTION, 1961–2007
Year
1971 1981 20010
20
19961986 2006
No information available
No information available
No information available
Adult (15+) per capita consumption, average 2003–2005 (in litres of pure alcohol):
Recorded
Unrecorded
Total
WHO European Region
Robust estimate of fi ve-year change in recorded adult(15+) per capita consumption,2001–2005:
INCREASE
STABLE
DECREASE
INCONCLUSIVE
No information availableNo information available
No information available
Beer Wine Spirits Other Total
No information available

33
PATTERNS OF DRINKING
ABSTAINERS (15+ years), 1999
Males Females Total
Lifetime abstainers 6.1% 16.7% 11.6%
Former drinkers 12.0% 19.1% 15.7%
Abstainers* 18.1% 35.8% 27.3%
* Persons who did not drink in the past 12 months.
DRINKERS ONLY
Adult (15+ years) per capita consumption*, total 13.82
Adult (15+ years) per capita consumption*, males 15.57
Adult (15+ years) per capita consumption*, females 12.19
Heavy episodic drinkers** (15–85+ years), males, 1999 19.6%
Heavy episodic drinkers** (15–85+ years), females, 1999 5.4%
* (Recorded + unrecorded) in litres of pure alcohol, average 2003–2005.** Had at least 60 grams or more of pure alcohol on at least one occasion weekly.
PATTERNS OF DRINKING SCORE
Patterns of drinking score* LEAST RISKY 1 2 3 4 5 MOST RISKY
* Given the same level of consumption, the higher the patterns of drinking score, the greater the alcohol-attributable burden of disease for the country.
ALCOHOL POLICYExcise tax on beer / wine / spirits Yes / Yes / Yes
National legal minimum age for off-premise sales of alcoholic beverages (selling) (beer / wine / spirits) 16 / 16 / 18
National legal minimum age for on-premise sales of alcoholic beverages (serving) (beer / wine / spirits) 16 / 16 / 18
Restrictions for on-/off-premise sales of alcoholic beverages:Time (hours and days) / location (places and density) Yes / Yes & NoSpecifi c events / intoxicated persons / petrol stations Yes / Yes / Yes
National maximum legal blood alcohol concentration (BAC) when driving a vehicle (general / young / professional), in % 0.05 / 0.02 / 0.05
Legally binding regulations on alcohol advertising / product placement Yes / Yes
Legally binding regulations on alcohol sponsorship / sales promotion Yes / Yes
HEALTH CONSEQUENCES
MORBIDITY
Prevalence estimates (12-month prevalence for 2004): Males Females
Alcohol use disorders (15+ years) 5.29% 0.81%
ALL CAUSE MORTALITY
Age-standardized deaths rates, 15+ years (per 100,000 population)
2000 2001 2002 2003 2004 2005
M F M F M F M F M F M F
Liver cirrhosis 6.7 3.4 6.2 3.4 6.4 3.2 6.2 3.3 6.3 3.0 6.1 3.2
Road traffi c accidents (1)
13.0 3.9 11.7 3.3 12.1 3.6 11.9 3.6 9.5 3.1 8.6 2.6
Data source: WHO Mortality Database, data as reported by countries (1) refer to transport accidents.
50%BEER
RECORDED ADULT (15+) ALCOHOL CONSUMPTION BY TYPE OF ALCOHOLIC BEVERAGE (IN % OF PURE ALCOHOL), 2005
Beer includes malt beers. Wine includes wine made from grapes. Spirits include all distilled beverages. Other includes one or several other alcoholic beverages, such as fermented beverages made from sorghum, maize, millet, rice, or cider, fruit wine, fortifi ed wine, etc.
Adult (15+) per capita consumption, average 2003–2005 (in litres of pure alcohol):
Recorded 9.6
Unrecorded 0.5
Total 10.1
WHO European Region 12.2
Netherlands (the)
Total population: 16 379 000 ➤ Population 15+ years: 82% ➤ Population in urban areas: 81% ➤ Income group (World Bank): High income
Data source: United Nations, data range 1990–2006.
SOCIOECONOMIC CONTEXT
Robust estimate of fi ve-year change in recorded adult(15+) per capita consumption,2001–2005:
INCREASE
➤ STABLE DECREASE
INCONCLUSIVE
15
2000 2002
Litre
s of
pur
e al
coho
l
ENLARGEMENT OF RECORDED ADULT (15+) PER CAPITA CONSUMPTION, 2000–2007
Year
2003 20072001
5
ALCOHOL CONSUMPTION Population data (refer to the population 15 years and older and are in litres of pure alcohol).
1961 1966 1976
Litre
s of
pur
e al
coho
l
1991
RECORDED ADULT (15+) PER CAPITA CONSUMPTION, 1961–2007
Year
1971 1981 200119961986 2006
Change in data source from 2002
Beer Wine Spirits Total
15
5
10
20
2004 2005
10
20060
0
34%WINE
16%SPIRITS

© World Health Organization 2011
PATTERNS OF DRINKING
ABSTAINERS (15+ years), 1999
Males Females Total
Lifetime abstainers 2.3% 4.1% 3.2%
Former drinkers 6.2% 7.3% 6.8%
Abstainers* 8.5% 11.4% 10.0%
* Personswhodidnotdrinkinthepast12months.
DRINKERS ONLY
Adult (15+ years) per capita consumption*, total 8.68
Adult (15+ years) per capita consumption*, males 12.47
Adult (15+ years) per capita consumption*, females 5.31
Heavy episodic drinkers** (15–85+ years), males, 1999 3.0%
Heavy episodic drinkers** (15–85+ years), females. 1999 0.9%
* (Recorded+unrecorded)inlitresofpurealcohol,average2003–2005.**Hadatleast60gramsormoreofpurealcoholonatleastoneoccasionweekly.
PATTERNS OF DRINKING SCORE
Patterns of drinking score* least risky 1 2 3 4 5 most risky
* Giventhesamelevelofconsumption,thehigherthepatternsofdrinkingscore,thegreaterthealcohol-attributableburdenofdiseaseforthecountry.
ALCOHOL POLICYExcise tax on beer / wine / spirits Yes / Yes / Yes
National legal minimum age for off-premise sales of alcoholic beverages (selling) (beer / wine / spirits) 18 / 18 / 20
National legal minimum age for on-premise sales of alcoholic beverages (serving) (beer / wine / spirits) 18 / 18 / 20
Restrictions for on-/off-premise sales of alcoholic beverages:Time (hours and days) / location (places and density) Yes / YesSpecific events / intoxicated persons / petrol stations Yes / Yes / Yes
National maximum legal blood alcohol concentration (BAC) when driving a vehicle (general / young / professional), in % 0.02 / 0.02 / ZT
Legally binding regulations on alcohol advertising / product placement Yes / No
Legally binding regulations on alcohol sponsorship / sales promotion Yes / Yes
ZT=Zerotolerance.
HEALTH CONSEQUENCES
MORBIDITY
Prevalence estimates (12-month prevalence for 2004): Males Females
Alcohol use disorders (15+ years) 9.05% 2.55%
ALL CAUSE MORTALITY
Age-standardized deaths rates, 15+ years (per 100,000 population)
2000 2001 2002 2003 2004 2005
M F M F M F M F M F M F
Liver cirrhosis 6.7 3.6 6.0 2.5 6.8 3.3 6.1 3.6 7.9 2.8 4.5 2.4
Road traffic accidents (1)
15.0 4.5 11.8 4.0 14.4 3.5 12.2 3.3 11.5 3.8 9.3 3.8
Datasource:WHOMortalityDatabase,dataasreportedbycountries(1)refertotransportaccidents.
Beerincludesmaltbeers.Wineincludeswinemadefromgrapes.Spiritsincludealldistilledbeverages.Otherincludesoneorseveralotheralcoholicbeverages,suchasfermentedbeveragesmadefromsorghum,maize,millet,rice,orcider,fruitwine,fortifiedwine,etc.
Adult (15+) per capita consumption, average 2003–2005 (in litres of pure alcohol):
Recorded 6.2
Unrecorded 1.6
Total 7.8
WHO European Region 12.2
Norway
Total population: 4 669 000 ➤ Population 15+ years: 81% ➤ Population in urban areas: 77% ➤ Income group (World Bank): High income
Datasource:UnitedNations,datarange1990–2006.
SOCIOECONOMIC CONTEXT
Robust estimate of five-year change in recorded adult(15+) per capita consumption,2001–2005:
➤ increase stable
decrease
inconclusive
8
2000 2002
Litre
s of
pur
e al
coho
l
ENLARGEMENT OF RECORDED ADULT (15+) PER CAPITA CONSUMPTION, 2000–2008
Year
2003 20082001
ALCOHOL CONSUMPTION Populationdata(refertothepopulation15yearsandolderandareinlitresofpurealcohol).
1961 1966 1976
Litre
s of
pur
e al
coho
l
1991
RECORDED ADULT (15+) PER CAPITA CONSUMPTION, 1961–2008
Year
1971 1981 200119961986 2006
Beer Wine Spirits Other Total
15
5
10
20
2004
2
4
2005 2006 2007
6
0
0
47%BEER
2%OTHER
RECORDED ADULT (15+) ALCOHOL CONSUMPTION BY TYPE OF ALCOHOLIC BEVERAGE (IN % OF PURE ALCOHOL), 2005
20%SPIRITS
31%WINE
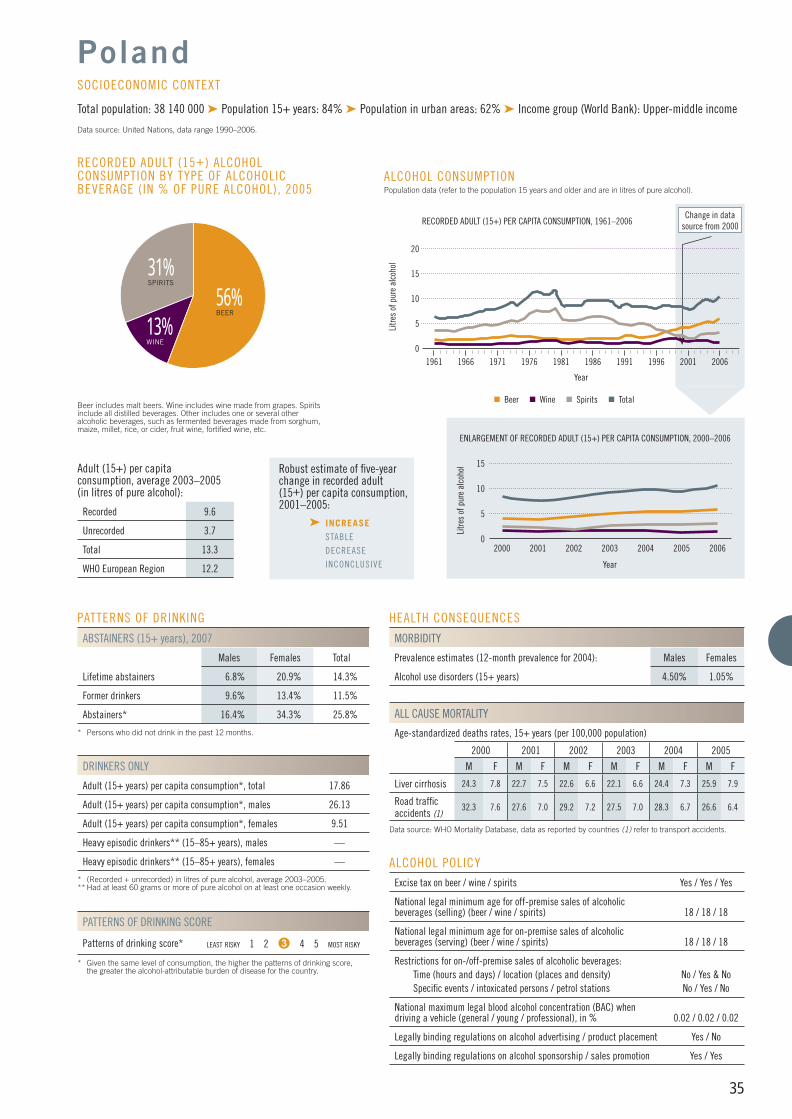
35
PATTERNS OF DRINKING
ABSTAINERS (15+ years), 2007
Males Females Total
Lifetime abstainers 6.8% 20.9% 14.3%
Former drinkers 9.6% 13.4% 11.5%
Abstainers* 16.4% 34.3% 25.8%
* Persons who did not drink in the past 12 months.
DRINKERS ONLY
Adult (15+ years) per capita consumption*, total 17.86
Adult (15+ years) per capita consumption*, males 26.13
Adult (15+ years) per capita consumption*, females 9.51
Heavy episodic drinkers** (15–85+ years), males —
Heavy episodic drinkers** (15–85+ years), females —
* (Recorded + unrecorded) in litres of pure alcohol, average 2003–2005.** Had at least 60 grams or more of pure alcohol on at least one occasion weekly.
PATTERNS OF DRINKING SCORE
Patterns of drinking score* LEAST RISKY 1 2 3 4 5 MOST RISKY
* Given the same level of consumption, the higher the patterns of drinking score, the greater the alcohol-attributable burden of disease for the country.
ALCOHOL POLICYExcise tax on beer / wine / spirits Yes / Yes / Yes
National legal minimum age for off-premise sales of alcoholic beverages (selling) (beer / wine / spirits) 18 / 18 / 18
National legal minimum age for on-premise sales of alcoholic beverages (serving) (beer / wine / spirits) 18 / 18 / 18
Restrictions for on-/off-premise sales of alcoholic beverages:Time (hours and days) / location (places and density) No / Yes & NoSpecifi c events / intoxicated persons / petrol stations No / Yes / No
National maximum legal blood alcohol concentration (BAC) when driving a vehicle (general / young / professional), in % 0.02 / 0.02 / 0.02
Legally binding regulations on alcohol advertising / product placement Yes / No
Legally binding regulations on alcohol sponsorship / sales promotion Yes / Yes
HEALTH CONSEQUENCES
MORBIDITY
Prevalence estimates (12-month prevalence for 2004): Males Females
Alcohol use disorders (15+ years) 4.50% 1.05%
ALL CAUSE MORTALITY
Age-standardized deaths rates, 15+ years (per 100,000 population)
2000 2001 2002 2003 2004 2005
M F M F M F M F M F M F
Liver cirrhosis 24.3 7.8 22.7 7.5 22.6 6.6 22.1 6.6 24.4 7.3 25.9 7.9
Road traffi c accidents (1)
32.3 7.6 27.6 7.0 29.2 7.2 27.5 7.0 28.3 6.7 26.6 6.4
Data source: WHO Mortality Database, data as reported by countries (1) refer to transport accidents.
56%BEER
RECORDED ADULT (15+) ALCOHOL CONSUMPTION BY TYPE OF ALCOHOLIC BEVERAGE (IN % OF PURE ALCOHOL), 2005
Beer includes malt beers. Wine includes wine made from grapes. Spirits include all distilled beverages. Other includes one or several other alcoholic beverages, such as fermented beverages made from sorghum, maize, millet, rice, or cider, fruit wine, fortifi ed wine, etc.
Adult (15+) per capita consumption, average 2003–2005 (in litres of pure alcohol):
Recorded 9.6
Unrecorded 3.7
Total 13.3
WHO European Region 12.2
Poland
Total population: 38 140 000 ➤ Population 15+ years: 84% ➤ Population in urban areas: 62% ➤ Income group (World Bank): Upper-middle income
Data source: United Nations, data range 1990–2006.
SOCIOECONOMIC CONTEXT
Robust estimate of fi ve-year change in recorded adult(15+) per capita consumption,2001–2005:
➤ INCREASE STABLE
DECREASE
INCONCLUSIVE
15
2000 2002
Litre
s of
pur
e al
coho
l
ENLARGEMENT OF RECORDED ADULT (15+) PER CAPITA CONSUMPTION, 2000–2006
Year
2003 20062001
10
ALCOHOL CONSUMPTION Population data (refer to the population 15 years and older and are in litres of pure alcohol).
1961 1966 1976
Litre
s of
pur
e al
coho
l
1991
RECORDED ADULT (15+) PER CAPITA CONSUMPTION, 1961–2006
Year
1971 1981 200119961986 2006
Change in data source from 2000
Beer Wine Spirits Total
15
5
10
20
2004
5
20050
0
13%WINE
31%SPIRITS

36
PATTERNS OF DRINKING
ABSTAINERS (15+ years), 2006
Males Females Total
Lifetime abstainers 18.6% 32.0% 26.0%
Former drinkers 16.0% 26.2% 21.0%
Abstainers* 34.6% 58.2% 47.0%
* Persons who did not drink in the past 12 months.
DRINKERS ONLY
Adult (15+ years) per capita consumption*, total 27.45
Adult (15+ years) per capita consumption*, males 32.26
Adult (15+ years) per capita consumption*, females 19.86
Heavy episodic drinkers** (15–85+ years), males —
Heavy episodic drinkers** (15–85+ years), females —
* (Recorded + unrecorded) in litres of pure alcohol, average 2003–2005.** Had at least 60 grams or more of pure alcohol on at least one occasion weekly.
PATTERNS OF DRINKING SCORE
Patterns of drinking score* LEAST RISKY 1 2 3 4 5 MOST RISKY
* Given the same level of consumption, the higher the patterns of drinking score, the greater the alcohol-attributable burden of disease for the country.
ALCOHOL POLICYExcise tax on beer / wine / spirits Yes / No / Yes
National legal minimum age for off-premise sales of alcoholic beverages (selling) (beer / wine / spirits) 16 / 16 / 16
National legal minimum age for on-premise sales of alcoholic beverages (serving) (beer / wine / spirits) 16 / 16 / 16
Restrictions for on-/off-premise sales of alcoholic beverages:Time (hours and days) / location (places and density) No / Yes & NoSpecifi c events / intoxicated persons / petrol stations Yes / Yes / No
National maximum legal blood alcohol concentration (BAC) when driving a vehicle (general / young / professional), in % 0.05 / 0.05 / 0.05
Legally binding regulations on alcohol advertising / product placement Yes / Yes
Legally binding regulations on alcohol sponsorship / sales promotion Yes / Yes
HEALTH CONSEQUENCES
MORBIDITY
Prevalence estimates (12-month prevalence for 2004): Males Females
Alcohol use disorders (15+ years) 4.07% 0.95%
ALL CAUSE MORTALITY
Age-standardized deaths rates, 15+ years (per 100,000 population)
2000 2001 2002 2003 2004 2005
M F M F M F M F M F M F
Liver cirrhosis 27.1 8.2 28.9 8.5 24.1 7.5 22.7 7.3 — — — —
Road traffi c accidents (1)
26.1 5.2 33.4 8.3 38.0 8.5 34.0 7.7 — — — —
Data source: WHO Mortality Database, data as reported by countries (1) refer to transport accidents.
31%BEER
4%OTHER
RECORDED ADULT (15+) ALCOHOL CONSUMPTION BY TYPE OF ALCOHOLIC BEVERAGE (IN % OF PURE ALCOHOL), 2005
Beer includes malt beers. Wine includes wine made from grapes. Spirits include all distilled beverages. Other includes one or several other alcoholic beverages, such as fermented beverages made from sorghum, maize, millet, rice, or cider, fruit wine, fortifi ed wine, etc.
Adult (15+) per capita consumption, average 2003–2005 (in litres of pure alcohol):
Recorded 12.5
Unrecorded 2.1
Total 14.6
WHO European Region 12.2
Portugal
Total population: 10 579 000 ➤ Population 15+ years: 84% ➤ Population in urban areas: 58% ➤ Income group (World Bank): High income
Data source: United Nations, data range 1990–2006.
SOCIOECONOMIC CONTEXT
Robust estimate of fi ve-year change in recorded adult(15+) per capita consumption,2001–2005:
INCREASE
➤ STABLE DECREASE
INCONCLUSIVE
15
2000 2002
Litre
s of
pur
e al
coho
lENLARGEMENT OF RECORDED ADULT (15+) PER CAPITA CONSUMPTION, 2000–2005
Year
2003 20052001
ALCOHOL CONSUMPTION Population data (refer to the population 15 years and older and are in litres of pure alcohol).
1961 1966 1976Li
tres
of p
ure
alco
hol
1991
RECORDED ADULT (15+) PER CAPITA CONSUMPTION, 1961–2005
Year
1971 1981 200119961986 2006
Change in data source from 2000
Beer Wine Spirits Other Total
15
5
10
20
2004
5
10
0
0
10%SPIRITS
55%WINE

37
PATTERNS OF DRINKING
ABSTAINERS (15+ years), 2005
Males Females Total
Lifetime abstainers 5.5% 17.8% 12.1%
Former drinkers 7.5% 12.2% 10.0%
Abstainers* 13.0% 30.0% 22.1%
* Persons who did not drink in the past 12 months.
DRINKERS ONLY
Adult (15+ years) per capita consumption*, total 23.39
Adult (15+ years) per capita consumption*, males 32.04
Adult (15+ years) per capita consumption*, females 13.57
Heavy episodic drinkers** (15–85+ years), males —
Heavy episodic drinkers** (15–85+ years), females —
* (Recorded + unrecorded) in litres of pure alcohol, average 2003–2005.** Had at least 60 grams or more of pure alcohol on at least one occasion weekly.
PATTERNS OF DRINKING SCORE
Patterns of drinking score* LEAST RISKY 1 2 3 4 5 MOST RISKY
* Given the same level of consumption, the higher the patterns of drinking score, the greater the alcohol-attributable burden of disease for the country.
ALCOHOL POLICYExcise tax on beer / wine / spirits Yes / Yes / Yes
National legal minimum age for off-premise sales of alcoholic beverages (selling) (beer / wine / spirits) 16 / 16 / 16
National legal minimum age for on-premise sales of alcoholic beverages (serving) (beer / wine / spirits) 16 / 16 / 16
Restrictions for on-/off-premise sales of alcoholic beverages:Time (hours and days) / location (places and density) No / Yes & NoSpecifi c events / intoxicated persons / petrol stations No / No / Yes
National maximum legal blood alcohol concentration (BAC) when driving a vehicle (general / young / professional), in % 0.05 / 0.05 / 0.05
Legally binding regulations on alcohol advertising / product placement Yes / No
Legally binding regulations on alcohol sponsorship / sales promotion No / No
HEALTH CONSEQUENCES
MORBIDITY
Prevalence estimates (12-month prevalence for 2004): Males Females
Alcohol use disorders (15+ years) 14.08% 2.15%
ALL CAUSE MORTALITY
Age-standardized deaths rates, 15+ years (per 100,000 population)
2000 2001 2002 2003 2004 2005
M F M F M F M F M F M F
Liver cirrhosis 112.1 91.7 119.3 100.5 117.2 94.4 119.4 99.3 119.6 100.0 132.2 108.9
Road traffi c accidents (1)
24.9 6.1 28.1 6.8 27.2 6.4 27.5 7.3 29.3 6.5 25.9 6.7
Data source: WHO Mortality Database, data as reported by countries (1) refer to transport accidents.
31%BEER
RECORDED ADULT (15+) ALCOHOL CONSUMPTION BY TYPE OF ALCOHOLIC BEVERAGE (IN % OF PURE ALCOHOL), 2005
Beer includes malt beers. Wine includes wine made from grapes. Spirits include all distilled beverages. Other includes one or several other alcoholic beverages, such as fermented beverages made from sorghum, maize, millet, rice, or cider, fruit wine, fortifi ed wine, etc.
Adult (15+) per capita consumption, average 2003–2005 (in litres of pure alcohol):
Recorded 9.2
Unrecorded 10.0
Total 19.2
WHO European Region 12.2
Republic of Moldova (the)
Total population: 3 833 000 ➤ Population 15+ years: 81% ➤ Population in urban areas: 47% ➤ Income group (World Bank): Lower-middle income
Data source: United Nations, data range 1990–2006.
SOCIOECONOMIC CONTEXT
Robust estimate of fi ve-year change in recorded adult(15+) per capita consumption,2001–2005:
INCREASE
STABLE
DECREASE
INCONCLUSIVE
No information available
12
2000 2002
Litre
s of
pur
e al
coho
l
ENLARGEMENT OF RECORDED ADULT (15+) PER CAPITA CONSUMPTION, 2000–2004
Year
2003 20042001
6
ALCOHOL CONSUMPTION Population data (refer to the population 15 years and older and are in litres of pure alcohol).
1961 1966 1976
Litre
s of
pur
e al
coho
l
1991
RECORDED ADULT (15+) PER CAPITA CONSUMPTION, 1961–2004
Year
1971 1981 200119961986 2006
Change in data source from 2003
Beer Wine Spirits Other Total
15
5
10
20
10
4
8
20
036%WINE
33%SPIRITS
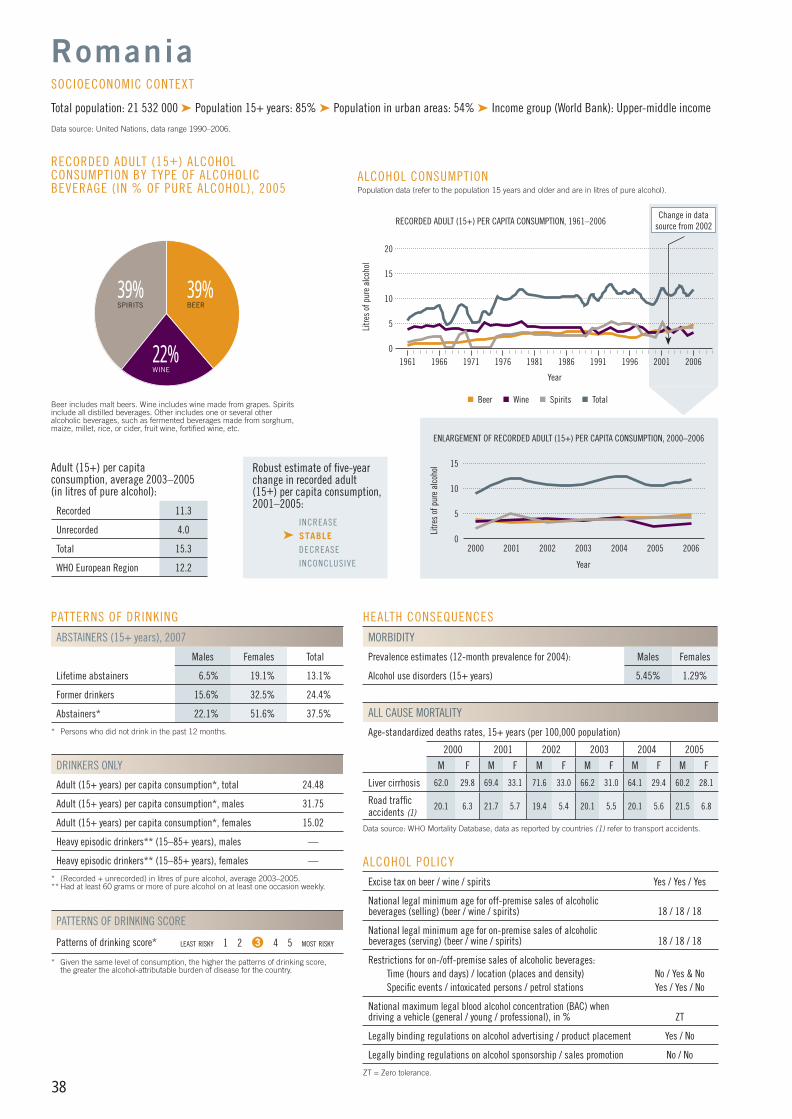
38
PATTERNS OF DRINKING
ABSTAINERS (15+ years), 2007
Males Females Total
Lifetime abstainers 6.5% 19.1% 13.1%
Former drinkers 15.6% 32.5% 24.4%
Abstainers* 22.1% 51.6% 37.5%
* Persons who did not drink in the past 12 months.
DRINKERS ONLY
Adult (15+ years) per capita consumption*, total 24.48
Adult (15+ years) per capita consumption*, males 31.75
Adult (15+ years) per capita consumption*, females 15.02
Heavy episodic drinkers** (15–85+ years), males —
Heavy episodic drinkers** (15–85+ years), females —
* (Recorded + unrecorded) in litres of pure alcohol, average 2003–2005.** Had at least 60 grams or more of pure alcohol on at least one occasion weekly.
PATTERNS OF DRINKING SCORE
Patterns of drinking score* LEAST RISKY 1 2 3 4 5 MOST RISKY
* Given the same level of consumption, the higher the patterns of drinking score, the greater the alcohol-attributable burden of disease for the country.
ALCOHOL POLICYExcise tax on beer / wine / spirits Yes / Yes / Yes
National legal minimum age for off-premise sales of alcoholic beverages (selling) (beer / wine / spirits) 18 / 18 / 18
National legal minimum age for on-premise sales of alcoholic beverages (serving) (beer / wine / spirits) 18 / 18 / 18
Restrictions for on-/off-premise sales of alcoholic beverages:Time (hours and days) / location (places and density) No / Yes & NoSpecifi c events / intoxicated persons / petrol stations Yes / Yes / No
National maximum legal blood alcohol concentration (BAC) when driving a vehicle (general / young / professional), in % ZT
Legally binding regulations on alcohol advertising / product placement Yes / No
Legally binding regulations on alcohol sponsorship / sales promotion No / No
ZT = Zero tolerance.
HEALTH CONSEQUENCES
MORBIDITY
Prevalence estimates (12-month prevalence for 2004): Males Females
Alcohol use disorders (15+ years) 5.45% 1.29%
ALL CAUSE MORTALITY
Age-standardized deaths rates, 15+ years (per 100,000 population)
2000 2001 2002 2003 2004 2005
M F M F M F M F M F M F
Liver cirrhosis 62.0 29.8 69.4 33.1 71.6 33.0 66.2 31.0 64.1 29.4 60.2 28.1
Road traffi c accidents (1)
20.1 6.3 21.7 5.7 19.4 5.4 20.1 5.5 20.1 5.6 21.5 6.8
Data source: WHO Mortality Database, data as reported by countries (1) refer to transport accidents.
39%BEER
RECORDED ADULT (15+) ALCOHOL CONSUMPTION BY TYPE OF ALCOHOLIC BEVERAGE (IN % OF PURE ALCOHOL), 2005
Beer includes malt beers. Wine includes wine made from grapes. Spirits include all distilled beverages. Other includes one or several other alcoholic beverages, such as fermented beverages made from sorghum, maize, millet, rice, or cider, fruit wine, fortifi ed wine, etc.
Adult (15+) per capita consumption, average 2003–2005 (in litres of pure alcohol):
Recorded 11.3
Unrecorded 4.0
Total 15.3
WHO European Region 12.2
Romania
Total population: 21 532 000 ➤ Population 15+ years: 85% ➤ Population in urban areas: 54% ➤ Income group (World Bank): Upper-middle income
Data source: United Nations, data range 1990–2006.
SOCIOECONOMIC CONTEXT
Robust estimate of fi ve-year change in recorded adult(15+) per capita consumption,2001–2005:
INCREASE
➤ STABLE DECREASE
INCONCLUSIVE
15
2000 2002
Litre
s of
pur
e al
coho
lENLARGEMENT OF RECORDED ADULT (15+) PER CAPITA CONSUMPTION, 2000–2006
Year
2003 20062001
ALCOHOL CONSUMPTION Population data (refer to the population 15 years and older and are in litres of pure alcohol).
1961 1966 1976Li
tres
of p
ure
alco
hol
1991
RECORDED ADULT (15+) PER CAPITA CONSUMPTION, 1961–2006
Year
1971 1981 200119961986 2006
Change in data source from 2002
Beer Wine Spirits Total
15
5
10
20
2004
10
5
2005
0
0
22%WINE
39%SPIRITS
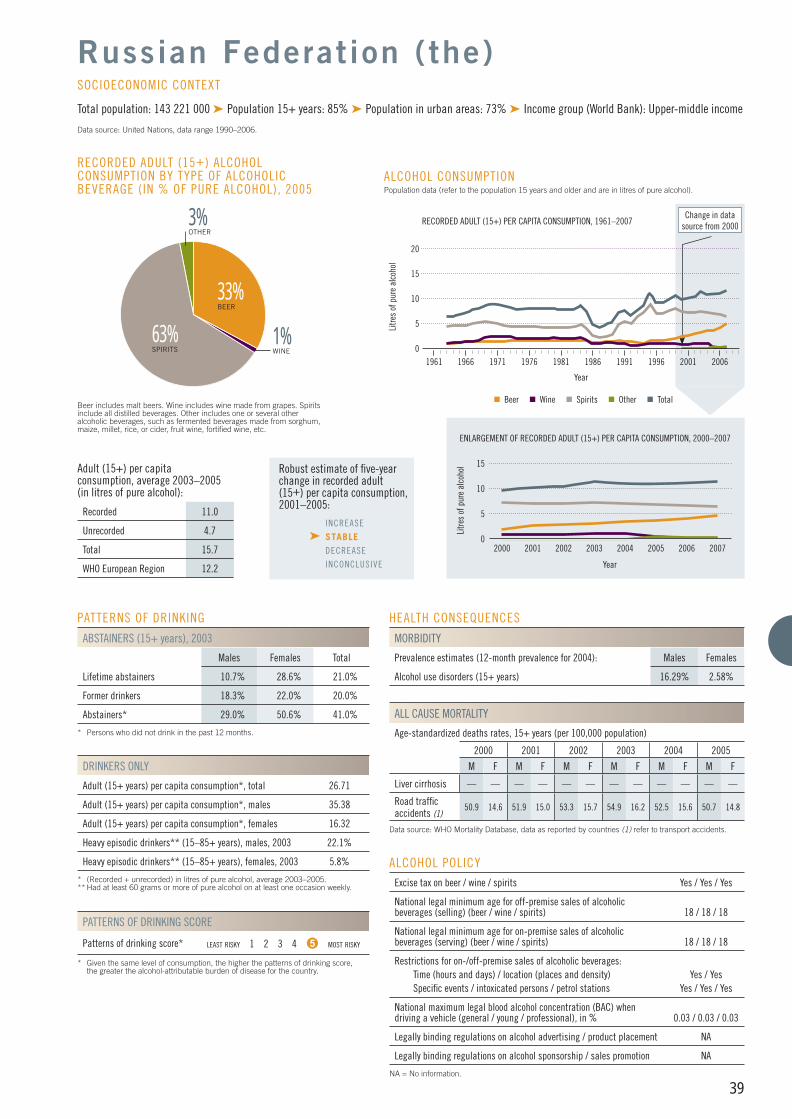
39
PATTERNS OF DRINKING
ABSTAINERS (15+ years), 2003
Males Females Total
Lifetime abstainers 10.7% 28.6% 21.0%
Former drinkers 18.3% 22.0% 20.0%
Abstainers* 29.0% 50.6% 41.0%
* Persons who did not drink in the past 12 months.
DRINKERS ONLY
Adult (15+ years) per capita consumption*, total 26.71
Adult (15+ years) per capita consumption*, males 35.38
Adult (15+ years) per capita consumption*, females 16.32
Heavy episodic drinkers** (15–85+ years), males, 2003 22.1%
Heavy episodic drinkers** (15–85+ years), females, 2003 5.8%
* (Recorded + unrecorded) in litres of pure alcohol, average 2003–2005.** Had at least 60 grams or more of pure alcohol on at least one occasion weekly.
PATTERNS OF DRINKING SCORE
Patterns of drinking score* LEAST RISKY 1 2 3 4 5 MOST RISKY
* Given the same level of consumption, the higher the patterns of drinking score, the greater the alcohol-attributable burden of disease for the country.
ALCOHOL POLICYExcise tax on beer / wine / spirits Yes / Yes / Yes
National legal minimum age for off-premise sales of alcoholic beverages (selling) (beer / wine / spirits) 18 / 18 / 18
National legal minimum age for on-premise sales of alcoholic beverages (serving) (beer / wine / spirits) 18 / 18 / 18
Restrictions for on-/off-premise sales of alcoholic beverages:Time (hours and days) / location (places and density) Yes / YesSpecifi c events / intoxicated persons / petrol stations Yes / Yes / Yes
National maximum legal blood alcohol concentration (BAC) when driving a vehicle (general / young / professional), in % 0.03 / 0.03 / 0.03
Legally binding regulations on alcohol advertising / product placement NA
Legally binding regulations on alcohol sponsorship / sales promotion NA
NA = No information.
HEALTH CONSEQUENCES
MORBIDITY
Prevalence estimates (12-month prevalence for 2004): Males Females
Alcohol use disorders (15+ years) 16.29% 2.58%
ALL CAUSE MORTALITY
Age-standardized deaths rates, 15+ years (per 100,000 population)
2000 2001 2002 2003 2004 2005
M F M F M F M F M F M F
Liver cirrhosis — — — — — — — — — — — —
Road traffi c accidents (1)
50.9 14.6 51.9 15.0 53.3 15.7 54.9 16.2 52.5 15.6 50.7 14.8
Data source: WHO Mortality Database, data as reported by countries (1) refer to transport accidents.
33%BEER
3%OTHER
RECORDED ADULT (15+) ALCOHOL CONSUMPTION BY TYPE OF ALCOHOLIC BEVERAGE (IN % OF PURE ALCOHOL), 2005
Beer includes malt beers. Wine includes wine made from grapes. Spirits include all distilled beverages. Other includes one or several other alcoholic beverages, such as fermented beverages made from sorghum, maize, millet, rice, or cider, fruit wine, fortifi ed wine, etc.
Adult (15+) per capita consumption, average 2003–2005 (in litres of pure alcohol):
Recorded 11.0
Unrecorded 4.7
Total 15.7
WHO European Region 12.2
Russian Federation (the)
Total population: 143 221 000 ➤ Population 15+ years: 85% ➤ Population in urban areas: 73% ➤ Income group (World Bank): Upper-middle income
Data source: United Nations, data range 1990–2006.
SOCIOECONOMIC CONTEXT
Robust estimate of fi ve-year change in recorded adult(15+) per capita consumption,2001–2005:
INCREASE
➤ STABLE DECREASE
INCONCLUSIVE
1%WINE
15
2000 2002
Litre
s of
pur
e al
coho
l
ENLARGEMENT OF RECORDED ADULT (15+) PER CAPITA CONSUMPTION, 2000–2007
Year
2003 20072001
10
5
ALCOHOL CONSUMPTION Population data (refer to the population 15 years and older and are in litres of pure alcohol).
1961 1966 1976
Litre
s of
pur
e al
coho
l
1991
RECORDED ADULT (15+) PER CAPITA CONSUMPTION, 1961–2007
Year
1971 1981 200119961986 2006
Change in data source from 2000
Beer Wine Spirits Other Total
15
5
10
20
2005 200620040
063%SPIRITS
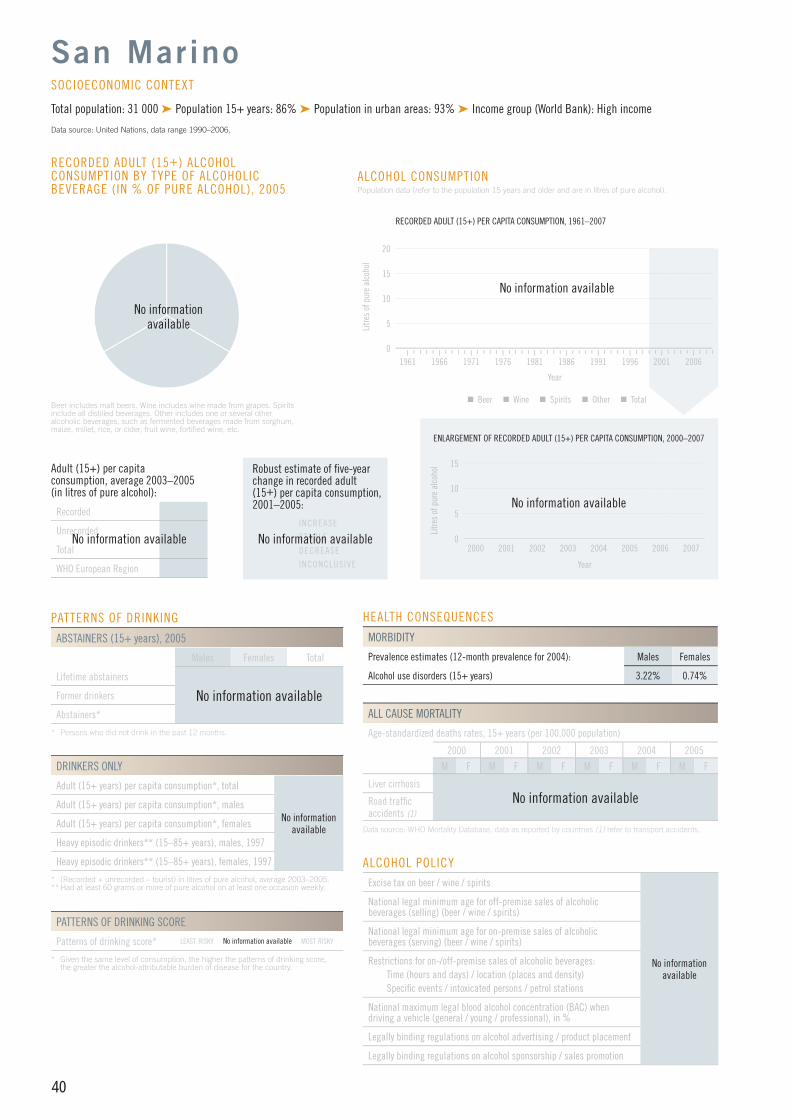
40
San Marino
Total population: 31 000 ➤ Population 15+ years: 86% ➤ Population in urban areas: 93% ➤ Income group (World Bank): High income
Data source: United Nations, data range 1990–2006.
SOCIOECONOMIC CONTEXT
PATTERNS OF DRINKING
ABSTAINERS (15+ years), 2005
Males Females Total
Lifetime abstainers
No information availableFormer drinkers
Abstainers*
* Persons who did not drink in the past 12 months.
DRINKERS ONLY
Adult (15+ years) per capita consumption*, total 13.42
Adult (15+ years) per capita consumption*, males 17.71
Adult (15+ years) per capita consumption*, females 8.43
Heavy episodic drinkers** (15–85+ years), males, 1997 5.0%
Heavy episodic drinkers** (15–85+ years), females, 1997 1.3%
* (Recorded + unrecorded – tourist) in litres of pure alcohol, average 2003–2005.** Had at least 60 grams or more of pure alcohol on at least one occasion weekly.
PATTERNS OF DRINKING SCORE
Patterns of drinking score* LEAST RISKY No information available MOST RISKY
* Given the same level of consumption, the higher the patterns of drinking score, the greater the alcohol-attributable burden of disease for the country.
ALCOHOL POLICYExcise tax on beer / wine / spirits Yes / No / Yes
National legal minimum age for off-premise sales of alcoholic beverages (selling) (beer / wine / spirits) 16 / 16 / 18
National legal minimum age for on-premise sales of alcoholic beverages (serving) (beer / wine / spirits) 16 / 16 / 18
Restrictions for on-/off-premise sales of alcoholic beverages:Time (hours and days) / location (places and density) Yes / NoSpecifi c events / intoxicated persons / petrol stations Yes / No / No
National maximum legal blood alcohol concentration (BAC) when driving a vehicle (general / young / professional), in % 0.05 / 0.05 / 0.05
Legally binding regulations on alcohol advertising / product placement Yes / Yes
Legally binding regulations on alcohol sponsorship / sales promotion Yes / Yes
ALL CAUSE MORTALITY
Age-standardized deaths rates, 15+ years (per 100,000 population)
2000 2001 2002 2003 2004 2005
M F M F M F M F M F M F
Liver cirrhosisNo information availableRoad traffi c
accidents (1)
Data source: WHO Mortality Database, data as reported by countries (1) refer to transport accidents.
RECORDED ADULT (15+) ALCOHOL CONSUMPTION BY TYPE OF ALCOHOLIC BEVERAGE (IN % OF PURE ALCOHOL), 2005
Beer includes malt beers. Wine includes wine made from grapes. Spirits include all distilled beverages. Other includes one or several other alcoholic beverages, such as fermented beverages made from sorghum, maize, millet, rice, or cider, fruit wine, fortifi ed wine, etc.
15
5
10
2000 2002 2004
Litre
s of
pur
e al
coho
l
2006
ENLARGEMENT OF RECORDED ADULT (15+) PER CAPITA CONSUMPTION, 2000–2007
Year
2003 2005 20070
2001
ALCOHOL CONSUMPTION Population data (refer to the population 15 years and older and are in litres of pure alcohol).
15
5
10
1961 1966 1976Li
tres
of p
ure
alco
hol
1991
RECORDED ADULT (15+) PER CAPITA CONSUMPTION, 1961–2007
Year
1971 1981 20010
20
19961986 2006
No information available
No information available
No information available
Adult (15+) per capita consumption, average 2003–2005 (in litres of pure alcohol):
Recorded
Unrecorded
Total
WHO European Region
Robust estimate of fi ve-year change in recorded adult(15+) per capita consumption,2001–2005:
INCREASE
STABLE
DECREASE
INCONCLUSIVE
No information availableNo information available
No information available
Beer Wine Spirits Other Total
HEALTH CONSEQUENCES
MORBIDITY
Prevalence estimates (12-month prevalence for 2004): Males Females
Alcohol use disorders (15+ years) 3.22% 0.74%
No information available

41
PATTERNS OF DRINKING
ABSTAINERS (15+ years), 2005
Males Females Total
Lifetime abstainers
No information availableFormer drinkers
Abstainers*
* Persons who did not drink in the past 12 months.
DRINKERS ONLY
Adult (15+ years) per capita consumption*, total —
Adult (15+ years) per capita consumption*, males —
Adult (15+ years) per capita consumption*, females —
Heavy episodic drinkers** (15–85+ years), males —
Heavy episodic drinkers** (15–85+ years), females —
* (Recorded + unrecorded) in litres of pure alcohol, average 2003–2005.** Had at least 60 grams or more of pure alcohol on at least one occasion weekly.
PATTERNS OF DRINKING SCORE
Patterns of drinking score* LEAST RISKY 1 2 3 4 5 MOST RISKY
* Given the same level of consumption, the higher the patterns of drinking score, the greater the alcohol-attributable burden of disease for the country.
ALCOHOL POLICYExcise tax on beer / wine / spirits Yes / Yes / Yes
National legal minimum age for off-premise sales of alcoholic beverages (selling) (beer / wine / spirits) 18 / 18 / 18
National legal minimum age for on-premise sales of alcoholic beverages (serving) (beer / wine / spirits) 18 / 18 / 18
Restrictions for on-/off-premise sales of alcoholic beverages:Time (hours and days) / location (places and density) No / No & YesSpecifi c events / intoxicated persons / petrol stations No / No / Yes
National maximum legal blood alcohol concentration (BAC) when driving a vehicle (general / young / professional), in % 0.05 / 0.05 / ZT
Legally binding regulations on alcohol advertising / product placement Yes / Yes
Legally binding regulations on alcohol sponsorship / sales promotion Yes / Yes
ZT = Zero tolerance.
HEALTH CONSEQUENCES
MORBIDITY
Prevalence estimates (12-month prevalence for 2004): Males Females
Alcohol use disorders (15+ years) — —
ALL CAUSE MORTALITY
Age-standardized deaths rates, 15+ years (per 100,000 population)
2000 2001 2002 2003 2004 2005
M F M F M F M F M F M F
Liver cirrhosis — — — — — — — — 18.6 4.1 18.1 4.4
Road traffi c accidents (1)
— — — — — — — — 13.1 3.3 15.9 4.0
Data source: WHO Mortality Database, data as reported by countries (1) refer to transport accidents.
44%BEER
<1%OTHER
RECORDED ADULT (15+) ALCOHOL CONSUMPTION BY TYPE OF ALCOHOLIC BEVERAGE (IN % OF PURE ALCOHOL), 2005
Beer includes malt beers. Wine includes wine made from grapes. Spirits include all distilled beverages. Other includes one or several other alcoholic beverages, such as fermented beverages made from sorghum, maize, millet, rice, or cider, fruit wine, fortifi ed wine, etc.
Adult (15+) per capita consumption, average 2003–2005 (in litres of pure alcohol):
Recorded 10.0
Unrecorded 1.1
Total 11.1
WHO European Region 12.2
Serbia
Total population: 9 851 000 ➤ Population 15+ years: 82% ➤ Population in urban areas: 52% ➤ Income group (World Bank): Upper-middle income
Data source: United Nations, data range 1990–2006.
SOCIOECONOMIC CONTEXT
Robust estimate of fi ve-year change in recorded adult(15+) per capita consumption,2001–2005:
INCREASE
➤ STABLE DECREASE
INCONCLUSIVE
12
2000 2002
Litre
s of
pur
e al
coho
l
ENLARGEMENT OF RECORDED ADULT (15+) PER CAPITA CONSUMPTION, 2000–2005
Year
2003 20052001
ALCOHOL CONSUMPTION Population data (refer to the population 15 years and older and are in litres of pure alcohol).
1961 1966 1976
Litre
s of
pur
e al
coho
l
1991
RECORDED ADULT (15+) PER CAPITA CONSUMPTION, 1961–2005
Year
1971 1981 200119961986 2006
Beer Wine Spirits Other Total
15
5
10
20
2004
8642
10
0
0
22%WINE
34%SPIRITS

42
PATTERNS OF DRINKING
ABSTAINERS (15+ years), 2003
Males Females Total
Lifetime abstainers 7.4% 7.1% 7.2%
Former drinkers 15.8% 15.8% 15.8%
Abstainers* 23.2% 22.9% 23.0%
* Persons who did not drink in the past 12 months.
DRINKERS ONLY
Adult (15+ years) per capita consumption*, total 17.31
Adult (15+ years) per capita consumption*, males 28.18
Adult (15+ years) per capita consumption*, females 8.13
Heavy episodic drinkers** (15–85+ years), males, 2003 19.6%
Heavy episodic drinkers** (15–85+ years), females, 2003 2.8%
* (Recorded + unrecorded) in litres of pure alcohol, average 2003–2005.** Had at least 60 grams or more of pure alcohol on at least one occasion weekly.
PATTERNS OF DRINKING SCORE
Patterns of drinking score* LEAST RISKY 1 2 3 4 5 MOST RISKY
* Given the same level of consumption, the higher the patterns of drinking score, the greater the alcohol-attributable burden of disease for the country.
ALCOHOL POLICYExcise tax on beer / wine / spirits Yes / Yes / Yes
National legal minimum age for off-premise sales of alcoholic beverages (selling) (beer / wine / spirits) 18 / 18 / 18
National legal minimum age for on-premise sales of alcoholic beverages (serving) (beer / wine / spirits) 18 / 18 / 18
Restrictions for on-/off-premise sales of alcoholic beverages:Time (hours and days) / location (places and density) Yes & No / Yes & NoSpecifi c events / intoxicated persons / petrol stations No / Yes / No
National maximum legal blood alcohol concentration (BAC) when driving a vehicle (general / young / professional), in % ZT
Legally binding regulations on alcohol advertising / product placement Yes / Yes
Legally binding regulations on alcohol sponsorship / sales promotion Yes / Yes
ZT = Zero tolerance.
HEALTH CONSEQUENCES
MORBIDITY
Prevalence estimates (12-month prevalence for 2004): Males Females
Alcohol use disorders (15+ years) 9.47% 0.93%
ALL CAUSE MORTALITY
Age-standardized deaths rates, 15+ years (per 100,000 population)
2000 2001 2002 2003 2004 2005
M F M F M F M F M F M F
Liver cirrhosis 45.8 11.5 41.5 13.9 42.9 15.3 41.1 13.0 35.5 13.8 40.4 14.4
Road traffi c accidents (1)
27.6 6.3 26.1 6.3 24.3 6.3 26.2 6.8 24.9 5.3 23.9 5.9
Data source: WHO Mortality Database, data as reported by countries (1) refer to transport accidents.
36%BEER
RECORDED ADULT (15+) ALCOHOL CONSUMPTION BY TYPE OF ALCOHOLIC BEVERAGE (IN % OF PURE ALCOHOL), 2005
Beer includes malt beers. Wine includes wine made from grapes. Spirits include all distilled beverages. Other includes one or several other alcoholic beverages, such as fermented beverages made from sorghum, maize, millet, rice, or cider, fruit wine, fortifi ed wine, etc.
Adult (15+) per capita consumption, average 2003–2005 (in litres of pure alcohol):
Recorded 10.3
Unrecorded 3.0
Total 13.3
WHO European Region 12.2
Slovakia
Total population: 5 388 000 ➤ Population 15+ years: 84% ➤ Population in urban areas: 56% ➤ Income group (World Bank): High income
Data source: United Nations, data range 1990–2006.
SOCIOECONOMIC CONTEXT
Robust estimate of fi ve-year change in recorded adult(15+) per capita consumption,2001–2005:
INCREASE
➤ STABLE DECREASE
INCONCLUSIVE
15
2000 2002
Litre
s of
pur
e al
coho
lENLARGEMENT OF RECORDED ADULT (15+) PER CAPITA CONSUMPTION, 2000–2006
Year
2003 20062001
ALCOHOL CONSUMPTION Population data (refer to the population 15 years and older and are in litres of pure alcohol).
1961 1966 1976Li
tres
of p
ure
alco
hol
1991
RECORDED ADULT (15+) PER CAPITA CONSUMPTION, 1961–2006
Year
1971 1981 200119961986 2006
Change in data source from 2002
Beer Wine Spirits Total
15
5
10
20
2004
10
5
2005
0
0
49%SPIRITS
15%WINE
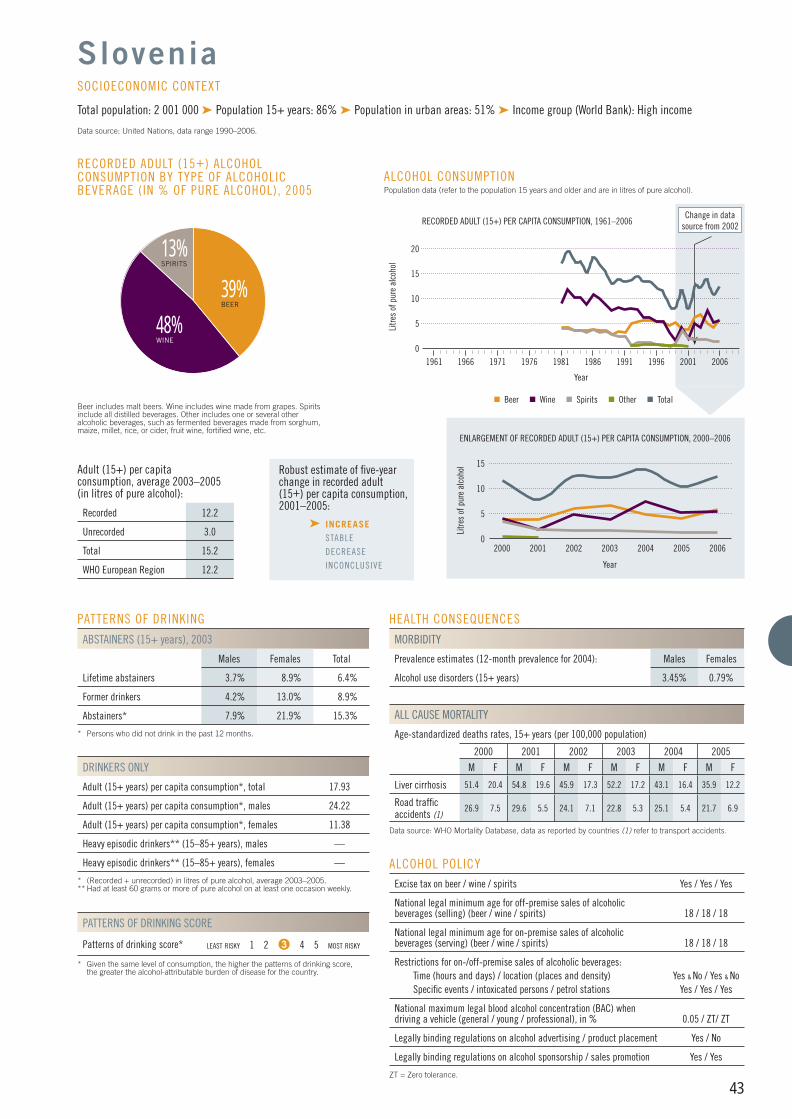
43
PATTERNS OF DRINKING
ABSTAINERS (15+ years), 2003
Males Females Total
Lifetime abstainers 3.7% 8.9% 6.4%
Former drinkers 4.2% 13.0% 8.9%
Abstainers* 7.9% 21.9% 15.3%
* Persons who did not drink in the past 12 months.
DRINKERS ONLY
Adult (15+ years) per capita consumption*, total 17.93
Adult (15+ years) per capita consumption*, males 24.22
Adult (15+ years) per capita consumption*, females 11.38
Heavy episodic drinkers** (15–85+ years), males —
Heavy episodic drinkers** (15–85+ years), females —
* (Recorded + unrecorded) in litres of pure alcohol, average 2003–2005.** Had at least 60 grams or more of pure alcohol on at least one occasion weekly.
PATTERNS OF DRINKING SCORE
Patterns of drinking score* LEAST RISKY 1 2 3 4 5 MOST RISKY
* Given the same level of consumption, the higher the patterns of drinking score, the greater the alcohol-attributable burden of disease for the country.
ALCOHOL POLICYExcise tax on beer / wine / spirits Yes / Yes / Yes
National legal minimum age for off-premise sales of alcoholic beverages (selling) (beer / wine / spirits) 18 / 18 / 18
National legal minimum age for on-premise sales of alcoholic beverages (serving) (beer / wine / spirits) 18 / 18 / 18
Restrictions for on-/off-premise sales of alcoholic beverages:Time (hours and days) / location (places and density) Yes & No / Yes & NoSpecifi c events / intoxicated persons / petrol stations Yes / Yes / Yes
National maximum legal blood alcohol concentration (BAC) when driving a vehicle (general / young / professional), in % 0.05 / ZT/ ZT
Legally binding regulations on alcohol advertising / product placement Yes / No
Legally binding regulations on alcohol sponsorship / sales promotion Yes / Yes
ZT = Zero tolerance.
HEALTH CONSEQUENCES
MORBIDITY
Prevalence estimates (12-month prevalence for 2004): Males Females
Alcohol use disorders (15+ years) 3.45% 0.79%
ALL CAUSE MORTALITY
Age-standardized deaths rates, 15+ years (per 100,000 population)
2000 2001 2002 2003 2004 2005
M F M F M F M F M F M F
Liver cirrhosis 51.4 20.4 54.8 19.6 45.9 17.3 52.2 17.2 43.1 16.4 35.9 12.2
Road traffi c accidents (1)
26.9 7.5 29.6 5.5 24.1 7.1 22.8 5.3 25.1 5.4 21.7 6.9
Data source: WHO Mortality Database, data as reported by countries (1) refer to transport accidents.
39%BEER
RECORDED ADULT (15+) ALCOHOL CONSUMPTION BY TYPE OF ALCOHOLIC BEVERAGE (IN % OF PURE ALCOHOL), 2005
Beer includes malt beers. Wine includes wine made from grapes. Spirits include all distilled beverages. Other includes one or several other alcoholic beverages, such as fermented beverages made from sorghum, maize, millet, rice, or cider, fruit wine, fortifi ed wine, etc.
Adult (15+) per capita consumption, average 2003–2005 (in litres of pure alcohol):
Recorded 12.2
Unrecorded 3.0
Total 15.2
WHO European Region 12.2
Slovenia
Total population: 2 001 000 ➤ Population 15+ years: 86% ➤ Population in urban areas: 51% ➤ Income group (World Bank): High income
Data source: United Nations, data range 1990–2006.
SOCIOECONOMIC CONTEXT
Robust estimate of fi ve-year change in recorded adult(15+) per capita consumption,2001–2005:
➤ INCREASE STABLE
DECREASE
INCONCLUSIVE
15
2000 2002
Litre
s of
pur
e al
coho
l
ENLARGEMENT OF RECORDED ADULT (15+) PER CAPITA CONSUMPTION, 2000–2006
Year
2003 20062001
5
ALCOHOL CONSUMPTION Population data (refer to the population 15 years and older and are in litres of pure alcohol).
1961 1966 1976
Litre
s of
pur
e al
coho
l
1991
RECORDED ADULT (15+) PER CAPITA CONSUMPTION, 1961–2006
Year
1971 1981 200119961986 2006
Change in data source from 2002
Beer Wine Spirits Other Total
15
5
10
20
2004 2005
10
0
0
13%SPIRITS
48%WINE

44
PATTERNS OF DRINKING
ABSTAINERS (15+ years), 2003
Males Females Total
Lifetime abstainers 9.5% 24.7% 17.4%
Former drinkers 23.4% 31.6% 27.6%
Abstainers* 32.9% 56.3% 45.0%
* Persons who did not drink in the past 12 months.
DRINKERS ONLY
Adult (15+ years) per capita consumption*, total 21.13
Adult (15+ years) per capita consumption*, males 24.79
Adult (15+ years) per capita consumption*, females 15.58
Heavy episodic drinkers** (15–85+ years), males —
Heavy episodic drinkers** (15–85+ years), females —
* (Recorded + unrecorded) in litres of pure alcohol, average 2003–2005.** Had at least 60 grams or more of pure alcohol on at least one occasion weekly.
PATTERNS OF DRINKING SCORE
Patterns of drinking score* LEAST RISKY 1 2 3 4 5 MOST RISKY
* Given the same level of consumption, the higher the patterns of drinking score, the greater the alcohol-attributable burden of disease for the country.
ALCOHOL POLICYExcise tax on beer / wine / spirits Yes / No / Yes
National legal minimum age for off-premise sales of alcoholic beverages (selling) (beer / wine / spirits) 16 / 16 / 16
National legal minimum age for on-premise sales of alcoholic beverages (serving) (beer / wine / spirits) 16 / 16 / 16
Restrictions for on-/off-premise sales of alcoholic beverages:Time (hours and days) / location (places and density) Yes & No / Yes & NoSpecifi c events / intoxicated persons / petrol stations Yes / No / Yes
National maximum legal blood alcohol concentration (BAC) when driving a vehicle (general / young / professional), in % 0.05 / 0.03 / 0.03
Legally binding regulations on alcohol advertising / product placement Yes / No
Legally binding regulations on alcohol sponsorship / sales promotion No / Yes
HEALTH CONSEQUENCES
MORBIDITY
Prevalence estimates (12-month prevalence for 2004): Males Females
Alcohol use disorders (15+ years) 1.07% 0.17%
ALL CAUSE MORTALITY
Age-standardized deaths rates, 15+ years (per 100,000 population)
2000 2001 2002 2003 2004 2005
M F M F M F M F M F M F
Liver cirrhosis 17.5 5.9 17.6 5.2 17.0 5.2 16.7 4.9 15.7 4.9 15.6 4.7
Road traffi c accidents (1)
27.6 7.4 26.0 6.9 24.3 6.4 24.3 6.4 21.1 5.6 19.8 4.7
Data source: WHO Mortality Database, data as reported by countries (1) refer to transport accidents.
45%BEER
6%OTHER
RECORDED ADULT (15+) ALCOHOL CONSUMPTION BY TYPE OF ALCOHOLIC BEVERAGE (IN % OF PURE ALCOHOL), 2005
Beer includes malt beers. Wine includes wine made from grapes. Spirits include all distilled beverages. Other includes one or several other alcoholic beverages, such as fermented beverages made from sorghum, maize, millet, rice, or cider, fruit wine, fortifi ed wine, etc.
Adult (15+) per capita consumption, average 2003–2005 (in litres of pure alcohol):
Recorded 10.2
Unrecorded 1.4
Total 11.6
WHO European Region 12.2
Spain
Total population: 43 887 000 ➤ Population 15+ years: 86% ➤ Population in urban areas: 77% ➤ Income group (World Bank): High income
Data source: United Nations, data range 1990–2006.
SOCIOECONOMIC CONTEXT
Robust estimate of fi ve-year change in recorded adult(15+) per capita consumption,2001–2005:
INCREASE
➤ STABLE DECREASE
INCONCLUSIVE
15
2000 2002
Litre
s of
pur
e al
coho
lENLARGEMENT OF RECORDED ADULT (15+) PER CAPITA CONSUMPTION, 2000–2006
Year
2003 20062001
ALCOHOL CONSUMPTION Population data (refer to the population 15 years and older and are in litres of pure alcohol).
1961 1966 1976Li
tres
of p
ure
alco
hol
1991
RECORDED ADULT (15+) PER CAPITA CONSUMPTION, 1961–2006
Year
1971 1981 200119961986 2006
Change in data source from 2002
Beer Wine Spirits Other Total
15
5
10
20
2004
10
5
2005
0
0
36%WINE
13%SPIRITS

45
PATTERNS OF DRINKING
ABSTAINERS (15+ years), 2002
Males Females Total
Lifetime abstainers 5.3% 10.8% 8.1%
Former drinkers 6.7% 11.9% 9.4%
Abstainers* 12.0% 22.7% 17.5%
* Persons who did not drink in the past 12 months.
DRINKERS ONLY
Adult (15+ years) per capita consumption*, total 12.48
Adult (15+ years) per capita consumption*, males 16.68
Adult (15+ years) per capita consumption*, females 7.84
Heavy episodic drinkers** (15–85+ years), males, 2002 2.6%
Heavy episodic drinkers** (15–85+ years), females, 2002 0.4%
* (Recorded + unrecorded) in litres of pure alcohol, average 2003–2005.** Had at least 60 grams or more of pure alcohol on at least one occasion weekly.
PATTERNS OF DRINKING SCORE
Patterns of drinking score* LEAST RISKY 1 2 3 4 5 MOST RISKY
* Given the same level of consumption, the higher the patterns of drinking score, the greater the alcohol-attributable burden of disease for the country.
ALCOHOL POLICYExcise tax on beer / wine / spirits Yes / Yes / Yes
National legal minimum age for off-premise sales of alcoholic beverages (selling) (beer / wine / spirits) 20* / 20 / 20
National legal minimum age for on-premise sales of alcoholic beverages (serving) (beer / wine / spirits) 18 / 18 / 18
Restrictions for on-/off-premise sales of alcoholic beverages:Time (hours and days) / location (places and density) Yes / Yes & NoSpecifi c events / intoxicated persons / petrol stations Yes / Yes / Yes
National maximum legal blood alcohol concentration (BAC) when driving a vehicle (general / young / professional), in % 0.02 / 0.02 / 0.02
Legally binding regulations on alcohol advertising / product placement Yes / No
Legally binding regulations on alcohol sponsorship / sales promotion Yes / Yes
* For beers of less than 3.5% alcohol by volume, the minimum age for off-premise sales is 18 years.
HEALTH CONSEQUENCES
MORBIDITY
Prevalence estimates (12-month prevalence for 2004): Males Females
Alcohol use disorders (15+ years) 6.32% 2.27%
ALL CAUSE MORTALITY
Age-standardized deaths rates, 15+ years (per 100,000 population)
2000 2001 2002 2003 2004 2005
M F M F M F M F M F M F
Liver cirrhosis 6.6 3.4 7.6 3.5 7.6 3.4 8.6 3.5 7.6 3.6 8.4 3.5
Road traffi c accidents (1)
11.6 3.1 11.5 3.5 10.3 3.2 10.1 3.1 9.2 2.7 8.6 2.9
Data source: WHO Mortality Database, data as reported by countries (1) refer to transport accidents.
39%BEER
RECORDED ADULT (15+) ALCOHOL CONSUMPTION BY TYPE OF ALCOHOLIC BEVERAGE (IN % OF PURE ALCOHOL), 2005
Beer includes malt beers. Wine includes wine made from grapes. Spirits include all distilled beverages. Other includes one or several other alcoholic beverages, such as fermented beverages made from sorghum, maize, millet, rice, or cider, fruit wine, fortifi ed wine, etc.
Adult (15+) per capita consumption, average 2003–2005 (in litres of pure alcohol):
Recorded 6.7
Unrecorded 3.6
Total 10.3
WHO European Region 12.2
Sweden
Total population: 9 078 000 ➤ Population 15+ years: 83% ➤ Population in urban areas: 84% ➤ Income group (World Bank): High income
Data source: United Nations, data range 1990–2006.
SOCIOECONOMIC CONTEXT
Robust estimate of fi ve-year change in recorded adult(15+) per capita consumption,2001–2005:
INCREASE
➤ STABLE DECREASE
INCONCLUSIVE
8
2000 2002
Litre
s of
pur
e al
coho
l
ENLARGEMENT OF RECORDED ADULT (15+) PER CAPITA CONSUMPTION, 2000–2006
Year
2003 20062001
4
ALCOHOL CONSUMPTION Population data (refer to the population 15 years and older and are in litres of pure alcohol).
1961 1966 1976
Litre
s of
pur
e al
coho
l
1991
RECORDED ADULT (15+) PER CAPITA CONSUMPTION, 1961–2006
Year
1971 1981 200119961986 2006
Change in data source from 2000
Beer Wine Spirits Total
15
5
10
20
2004 2005
6
2
0
0
17%SPIRITS
44%WINE
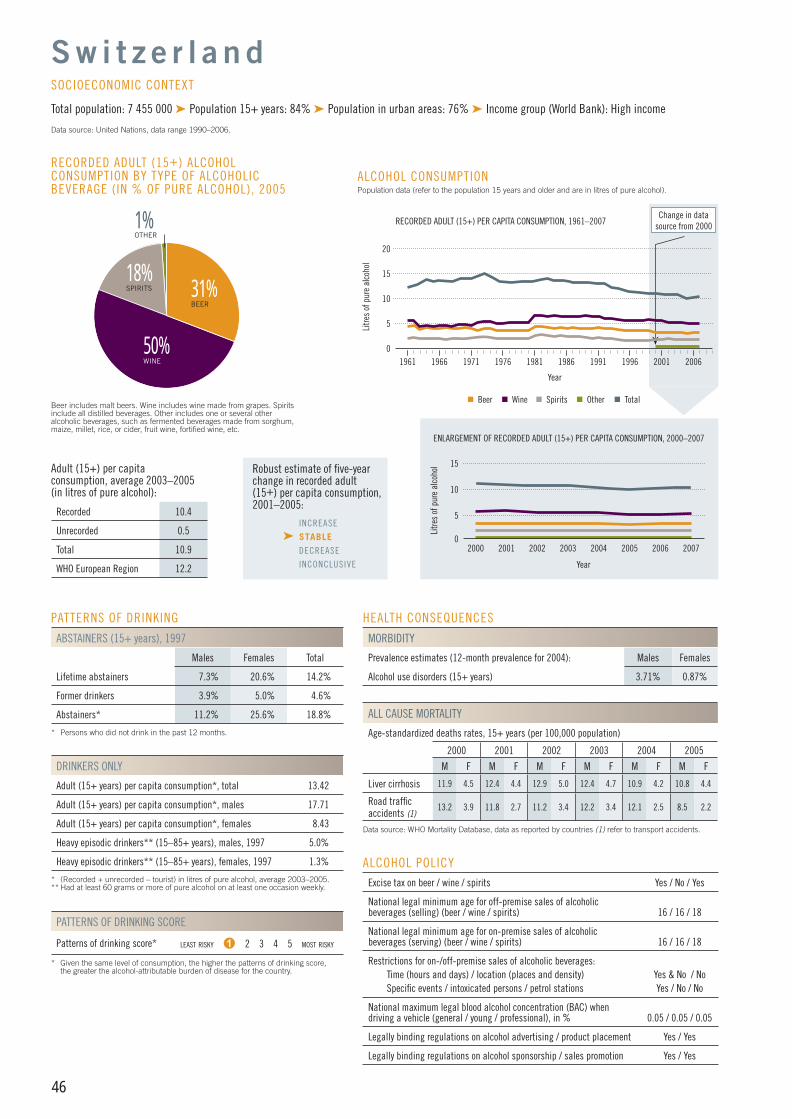
46
PATTERNS OF DRINKING
ABSTAINERS (15+ years), 1997
Males Females Total
Lifetime abstainers 7.3% 20.6% 14.2%
Former drinkers 3.9% 5.0% 4.6%
Abstainers* 11.2% 25.6% 18.8%
* Persons who did not drink in the past 12 months.
DRINKERS ONLY
Adult (15+ years) per capita consumption*, total 13.42
Adult (15+ years) per capita consumption*, males 17.71
Adult (15+ years) per capita consumption*, females 8.43
Heavy episodic drinkers** (15–85+ years), males, 1997 5.0%
Heavy episodic drinkers** (15–85+ years), females, 1997 1.3%
* (Recorded + unrecorded – tourist) in litres of pure alcohol, average 2003–2005.** Had at least 60 grams or more of pure alcohol on at least one occasion weekly.
PATTERNS OF DRINKING SCORE
Patterns of drinking score* LEAST RISKY 1 2 3 4 5 MOST RISKY
* Given the same level of consumption, the higher the patterns of drinking score, the greater the alcohol-attributable burden of disease for the country.
ALCOHOL POLICYExcise tax on beer / wine / spirits Yes / No / Yes
National legal minimum age for off-premise sales of alcoholic beverages (selling) (beer / wine / spirits) 16 / 16 / 18
National legal minimum age for on-premise sales of alcoholic beverages (serving) (beer / wine / spirits) 16 / 16 / 18
Restrictions for on-/off-premise sales of alcoholic beverages:Time (hours and days) / location (places and density) Yes & No / NoSpecifi c events / intoxicated persons / petrol stations Yes / No / No
National maximum legal blood alcohol concentration (BAC) when driving a vehicle (general / young / professional), in % 0.05 / 0.05 / 0.05
Legally binding regulations on alcohol advertising / product placement Yes / Yes
Legally binding regulations on alcohol sponsorship / sales promotion Yes / Yes
HEALTH CONSEQUENCES
MORBIDITY
Prevalence estimates (12-month prevalence for 2004): Males Females
Alcohol use disorders (15+ years) 3.71% 0.87%
ALL CAUSE MORTALITY
Age-standardized deaths rates, 15+ years (per 100,000 population)
2000 2001 2002 2003 2004 2005
M F M F M F M F M F M F
Liver cirrhosis 11.9 4.5 12.4 4.4 12.9 5.0 12.4 4.7 10.9 4.2 10.8 4.4
Road traffi c accidents (1)
13.2 3.9 11.8 2.7 11.2 3.4 12.2 3.4 12.1 2.5 8.5 2.2
Data source: WHO Mortality Database, data as reported by countries (1) refer to transport accidents.
31%BEER
50%WINE
18%SPIRITS
1%OTHER
RECORDED ADULT (15+) ALCOHOL CONSUMPTION BY TYPE OF ALCOHOLIC BEVERAGE (IN % OF PURE ALCOHOL), 2005
Beer includes malt beers. Wine includes wine made from grapes. Spirits include all distilled beverages. Other includes one or several other alcoholic beverages, such as fermented beverages made from sorghum, maize, millet, rice, or cider, fruit wine, fortifi ed wine, etc.
Adult (15+) per capita consumption, average 2003–2005 (in litres of pure alcohol):
Recorded 10.4
Unrecorded 0.5
Total 10.9
WHO European Region 12.2
S w i t z e r l a n d
Total population: 7 455 000 ➤ Population 15+ years: 84% ➤ Population in urban areas: 76% ➤ Income group (World Bank): High income
Data source: United Nations, data range 1990–2006.
SOCIOECONOMIC CONTEXT
Robust estimate of fi ve-year change in recorded adult(15+) per capita consumption,2001–2005:
INCREASE
➤ STABLE DECREASE
INCONCLUSIVE
15
5
10
2000 2002 2004
Litre
s of
pur
e al
coho
l
2006
ENLARGEMENT OF RECORDED ADULT (15+) PER CAPITA CONSUMPTION, 2000–2007
Year
2003 2005 20070
2001
Beer Wine Spirits Other Total
ALCOHOL CONSUMPTION Population data (refer to the population 15 years and older and are in litres of pure alcohol).
15
5
10
1961 1966 1976Li
tres
of p
ure
alco
hol
1991
RECORDED ADULT (15+) PER CAPITA CONSUMPTION, 1961–2007
Year
1971 1981 20010
20
19961986 2006
Change in data source from 2000
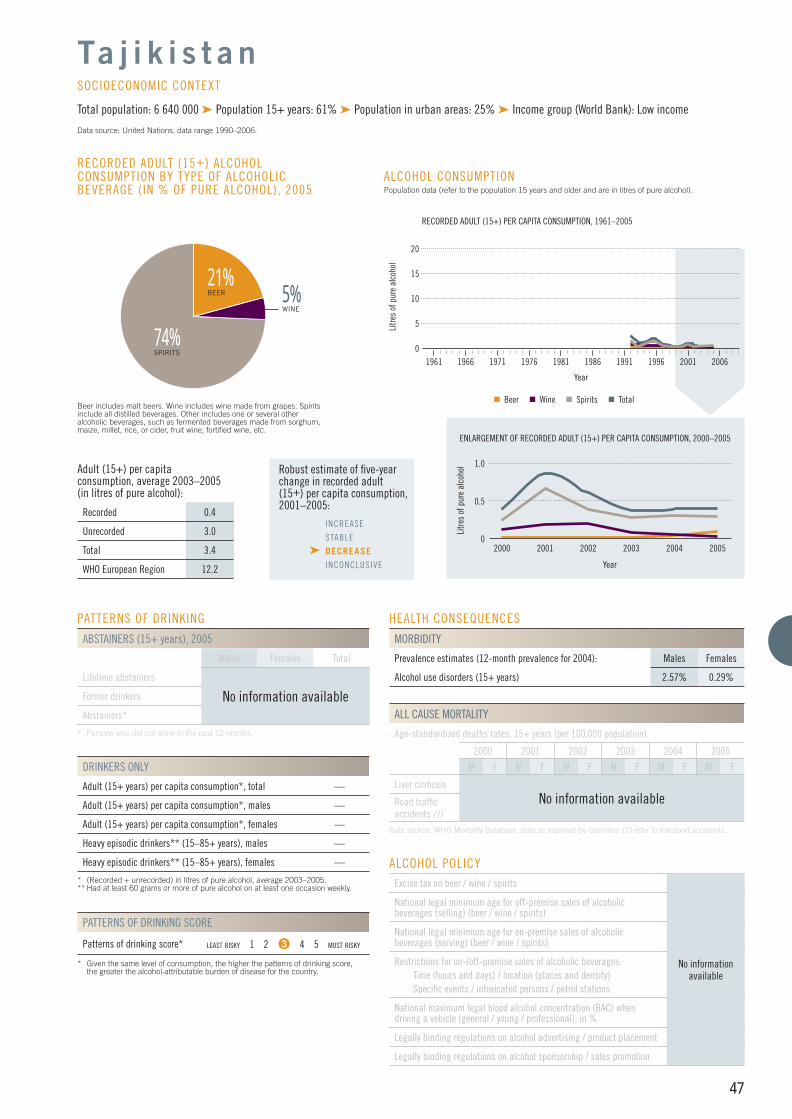
47
PATTERNS OF DRINKING
ABSTAINERS (15+ years), 2005
Males Females Total
Lifetime abstainers
No information availableFormer drinkers
Abstainers*
* Persons who did not drink in the past 12 months.
DRINKERS ONLY
Adult (15+ years) per capita consumption*, total —
Adult (15+ years) per capita consumption*, males —
Adult (15+ years) per capita consumption*, females —
Heavy episodic drinkers** (15–85+ years), males —
Heavy episodic drinkers** (15–85+ years), females —
* (Recorded + unrecorded) in litres of pure alcohol, average 2003–2005.** Had at least 60 grams or more of pure alcohol on at least one occasion weekly.
PATTERNS OF DRINKING SCORE
Patterns of drinking score* LEAST RISKY 1 2 3 4 5 MOST RISKY
* Given the same level of consumption, the higher the patterns of drinking score, the greater the alcohol-attributable burden of disease for the country.
HEALTH CONSEQUENCES
MORBIDITY
Prevalence estimates (12-month prevalence for 2004): Males Females
Alcohol use disorders (15+ years) 2.57% 0.29%
ALL CAUSE MORTALITY
Age-standardized deaths rates, 15+ years (per 100,000 population)
2000 2001 2002 2003 2004 2005
M F M F M F M F M F M F
Liver cirrhosisNo information availableRoad traffi c
accidents (1)
Data source: WHO Mortality Database, data as reported by countries (1) refer to transport accidents.
21%BEER
74%SPIRITS
5%WINE
RECORDED ADULT (15+) ALCOHOL CONSUMPTION BY TYPE OF ALCOHOLIC BEVERAGE (IN % OF PURE ALCOHOL), 2005
Beer includes malt beers. Wine includes wine made from grapes. Spirits include all distilled beverages. Other includes one or several other alcoholic beverages, such as fermented beverages made from sorghum, maize, millet, rice, or cider, fruit wine, fortifi ed wine, etc.
Adult (15+) per capita consumption, average 2003–2005 (in litres of pure alcohol):
Recorded 0.4
Unrecorded 3.0
Total 3.4
WHO European Region 12.2
Ta j i k i s t a n
Total population: 6 640 000 ➤ Population 15+ years: 61% ➤ Population in urban areas: 25% ➤ Income group (World Bank): Low income
Data source: United Nations, data range 1990–2006.
SOCIOECONOMIC CONTEXT
Robust estimate of fi ve-year change in recorded adult(15+) per capita consumption,2001–2005:
INCREASE
STABLE
➤ DECREASE INCONCLUSIVE
1.0
2000 2002
Litre
s of
pur
e al
coho
l
ENLARGEMENT OF RECORDED ADULT (15+) PER CAPITA CONSUMPTION, 2000–2005
Year
2003 20052001
ALCOHOL CONSUMPTION Population data (refer to the population 15 years and older and are in litres of pure alcohol).
1961 1966 1976
Litre
s of
pur
e al
coho
l
1991
RECORDED ADULT (15+) PER CAPITA CONSUMPTION, 1961–2005
Year
1971 1981 200119961986 2006
Beer Wine Spirits Total
15
5
10
20
2004
0.5
0
0
ALCOHOL POLICYExcise tax on beer / wine / spirits Yes / No / Yes
National legal minimum age for off-premise sales of alcoholic beverages (selling) (beer / wine / spirits) 16 / 16 / 18
National legal minimum age for on-premise sales of alcoholic beverages (serving) (beer / wine / spirits) 16 / 16 / 18
Restrictions for on-/off-premise sales of alcoholic beverages:Time (hours and days) / location (places and density) Yes / NoSpecifi c events / intoxicated persons / petrol stations Yes / No / No
National maximum legal blood alcohol concentration (BAC) when driving a vehicle (general / young / professional), in % 0.05 / 0.05 / 0.05
Legally binding regulations on alcohol advertising / product placement Yes / Yes
Legally binding regulations on alcohol sponsorship / sales promotion Yes / Yes
No information available

48
PATTERNS OF DRINKING
ABSTAINERS (15+ years), 2005
Males Females Total
Lifetime abstainers
No information availableFormer drinkers
Abstainers*
* Persons who did not drink in the past 12 months.
DRINKERS ONLY
Adult (15+ years) per capita consumption*, total —
Adult (15+ years) per capita consumption*, males —
Adult (15+ years) per capita consumption*, females —
Heavy episodic drinkers** (15–85+ years), males —
Heavy episodic drinkers** (15–85+ years), females —
* (Recorded + unrecorded) in litres of pure alcohol, average 2003–2005.** Had at least 60 grams or more of pure alcohol on at least one occasion weekly.
PATTERNS OF DRINKING SCORE
Patterns of drinking score* LEAST RISKY 1 2 3 4 5 MOST RISKY
* Given the same level of consumption, the higher the patterns of drinking score, the greater the alcohol-attributable burden of disease for the country.
ALCOHOL POLICYExcise tax on beer / wine / spirits Yes / Yes / Yes
National legal minimum age for off-premise sales of alcoholic beverages (selling) (beer / wine / spirits) 18 / 18 / 18
National legal minimum age for on-premise sales of alcoholic beverages (serving) (beer / wine / spirits) 18 / 18 / 18
Restrictions for on-/off-premise sales of alcoholic beverages:Time (hours and days) / location (places and density) Yes & No / NoSpecifi c events / intoxicated persons / petrol stations Yes / Yes / No
National maximum legal blood alcohol concentration (BAC) when driving a vehicle (general / young / professional), in % 0.05 / ZT / ZT
Legally binding regulations on alcohol advertising / product placement Yes / Yes
Legally binding regulations on alcohol sponsorship / sales promotion No / No
ZT = Zero tolerance.
HEALTH CONSEQUENCES
MORBIDITY
Prevalence estimates (12-month prevalence for 2004): Males Females
Alcohol use disorders (15+ years) 3.35% 0.80%
ALL CAUSE MORTALITY
Age-standardized deaths rates, 15+ years (per 100,000 population)
2000 2001 2002 2003 2004 2005
M F M F M F M F M F M F
Liver cirrhosis 12.3 3.3 15.7 3.3 14.4 4.3 12.2 3.1 — — — —
Road traffi c accidents (1)
9.9 2.7 10.2 1.6 13.1 3.4 12.7 2.2 — — — —
Data source: WHO Mortality Database, data as reported by countries (1) refer to transport accidents.
36%BEER
RECORDED ADULT (15+) ALCOHOL CONSUMPTION BY TYPE OF ALCOHOLIC BEVERAGE (IN % OF PURE ALCOHOL), 2005
Beer includes malt beers. Wine includes wine made from grapes. Spirits include all distilled beverages. Other includes one or several other alcoholic beverages, such as fermented beverages made from sorghum, maize, millet, rice, or cider, fruit wine, fortifi ed wine, etc.
Adult (15+) per capita consumption, average 2003–2005 (in litres of pure alcohol):
Recorded 5.6
Unrecorded 2.9
Total 8.5
WHO European Region 12.2
The Former Yugoslav Republic of MacedoniaTotal population: 2 036 000 ➤ Population 15+ years: 81% ➤ Population in urban areas: 70% ➤ Income group (World Bank): Lower-middle income
Data source: United Nations, data range 1990–2006.
SOCIOECONOMIC CONTEXT
Robust estimate of fi ve-year change in recorded adult(15+) per capita consumption,2001–2005:
➤ INCREASE STABLE
DECREASE
INCONCLUSIVE
8
2000 2002
Litre
s of
pur
e al
coho
lENLARGEMENT OF RECORDED ADULT (15+) PER CAPITA CONSUMPTION, 2000–2005
Year
2003 20052001
ALCOHOL CONSUMPTION Population data (refer to the population 15 years and older and are in litres of pure alcohol).
1961 1966 1976Li
tres
of p
ure
alco
hol
1991
RECORDED ADULT (15+) PER CAPITA CONSUMPTION, 1961–2005
Year
1971 1981 200119961986 2006
Beer Wine Spirits Total
15
5
10
20
4
2
2004
6
0
0
36%SPIRITS
28%WINE

49
PATTERNS OF DRINKING
ABSTAINERS (15+ years), 2003
Males Females Total
Lifetime abstainers 65.0% 91.9% 78.4%
Former drinkers 18.6% 5.2% 11.9%
Abstainers* 83.6% 97.1% 90.3%
* Persons who did not drink in the past 12 months.
DRINKERS ONLY
Adult (15+ years) per capita consumption*, total 29.42
Adult (15+ years) per capita consumption*, males 31.22
Adult (15+ years) per capita consumption*, females 19.39
Heavy episodic drinkers** (15–85+ years), males, 2003 14.9%
Heavy episodic drinkers** (15–85+ years), females, 2003 12.8%
* (Recorded + unrecorded – tourist) in litres of pure alcohol, average 2003–2005.** Had at least 60 grams or more of pure alcohol on at least one occasion weekly.
PATTERNS OF DRINKING SCORE
Patterns of drinking score* LEAST RISKY 1 2 3 4 5 MOST RISKY
* Given the same level of consumption, the higher the patterns of drinking score, the greater the alcohol-attributable burden of disease for the country.
ALCOHOL POLICYExcise tax on beer / wine / spirits Yes / Yes / Yes
National legal minimum age for off-premise sales of alcoholic beverages (selling) (beer / wine / spirits) 18 / 18 / 18
National legal minimum age for on-premise sales of alcoholic beverages (serving) (beer / wine / spirits) 18 / 18 / 18
Restrictions for on-/off-premise sales of alcoholic beverages:Time (hours and days) / location (places and density) No / Yes & NoSpecifi c events / intoxicated persons / petrol stations Yes / No / Yes
National maximum legal blood alcohol concentration (BAC) when driving a vehicle (general / young / professional), in % 0.05 / 0.05 / ZT
Legally binding regulations on alcohol advertising / product placement Yes / Yes
Legally binding regulations on alcohol sponsorship / sales promotion No / Yes
ZT = Zero tolerance.
HEALTH CONSEQUENCES
MORBIDITY
Prevalence estimates (12-month prevalence for 2004): Males Females
Alcohol use disorders (15+ years) 1.77% 0.65%
ALL CAUSE MORTALITY
Age-standardized deaths rates, 15+ years (per 100,000 population)
2000 2001 2002 2003 2004 2005
M F M F M F M F M F M F
Liver cirrhosisNo information availableRoad traffi c
accidents (1)
Data source: WHO Mortality Database, data as reported by countries (1) refer to transport accidents.
60%BEER
35%SPIRITS
5%WINE
RECORDED ADULT (15+) ALCOHOL CONSUMPTION BY TYPE OF ALCOHOLIC BEVERAGE (IN % OF PURE ALCOHOL), 2005
Beer includes malt beers. Wine includes wine made from grapes. Spirits include all distilled beverages. Other includes one or several other alcoholic beverages, such as fermented beverages made from sorghum, maize, millet, rice, or cider, fruit wine, fortifi ed wine, etc.
Adult (15+) per capita consumption, average 2003–2005 (in litres of pure alcohol):
Recorded 1.4
Unrecorded 2.0
Total 3.4
WHO European Region 12.2
Tu r k e y
Total population: 73 922 000 ➤ Population 15+ years: 72% ➤ Population in urban areas: 68% ➤ Income group (World Bank): Upper-middle income
Data source: United Nations, data range 1990–2006.
SOCIOECONOMIC CONTEXT
Robust estimate of fi ve-year change in recorded adult(15+) per capita consumption,2001–2005:
INCREASE
➤ STABLE DECREASE
INCONCLUSIVE
2.0
2000 2002
Litre
s of
pur
e al
coho
l
ENLARGEMENT OF RECORDED ADULT (15+) PER CAPITA CONSUMPTION, 2000–2005
Year
2003 20052001
ALCOHOL CONSUMPTION Population data (refer to the population 15 years and older and are in litres of pure alcohol).
1961 1966 1976
Litre
s of
pur
e al
coho
l
1991
RECORDED ADULT (15+) PER CAPITA CONSUMPTION, 1961–2005
Year
1971 1981 200119961986 2006
Change in data source from 2000
Beer Wine Spirits Total
15
5
10
20
2004
1.5
0.5
1.0
0
0

50
PATTERNS OF DRINKING
ABSTAINERS (15+ years), 2005
Males Females Total
Lifetime abstainers
No information availableFormer drinkers
Abstainers*
* Persons who did not drink in the past 12 months.
DRINKERS ONLY
Adult (15+ years) per capita consumption*, total —
Adult (15+ years) per capita consumption*, males —
Adult (15+ years) per capita consumption*, females —
Heavy episodic drinkers** (15–85+ years), males —
Heavy episodic drinkers** (15–85+ years), females —
* (Recorded + unrecorded) in litres of pure alcohol, average 2003–2005.** Had at least 60 grams or more of pure alcohol on at least one occasion weekly.
PATTERNS OF DRINKING SCORE
Patterns of drinking score* LEAST RISKY 1 2 3 4 5 MOST RISKY
* Given the same level of consumption, the higher the patterns of drinking score, the greater the alcohol-attributable burden of disease for the country.
ALCOHOL POLICYExcise tax on beer / wine / spirits NA
National legal minimum age for off-premise sales of alcoholic beverages (selling) (beer / wine / spirits) NA
National legal minimum age for on-premise sales of alcoholic beverages (serving) (beer / wine / spirits) NA
Restrictions for on-/off-premise sales of alcoholic beverages:Time (hours and days) / location (places and density) NASpecifi c events / intoxicated persons / petrol stations NA
National maximum legal blood alcohol concentration (BAC) when driving a vehicle (general / young / professional), in % 0.05 / 0.05 / 0.05
Legally binding regulations on alcohol advertising / product placement NA
Legally binding regulations on alcohol sponsorship / sales promotion NA
NA = No information.
HEALTH CONSEQUENCES
MORBIDITY
Prevalence estimates (12-month prevalence for 2004): Males Females
Alcohol use disorders (15+ years) 1.51% 0.17%
ALL CAUSE MORTALITY
Age-standardized deaths rates, 15+ years (per 100,000 population)
2000 2001 2002 2003 2004 2005
M F M F M F M F M F M F
Liver cirrhosisNo information availableRoad traffi c
accidents (1)
Data source: WHO Mortality Database, data as reported by countries (1) refer to transport accidents.
9%BEER
39%WINE
52%SPIRITS
RECORDED ADULT (15+) ALCOHOL CONSUMPTION BY TYPE OF ALCOHOLIC BEVERAGE (IN % OF PURE ALCOHOL), 2005
Beer includes malt beers. Wine includes wine made from grapes. Spirits include all distilled beverages. Other includes one or several other alcoholic beverages, such as fermented beverages made from sorghum, maize, millet, rice, or cider, fruit wine, fortifi ed wine, etc.
Adult (15+) per capita consumption, average 2003–2005 (in litres of pure alcohol):
Recorded 2.3
Unrecorded 2.3
Total 4.6
WHO European Region 12.2
Tu r k m e n i s t a n
Total population: 4 899 000 ➤ Population 15+ years: 69% ➤ Population in urban areas: 47% ➤ Income group (World Bank): Lower-middle income
Data source: United Nations, data range 1990–2006.
SOCIOECONOMIC CONTEXT
Robust estimate of fi ve-year change in recorded adult(15+) per capita consumption,2001–2005:
INCREASE
➤ STABLE DECREASE
INCONCLUSIVE
4
2000 2002
Litre
s of
pur
e al
coho
lENLARGEMENT OF RECORDED ADULT (15+) PER CAPITA CONSUMPTION, 2000–2005
Year
2003 20052001 2004
3
2
ALCOHOL CONSUMPTION Population data (refer to the population 15 years and older and are in litres of pure alcohol).
1961 1966 1976Li
tres
of p
ure
alco
hol
1991
RECORDED ADULT (15+) PER CAPITA CONSUMPTION, 1961–2005
Year
1971 1981 200119961986 2006
Change in data source from 2000
Beer Wine Spirits Total
15
5
10
20
1
0
0
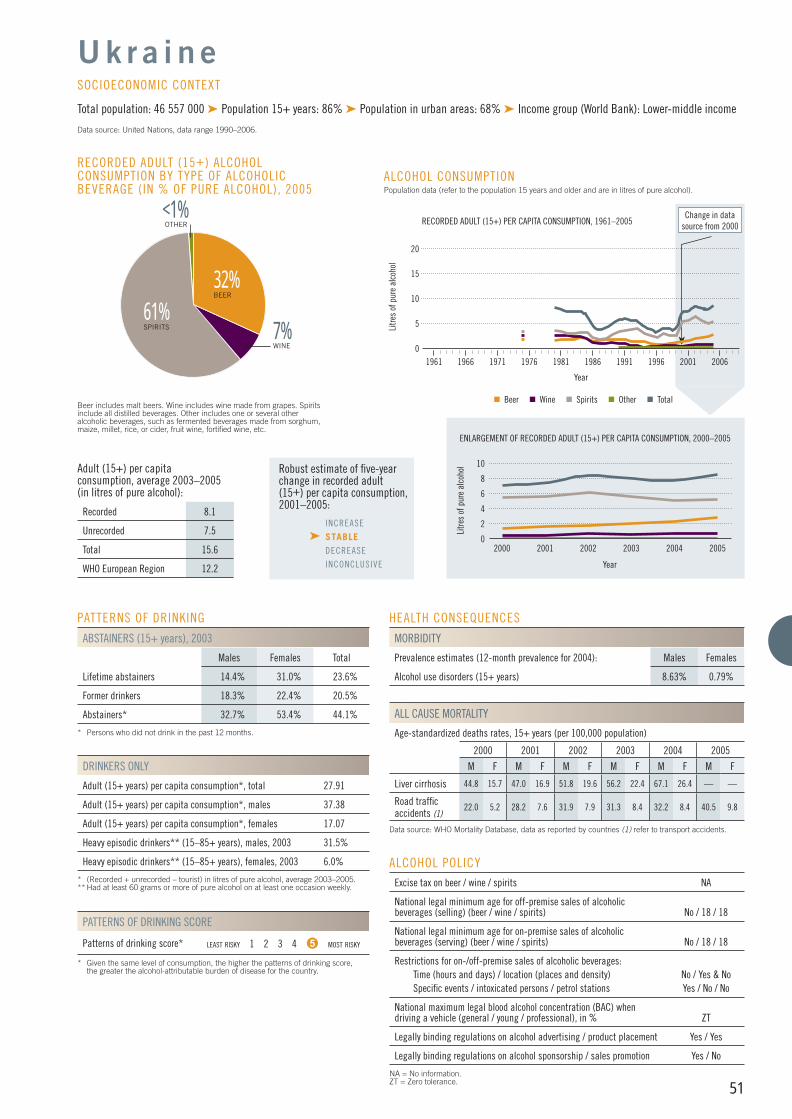
51
PATTERNS OF DRINKING
ABSTAINERS (15+ years), 2003
Males Females Total
Lifetime abstainers 14.4% 31.0% 23.6%
Former drinkers 18.3% 22.4% 20.5%
Abstainers* 32.7% 53.4% 44.1%
* Persons who did not drink in the past 12 months.
DRINKERS ONLY
Adult (15+ years) per capita consumption*, total 27.91
Adult (15+ years) per capita consumption*, males 37.38
Adult (15+ years) per capita consumption*, females 17.07
Heavy episodic drinkers** (15–85+ years), males, 2003 31.5%
Heavy episodic drinkers** (15–85+ years), females, 2003 6.0%
* (Recorded + unrecorded – tourist) in litres of pure alcohol, average 2003–2005.** Had at least 60 grams or more of pure alcohol on at least one occasion weekly.
PATTERNS OF DRINKING SCORE
Patterns of drinking score* LEAST RISKY 1 2 3 4 5 MOST RISKY
* Given the same level of consumption, the higher the patterns of drinking score, the greater the alcohol-attributable burden of disease for the country.
ALCOHOL POLICYExcise tax on beer / wine / spirits NA
National legal minimum age for off-premise sales of alcoholic beverages (selling) (beer / wine / spirits) No / 18 / 18
National legal minimum age for on-premise sales of alcoholic beverages (serving) (beer / wine / spirits) No / 18 / 18
Restrictions for on-/off-premise sales of alcoholic beverages:Time (hours and days) / location (places and density) No / Yes & NoSpecifi c events / intoxicated persons / petrol stations Yes / No / No
National maximum legal blood alcohol concentration (BAC) when driving a vehicle (general / young / professional), in % ZT
Legally binding regulations on alcohol advertising / product placement Yes / Yes
Legally binding regulations on alcohol sponsorship / sales promotion Yes / No
NA = No information.ZT = Zero tolerance.
HEALTH CONSEQUENCES
MORBIDITY
Prevalence estimates (12-month prevalence for 2004): Males Females
Alcohol use disorders (15+ years) 8.63% 0.79%
ALL CAUSE MORTALITY
Age-standardized deaths rates, 15+ years (per 100,000 population)
2000 2001 2002 2003 2004 2005
M F M F M F M F M F M F
Liver cirrhosis 44.8 15.7 47.0 16.9 51.8 19.6 56.2 22.4 67.1 26.4 — —
Road traffi c accidents (1)
22.0 5.2 28.2 7.6 31.9 7.9 31.3 8.4 32.2 8.4 40.5 9.8
Data source: WHO Mortality Database, data as reported by countries (1) refer to transport accidents.
32%BEER
61%SPIRITS
<1%OTHER
RECORDED ADULT (15+) ALCOHOL CONSUMPTION BY TYPE OF ALCOHOLIC BEVERAGE (IN % OF PURE ALCOHOL), 2005
Beer includes malt beers. Wine includes wine made from grapes. Spirits include all distilled beverages. Other includes one or several other alcoholic beverages, such as fermented beverages made from sorghum, maize, millet, rice, or cider, fruit wine, fortifi ed wine, etc.
Adult (15+) per capita consumption, average 2003–2005 (in litres of pure alcohol):
Recorded 8.1
Unrecorded 7.5
Total 15.6
WHO European Region 12.2
U k r a i n e
Total population: 46 557 000 ➤ Population 15+ years: 86% ➤ Population in urban areas: 68% ➤ Income group (World Bank): Lower-middle income
Data source: United Nations, data range 1990–2006.
SOCIOECONOMIC CONTEXT
Robust estimate of fi ve-year change in recorded adult(15+) per capita consumption,2001–2005:
INCREASE
➤ STABLE DECREASE
INCONCLUSIVE
10
2000 2002
Litre
s of
pur
e al
coho
l
ENLARGEMENT OF RECORDED ADULT (15+) PER CAPITA CONSUMPTION, 2000–2005
Year
2003 20052001
ALCOHOL CONSUMPTION Population data (refer to the population 15 years and older and are in litres of pure alcohol).
1961 1966 1976
Litre
s of
pur
e al
coho
l
1991
RECORDED ADULT (15+) PER CAPITA CONSUMPTION, 1961–2005
Year
1971 1981 200119961986 2006
Change in data source from 2000
Beer Wine Spirits Other Total
15
5
10
20
2004
4
8
2
6
0
0
7%WINE
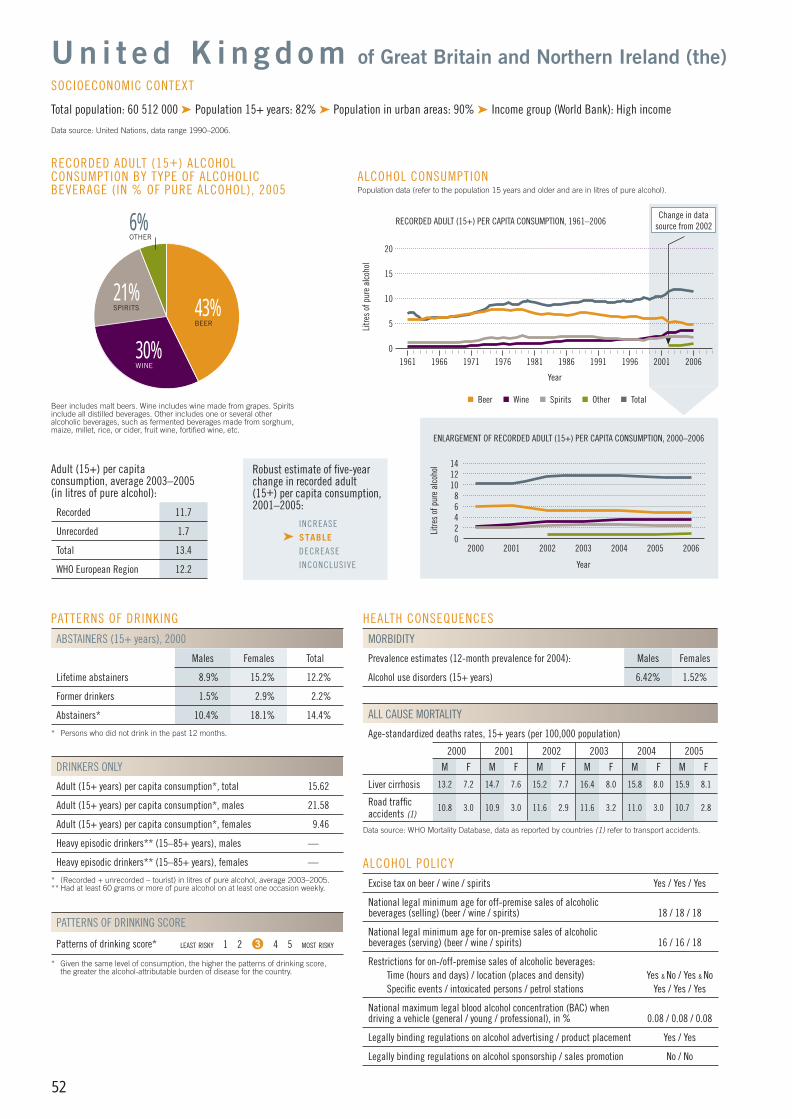
52
PATTERNS OF DRINKING
ABSTAINERS (15+ years), 2000
Males Females Total
Lifetime abstainers 8.9% 15.2% 12.2%
Former drinkers 1.5% 2.9% 2.2%
Abstainers* 10.4% 18.1% 14.4%
* Persons who did not drink in the past 12 months.
DRINKERS ONLY
Adult (15+ years) per capita consumption*, total 15.62
Adult (15+ years) per capita consumption*, males 21.58
Adult (15+ years) per capita consumption*, females 9.46
Heavy episodic drinkers** (15–85+ years), males —
Heavy episodic drinkers** (15–85+ years), females —
* (Recorded + unrecorded – tourist) in litres of pure alcohol, average 2003–2005.** Had at least 60 grams or more of pure alcohol on at least one occasion weekly.
PATTERNS OF DRINKING SCORE
Patterns of drinking score* LEAST RISKY 1 2 3 4 5 MOST RISKY
* Given the same level of consumption, the higher the patterns of drinking score, the greater the alcohol-attributable burden of disease for the country.
ALCOHOL POLICYExcise tax on beer / wine / spirits Yes / Yes / Yes
National legal minimum age for off-premise sales of alcoholic beverages (selling) (beer / wine / spirits) 18 / 18 / 18
National legal minimum age for on-premise sales of alcoholic beverages (serving) (beer / wine / spirits) 16 / 16 / 18
Restrictions for on-/off-premise sales of alcoholic beverages:Time (hours and days) / location (places and density) Yes & No / Yes & NoSpecifi c events / intoxicated persons / petrol stations Yes / Yes / Yes
National maximum legal blood alcohol concentration (BAC) when driving a vehicle (general / young / professional), in % 0.08 / 0.08 / 0.08
Legally binding regulations on alcohol advertising / product placement Yes / Yes
Legally binding regulations on alcohol sponsorship / sales promotion No / No
HEALTH CONSEQUENCES
MORBIDITY
Prevalence estimates (12-month prevalence for 2004): Males Females
Alcohol use disorders (15+ years) 6.42% 1.52%
ALL CAUSE MORTALITY
Age-standardized deaths rates, 15+ years (per 100,000 population)
2000 2001 2002 2003 2004 2005
M F M F M F M F M F M F
Liver cirrhosis 13.2 7.2 14.7 7.6 15.2 7.7 16.4 8.0 15.8 8.0 15.9 8.1
Road traffi c accidents (1)
10.8 3.0 10.9 3.0 11.6 2.9 11.6 3.2 11.0 3.0 10.7 2.8
Data source: WHO Mortality Database, data as reported by countries (1) refer to transport accidents.
43%BEER
30%WINE
21%SPIRITS
6%OTHER
RECORDED ADULT (15+) ALCOHOL CONSUMPTION BY TYPE OF ALCOHOLIC BEVERAGE (IN % OF PURE ALCOHOL), 2005
Beer includes malt beers. Wine includes wine made from grapes. Spirits include all distilled beverages. Other includes one or several other alcoholic beverages, such as fermented beverages made from sorghum, maize, millet, rice, or cider, fruit wine, fortifi ed wine, etc.
Adult (15+) per capita consumption, average 2003–2005 (in litres of pure alcohol):
Recorded 11.7
Unrecorded 1.7
Total 13.4
WHO European Region 12.2
U n i t e d K i n g d o m
Total population: 60 512 000 ➤ Population 15+ years: 82% ➤ Population in urban areas: 90% ➤ Income group (World Bank): High income
Data source: United Nations, data range 1990–2006.
SOCIOECONOMIC CONTEXT
Robust estimate of fi ve-year change in recorded adult(15+) per capita consumption,2001–2005:
INCREASE
➤ STABLE DECREASE
INCONCLUSIVE
14
2000 2002
Litre
s of
pur
e al
coho
lENLARGEMENT OF RECORDED ADULT (15+) PER CAPITA CONSUMPTION, 2000–2006
Year
2003 20062001
6
ALCOHOL CONSUMPTION Population data (refer to the population 15 years and older and are in litres of pure alcohol).
1961 1966 1976Li
tres
of p
ure
alco
hol
1991
RECORDED ADULT (15+) PER CAPITA CONSUMPTION, 1961–2006
Year
1971 1981 200119961986 2006
Change in data source from 2002
Beer Wine Spirits Other Total
15
5
10
20
2004 2005
1012
2
8
4
0
0
of Great Britain and Northern Ireland (the)

53
PATTERNS OF DRINKING
ABSTAINERS (15+ years), 2005
Males Females Total
Lifetime abstainers
No information availableFormer drinkers
Abstainers*
* Persons who did not drink in the past 12 months.
DRINKERS ONLY
Adult (15+ years) per capita consumption*, total —
Adult (15+ years) per capita consumption*, males —
Adult (15+ years) per capita consumption*, females —
Heavy episodic drinkers** (15–85+ years), males —
Heavy episodic drinkers** (15–85+ years), females —
* (Recorded + unrecorded) in litres of pure alcohol, average 2003–2005.** Had at least 60 grams or more of pure alcohol on at least one occasion weekly.
PATTERNS OF DRINKING SCORE
Patterns of drinking score* LEAST RISKY 1 2 3 4 5 MOST RISKY
* Given the same level of consumption, the higher the patterns of drinking score, the greater the alcohol-attributable burden of disease for the country.
ALCOHOL POLICYExcise tax on beer / wine / spirits NA
National legal minimum age for off-premise sales of alcoholic beverages (selling) (beer / wine / spirits) 18 / 18 / 18
National legal minimum age for on-premise sales of alcoholic beverages (serving) (beer / wine / spirits) 18 / 18 / 18
Restrictions for on-/off-premise sales of alcoholic beverages:Time (hours and days) / location (places and density) Yes & No / YesSpecifi c events / intoxicated persons / petrol stations No / No / No
National maximum legal blood alcohol concentration (BAC) when driving a vehicle (general / young / professional), in % ZT
Legally binding regulations on alcohol advertising / product placement Yes / Yes
Legally binding regulations on alcohol sponsorship / sales promotion Yes / Yes
NA = No information.ZT = Zero tolerance.
HEALTH CONSEQUENCES
MORBIDITY
Prevalence estimates (12-month prevalence for 2004): Males Females
Alcohol use disorders (15+ years) 2.10% 0.23%
ALL CAUSE MORTALITY
Age-standardized deaths rates, 15+ years (per 100,000 population)
2000 2001 2002 2003 2004 2005
M F M F M F M F M F M F
Liver cirrhosis 61.1 47.2 60.0 48.0 64.7 50.6 62.8 47.1 51.3 38.6 53.7 40.6
Road traffi c accidents (1)
17.6 4.3 17.2 4.2 10.9 2.9 16.8 3.7 21.8 4.8 21.3 4.5
Data source: WHO Mortality Database, data as reported by countries (1) refer to transport accidents.
20%BEER
14%WINE66%
SPIRITS
RECORDED ADULT (15+) ALCOHOL CONSUMPTION BY TYPE OF ALCOHOLIC BEVERAGE (IN % OF PURE ALCOHOL), 2005
Beer includes malt beers. Wine includes wine made from grapes. Spirits include all distilled beverages. Other includes one or several other alcoholic beverages, such as fermented beverages made from sorghum, maize, millet, rice, or cider, fruit wine, fortifi ed wine, etc.
Adult (15+) per capita consumption, average 2003–2005 (in litres of pure alcohol):
Recorded 1.6
Unrecorded 1.9
Total 3.5
WHO European Region 12.2
U z b e k i s t a n
Total population: 26 981 000 ➤ Population 15+ years: 68% ➤ Population in urban areas: 37% ➤ Income group (World Bank): Low income
Data source: United Nations, data range 1990–2006.
SOCIOECONOMIC CONTEXT
Robust estimate of fi ve-year change in recorded adult(15+) per capita consumption,2001–2005:
➤ INCREASE STABLE
DECREASE
INCONCLUSIVE
2.0
2000 2002
Litre
s of
pur
e al
coho
l
ENLARGEMENT OF RECORDED ADULT (15+) PER CAPITA CONSUMPTION, 2000–2005
Year
2003 20052001
ALCOHOL CONSUMPTION Population data (refer to the population 15 years and older and are in litres of pure alcohol).
1961 1966 1976
Litre
s of
pur
e al
coho
l
1991
RECORDED ADULT (15+) PER CAPITA CONSUMPTION, 1961–2005
Year
1971 1981 200119961986 2006
Beer Wine Spirits Total
15
5
10
20
2004
1.0
0.5
1.5
0
0
Recommended

![Wine’s Phenolic Compounds and Health: A Pythagorean View · lower thrombogenicity observed in moderate drinkers vs. abstainers [1]. Some authors propose the superiority of wine,](https://img.pdfslide.us/doc/110x75/61018d03a183831ccf316537/wineas-phenolic-compounds-and-health-a-pythagorean-view-lower-thrombogenicity.jpg)