Counseling and Complementary Therapy:
A National Survey of Counselors’ Experiences
Trent Alan Davis
Dissertation submitted to the faculty of the
Virginia Polytechnic Institute and State University
in partial fulfillment of the requirements for the degree of
Doctor of Philosophy
In
Counselor Education
Hildy Getz, Co-chair
Kusum Singh, Co-chair
Gerard Lawson
Maria Papadakis
Christina McGrady Mathai
April 11, 2005
Blacksburg, Virginia
Keywords: Complementary Therapy, Alternative Therapy, Counseling, Counselor
Education, Referral, Inclusion, Personal Experience
Copyright 2005, Trent Alan Davis
Counseling and Complementary Therapy:
A National Survey of Counselors’ Experiences
Trent Alan Davis
Co-chairs: Hildy Getz and Kusum Singh
(ABSTRACT)
There has been little research to date specifically addressing counselors’
experiences with complementary therapy. The objective of this exploratory survey was to
assess counselors’ professional practice, knowledge and training, and personal experience
with complementary therapy. The study design was a web-based, random sample survey
of American Counseling Association members.
Results indicated the typical respondent was female, Caucasian, holds a Master’s
degree and works in a private practice/self-employed or community agency setting as an
outpatient counselor. Few respondents asked about or had clients volunteer use of
complementary therapy. Anxiety and depression were the most common client concerns
for which respondents recommended or referred for complementary therapy.
Respondents agreed that client referrals should be to licensed or certified practitioners.
Respondents reported that complementary therapy provided clients with at least some
positive benefits and few negative consequences.
The majority of respondents included complementary therapy in counseling
during the past year and thought that complementary therapy should be included in
addition to counseling. Although respondents considered themselves qualified to discuss
a variety of complementary therapies, few possessed licensure or certification. The
majority of respondents used informal, self-study to gain knowledge of complementary
therapy. Most respondents have personally experienced at least one complementary
therapy, primarily “To improve overall wellness”. Respondents reported they received
some to large benefits from this experience.
A number of respondents descriptors had moderately positive associations with
client usage, recommendation and referral, inclusion, and knowledge factors. These
descriptors were those respondents who worked in a private practice/self-employed
setting, as an outpatient counselor, were licensed as an LPC, provided individual,
family/couples, or alcohol/substance abuse counseling, and had a psychodynamic
iii
orientation. There were moderately negative associations between respondents who
worked in a K-12 setting, did not possess mental health licensure and were a Master’s
student and client usage, recommendation and referral, and inclusion factors.
The data provide support for the idea that counselors are beginning to embrace a
post-modern approach, which gives consideration to complementary therapy
interventions. However, the findings also suggested that the counseling profession still
has a good deal of work to do before it can be considered truly holistic.

iv
DEDICATION
I dedicate this dissertation to my family for their support throughout this long process.
Thank you all for your patience and understanding of the long hours I spent working on
my computer. I also wish to thank my parents for believing in me – I finally did it!
v
ACKNOWLEDGEMENTS
I wish to acknowledge my committee members for their encouragement throughout this
dissertation. I also appreciate their enthusiastic support for my dissertation subject matter.
Thank you to my co-chair Hildy Getz for her kind spirit, intellectual acumen and
openness. You made this a great experience.
Thank you to my co-chair Kusum Singh for her intelligence, insight and humor. You
were awesome.
Thank you to Gerard Lawson for his thoughtful feedback at my final defense. I look
forward to creating a great article together.
Thank you to Maria Papadakis for her friendship and professional support throughout this
process. You helped me more than you know.
Thank you to Christina Mathai for being willing to take on another task along with
raising your son. Your experience was invaluable.
Thank you to Vicki Meadows for her calm demeanor and making the paperwork easy.
A special thanks go to my wife, Joyce, for her personal and professional sustenance. I
know you will be almost as happy as I am when this is done.
Thank you also to Ethan and Alanis for their good-humored tolerance of something they
cannot quite understand yet. Also, a special gratitude goes out to my furry friends, Skippy
and Summer for their companionship throughout this process. You may miss me when
this is done.
vi
TABLE OF CONTENTS
ABSTRACT........................................................................................................................ ii
DEDICATION................................................................................................................... iv
ACKNOWLEDGEMENTS................................................................................................ v
TABLE OF CONTENTS................................................................................................... vi
LIST OF TABLES............................................................................................................. ix
CHAPTER ONE: INTRODUCTION................................................................................. 1
Rationale for the Study ................................................................................................. 3
Statement of the Problem.............................................................................................. 7
Purpose of the Study ..................................................................................................... 8
Research Questions....................................................................................................... 8
Significance of the Study .............................................................................................. 8
Methodology................................................................................................................. 9
Definition of Terms....................................................................................................... 9
Delimitations and Limitations..................................................................................... 10
Summary ..................................................................................................................... 11
CHAPTER TWO: REVIEW OF THE LITERATURE.................................................... 12
The Shifting Paradigm of Complementary Therapy................................................... 13
Effects of Dualism ................................................................................................. 14
Paradigms “Shift” ................................................................................................ 15
Definitions and Categories of Complementary Therapy ............................................ 17
Utilization Trends in Complementary Therapy .......................................................... 19
Mental Health Consumers’ Experiences with Complementary Therapy ................... 20
The Emergent Role of Counselors and Complementary Therapy .............................. 23
Training and Education in Complementary Therapy.................................................. 24
Summary ..................................................................................................................... 25
CHAPTER THREE: METHODOLOGY ......................................................................... 26
Web-based Survey Research....................................................................................... 26
Participants.................................................................................................................. 30
Representativeness...................................................................................................... 31
Response Rate............................................................................................................. 31
vii
Sample Size................................................................................................................. 31
Calculation of Sample Size......................................................................................... 33
Confidentiality and Informed Consent........................................................................ 34
Delimitations and Limitations..................................................................................... 34
Research Questions..................................................................................................... 35
Instrumentation ........................................................................................................... 36
Data Collection Procedures......................................................................................... 38
Data Analysis .............................................................................................................. 42
Summary ..................................................................................................................... 42
CHAPTER FOUR: RESULTS ......................................................................................... 44
Demographic Data Corresponding to ACA Categories.............................................. 45
Representativeness of Sample..................................................................................... 48
Additional Demographic Data .................................................................................... 51
Results of Research Questions.................................................................................... 55
Research Question One......................................................................................... 55
Research Question Two ........................................................................................ 59
Research Question Three ...................................................................................... 64
Research Question Four ....................................................................................... 68
Research Question Five ........................................................................................ 73
Research Question Six .......................................................................................... 77
Summary ................................................................................................................... 102
CHAPTER FIVE: DISCUSSION AND RECOMMENDATIONS ............................... 103
Profile of Participants ............................................................................................... 103
Overview of Findings ............................................................................................... 104
Research Question One............................................................................................. 104
Research Question Two ............................................................................................ 106
Research Question Three .......................................................................................... 108
Research Question Four............................................................................................ 109
Research Question Five ............................................................................................ 111
Research Question Six .............................................................................................. 112
Summary of Findings................................................................................................ 117
viii
Work Setting Matters .......................................................................................... 118
Mental Health Licensure is Critical ................................................................... 118
Position, Services Provided and Theoretical Orientation Play Key Roles......... 118
Alternative Analysis of Associations ................................................................... 118
Implications for Clinical Practice ............................................................................. 119
Implications for Counselor Education ...................................................................... 120
Limitations ................................................................................................................ 121
Recommendations for Research, Practice and Education......................................... 122
Research Methodology........................................................................................ 122
Practice and Education....................................................................................... 122
Conclusion ................................................................................................................ 123
Summary ................................................................................................................... 124
REFERENCES ............................................................................................................... 126
Appendix A..................................................................................................................... 141
Appendix B ..................................................................................................................... 156
Appendix C ..................................................................................................................... 157
Appendix D..................................................................................................................... 159
Appendix E ..................................................................................................................... 161
Appendix F...................................................................................................................... 163
Vita.…............................................................................................................................. 171
ix
LIST OF TABLES
Table 1: Demographic Data Corresponding to ACA Categories...................................... 46
Table 2: Representativeness of Sample with Chi-square Output...................................... 49
Table 3: Additional Demographic Data............................................................................ 53
Table 4: Professional Practice Factors: Research Question One ...................................... 57
Table 5: Professional Practice Factors: Research Question Two ..................................... 62
Table 6: Professional Practice Factors: Research Question Three ................................... 66
Table 7: Knowledge and Training Factors: Research Question Four............................... 70
Table 8: Personal Experience Factors: Research Question Five ...................................... 74
Table 9: Crosstabulation: Significant Associations for
Demographics x Research Question One (#1).................................................... 80
Table 10: Crosstabulation: Significant Associations for
Demographics x Research Question One (#2).................................................. 83
Table 11: Crosstabulation: Significant Associations for
Demographics x Research Question Two (#19) ............................................... 85
Table 12: Crosstabulation: Significant Associations for
Demographics x Research Question Two (#20) ............................................... 86
Table 13: Crosstabulation: Significant Associations for
Demographics x Research Question Two (#21) ............................................... 87
Table 14: Crosstabulation: Significant Associations for
Demographics x Research Question Two (#22) ............................................... 89
Table 15: Crosstabulation: Significant Associations for
Demographics x Research Question Three (#14) ............................................. 92
Table 16: Crosstabulation: Significant Associations for
Demographics x Research Question Three (#15) ............................................. 95
Table 17: Crosstabulation: Significant Associations for
Demographics x Research Question Four (#10)............................................... 97
Table 18: Crosstabulation:
Ordered by Strength of Association (Cramer’s V) ......................................... 100
1
CHAPTER ONE
INTRODUCTION
Over the past few decades, the character of health care has gradually shifted
toward a more inclusive or holistic model of wellness (Shannon, 2002). An important
element of this conceptualization of health is an emphasis on “being well”, not simply
free of disease. This comprehensive model posits well being as our natural state, in stark
contrast with the conventional medical view of the human being as engaged in a constant
battle with a variety of insidious disease agents (i.e., germs, viruses, mutating cells)
(Weil, 1997).
This recognition of our holistic nature represents a fundamental shift in how
society views both illness and health. As Thomas Kuhn (1970) eloquently argued in his
seminal work, The Structure of Scientific Revolutions, when accumulating (scientific)
evidence does not readily fit into the currently accepted reality, it (the evidence) is more
accurately termed a paradigm shift. This emerging trend has also been labeled as
postmodern or constructivist because its challenges to present “givens” (i.e., paradigms)
and skepticism about postulates that there exists a single truth or reality (Gerber &
Basham, 1999). So, today, it has been asserted that underneath the observed changes in
peoples’ health care behaviors there are deeper currents at play, which reflect profound
changes in modern society’s needs and values (Jonas, 2000).
From a mental health perspective, Bassman and Uellendahl (2003) concurred that
complementary and alternative therapy represents a profound paradigm shift for the
practice of counseling. As they stated, “old, comfortable patterns would give way to new
ones that call for more personal responsibility on the part of clients and involve more
health care options” (p. 268; emphasis added). This ability to shift worldviews in order to
meet changing needs and values is one of the most important, and difficult, challenges
facing 21st century mental health caregivers (Shannon, 2002).
In striving to meet this need, the mental health profession has begun to recognize
the holistic nature of psychological problems and researchers have called for a
broadening of the psychotherapist’s role (Miller, 1996; Pollock, 2001). Specific to
counseling, is a core philosophy of wellness, which posits a positive, holistic stance
toward human suffering and change (Myers, 1992). Counselors have a unique role to play
2
in the mental health arena by focusing on those factors, and offering more options that
address the gap between wellness and lack of illness (Hermon & Hazler, 1999).
Research has shown there is an inherent and crucial connection between body,
mind and spirit (Pert, 1997; Rand, 1996). Therefore, the implication of a holistic model of
wellness is that effective health care, whether identified primarily as physical or
psychological in origin, can no longer restrict itself to only treating part of the person, but
must address multiple realms of experience (White, 2000)
Along with this emergent definition of wellness has come an increased interest in
more inclusive and less invasive therapies, which work with the whole person. Thus,
many age-old therapies, such as acupuncture, as well as some newer therapies (e.g., Eye
Movement Desensitization Reprocessing) have become vanguards of modern health care.
Likewise, counselors are also searching for integration in the practice of psychotherapy,
which necessarily involves the reconciliation of different realities (Fear & Woolfe, 1996).
These “new”, integrative therapies/realties have received the title of
complementary and/or alternative health care/therapy (National Center for
Complementary and Alternative Medicine, 2002). Specific to a counseling perspective,
complementary and alternative therapies are defined as, “therapeutic modalities other
than [mainstream] psychotherapy in all its various forms and other than mainstream
medical practice” (Bassman & Uellendahl, 2003, p. 264). A few examples of
complementary counseling interventions are aromatherapy, exercise, guided imagery,
herbs, Reiki, and Yoga. (Ernst, Rand, & Stevinson, 1998). Note: The term
complementary therapy is used throughout this paper in lieu of complementary and
alternative therapy, since less than 2% of the US population has used these therapies as
an “alternative” to conventional health care (Druss & Rosenheck, 1999).
Despite a long history of animosity toward unconventional approaches, the
conventional medical community has begun serious scrutiny of claims of efficacy for
complementary therapeutic approaches (Diamond, 2001). In 1993, Congress established
the National Center for Complementary and Alternative Medicine (NCCAM), part of the
National Institutes of Health (NIH), to address many of the issues surrounding
complementary therapy. Furthermore, specialized research institutes have been
3
established at a select group of higher education institutions to rigorously investigate
complementary therapy under the auspices of the NCCAM (Marwick, 1998).
Studies have shown a substantial increase in the use of complementary therapy by
the general public in recent years. Visits to complementary therapy practitioners
increased by 47% between 1990 and 1997, reaching 629 million adult visits in 1997
(Eisenberg, et al., 1993, 1998). Further, 42% of the US population utilized at least one
form of complementary therapy in 1997, exceeding visits to all US primary care
physicians by almost 40%. In addition, payments to complementary therapy practitioners
were $21 billion in 1997, with $12 billion coming out-of-pocket, exceeding expenditures
for all US hospitalizations. Finally, and most importantly, these figures are expected to
increase for the foreseeable future (Chez & Jonas, 1997).
Critics argue that the increased interest of the medical community reflects this
inexorable trend toward the greater use of complementary therapy by consumers
(Gordon, Nienstedt, & Gesler, 1998). The enormity of out-of pocket expenditures on
complementary therapy alone ($27 billion in 1997, exceeding the total amount spent by
consumers on all US physician services that same year), is certainly sufficient to attract
the attention of those involved in conventional health care, research and policy.
Relevant research reported that an even greater percentage of the mental health
population uses complementary therapy on a regular basis. Research by Knaudt, Conner,
Weisler, Churchill, and Davidson (1999) found that 54% of psychiatric outpatients had
used some form of complementary therapy in the past year to treat a mental health
condition. Further evidence for this trend comes from research by Eisenberg, et al. (1993,
1998), which established that much of the increased use of complementary therapies was
for the psychological concerns of anxiety, depression, insomnia, and (psychologically
mediated) back and neck pain.
Rationale for the Study
There remains little ambiguity that mental health clients are using complementary
therapy to treat both mental and physical concerns. However, Knaudt, et al. (1999) found
that while over half of psychiatric outpatients had concurrent use of complementary
therapy and standard mental health care, only 51% discussed this use with their
psychiatrist. Interestingly, this underreporting of use was not attributed by clients to
4
feelings their conventional caregiver would disapprove of their use of complementary
therapy (Astin, 1998). Rather, it was more likely, clients reasoned, that it was not
important their caregiver know, that their caregiver did not ask or that their caregiver
would not understand (Eisenberg, et al., 2001; Knaudt, et al., 1999). Surprisingly, the
counseling literature is virtually silent concerning what percentage of clients discuss their
use of complementary therapy with their counselors.
The dramatic increase in the use of complementary therapy produces several
challenges for counselors. First, counselors need to be aware of their clients’ use of
complementary therapy in order to continue to provide educated and effective
interventions. In addition, counselors need to be aware of the possible impact of culture
on clients’ use of complementary therapy. Finally, counselors have an ethical
responsibility to their clients to be able to engage in competent discussions and provide
knowledgeable recommendations and referrals concerning complementary therapy.
One of the goals of all forms of counseling is the empowerment of clients in the
direction of self-care and regulation (Bankart, 1997; Teyber, 1997). For example, a
significant predictor of complementary therapy use for women living with breast cancer
was a preference for a more active and collaborative role in their treatment (Balneaves,
Kristjanson, & Tataryn, 1999). Similarly, Truant and Bottroff (1999) found that a similar
group of clients perceived their use of complementary therapy as means of gaining
control and maintaining hope during a time of uncertainty. Therefore, the use of
complementary therapy may function as a behavioral indicator and possible pathway for
clients seeking self-empowerment. In essence, clients may seek out complementary
therapy to take charge of their own “being” – well or not.
An additional concern relates to reported correlates between clients’ use of
complementary therapy and psychopathology. Several studies indicated that self-reported
and professional diagnosis of mental disorders were both associated with increased client
use of complementary therapy (Davidson, et al., 1998; Druss, Rohrbaugh, Kosten, Hoff,
& Rosenheck, 1998; Druss & Rosenheck, 2000). These findings point out the need for
counselors to be aware that clients’ use of complementary treatments may be associated
with mental illness. As a result, several researchers have strongly recommended that
practitioners of conventional and complementary therapy increase their collaboration
5
concerning mental health care (Kessler et al., 2001; Ngoma, Prince, & Mann, 2003;
Unutzer, et al., 2000; White, 2000).
Due to cultural norms, complementary therapy may also serve as the primary
health care system for some clients (Bodeker & Kronenberg, 2002; Lee, Lin, Wrensch,
Adler, & Eisenberg, 2000; Wilkinson, 1987). In fact, the World Health Organization
(2002) reported that up to 80% of the population in several developing countries uses
traditional or complementary therapy as the primary means to meet their health care
needs. Closer to home, Brown and Segal (1996) found that African Americans residing in
North Florida were almost three times more likely to use home remedies as compared to
their white counterparts, controlling for all other factors. They also found that lower
educational level, along with having a poverty status, was a significant predictor of use,
regardless of ethnicity.
Further, Bassman and Uellendahl (2003) asserted that complementary therapy
could be “important and useful to expand treatment opportunities for those individuals,
who for reason of culture or worldview, easily accept the mind-body-spirit connection
and who may not respond to allopathic approaches” (p. 269). Other researchers have
emphasized the importance of clinicians making a conscious effort to understand the
critical role that cultural values and beliefs can play in shaping clients’ health information
seeking behaviors (Kakai, Maskarinec, Shumay, Tatsumura, & Taskai, 2003). These
cultural influences affect clients’ quality of life and, perhaps, even their survival.
Therefore, it is crucial that counselors have an awareness and working knowledge of
culturally mediated complementary therapy.
Informed consent concerns require that counselors are aware of relevant evidence
for the use of any intervention, complementary or not, and are able to assess risk-benefits
and competently discuss these options with their clients (Adams, Cohen, Eisenberg, &
Jonsen, 2002). In fact, it could be reasonably argued that counselors have an ethical
obligation to raise and discuss complementary therapies that have been shown to be
clinically efficacious.
This dilemma is further compounded by the fact that while clients are only partly
informing their health providers about their use of complementary therapy, their
providers lack accurate knowledge concerning this realm of interventions. Pollock (2001)
6
asserted that most psychotherapists, regardless of professional discipline, lack adequate
knowledge and training in complementary therapy to discuss or deliver these therapies
effectively. Further, this lack of expertise could be due in part to psychotherapists’ lack of
belief in the usefulness of these therapies, regardless of their research base. For many
psychotherapists, complementary therapy simply lies too far outside the “normal” realm
of what constitutes the practice of psychotherapy.
Presently, counselors need to be able to provide referrals for additional
psychological testing and/or a medical evaluation when necessary. Likewise, counselors
should be familiar enough with complementary therapy to provide appropriate
recommendations and referrals. Much like the interactions that regularly occur between
psychiatrists and other non-medical mental health care workers, counselors need to be in
communication with complementary therapy practitioners and have an established
referral network (Greub & McNamara, 2000).
Unfortunately, there is little guidance available for those psychotherapists who
wish to use or suggest complementary therapies for their clients in an ethical and
competent manner (Greub & McNamara, 2000). Simply keeping abreast of the far-flung
landscape that makes up complementary therapy is in itself a daunting task (Kaptchuk &
Eisenberg, 2001).
In reaction to this deficiency, there has been a recent upsurge of interest in
increasing educational opportunities for conventional health care professionals
concerning complementary therapy (Marcus, 2001; Wetzel, Kaptchuk, Haramati, &
Eisenberg, 2003). Specifically, over 82 medical schools currently offer some form of
education in complementary therapy (Wetzel, et al., 2003).
Encouragingly, psychotherapists have expressed a strong interest in knowing
more about complementary therapy (Berman, et al., 1995; Sikand & Laken, 1998;
Verhoff & Sutherland, 1995). Along the same lines, many professionals are advocating
for the integration of complementary therapy into the practice of mainstream health care
and psychotherapy (Astin, Marie, Pelletier, Hansen, & Haskel, 1998; Frenkel & Borkan,
2003; Shannon, 2002). However, there has been little movement within the clinical and
counselor education communities toward educating counselors about complementary
therapy (White, 2000).
7
In fact, a thorough review of the literature indicated there is little ongoing
research related to counseling and complementary therapy. A search for articles on
“complementary and alternative medicine and/or therapy” yielded limited citations from
the well-known counseling databases PSYCLIT and ERIC, or the ancillary databases of
Education Full-text and Sociological Abstracts. Only 20% of articles concerned with any
aspect of complementary therapy were cited in counseling related journals. Echoing this
dearth of information, several authors have recommended the mental health profession
immediately begin its own investigations related to all aspects of complementary therapy
(Bassmen & Uellendahl, 2003; Knaudt, et al., 1999; White, 2000; Yager, Siefried, &
DiMatteo, 1999).
In contrast, the medical literature is replete with articles, editorials, and reviews
dedicated to the many issues surrounding complementary therapy. A recent systematic
literature search found over 1500 article additions located in the mainstream medical
literature concerned with complementary and alternative medicine indexed per annum
(equal to 0.4% of all article additions indexed per annum) between 1986 and 1996
(Barnes, Abbot, Harkness, & Ernst, 1999).
Statement of the Problem
It has been established that: (a) clients’ use of complementary therapy has
increased to the point that it has become an important consideration in mental health care,
(b) this use is underreported, (c) counselors need to be aware and knowledgeable of their
clients’ use of complementary therapy in order to provide learned and effective
interventions, enhance cultural sensitivity, engage in competent discussions and provide
informed recommendations and referrals, (d) counselors lack adequate knowledge and
training in complementary therapy to discuss or deliver these therapies effectively, (e)
existing guidelines are inadequate for counselors who wish to use or suggest
complementary therapy for their clients in an ethical and competent manner, and (f) there
is little ongoing research related to counseling and complementary therapy.
The problem is that despite a significant increase in clients’ use of complementary
therapy over the last decade, counselors’ knowledge, training, personal and professional
experience with complementary therapy is mostly unknown. The goal of this study is to
help fill this information void.
8
Purpose of the Study
The purpose of the present study was to gather information from counselors
regarding: clients’ disclosure of complementary therapy use, recommendation and
referral patterns for complementary therapy, inclusion of complementary therapy within
clinical practice, counselors’ knowledge and training in complementary therapy and
counselors’ personal experience with complementary therapy. In addition, demographic
information was collected from respondents.
Research Questions
I. Professional Practice variables
1. What do counselors ask, and their clients disclose, concerning clients’ use of
complementary therapy?
2. What are counselors’ recommendation and referral patterns for complementary
therapy?
3. Do counselors include complementary therapy in their practice of
counseling? If so, how is it included?
II. Knowledge and training variables
4. What are counselors’ knowledge and training in complementary therapy?
III. Personal experience variables
5. What are counselors’ personal experiences with complementary therapy?
IV. Demographic variables
6. Do counselors differ across demographic variables (i.e., gender, age,
race/ethnicity, income, degree, mental health license, years practicing,
clients/week, current position, work setting, services provided, theoretical
orientation) with regards to professional practice variables, knowledge and
training variables, and personal experience variables?
Significance of the Study
The current study has importance for research, policy, education, and practice in
counseling. It begins the process of understanding the experiences of counselors with
regard to complementary therapy. This research supports the counseling profession in
furthering its commitment to mental health from a holistic perspective of wellness across
the lifespan.
9
Specifically, this study will help facilitate an increase in counselors’ awareness of
the need to be knowledgeable of clients’ use of complementary therapy, enhance
sensitivity to the cultural context of complementary therapy, and highlight the importance
of being able to engage in competent discussions and provide informed recommendations
and referrals. In addition, counselor education programs may wish to use this information
to develop and enhance curricula to more accurately reflect changing paradigms, as
manifest in the “real world” of counseling practice.
Most importantly, the present study offers support to the counseling profession as
it strives to honor its holistic roots in the midst of the currently restrictive environment of
managed health care. Finally, as this field of research is still relatively new, the present
study will hopefully provide both inspiration and support for future counseling
researchers.
Methodology
This was an exploratory survey of mental health counselors utilizing a web-based
survey methodology. The survey sample included individuals who were members of the
American Counseling Association (ACA) and who volunteered to complete the web-
based survey. Therefore, all respondents were required to have an email address and
access to the Internet.
The survey instrument was designed based on a thorough review of the literature,
extensive feedback from committee members and a pilot study of the instrument. The
resulting survey was posted on a designated Virginia Tech server and made available for
approximately three weeks to respondents. Implementation of the survey closely
followed the proven Tailored Design Method developed by Dillman (2000).
The survey addressed four specific areas of interest, including, professional
practice, knowledge and training, personal experience and demographic variables. Data
analysis and reporting included computing descriptive statistics for each area of interest
and investigation of associations between variables.
Definition of Terms
Allopathic medicine – also called Conventional medicine. Refers to the Western,
biologically-based, mainstream practice of medicine that focuses on disease processes
and subsequently employs interventions to combat them (Muehsam, Eskinazi, Park, &
10
Daly, 1997). Interventions within allopathic medicine may be roughly grouped into the
categories of medication and surgery.
Alternative therapy – operationally speaking, alternative therapy refers to interventions
used as a substitute or complete alternative to conventional health care (Trachtenberg,
2002).
Complementary therapy – operationally speaking, complementary therapy refers to
interventions used as an adjunct to conventional health care (Trachtenberg, 2002).
Conventional healthcare – the generally acknowledged practices of the dominant health
care model (Eisenberg, et al., 1998). Weil (1997) proposed that orthodox health care
represented a more accurate definition.
Integrative healthcare – refers to a holistic approach in which the patient, not the disease,
is the focus of the healing practice (Diamond, 2001). The clients’ physical, mental and
spiritual well being are all given attention in order to realize the greatest healing possible
(which does not necessarily correlate with a cure). Integrative medicine is also used to
describe the practice of combining conventional and complementary approaches.
Counselor – relative to this study, refers to any individual who classified themselves as a
counselor, regardless of employment setting or client population (i.e., school, community
agency, private practice, student, etc.). Counselors are further defined as those
respondents who currently possess or are in the process of obtaining the educational and
experiential requirements for licensure as a counselor in their state or jurisdiction.
Traditional healthcare – used to denote the indigenous health practices of the world
(World Health Organization, 2002).
Unconventional healthcare – an umbrella term, used to refer to alternative and/or
complementary therapies (Trachtenberg, 2002).
Delimitations and Limitations
The present study was designed to be exploratory in nature. Therefore, it was not
expected to provide definitive answers to the current issues surrounding counseling and
complementary therapy. Rather, the goal was to provide a baseline of data to guide future
research.
At present, web-based survey research methodology is still considered limited
with regards to generalizability (Dillman, 2000). For that reason, the results of this study
11
cannot be considered representative of the general population of counselors. However,
the sampling approach may provide representation of a specific subset of counselors (i.e.,
counselors who are members of ACA, with an email address and access to the Internet)
(Kaye & Johnson, 1999). It was also assumed that those counselors who responded have
at least a passing interest in complementary therapy.
Summary
Chapter One began with an introduction to complementary therapy and its
significance for the counseling profession. Rationales for the study were then discussed.
These revolved around the importance of counselors being aware and knowledgeable of
their clients’ use of complementary therapy in order to provide learned and effective
interventions, enhance sensitivity to cultural issues, engage in informed and competent
discussions, and provide knowledgeable recommendations and referrals for
complementary therapy.
The statement of the problem noted that there has been little, if any, research
concerning clients’ disclosure of complementary therapy use, counselors’
recommendation and referral patterns for complementary therapy, inclusion of
complementary therapy within the practice of counseling, counselors’ knowledge and
training in complementary therapy, and counselors’ personal use of complementary
therapy. Four specific areas of interest to be researched were outlined, including,
professional practice variables, knowledge and training variables, personal experience
variables and demographic variables. Next, an overview of research methodology was
presented. Definitions of crucial terms were provided. Finally, limitations and
delimitations were discussed.
12
CHAPTER TWO
REVIEW OF THE LITERATURE
High utilization rates, underreported usage, as well as a growing body of evidence
indicating the effectiveness of some complementary therapies for mental health related
problems, all call for a response from the counseling profession on the role of
complementary therapy. White (2000) cautioned that the field of psychology has done
little to explore this connection, despite the fact that complementary therapies usually
care for the mind, as well as the body. If this reproof holds true for psychology, then the
paucity of counseling literature related to complementary therapy highlights an even
greater need for counselors to investigate the opportunities and challenges surrounding
complementary therapy within their distinct domain.
As pointed out in chapter one, the medical profession has conducted the majority
of research on complementary therapy to date. Underscoring the importance given to this
area of health care, the American Medical Association recently devoted an entire issue of
its preeminent journal to complementary medicine (Fontanarosa & Lundberg, 1998b).
While there are some extant guidelines regarding complementary therapy and mental
health care, these are limited in scope. Expanding on White’s (2000) recommendations
for psychologists, the counseling profession needs to develop, “mechanisms for
educators, students, researchers and practitioners to investigate CAM [complementary
and alternative medicine/therapy] in an unbiased manner as these fields relate to all
aspects of [counseling]” (p. 679; emphasis added).
In this spirit, chapter two investigates several areas of the literature related to
complementary therapy. First, a look at the changing paradigm of mental health care,
which underlies the increased interest in complementary therapy, provides a context for
discussions specific to counseling and complementary therapy. Next, a brief overview of
efforts to define and categorize the diverse spectrum of complementary therapy is
offered. Then, given the rapid growth in popularity of complementary therapy, an
overview of utilization trends is presented. A discussion of the experiences of mental
health consumers with complementary therapy gives insights into the variety of meanings
and functions these interventions can hold for counseling clients. Included is research on
mental health consumers’ usage of complementary therapy, as well as a discussion of
13
caregivers’ perceptions of this use. Then, a review of the emergent roles of mental health
care providers regarding complementary therapy is offered. This includes discussion of
referral, recommendation and inclusion issues surrounding complementary therapy. The
literature concerning education and training in complementary therapy is reviewed.
Finally, insights into psychotherapists’ knowledge and personal experience with
complementary therapy are discussed. Multicultural, legal, and ethical concerns are
included as appropriate.
The Shifting Paradigm of Complementary Therapy
“Cogito ergo sum – I think, therefore I am”. With this indubitable proposition,
René Descartes defined the dualism of mind and body for the next three centuries of
Western thought. To make the matter even more fractious, Descartes was not referring to
a mere superficial division between the material (body) and the non-material (mind) 0
1, he
insisted that, for all intents and purposes, they have little or no interaction (Earle, 1992).
Demasio (1994) makes this point clear:
This is Descartes’ error: the abyssal separation between body and mind, between the sizable, dimensioned, mechanically operated, infinitely divisible, body stuff, on the one hand, and the unsizable, undimensioned, un-pushpullable, nondivisible mind stuff; the suggestion that reasoning, and moral judgement, and the suffering that come from physical pain or emotional upheaval might exist separately from the body. Specifically, the separation of the most refined operations of the mind from the structure and operation of a biological organism. (pp. 249-50)
This argument for the separation of mind from body is often called
“Cartesianism”. Its tenets can be summarized as follows: “I can think; Bodies cannot
think – Therefore, I am not a body”, and “I cannot doubt that I have a mind (… that is,
something that thinks…); I can doubt that I have a body – Therefore, my mind and body
are not identical” (Earle, 1992, p. 104).
Wilber (1991) asserted that the separation of mind and body is fundamental to Western
culture. Until recently, this perspective has contributed to a dearth of holistic ideas about
human functioning.
1Descartes used the term res cogitans meaning “thinking thing” to describe the mind, in contrast with res extensa or “extended thing” to describe the body.
14
Effects of Dualism
An unfortunate outcome of Cartesian dualism is that it leaves little room for
integration and wholeness in trying to heal the mind or the body. If, as Descartes
believed, the body is nothing but an automat-on/ic, matter-based, mechanism (Berman,
1990), then its influence on healing (or hindering) the mind is irrelevant. In other words,
the mind is treated and/or the body is treated, but they do not affect one another. That is,
the cure of the mind (or body) is possible only by way of its (already sick) self.
Therefore, any sensory evidence of the body is suspect and seen to have little value in
engendering psychological (i.e., mind) change (Berman). So, today we generally have a
dichotomy between those that define themselves as doctors of the “mind” and others that
consider themselves to be doctors of the “body” (Schlesinger & Appelbaum, 2000).
Brown (2002) aptly defined the schism resulting from the encapsulation of fundamentally
different paradigms as “conceptual apartheid”.
Candace Pert (1997) offered a concise summary of the effect of a dualistic
“mindset” on the culture at large - and, thereby science (including, the relatively young
science of psychology). She made the assertion that our culture is in a state of denial
about the psychosomatic nature of many illnesses. The fact that the word
“psychosomatic” consists of a fusion of psyche (literally “soul”) and soma (or body) is
beside the point. For the majority of our culture, and positively for most of the scientific
community, “bringing the mind too close to the body threatens the legitimacy of any
particular illness, suggesting it may be imaginary, unreal, unscientific” (Pert, p.18;
emphasis added).
Further, if the contribution of the psyche to physical health is suspect, the
possibility that the literal interpretation of psyche as “soul” may be of any consequence to
health and healing smacks of mysticism, a place “where scientists have been forbidden to
tread ever since the seventeenth century” (Pert, 1997, p. 18). She continues:
It was then that René Descartes, the philosopher and [significantly, considered] one of the founding fathers of modern medicine, was forced to make a turf deal with the Pope in order to get the human bodies that he needed for dissection. Descartes agreed that he wouldn’t have anything to do with the soul, the mind, or the emotions – those aspects of human experience under the virtually exclusive jurisdiction of the church at the time – if he could claim the physical realm as his own. Alas, this bargain set the tone and direction for Western science over the
15
next two centuries, dividing human experience into two distinct and separate spheres that could never overlap, creating the unbalanced situation that is mainstream science as we know it today. (p. 18)
So, psychology in its quest for legitimacy and purpose, and being a nascent area
of study at the turn of the century, found itself logically embracing this mechanistic,
dualistic paradigm (Schaef, 1992). Inevitably, this prevailing climate strongly influenced
the development of Freud’s psychological theories that incorporated an almost exclusive
emphasis on mental processes. This outlook still resounds within the halls of psychology
(and counselor) education and practice. As a result, “this dualistic conception of human
nature became firmly entrenched in contemporary psychological theory” (Rappaport,
1975, p. 49).
It has been asserted that psychotherapists have unconsciously “embodied” these
cultural norms/paradigms into their own selves and practice of therapy. “We consider
ourselves - and others deem us – professionals who have opted for a quiet, reflective,
contemplative life in the head, not for a lot of physical exertion or athletic prowess”
(Miller, 2000, p. 442).
Paradigms “Shift”
Fortunately, through accumulating scientific advances in fields such as
psychoneuroimmunology, there has been a gradual transformation in opinions regarding
the possibility that realms of the mind affect realms of the body, and vice versa (Murphy,
1992; Pert, 1997). This mind-body connection has been documented in depth and has
contributed to a greater understanding of the truly unitive nature of the psyche and soma
(Benson, 1996; Borysenko, 1988; Ford, 1989; Kabat-Zinn, 1990; Pelletier, 1977; Rossi,
1986).
There remains little doubt at this point of the relationship between the state of
health of the mind and that of the body. As Damsio (1994) aptly puts it, “… the body
contributes more than life support and modulatory effects to the brain. It contributes a
content that is part and parcel of the workings of the normal mind” (p. 226; emphasis
added).
16
The field of neuroscience has also made significant contributions to building a
bridge between old and new paradigms of health care. Specific to mental health,
Winkelman (2002) documented the psychobiological effects of shamanism in terms of
brain functioning, socio-cultural manifestations and the psychological correlates of
altered states of consciousness as adaptive potentials for wholeness and wellness. Simply
put, mental health is influenced by biological, social, cultural, psychological and spiritual
processes. Therefore, to be well involves accessing multiple modes of healing which, by
necessity, include complementary therapy approaches.
Further support for changing paradigms comes from research, which found that
neural activity following treatment for Obsessive Compulsive Disorder (OCD) was
essentially identical regardless of whether the intervention was of a cognitive-behavioral
or pharmaceutical nature (Brown, 2002). Perhaps even more relevant to counseling, is the
well-researched connection between physical activity (i.e., body) and an improvement in
depressive symptoms (i.e., mind) (Hayes, 1999; Herman, et al., 2000).
Authors writing for the counseling field have argued that there has been a shift in
worldview for counselors, paralleling the changing paradigms of conventional health care
(Granello, 2000; McAuliffe & Eriksen, 1999). This “new” counseling worldview
conceptualizes the existence of a fundamental unity of mind and body, and acknowledges
that psychological factors play a role in the etiology and course of physical disease and
vice versa (White, 2000). Within this paradigm, the multiple dimensions of biological,
cultural, spiritual, social, and psychological interact and influence mental health (Roberts,
Kiselica, & Fredrickson, 2002). Over a decade ago, Witmer and Sweeney (1992)
extended this interaction among factors to include the far-reaching concept of “cosmic
consciousness”, which focused on the connections among all things.
Most importantly for counselors is “the fact that the emerging paradigm in health
care stresses prevention, early intervention and alternative methods of remediation –
strategies that are in the purview of skills of professionals in our field” (Myers, Sweeney,
& Witmer, 2000, p. 251; emphasis added). For example, in outlining their program for
incorporating a wellness model in a violence prevention program for adolescents,
Makinson and Myers (2003) emphasized that a holistic paradigm, which by definition,
includes complementary therapy, can be effective in all aspects of counseling.
17
This all sounds like Eastern approaches to healing, which embrace a harmonious,
balanced relationship between nature and wo/man; mind and body (Teeguarden, 1987).
For example, in the Taoist view, there is an inherent unity between wo/man and nature. A
life well lived is one that follows the natural cycles and patterns of life, without trying to
force or coerce life to meet “perceived” needs. Nature can be trusted to support growth,
but not to prevent suffering.
As the great sage Lao Tzu once said,
“The right way to go easy
Is to forget the right way
And forget that the going is easy”
(Merton, 1965, p. 104).
These ancient sages, Western and Eastern, knew how to properly embrace the
inherent wholeness that is our birthright. They understood that experience could be
trusted (Teeguarden, 1987). They grasped (without grasping) that the wisdom of the mind
and body are inextricably linked – are in fact, one and the same.
Definitions and Categories of Complementary Therapy
Many definitions and categories have been proposed for complementary therapy.
However, due to rapid changes throughout society and consequently, the health care
industry, attempts to define complementary therapy are currently in a state of flux
(Bassman & Uellendahl, 2003; Trachtenberg, 2002). Efforts at defining complementary
and alternative therapy have ranged from what it is not (Eisenberg, et al., 1993), to a
variety of definitions and categories of complementary therapy (Chez & Jonas, 1997;
Health Canada, 2001; Kaptchuk & Eisenberg, 2001; National Center for Complementary
and Alternative Medicine, 2002; Shannon, 2002).
With regard to counseling, complementary therapy was defined earlier as
“interventions outside of mainstream psychotherapy or medical practice” (Bassman &
Uellendahl, 2003, p. 264). Ironically, psychotherapy itself was, and occasionally still is,
considered to be “complementary” in nature.
An early functional definition of complementary therapy was “those interventions
neither widely taught in medical schools nor generally available in US hospitals”
(Eisenberg, et al., 1993, p. 247). This definition is now outdated, since the majority of
18
medical schools incorporate some education on complementary therapy in their
curriculum. Others have argued that there is no such thing as complementary medicine,
only “scientifically proven, evidence-based medicine, … or unproven medicine, for
which evidence is lacking” (Fontanarosa & Lundberg, 1998a, p. 1618).
A more comprehensive definition was proposed by Eskinazi (1998), who
described alternative medicine as a, “broad set of health care practices not readily
integrated into the dominant health care model, because they pose challenges to diverse
societal beliefs and practices (cultural, economic, scientific, medical, and educational)”
(p. 1622). In concurring, Astin, et al. (1998) asserted that CAM is largely a political term
and, as such, what is considered alternative is likely to change over time. Along the same
lines, Berman, et al., (1995) reported that areas where physicians had the least amount of
training were considered the most alternative (or complementary) by them.
Similar to attempts to “define” complementary therapy, classification schemes
have also been fraught with controversy. Some have argued that any system of
classification should be precise and avoid the use of general terms (e.g., movement,
healing) to distinguish among groups of interventions (Astin, et al., 1998). This is
because interventions considered complementary will continue to change over time.
Nevertheless, several authors have attempted to outline a taxonomy of complementary
therapies (Chez & Jonas, 1997; Health Canada, 2001; Kaptchuk & Eisenberg, 2001;
National Center for Complementary and Alternative Medicine, 2002; Shannon, 2002).
Kaptchuk and Eisenberg (2001) delineated between two types of complementary
interventions, those that appeal to the general public and interventions that confine
themselves to a particular ethnic or religious group. Accordingly, their taxonomy reflects
this bifurcation by assigning interventions to either a secular or parochial grouping.
Several authors have proposed classification schemes for complementary
therapies, which are generally equivalent (Chez & Jonas, 1997; Health Canada, 2001;
National Center for Complementary and Alternative Medicine, 2002; Shannon, 2002).
The taxonomy of complementary therapy proposed by the National Center for
Complementary and Alternative Medicine serves as an exemplar for our purposes. This
classification system consists of five major domains:
19
1) Alternative medical systems - Acupuncture, Ayurveda, herbal medicine,
Homeopathic medicine, and Naturopathic medicine.
2) Mind-Body interventions – breathwork, meditation, prayer, mental healing, mental
imagery, Yoga, and the art, music and dance therapies.
3) Biologically based therapies – aromatherapy, herbs, food, and vitamins.
4) Manipulative and body-based methods – applied kinesiology, chiropractic,
massage, and exercise.
5) Energy therapies – Healing/Therapeutic touch, Qigong, Reiki, and magnetic
therapy.
The examples given are not all-inclusive and are all subject, more or less, to
becoming “mainstreamed”, hence non-complementary, at some point in the future.
Utilization Trends in Complementary Therapy
In a seminal series of studies, Eisenberg, et al. (1993, 1998), first documented the
enormous interest in and consumption of complementary therapy by the general public.
They found that the use of complementary therapy nationwide increased from 34% to
42% between 1990 and 1997. “Conservative” estimates of expenditures on
complementary therapy in 1997 were $21.2 billion, more than twice the amount ($9.1
billion) spent on all US hospitalizations that same year. In addition, Americans made an
estimated 629 million visits to complementary therapy practitioners versus 386 million
visits to all primary care physicians in 1997. There was also a 46% probability of having
visited a complementary therapy practitioner in 1997.
Certain demographic factors have been consistently associated with the use of
complementary therapy. There were positive correlations across several large group
studies, in which being female, Caucasian, ages 35 to 64, living in the Western part of the
US, having a higher socioeconomic status and being college educated were associated
with greater use of complementary therapy (Astin, 1998; Eisenberg, et al., 1993, 1998;
Paramor, 1996; Unutzer et al., 2000).
The most common health-related reasons cited by clients for use of
complementary therapy were anxiety and depression, followed by headaches, and chronic
pain, especially neck and back problems (Bausel, Lee, & Berman, 2001; Eisenberg, et al.,
1993, 1998; Kessler, et al., 2001; Unutzer et al., 2000). Broadly speaking, clients using
20
complementary therapy have been found to possess poorer health status, have
experienced long-term, chronic conditions that affect daily life and are more frequent
consumers of conventional health care (Kelner & Wellman, 1997; Richardson, Sanders,
Palmer, Greisinger, & Singletary, 2000).
From a more philosophical perspective, users of complementary therapy were
classified as belonging to cultural groups committed to the tenants of environmentalism,
feminism, personal growth and spirituality (Astin, 1998). Kelner and Wellman (1997)
termed this viewpoint an “alternative therapy ideology”.
In addition, those clients who consulted with a complementary therapy
practitioner tended to remain loyal to their provider, have a strong belief in the efficacy of
the treatment, hold a higher “health consciousness” and were likely to have relied on a
personal referral from someone they knew and trusted (Furnham & Forey, 1994).
Surprisingly, dissatisfaction with conventional health care was not a predictor of greater
use of complementary therapy (Eisenberg, et al., 2001).
Mental Health Consumers’ Experiences with Complementary Therapy
Use of complementary therapy by consumers of mental health is even more
salient. Kessler, et al. (2001) reported that a total of 56.7% of respondents with anxiety
disorder and 53.6% with severe depression reported using complementary therapy to treat
these conditions within the past year. When these consumers were simultaneously seeing
a conventional practitioner, the probability of using complementary therapy for care of
anxiety disorder or severe depression increased to 65.9% and 66.7%, respectively.
However, their most striking finding was that close to nine out of ten patients with self-
defined anxiety attacks, who were seeing a psychiatrist, were also pursuing
complementary therapy (this ratio was more than six out of ten for depression).
Similarly, Unutzer, et al. (2000) found that respondents who met the criteria for major
depression and panic disorder were more likely to report use of complementary therapy.
Finally, Druss and Rosenheck (2000) reported that the mental health care consumers they
surveyed with an adjustment disorder had the highest prevalence of complementary
therapy use. Given these findings, it is clear that consumers are using complementary
therapies on a regular basis to treat commonly occurring mental illnesses.
21
The choice of a specific complementary therapy appears to be at least partially
dependent on the presenting mental health concern. For example, among a select sample
of consumers with a range of anxiety disorders, the two most popular complementary
therapies were hypnotherapy and self-help therapy, accounting for 44% of responses
(Graham, Franses, Kenwright, & Marks, 2001). Kessler, et al. (2001) found a similar
pattern of complementary therapy use for treatment of self-defined anxiety attacks or
severe depression among their survey participants. These were (in order of decreasing
popularity), cognitive feedback interventions (e.g., relaxation techniques, imagery),
“other” therapies (e.g., spiritual healing by others, dietary changes), physical treatments
(e.g., massage, acupuncture, Yoga) and oral medications (e.g., herbs, megavitamins,
homeopathy). In addition, Knaudt, et al. (1999) reported that herbal/homeopathic
remedies and meditation/spiritual activities were by far the most popular complementary
therapies used in the previous year by psychiatric outpatients primarily diagnosed with
anxiety disorders or major depression. Finally, among patients with adjustment disorders,
herbal remedies were the most commonly used complementary therapy (Druss &
Rosenheck, 2000).
From a broader perspective, O’Mathuna (2001) asserted that the increased interest
in complementary therapy is at least partially addressing the Western thirst for
spirituality, not just obvious health concerns. Furthermore, conventional practitioners
often ignore complex effects that are part of the healing process. Therefore, for many
clients, their search through the complementary therapy landscape for healing is rooted in
an existential search for meaning. As Yamey (2000) aptly puts it, “this huge demand
suggests that it [complementary therapy] offers something of value that is not provided
by orthodox medicine” (p. 5). Of import here is that many well-known theories and
schools of psychotherapy have been established in response to existential concerns – this
“something” of value (Bankart, 1997).
Using this framework as a starting point, reasons given by mental health
consumers for their use of complementary therapy are of special interest to counselors.
Knaudt, et al. (1999) found that greatest perceived advantages of complementary therapy
over conventional treatment were (from most to least advantage) the “natural” aspect of
interventions, fewer side effects, greater effectiveness, not requiring involvement of a
22
health professional, less expense and greater control. Cited disadvantages were that
interventions were perceived as not scientifically proven and less effective. Interestingly,
potential side effects or being too expensive were not cited as disadvantages.
Other reasons given for the attraction of complementary therapy included greater
time with complementary therapy practitioners, continuity of treatment, attention to
personality and unique experience, client involvement and choice in treatment,
instillation of hope, “high touch”, ability of practitioner to work with ill-defined
symptoms and explanations of illness that made sense (Zollman & Vickers, 1999). In
general, consumers of complementary therapy perceived them to be more helpful than
conventional care, especially for chronic, persistent, and debilitating conditions (Astin,
1988; Eisenberg, et al., 2001). In addition, up to 89% of users of complementary therapy
for mental illness reported feeling at least “a little better” as a result (Knaudt, et al.,
1999). These client motives are important and relevant issues for every counselor,
regardless of their individual experiences or beliefs surrounding complementary therapy.
A related area of concern was the significant discrepancy between clients’ use of
complementary therapy and health care providers’ perceptions of this use. Overall, less
than 40% of all users of complementary therapy informed their caregiver of this fact
(Eisenberg, et al., 1993, 1998). Baumrucker (2002) related that oncologists tended to
“wildly underestimate” their patients’ usage of complementary therapies to illustrate how
physicians are mostly oblivious to their patients’ health care practices. Caveat emptor -
being oblivious is definitely not considered a necessary and sufficient condition of
therapeutic personality change (Rogers, 1957).
Specific to mental health consumers, the percentage of clients who disclosed their
use of alternative therapy was slightly higher, but still just over 50% (Knaudt, et al.,
1999). In contrast to physicians, counselors’ perceptions of their clients’ use of
complementary therapy is unknown.
Based on these findings, White (2000) recommended that psychologists become
proactive about inquiring into their clients’ use of complementary therapy. She also
encouraged therapists to support their clients in reporting their use of complementary
therapy to their medical caregiver, as well as informing their complementary practitioner
of all other treatments.
23
Several sources have outlined procedural steps to insure that health care providers
begin a conversation with their clients concerning complementary therapy (American
Academy of Pediatrics, Committee on Children with Disabilities, 2001; Eisenberg, et al.,
1998; Yager, et al., 1999). In fact, Haller (2001) recommends that practitioners always
ask clients about possible use of complementary therapy. Certainly, these
recommendations are equally applicable to counselors.
The Emergent Role of Counselors and Complementary Therapy
Counselors are just beginning to gain an awareness of the various issues
surrounding counseling and complementary therapy. Not surprisingly, counselors have
conducted little research into complementary therapy. However, there is a diverse and
growing quantity of literature related to the use of complementary therapies for mental
health care (Beaubrun & Gray, 2000; Findling, Feeny, Stansbrey, DelPorto-Bedoya, &
Demeter, 2002; Graham, et al., 2001; Kessler, et al., 2001; Knaudt, et al., 1999; Schaffer,
LaSalvia, & Stein, 1997; Yager, et al., 1999). However, this research is generally by, and
for, the psychiatric profession and, as a result, published almost exclusively in medical
journals. Researchers have called for more psychotherapists to incorporate research
concerning complementary therapy into their work (Bassmen & Uellendahl, 2003;
Shannon, 2002; White, 2000).
In the interim, a small, but significant body of knowledge suggests that
complementary therapy offers effective interventions for certain psychological problems
(Greub & McNamara, 2000). For example, there have been greater than 1000 trials over a
25-year period concerning the efficacy of exercise in the management of depression
(Ernst, et al., 1998). The research in this area forms a compelling argument that exercise
should be a viable first-line treatment for mild to moderate depression. Despite these
findings, few psychotherapists have integrated exercise into their treatment regimen for
those clients most likely to benefit (Pollock, 2001).
In addition, Miller (1996) discussed the “substantive and compelling” research
concerning the relationship between diet and mental illness and health. This author also
decried the lack of existing clinical protocols addressing the integration of dietary factors
into mental health treatment.
24
Along the same lines, the medical profession has already begun to investigate
referral patterns for complementary therapy (Astin, et al., 1998; Berman, Bausell,
Hartnoll, Beckner, & Bareta, 1999; Frenkel & Borkan, 2003; Sikand & Laken, 1998).
Overall, more than half of surveyed physicians were willing to refer their clients to a
complementary practitioner (Sikand & Laken). In addition, willingness to refer was
found to be strongest for clients suffering from chronic conditions. Still, significant
concern is generated by reports of the ongoing fragmentation in care between
conventional and complementary practitioners (Mainous, Gill, Zoller, & Wollman, 2000).
Greub & McNamara (2000) offered helpful professional guidelines concerning
consulting with a physician when employing complementary therapies in a psychological
setting. However, additional information is needed concerning counselors’ referral and
recommendation patterns for complementary therapy in order to develop guidelines
specific to counselors.
The medical literature also addresses ethical and legal issues regarding referrals
for complementary therapy (Adams, et al., 2002; Studdert, et al., 1998). The good news is
that physicians are unlikely to be held liable for a referral to a complementary therapy
practitioner gone awry – if, they refer to credentialed practitioners (Cohen & Eisenberg,
2002). Unfortunately, counselors appear to operate without professional awareness and
guidance concerning complementary therapy referrals (Greub & McNamara, 2000).
Inclusion of complementary therapy into psychotherapy is also a salient issue for
counselors. In fact, the integration of divergent psychotherapeutic traditions remains a
long-standing concern for the counseling profession (Fear & Woolfe, 1996).
Regrettably, neither the medical community nor the counseling profession have
conducted much research on the inclusion of complementary therapy in practice. One
relevant article from West (1997), documents the experiences of counselors in the U.K.,
whose work also included healing. Not surprisingly, the majority of the counselors
studied found their attempts at inclusion extremely challenging due to lack of
professional support and supervision in this area.
Training and Education in Complementary Therapy
There has been a great deal of debate in the medical community concerning the
need (or not) for integration of complementary therapy into mainstream systems of care
25
(Caspi, Bell, Rychener, Gaudet, & Weil, 2000; Grollman, 2001; Marcus, 2001; Owen,
Lewith, & Stephens, 2001; Wetzel, Eisenberg, & Kaptchuk, 1998; Wetzel, et al., 2003).
Despite this controversy, most medical schools now include some form of training in
complementary therapy for their students (Bhattacharya, 2000; Wetzel, et al.). However,
this training is usually ancillary to the conventional biomedical curriculum and of
dubious value for actually practicing any form of complementary therapy (Wetzel, et al.).
Indeed, the American Academy of Pediatrics noted this lack of expertise and
concluded that pediatricians’ training in biomedicine may not adequately prepare them
for discussion of complementary therapies (American Academy of Pediatrics, Committee
on Children with Disabilities, 2001). Furthermore, the vast majority of nurses in a recent
study perceived their preparation in this area to be fair or poor (Brolinson, Price, Ditmyer
& Reis, 2001). Counselors’ perceptions of readiness regarding various aspects of
complementary therapy remain unexplored.
Finally, Burg, Kosch, Neims, and Stoller (1998) reported that more than half of
the faculty they surveyed at a major health science center engaged in the personal use of
at least one type of complementary therapy. Interestingly, personal or familial use of a
complementary therapy has been associated with higher referral rates for complementary
therapy (Borkan, Neher, Anson, & Smoker, 1994). However, counselors’ personal
experiences with complementary therapy are unknown.
Summary
Chapter Two began with an overview of research issues for the counseling
profession regarding complementary therapy. First, the shifting paradigm of mental
health care was discussed. Next, the literature surrounding definitions and categories of
complementary therapy was reviewed. Then, utilization trends in complementary therapy
were discussed to provide a background for this recent, but important phenomenon.
Specific coverage was given to the literature referencing mental health consumers’
experiences with complementary therapy. The literature addressing the emergent roles of
counselors and complementary therapy followed. Training and education issues for
counselors were then discussed. Finally, consideration of counselors’ personal
experiences with complementary therapy concluded the literature review.
26
CHAPTER THREE
METHODOLOGY
The current research study investigated the experiences of counselors concerning
complementary therapy. Due to the deficiency of existing information, this study was
designed to be exploratory in nature.
This study is important, as there has been little research to date, which specifically
addresses counselors’ experiences with complementary therapy. This information is
expected to add to the current knowledge base, as well as provide impetus for further
research regarding counseling and complementary therapy.
Web-based Survey Research
The social sciences have recently experienced an explosion in the use of the
Internet (i.e., web-based) for survey research (White, Carey, & Dailey, 2001). The
potential to reach a vast population of groups and individuals, while spanning
geographical and social borders, has clearly changed the nature of conducting survey
research (Coomber, 1997).
Harris and Dersch (1999) posited that the use of the Internet as a research medium
is in line with the transition to a postmodern paradigm of scientific inquiry. Under
postmodernism, the concept of what constitutes research expands (Gergen
& Thatchenkery, 1996). Within this model, arbitrary empiricism is deemphasized, while
cultural factors governing the production and interpretation of data gains primacy.
Further, the particular research methodology is seen as less important as an arbiter of
“truth”. In other words, as geographical and social barriers become blurred through the
medium of the Internet, there is a greater likelihood of data reflecting a broader
worldview (i.e., paradigm). Specific to this study, it seems appropriate to employ a
postmodern approach to survey a paradigm shift in counseling.
Researchers selecting a web-based approach for obtaining survey data can expect
to deal with a unique set of issues, due in large part to the dynamic nature of the Internet
itself. Knowledge of these issues is critical in order to obtain reliable data, while realizing
the Internet’s potential as a fast, efficient and cost-effective research tool (Houston &
Fiore, 1998; Kaye & Johnson, 1999). Because of the problems inherent in online
27
research, most notably sampling concerns, the promise of the Internet as a survey
methodology often remains unrealized (Dillman, 2000).
Several researchers have offered perspectives on the use of the Internet for
conducting surveys (Dillman, 2000; Harris & Dersch, 1999; Houston & Fiore, 1998;
Katz, Rice, & Aspden, 2001; Kehow & Pitkow, 1996; Sills & Song, 2002; Smith, 1997;
Truell, Bartlett, & Alexander, 2002). The relative advantages and disadvantages of web-
based survey approaches is used to offer a balanced viewpoint.
Potential advantages of using the Internet for web-based survey research are:
1. The Internet is unparalleled in terms of accessibility of data. Geographical (and
some) social barriers are of little consequence (i.e., the computer does not “care”
where the data comes from, its main concern is that proper communication
protocols are followed) (Houston & Fiore, 1998; Turner & Turner, 1998).
2. The Internet offers the potential for a drastic reduction in the close relationship
between sample size and survey costs (Dillman, 2000). Once the initial costs of
creating the survey are accomplished, the expense for each additional survey is
significantly less than for any other survey method (Kehoe & Pitkow, 1996).
3. In some cases, it is possible to survey entire populations, thus eliminating or
ameliorating many concerns about the coverage and representativeness of the
sample (i.e., sampling error) (Sills & Song, 2002). One common compromise
employed by researchers is the use of oversampling to lend more credibility to a
non-random sample (Kehoe & Pitkow, 1996).
4. The design flexibility of web-based surveys far exceeds those of any other survey
environment (Dillman, 2000; Sills & Song, 2002). As a result, survey designs can
allow for much greater interaction between the questionnaire and the respondent.
In addition, multimedia capabilities can further enhance the range of survey
options (e.g., audio, video).
5. Distribution and response times for web-based surveys are significantly shorter
than for traditional means of surveying (i.e., telephone, in-person). This time is
measured in days, or even hours, instead of weeks (Dillman, 2000).
6. Ease of data cleaning and analysis is enhanced with web-based surveys. Advances
in survey software means collected data can often be prepared for analysis
28
without a single minute of researcher intervention (White, et al., 2001). For
example, the use of a web-based survey technology, such as software filtering,
can reduce errors due to entry of erroneous or unacceptable data (Houston &
Fiore, 1998). This reduces the possibility of errors resulting from manual cleaning
of pre-analysis data.
7. Web-based surveys may result in more extensive and candid response quality
(Bachmann, Elfrink, & Vazzana, 1996). For some people, the ability to type in a
quick response instead of the having to meet the requirements for a hand-written
response may produce higher quality data. In addition, the perception of increased
anonymity with computerized surveys may enhance data quality (Houston &
Fiore, 1998).
On the other hand, potential disadvantages of using the Internet for web-based survey
research are:
1. Sampling issues abound with web-based surveys. Many households still do not
own or have access to a computer connected to the Internet (Dillman, 2000;
Kehoe & Pitkow, 1996). Coverage error may result as not every potential member
of a survey population has an equal chance of being selected for the sample.
Specifically, without access to the Internet, someone has a zero chance of
selection. This results in non-random (thus non-generalizable) sampling outcomes
for many web-based surveys. An exception would be the case where each
member of a sample frame has an equal probability of being selected (e.g.,
surveying employees of a company who are all issued an email account).
2. In addition, there is no current national listing of email addresses approximating
those in existence for telephone numbers (Sills & Song, 2002). Even when email
lists do exist for “closed”, finite populations (i.e., members of an organization
with email addresses) these lists quickly become obsolete, as email addresses are
prone to rapid change. This phenomenon has resulted in reports of returned or
“bounced” emails as high as 28% (Smith, 1997).
3. Low response rates are another common drawback of web-based surveys. To
date, methods have not been fully articulated, which consistently achieve rates
comparable to those for mail surveys (Duffy, 2002; Schaefer & Dillman, 1998).
29
Notable are reports of substantial increases in nonresponse rates for web-based
surveys (as with all types of surveys) in recent years (Cook, Heath, & Thompson,
2000). This may be due in part to increases in the incidences (and perceptions) of
spamming and junk mail (Sheehan & Hoy, 1999; Sills & Song, 2002).
4. Self-selection of respondents can increase bias in web-based surveys (Houston &
Fiore, 1998). Only those respondents with access to the Internet are eligible to
complete the survey. In addition, respondents must posses at least a reasonable
amount of technical understanding to access and complete the survey (Smith,
1997). Specifically, selection bias is related to depictions of typical web-based
survey respondents as educated, white males, 26 to 30 years old (Kehoe &
Pitkow, 1996).
5. Technological issues with deployment also confound web-based survey
implementation (Sills & Song, 2002). Transmission rates and questionnaire image
quality are interrelated concerns for all survey designers (Dillman, 2000). In
practice, not every user will necessarily have the technology to easily access a
web-based survey, especially if it employs multimedia elements, such as video
clips. In addition, there are no guarantees that all software and hardware
variations can be accounted for by designers to insure adequate access to the
survey (White, et al., 2001). Harris and Dersch (1999) cautioned web-based
survey designers to work as if all users are “thin clients” - that is, possess the
minimum of computer resources.
6. Other technical issues relate to security concerns. Although unlikely, any data
moving across the Internet does have the potential to be accessed. Therefore,
claims of confidentiality may sometimes be easier to make than deliver (Bier,
Sherblom, & Gallo, 1996). These concerns should be adequately disclosed to
participants.
7. While anonymity can result in participants providing more truthful or involved
responses, it may also create the situation where someone may falsify or skew
information, including their identity (Kehoe & Pitkow, 1996). In addition, the
submission of multiple responses can be a concern unless proper precautions are
30
taken to control survey accesss (Harris & Dersch, 1999; Heerwegh & Loosveldt,
2002).
It is important to note that many of these issues are presently in a pattern of rapid
change, paralleling that of the Internet itself. For example, much research and debate has
focused the so-called “digital divide” in access to the Internet. Despite ominous
predictions, the division between those with and without Internet access has steadily
narrowed over time (Novak & Hoffman, 1998; Stross, 2000).
While several features, including race and ethnicity, remain significant with
regards to computer ownership and Internet access, other factors, such as socioeconomic
status have become more accurate in delineating among factors restricting access (Bier, et
al., 1996). It is projected that as the use of the Internet continues to grow across all
segments of society, that it (the Internet) will one day represent a population of users in
line with national demographics (Kehoe & Pitkow, 1996).
As discussed above, web-based research does present significant limitations at
this time. However, it remains a modality with high potential and can provide quality data
under certain circumstances.
Encouragingly, several leading researchers have outlined specific guidelines for
conducting effective Internet surveys (Dillman, 2000; Fowler, 2002; Schonlau, Fricker, &
Elliott, 2002). Specific to this research, are their recommendations for use of the Internet
for data collection with populations with almost universal Internet (and email) access.
While the exact percentage of counselors with online access is uncertain, some assurance
comes from reports that similar groups of individuals have high rates of computer
ownership and Internet access (Owen & Weikel, 1999). In fact, Greene (2003) reported
that over 97% of the mental health counselors he surveyed considered themselves to have
medium to high Internet competence. Furthermore, professionals, such as counselors, can
be expected to have greater overall levels of Internet usage and familiarity (Watt, 1997).
Participants
The survey population for this study included individuals who are members of the
American Counseling Association (ACA), who possessed an email address, had access to
the Internet and volunteered to complete the web-based survey. The ACA currently lists
its total membership at 43,470 (American Counseling Association, 2004). In addition, the
31
ACA estimates there are currently over 80,000 professional counselors who are licensed
or certified in 46 states and the District of Columbia.
Representiveness
The sample was drawn from the population of counselors with membership in the
ACA. As such, the sample cannot be considered to be representative of the entire group
of counselors in the United States. However, the survey results may prove to be
representative of a specific subset of counselors. Specifically, those counselors who are
members of ACA, have an email address and access to the Internet (Kaye & Johnson,
1999). Comparisons of the sample demographic characteristics with those provided by
the ACA were used to assess the representativeness of the sample (Lundberg & Cobitz,
1999).
Response Rate
There have been disparate reports regarding response rates to web-based survey
(McGlothlin, 2004). However, response rates have generally been lower than those
achieved via more traditional means (Swoboda, Muhlberger, Weitkunat, & Schneeweiss,
1997). Cook, et al. (2000) found a mean response rate of 34.6% in a meta-analysis of 56
web-based surveys (with no missing data). In addition, Sheehan and Hoy (1999) reported
a response rate of 24% for their survey of 5000 Internet users. Nevertheless, particular
consideration was given to feedback from a researcher who recently conducted a similar
study, drawing from the same population (G. Lawson, personal communication, July 7,
2004). In this particular case, a response rate of 15% was achieved. In addition,
consultation with several committee members supported the use of this estimate
Therefore, a 15% response rate was selected as a reasonable, if somewhat conservative
estimate, and was used for sample size calculation.
Sample Size
Sample size is one of the most important considerations in designing a study,
while at the same time, being one of the more difficult tasks a researcher faces (Bonett,
2002; Lenth, 2001). Too large of a sample is wasteful of costly resources. On the other
hand, too small of a sample results in an underpowered study and may also result in an
excessively wide confidence interval.
32
The present study was designed to be exploratory in nature. Therefore, the
emphasis was less on traditional null hypothesis significance testing (NHST). However,
in line with current recommendations of several prominent researchers, the process that
determined the sample size is fully elucidated (Cohen, 1994; Olejnik & Algina, 2000;
Wilkinson, 1999). Accordingly, the margin of error and amount of informational
confidence desired were given careful consideration (Mendoza & Stafford, 2001;
Smithson, 2003). Finally, the reporting of results focused on ease of understanding, as
opposed to “nth percentile accuracy” (Wilkinson, 1999).
In deciding on a sample size, several key criteria are important to consider
(Cumming & Finch, 2001). First, a margin of error needs to be chosen. This is usually
based on either convention (i.e., Cohen’s effect sizes) or results from previous studies.
The latter approach is preferred and also promotes the use of meta-analytic thinking
(Thompson, 2002b).
The margin of error (also called the confidence interval) is the amount of error in
the result that the researcher determines to be tolerable. For instance, given a margin of
error of 3%, it can be assumed that if 50% of a sample picked an answer, then between
47% and 53% (i.e., +/- 3%) of the corresponding population would pick the same answer.
In general, narrower (conservative) intervals are preferred over wider (liberal) intervals
(Smithson, 2003). Narrower intervals are also considered more informative than wider
ones.
The ideal situation is to design for a confidence interval that has the greatest
probability of containing the true parameter value (and, therefore, the least probability of
including false values). Since smaller margins of error typically require larger sample
sizes, designers usually face a tradeoff of accuracy versus cost. As Delucchi (2004)
stated, “In the end, the sample size must be a compromise between the competing
demands of good science and available resources of time and budget” (p. 373).
Confidence level is another important criteria. The confidence level tells how sure
of the results the researcher can be. For example, a confidence level of 95% means that
the “true” percentage of the population who would pick an answer - within the respective
margin of error - is 95% certain. A 95% confidence level is most commonly used and
was adhered to in this study (Smithson, 2000). The choice of this value convention was
33
further confirmed by research related to the present study (Astin, 1998; Cuijpers, 1997;
Druss & Rosenheck, 1999, 2000; Ernst, Rand, & Stevinson, 1998; McKendree-Smith,
Floyd, & Scogin, 2003; Ngoma, Prince, & Mann, 2003; Unutzer, et al., 2000; Young,
Klap, Sherbourne, & Well, 2001).
An additional consideration is the predicted distribution of responses. If the
results are highly skewed (e.g., 99% of a sample picked “Yes”, while 1% chose “No”),
then the chances of error are inherently low (Smithson, 2003). The chances of error are
much greater for results that tend to cluster in the middle (i.e., 50%). In order to account
for the worst-case scenario, a response distribution of 50% was employed when
calculating the sample size.
Finally, population size is another important consideration. Fortunately,
population size is only a factor when working with relatively small populations.
Otherwise, for large populations, (such as the members of ACA) the sample size does not
change much, if any, as the population increases.
The preceding discussion of sample size brings up the ongoing controversy
surrounding the use of null-hypothesis significance testing (NHST) (Cohen, 1994;
Wilkinson, 1999). NHST continues to be used despite the reform of statistical practices in
favor of confidence intervals. In addition, underpowered trials continue to plague
scientific research (Halpern, Karlawish, & Berlin, 2002; Hoenig & Heisey, 2001).
Several authors have pushed for a differentiation between statistical, practical and clinical
significance (Kendall, 1999; Thompson, 2002a). This delineation among types of
significance further obfuscates the usefulness of the traditional NHST.
For the purposes of the present research, the message is clear - the sample size
needs to be sufficient large to adequately and accurately represent the population under
consideration. Also, the results should be presented in a meaningful way, in which the
magnitude of effects is communicated in diverse ways (Thompson, 2002b).
Calculation of Sample Size
The ACA currently has about 44,000 members (population size). A 95%
confidence level and a 3% confidence interval (i.e., margin of error) were selected
(Smithson, 2003). The response distribution was assumed to be 50%.
34
Given these assumptions, software calculations (Lenth, 2004) determined the
needed sample size as 1046. Further, a 15% response rate was previously established as a
reasonable, if conservative, goal. Therefore, if the response rate equals completed
surveys/sent surveys*100%, then the number of surveys needed to be sent is 6973 (i.e.,
1046/.15).
In addition, to compensate for the possibility of undeliverable email addresses, it
was assumed that as many as 25% of the emails would “bounce”. (G. Lawson, personal
communication, July 7, 2004; Sheehan & Hoy, 1999; Smith, 1997). In other words, 75%
of sent emails would be received. Therefore, the total sample size is 9057 (i.e., 6973/.75).
To summarize, a total of 9057 surveys would have to be sent in order to achieve
the ideal of 1046 completed surveys. This figure assumes a 15% response rate and that
75% of sent emails are received.
However, due to limited resources, only 4000 email addresses were available to
be “purchased” from the ACA. This is the equivalent of accepting a 4% margin of error
(e.g., 4000*.15=600). In other words, 4000 email addresses is the approximate sample
size with a 4% margin of error (Lenth, 2004), all other factors remaining the same.
(Note: The sample size was calculated using Lenth’s (2004) CI for one proportion
Applet. This test provided a sample-size determination for estimating a proportion to
within a specified margin of error and for a finite population of specified size.)
Confidentiality and Informed Consent
This study was approved by the Virginia Tech Institutional Review Board (IRB)
under an “Expedited” status. The identities of survey respondents remained confidential
at all times. Only the researcher saw their email addresses. To further insure
confidentiality and provide security against unauthorized access, data was removed from
the remote server on a daily basis during the period of online collection based on several
unambiguous recommendations (Harris & Dersch, 1999; White, et al., 2001).
Delimitations and Limitations
This study was exploratory in nature. As such, it was not designed to provide
results generalizable to the entire population of counselors.
Counselors who responded to the survey by default must have possessed an email
address and access to the Internet. Information could not be gathered from counselors
35
who could not receive solicitation for the survey via email or did not use the Internet.
Lack of experience or comfort with the Internet may also have been a source of
nonresponse error. For some counselors the subject of complementary therapy itself may
simply have lacked sufficient salience for them to take the time and energy required to
participate. On the other hand, counselors with strong computer skills and/or interest in
complementary therapy may have been more likely to respond. Response bias is to be
expected in these instances.
It was further assumed that respondents who completed the survey provided
factual information about themselves and their experiences. While providing misleading
or incorrect information is unlikely, misrepresentation remains a significant concern for
online surveys (Harris & Dersch, 1999; Kehoe & Pitkow, 1996). More realistic concerns
about data reliability related to the possibility of someone coming upon the survey
accidentally when browsing the Internet. Providing a link to the survey website, along
with a requirement that all respondents must provide a password before they can access
the survey, is generally considered sufficient to ameliorate these concerns (Heerwegh &
Loosveldt, 2002).
An additional limitation is the fact that the collection of data was restricted to a
period of approximately three weeks, in keeping with recommendations for web-based
surveys (Dillman, 2000). Once again, only those respondents who had access to and
responded to the survey within this temporal window could contribute to the data.
Finally, some counselors may have made a faulty assumption that the first contact, an
email used to recruit subjects, was either junk or Spam (Sills & Song, 2002). Researchers
must realize that unsolicited email may be seen a breach of “Netiquitte”.
Research Questions
The purpose of the study was to gather information from counselors regarding:
clients’ disclosure of complementary therapy use, recommendation and referral patterns
for complementary therapy, inclusion of complementary therapy within clinical practice,
counselors’ knowledge and training in complementary therapy and counselors’ personal
experience with complementary therapy. In addition, demographic information was
collected from respondents.
I. Professional Practice variables
36
1. What do counselors ask, and their clients disclose, concerning clients’ use of
complementary therapy?
2. What are counselors’ recommendation and referral patterns for complementary
therapy?
3. Do counselors include complementary therapy in their practice of
counseling? If so, how is it included?
II. Knowledge and training variables
4. What are counselors’ knowledge and training in complementary therapy?
III. Personal experience variables
5. What are counselors’ personal experiences with complementary therapy?
IV. Demographic variables
7. Do counselors differ across demographic variables (i.e., gender, age,
race/ethnicity, income, degree, mental health license, years practicing,
clients/week, current position, work setting, services provided, theoretical
orientation) with regards to professional practice variables, knowledge and
training variables, and personal experience variables?
Instrumentation
The survey instrument was developed by the researcher after a thorough review of
the literature. In addition, the face and content validity of the instrument were appraised
by the researcher’s dissertation committee. The survey instrument was then pilot tested
with a diverse group of 17 counselors. Changes were implemented as recommended by
the dissertation validation committee and pilot. Modifications to the instrument were
mainly changing the wording of items to increase understandability, adjusting the order
of questions and determining the content of the complementary therapy list. The final
version of the instrument is found in Appendix A.
The writing of questions was based on the recommendations of several
researchers (Dillman, 2000; Fowler, 2002; Schonlau, et al., 2002). This resulted in the
employment of a short-list of general criteria for assessing each question’s
appropriateness for the proposed study. Issues of question structure and wording were
deliberated with appropriate regard given to social exchange theory, which is discussed in
detail in the next section. For example, providing time referents provided a temporal
37
“anchor” to respondents and eased their “cognitive cost”. Another example was the use of
cognitive design techniques to improve information recall over a sequence of questions.
The construction of the questionnaire was also strongly influenced by
recommended guidelines (Dillman, 2000; Fowler, 2002; Schonlau, et al., 2002). Careful
attention was given to key principles that guided the design, format and layout of the
questionnaire. These principles included, manipulation of size, brightness, figure/ground,
simplicity and regularity. Salience is also an important issue, and the selection of an
appealing first question was given careful consideration.
Dillman (2000) discussed the two overall objectives of questionnaire construction
as reducing errors of both nonresponse and measurement (i.e., bias). In other words, the
overall goal is the design of a respondent-friendly questionnaire, which is easily and
consistently understood and thoroughly completed. For example, a very practical and
effective technique to help meet these goals is to provide the respondents with some
indication of survey progress as they proceed through the questionnaire (e.g., “You are
halfway done”) (Schonlau, et al., 2002).
Dillman (2000) cautioned that specific consideration needs to be given to the
design of web-based surveys, over and above those of other mediums. Not only is
questionnaire logic important, special attention needs to be given to “computer logic”.
This means that designers may need to provide web-based survey respondents with
specific computer related instructions and assistance. This is done in order to avoid
assumptions about respondents’ computer skills and, correspondingly, reduce social
costs. For example, it may seem overly simplistic, but prove necessary, to provide
instructions to respondents to click on the “Submit” button when the survey is completed
(Mathai, 2002).
Finally, there may be differences between what the designer sees on his or her
computer and the image that results once the questionnaire has passed through the
respondent’s hardware and software. For example, disparities may occur among colors,
text, and horizontal and vertical layout of the questionnaire. Other authors have put forth
the recommendation that designers adopt a worst-case stance with regards to
respondents’ technological savvy and installed hardware and software. In proposing this
38
design principle, Harris and Dersch (1999) coined the term “the thin client” to indicate
this type of respondent.
The questionnaire was deployed via the “Survey Maker” programming
environment at Virginia Tech. The questionnaire and all collected data was stored on a
dedicated Virginia Tech server. As an additional benefit, the Survey Maker program has
been shown to be compatible with all currently used browsers, thus eliminating some
concerns related to “thin clients”.
Data Collection Procedures
The implementation of the survey closely followed the proven Tailored Design
Method developed by Dillman (2000). Over time, this method has been proven to provide
consistently high response rates and quality data – as long as it is precisely followed.
While initially developed for telephone surveys and implemented successfully within that
milieu for several decades (Dillman, Christenson, Carpenter, & Brooks, 1977), the
tailored design method has since been adapted to e-mail (Schaefer & Dillman, 1998) and,
more recently, web-based surveys (Dillman, 2000).
One of the crucial elements in the success of the tailored design method is its
utilization of social exchange theory (Dillman, 2000). Social exchange theory posits that
the decisions people make concerning a request to give of themselves in some way (i.e.,
complete a survey), depends to a large degree on their perceptions of both the costs and
rewards of the request. In addition, respondents need to know that they can trust these
perceptions. Specific to this research, the costs of taking the time and energy to complete
the survey with accuracy and thoroughness, must be offset by a “trusted” perception of
adequate reward.
Rewards may take a tangible form such as cash or other substantial incentives for
completing a survey. For example, a commitment to send the results of the study may be
a sufficient and valuable incentive for some responders (Dillman, 2000). In addition, less
substantive means, such as showing positive regard, saying thank you, asking for advice,
making the questionnaire compelling or the simple promise of contributing to the greater
good can be effective rewards.
On the other hand, the researcher must somehow convey to the respondent that
the social costs (i.e., completing a survey) are, on balance, reasonable. Some means of
39
reducing costs include, minimizing inconvenience for the respondent, keeping
questionnaires (to at least appear) short and simple, and minimizing personal information
inquiries (Dillman, 2000). Reducing social costs can also involve taking care to avoid
subordinating or embarrassing language,
In addition, the researcher needs to be able to communicate trust. Specifically,
respondents need to know that the social costs are limited to those explicitly (or
implicitly) given, that the survey is what it purports to be and that any promised rewards
will be conveyed. Trust can be engendered through such means as using official
letterheads to show legitimate authority, making the task appear important, invoking
other exchange associations (e.g., contributing to the greater good) or providing a token
incentive to respond to the survey - in advance (Dillman, 2000). Unfortunately, one of the
significant drawbacks of online surveys is the lack of a mechanism to easily provide an
incentive to respondents, such as putting a dollar bill in an envelope. In summary, use of
the tailored design method involves invoking social exchange theory throughout the
survey design and implementation process in order to most effectively increase rewards,
reduce costs and engender trust.
The approach of Dillman (2000) was further utilized to structure the collection of
data. Despite the attention given to the design of the questions and construction of the
questionnaire, these are not the main determinants of response rates to surveys.
In fact, the area of survey implementation is clearly the most important factor in
improving response rates (Dillman, 2000). Specifically, the principal influence on
response rates has been found to be the employment of a survey implementation structure
that employs multiple contacts (Dillman, 1991). Further, the use of a precontact or
prenotification that a survey would soon be arriving, effectively functioned to increase
response rates across a meta-analysis of 68 web-based surveys. (Cook, et al., 2000). In
addition, the employment of a token incentive - in advance - has been found to result in
slightly higher rates of response and less variability in data. Personalized contacts have
also been associated with higher response rates in electronic surveys. Finally, the salience
of the survey subject matter, while a somewhat “intangible” factor, can have a significant
influence on response rates (Dillman, 2000). Interestingly, the social costs of survey
40
length or having to login with a password have not been found to correlate with
decreased response rates (Cook, et al.).
With one exception, all of the above methods for improving the present survey’s
response rate were implemented. Unfortunately, the use of personalized contacts was
woefully constrained due to the large number of solicitations mandated by the research
design. In addition, the implementation of traditional pre-solicitation incentives (i.e., a
dollar bill) is inherently problematic for web-based surveys. A reasonable substitute was
developed, consisting of a link to an abridged list of complementary therapy resources on
the web.
Finally, while the salience of the research topic will differ to some degree for each
respondent, the intersection of complementary therapy and counseling is thought by
several authors to be both compelling and on the “cutting edge” (Bassman & Uellendahl,
2003; Shannon, 2002; White, 2000). On the other hand, too much salience might prove to
be counterproductive. Cook, et al. (2000) reported that a somewhat salient topic was
associated with greater response rates than a topic deemed to be either not salient or very
salient.
The final version of the survey was posted on the Internet for an approximately
three-week period beginning November 1, 2004 and ending November 24, 2004. During
this time, the survey was open for data collection 24 hours per day. Respondents were
able to access the survey by simply clicking on a link provided in the second through
fourth emails. Once respondents completed the questionnaire, they simply clicked on the
“Submit” button to send their data. Once a day during the collection period, the raw data
submitted by respondents was removed from the remote server and transferred to the
researcher’s computer. This measure was carried out to increase security and protect the
confidentiality of respondents.
The data collection procedure carefully followed the established system of
Dillman (2000). However, two modifications were made to this approach. First, the
number of contacts was changed from a total of five to a total of four. Second, a
reduction was made in the time for follow up contacts as recommended by Truell, et al.
(2002). The change in the total number of contacts was partially based on the results of a
meta-analysis of factors having an effect on web-based survey response rates (Cook, et
41
al., 2000). Their research showed that response rates peaked after the third contact,
dipped slightly by the fourth, and were significantly lower by the fifth contact. In
addition, Mathai (2002) reported that the incorporation of a fifth and final contact was
found to be redundant. Therefore, in this study, the fourth contact (a final reminder) was
combined with the fifth contact (announcing the closing of the data collection period).
This strategy also reduced the possibility of inundating respondents with emails and,
possibly, breaching “Netiquitte” (Sills & Song, 2002).
Contacts were broken down as follows.
a. The initial contact was a notice emailed to all potential members of the sample.
This contact was used to introduce the study, explain its purposes, make an appeal
for the usefulness of the survey and provide a token incentive. Potential
respondents were informed they would be receiving a follow up email in
approximately three (3) days, which would include a link to the survey (see
Appendix B).
b. A second contact was made via an email sent once more to all potential
respondents. In this email, respondents were informed of the specific request of
them, a statement was provided regarding why they were selected, the usefulness
of the survey was again emphasized, confidentiality issues were addressed, the
provision of a token was reiterated and contact information for the researcher was
provided for any questions or concerns. A link to the questionnaire itself was
included, along with instructions on how to use the link. The period when the
survey would be open for data collection was also given. Finally, a password was
provided, which was identical for all participants (see Appendix C).
c. A third contact was made one week after the survey opened for data collection.
This email included a thank you to respondents who had already completed the
survey and a reminder to those who had not yet taken the opportunity to
contribute to the research. Respondents were prompted that if they have already
completed the survey, to simply ignore this message (see Appendix D).
d. A fourth contact, and final contact, was made one week later. This email again
expressed appreciation to respondents who had already completed the survey. It
also included a “stronger” reminder to those who had not yet taken the
42
opportunity to respond. Respondents were once more prompted that if they have
already completed the survey, to ignore this message. Finally, this email
announced that the data collection period would end in approximately three days
(see Appendix E).
Data Analysis
The first step in the analysis of the data was to import the raw data into a
Microsoft Excel spreadsheet. The Virginia Tech Survey Maker program has this
capability built in, making for a straightforward procedure. The data was then “cleaned
up” as necessary to catch “rogue” or blank data, and insure a consistent data format.
Finally, the data was imported into SPSS 12.0 from Excel for further analysis.
Once the data was in SPSS format, it was modified as necessary through recoding
(into same and new variables), restructuring and regrouping of variables. This was done
to enhance, augment and simplify analysis.
Univariate descriptive statistics were calculated for all demographic variables and
reported in text format, as well as in tables, as recommended by Wilkinson, 1999. The
representativeness of the sample was then assessed through comparison with equivalent
ACA categories, using chi-square based statistical analysis.
Descriptive results were delineated and reported as above for all remaining
variables. This information was used to answer research questions one through five.
Finally, contingency tables (or crosstabulations) were used to answer question six.
The various demographic categories served as independent variables, with professional
practice, knowledge and training, and personal experience factors functioning as
dependent variables. The results of these analyses were reported in both text and table
format.
Summary
Chapter Three outlined the methodology used to collect data on counselors’
experiences with complementary therapy. First, an overview of web-based survey
research was provided and included an overview of possible advantages and limitations.
Next, the rationale for selection of the sample frame from which participants were
recruited was discussed. A summary of confidentiality issues and delimitations and
limitations was provided. The research questions were then reiterated. Next, the

43
reasoning, which governed the design of the survey instrument, was covered in depth.
Then, the details of the data collection procedure were examined. Finally, data analysis
methods were described.
44
CHAPTER FOUR
RESULTS
This exploratory research study gathered data on counselors’ experiences with
complementary therapy (CT). This chapter reports the results of the research. First, an
overview of respondent demographics corresponding to those of the American
Counseling Association (ACA) is offered. Then chi-square based comparison with ACA
demographics was conducted to assess the representativeness of the sample. Additional
respondent demographics beyond the ACA categories are then presented. Statistical
procedures, including descriptive results and crosstabulations are used to answer each
research question.
An initial email announcing the study and soliciting respondents was sent to 4000
randomly selected members of the American Counseling Association (ACA). Out of this
original group, 959 email address were ultimately determined to be undeliverable for a
variety of reasons. The undeliverable email rate was therefore 24% (i.e., 959/4000
*100%). This frequency is in line with data on undeliverable rates (Smith, 1997). Of the
remaining total of 3041 viable email addresses, 657 completed responses were obtained.
This resulted in a survey response rate of 21.6% (i.e., 657/3041 *100%). The decline rate
was less than 0.1% as only three of the 3041 possible respondents requested removal
from involvement in the survey.
Due in part to the exploratory nature of this study, all data was either in the form
of categorical (i.e., nominal) or rank ordered (i.e., ordinal) data. For nominal data,
descriptive statistics are calculated and reported in table form. In the case of ordinal data,
the mean, median, mode and standard deviation (SD) are also calculated and reported.
Technically speaking, central tendency measures for ordinal data should be
reported in the form of median values (Rea & Parker, 1992). This is primarily due to the
fact that it cannot be assumed that there are equal distances/values between each ordinal
data subcategory, as with interval data. Ordinality only grants authorization to rank (i.e.,
order) the data, not manipulate the data mathematically. However, it has been argued that
the reporting of mean values with ordinal data provides more detailed and powerful
information, which tends to “far outweigh the costs associated with relaxing these
45
technicalities” (Rea & Parker, p. 176). In this spirit, arithmetic means are provided for all
ordinal data.
Demographic Data Corresponding to ACA Categories
The demographic characteristics of the sample corresponding to ACA categories
were collected through a number of survey questions. Question numbers precede each
respective category. The results are summarized in Table1.
The majority of the 657 respondents were female (78%, n=509). In terms of
race/ethnicity, most respondents were “Caucasian” (86%, n=555), while “Native
American” was the least reported race/ethnicity (0.5%, n=3).
Because of the small frequencies for all subcategories of race/ethnicity, except
Caucasian, the race/ethnicity data was combined and then divided into either “Caucasian”
(n=555, 86%) or “Other” (n=78. 11.9%) subcategories. This reassignment also enhanced
follow up analysis by limiting the number of low cell frequencies. See the category
Race/Ethnicity-Recoded in Table 1.
The income category consisted of five subcategories reported on a Likert (ordinal)
scale. The ordered values of 1 to 5 for each subcategory are listed after its respective
label. The mean for this category was 2.82, signifying that the average income for
respondents is slightly below $25,000 per year from counseling related activities. The
mean value’s proximity to the median value of 3.0 indicates that the center of the
distribution is close to the median, but with a slight negative skew (i.e., more results at
the high end of the scale).
With regard to income from counseling related activities, more than one quarter
of respondents (25.4%, n=167) reported earning less than $12,500 annually, while an
annual income of $12,500 to 24,999 accounted for less that ten percent of responses
(9.3%, n=51). By combining subcategories, it was established that nearly 41% (40.8%,
n=268) of respondents earned $25,000 to $59,999 per year from counseling related
activities. Not surprisingly, the income category had the greatest number of respondents
(11.9%, n=78) who preferred not to disclose the requested information (i.e., income).
The majority of respondents (61.8%, n=406) reported a “Master’s” as their
highest earned degree, with the “Educational Specialist” degree achieving the lowest
response rate (4%, n=26). Further, the low number of respondents for the “Educational
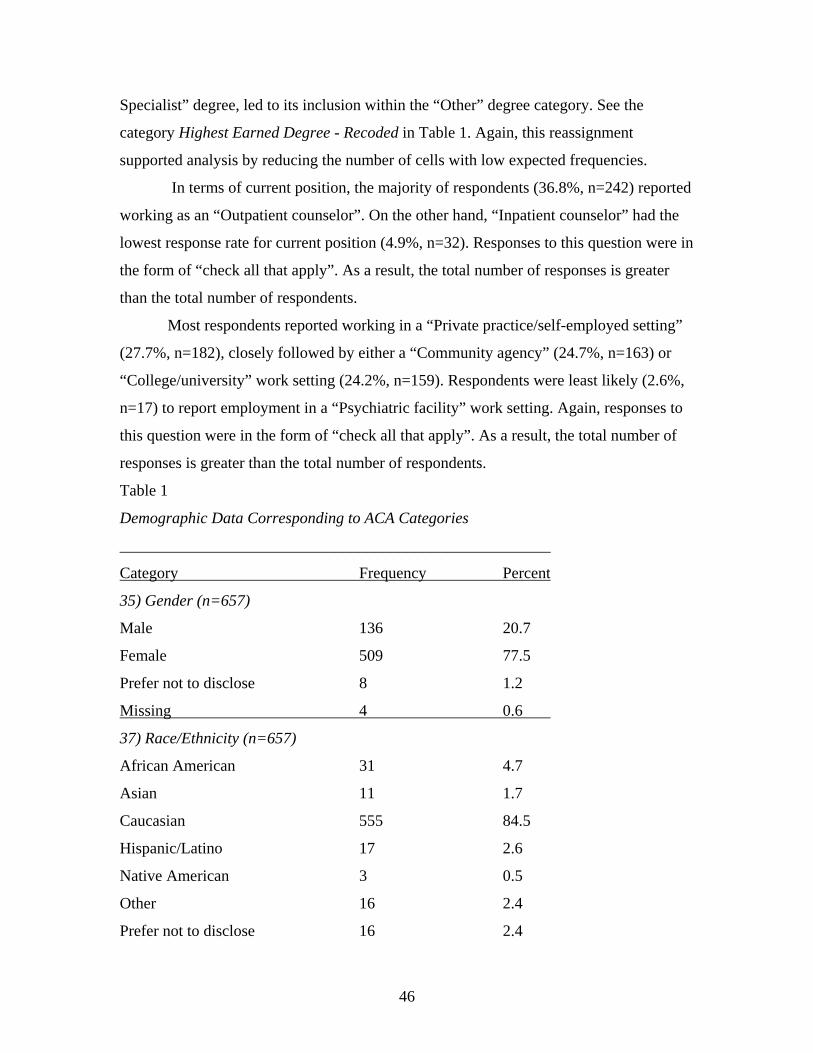
46
Specialist” degree, led to its inclusion within the “Other” degree category. See the
category Highest Earned Degree - Recoded in Table 1. Again, this reassignment
supported analysis by reducing the number of cells with low expected frequencies.
In terms of current position, the majority of respondents (36.8%, n=242) reported
working as an “Outpatient counselor”. On the other hand, “Inpatient counselor” had the
lowest response rate for current position (4.9%, n=32). Responses to this question were in
the form of “check all that apply”. As a result, the total number of responses is greater
than the total number of respondents.
Most respondents reported working in a “Private practice/self-employed setting”
(27.7%, n=182), closely followed by either a “Community agency” (24.7%, n=163) or
“College/university” work setting (24.2%, n=159). Respondents were least likely (2.6%,
n=17) to report employment in a “Psychiatric facility” work setting. Again, responses to
this question were in the form of “check all that apply”. As a result, the total number of
responses is greater than the total number of respondents.
Table 1
Demographic Data Corresponding to ACA Categories
______________________________________________________
Category Frequency Percent
35) Gender (n=657)
Male 136 20.7
Female 509 77.5
Prefer not to disclose 8 1.2
Missing 4 0.6
37) Race/Ethnicity (n=657)
African American 31 4.7
Asian 11 1.7
Caucasian 555 84.5
Hispanic/Latino 17 2.6
Native American 3 0.5
Other 16 2.4
Prefer not to disclose 16 2.4
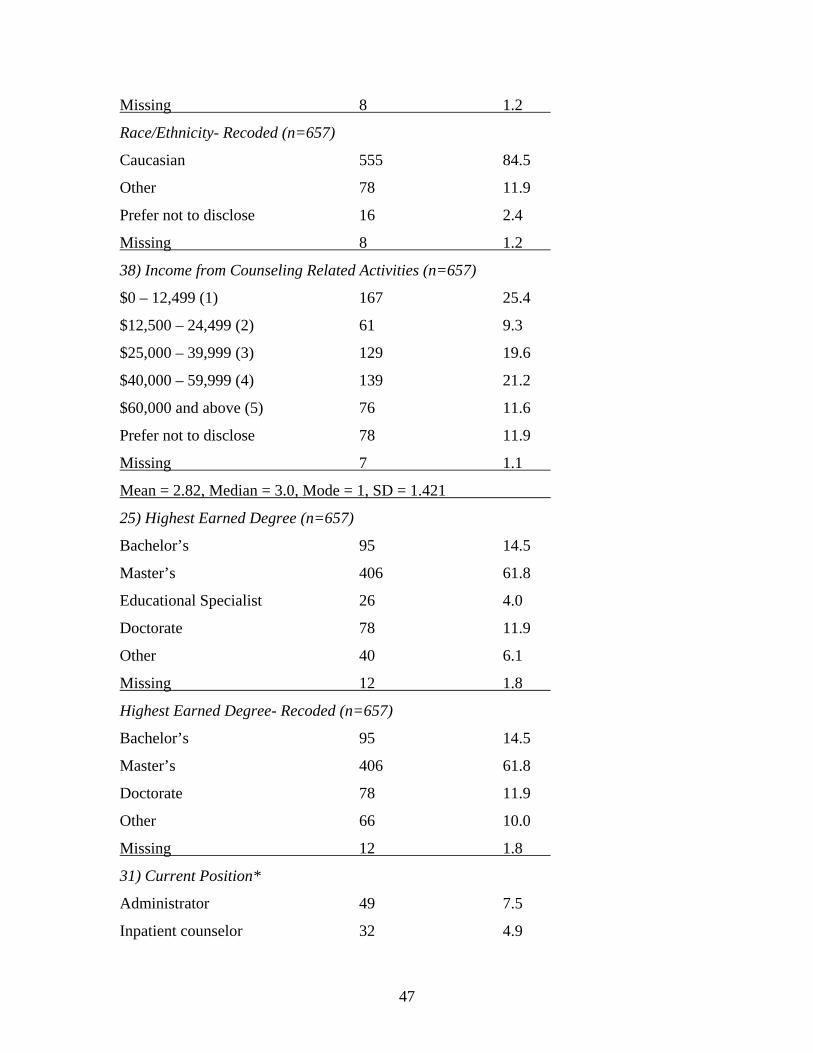
47
Missing 8 1.2
Race/Ethnicity- Recoded (n=657)
Caucasian 555 84.5
Other 78 11.9
Prefer not to disclose 16 2.4
Missing 8 1.2
38) Income from Counseling Related Activities (n=657)
$0 – 12,499 (1) 167 25.4
$12,500 – 24,499 (2) 61 9.3
$25,000 – 39,999 (3) 129 19.6
$40,000 – 59,999 (4) 139 21.2
$60,000 and above (5) 76 11.6
Prefer not to disclose 78 11.9
Missing 7 1.1
Mean = 2.82, Median = 3.0, Mode = 1, SD = 1.421
25) Highest Earned Degree (n=657)
Bachelor’s 95 14.5
Master’s 406 61.8
Educational Specialist 26 4.0
Doctorate 78 11.9
Other 40 6.1
Missing 12 1.8
Highest Earned Degree- Recoded (n=657)
Bachelor’s 95 14.5
Master’s 406 61.8
Doctorate 78 11.9
Other 66 10.0
Missing 12 1.8
31) Current Position*
Administrator 49 7.5
Inpatient counselor 32 4.9
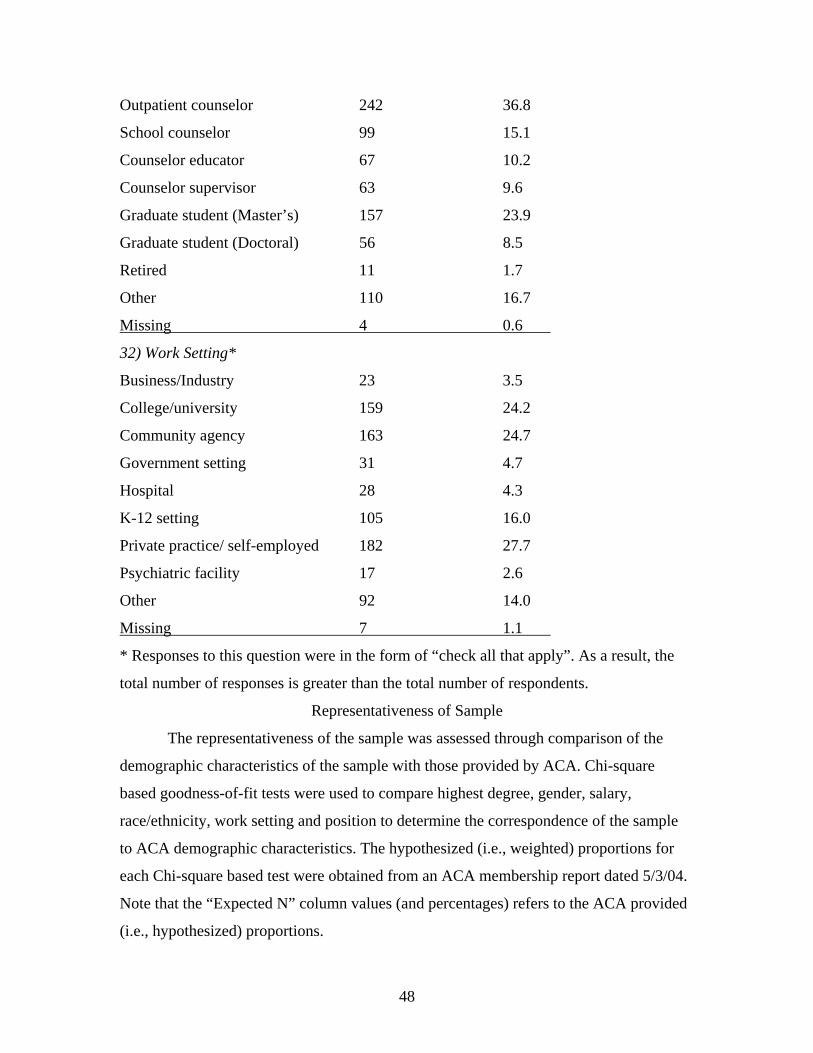
48
Outpatient counselor 242 36.8
School counselor 99 15.1
Counselor educator 67 10.2
Counselor supervisor 63 9.6
Graduate student (Master’s) 157 23.9
Graduate student (Doctoral) 56 8.5
Retired 11 1.7
Other 110 16.7
Missing 4 0.6
32) Work Setting*
Business/Industry 23 3.5
College/university 159 24.2
Community agency 163 24.7
Government setting 31 4.7
Hospital 28 4.3
K-12 setting 105 16.0
Private practice/ self-employed 182 27.7
Psychiatric facility 17 2.6
Other 92 14.0
Missing 7 1.1
* Responses to this question were in the form of “check all that apply”. As a result, the
total number of responses is greater than the total number of respondents.
Representativeness of Sample
The representativeness of the sample was assessed through comparison of the
demographic characteristics of the sample with those provided by ACA. Chi-square
based goodness-of-fit tests were used to compare highest degree, gender, salary,
race/ethnicity, work setting and position to determine the correspondence of the sample
to ACA demographic characteristics. The hypothesized (i.e., weighted) proportions for
each Chi-square based test were obtained from an ACA membership report dated 5/3/04.
Note that the “Expected N” column values (and percentages) refers to the ACA provided
(i.e., hypothesized) proportions.
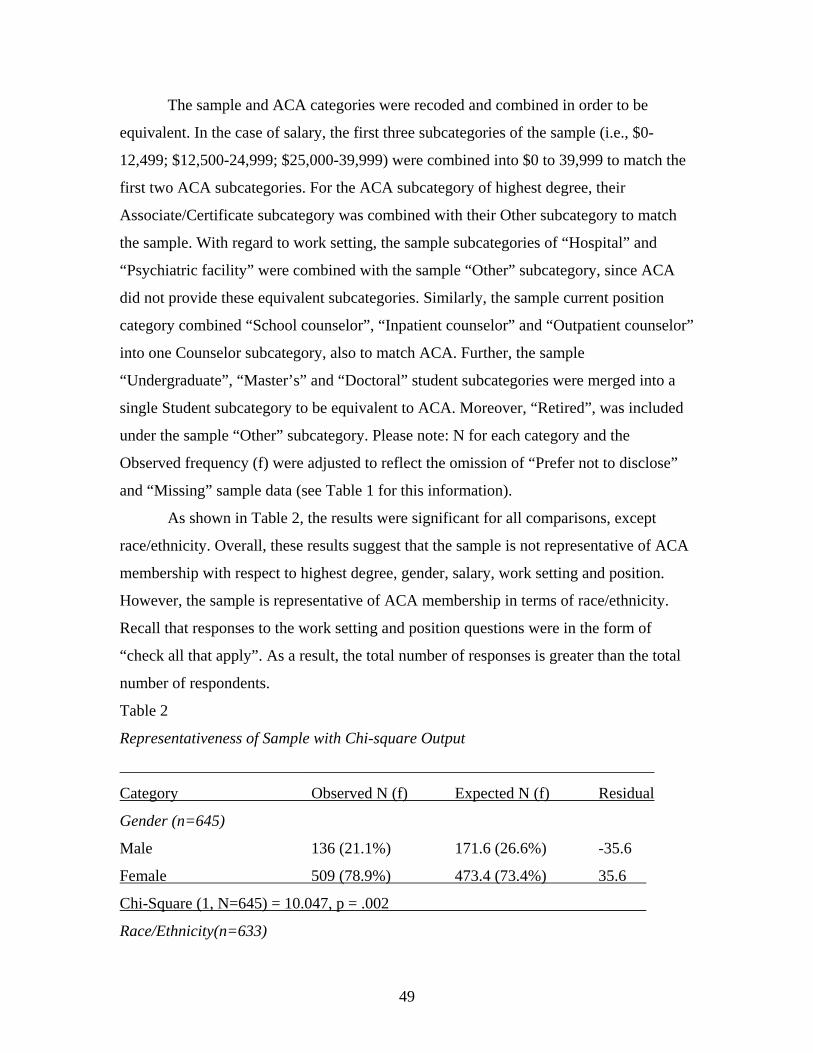
49
The sample and ACA categories were recoded and combined in order to be
equivalent. In the case of salary, the first three subcategories of the sample (i.e., $0-
12,499; $12,500-24,999; $25,000-39,999) were combined into $0 to 39,999 to match the
first two ACA subcategories. For the ACA subcategory of highest degree, their
Associate/Certificate subcategory was combined with their Other subcategory to match
the sample. With regard to work setting, the sample subcategories of “Hospital” and
“Psychiatric facility” were combined with the sample “Other” subcategory, since ACA
did not provide these equivalent subcategories. Similarly, the sample current position
category combined “School counselor”, “Inpatient counselor” and “Outpatient counselor”
into one Counselor subcategory, also to match ACA. Further, the sample
“Undergraduate”, “Master’s” and “Doctoral” student subcategories were merged into a
single Student subcategory to be equivalent to ACA. Moreover, “Retired”, was included
under the sample “Other” subcategory. Please note: N for each category and the
Observed frequency (f) were adjusted to reflect the omission of “Prefer not to disclose”
and “Missing” sample data (see Table 1 for this information).
As shown in Table 2, the results were significant for all comparisons, except
race/ethnicity. Overall, these results suggest that the sample is not representative of ACA
membership with respect to highest degree, gender, salary, work setting and position.
However, the sample is representative of ACA membership in terms of race/ethnicity.
Recall that responses to the work setting and position questions were in the form of
“check all that apply”. As a result, the total number of responses is greater than the total
number of respondents.
Table 2
Representativeness of Sample with Chi-square Output
___________________________________________________________________
Category Observed N (f) Expected N (f) Residual
Gender (n=645)
Male 136 (21.1%) 171.6 (26.6%) -35.6
Female 509 (78.9%) 473.4 (73.4%) 35.6
Chi-Square (1, N=645) = 10.047, p = .002
Race/Ethnicity(n=633)
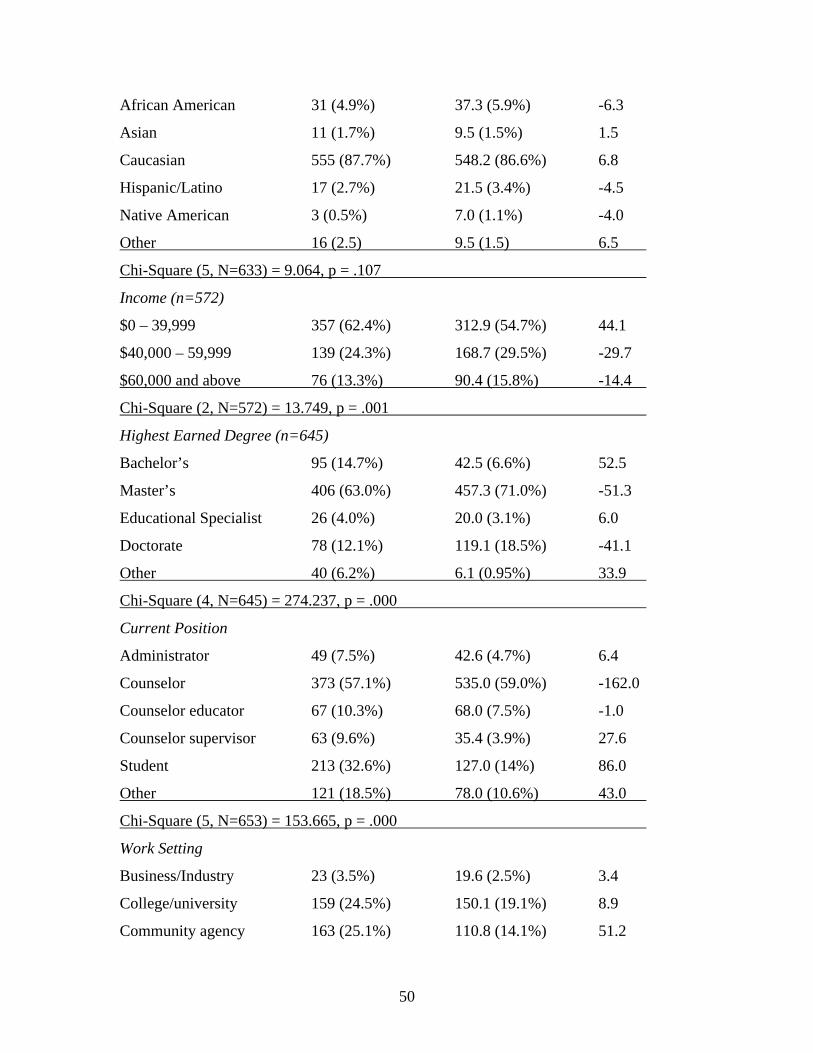
50
African American 31 (4.9%) 37.3 (5.9%) -6.3
Asian 11 (1.7%) 9.5 (1.5%) 1.5
Caucasian 555 (87.7%) 548.2 (86.6%) 6.8
Hispanic/Latino 17 (2.7%) 21.5 (3.4%) -4.5
Native American 3 (0.5%) 7.0 (1.1%) -4.0
Other 16 (2.5) 9.5 (1.5) 6.5
Chi-Square (5, N=633) = 9.064, p = .107
Income (n=572)
$0 – 39,999 357 (62.4%) 312.9 (54.7%) 44.1
$40,000 – 59,999 139 (24.3%) 168.7 (29.5%) -29.7
$60,000 and above 76 (13.3%) 90.4 (15.8%) -14.4
Chi-Square (2, N=572) = 13.749, p = .001
Highest Earned Degree (n=645)
Bachelor’s 95 (14.7%) 42.5 (6.6%) 52.5
Master’s 406 (63.0%) 457.3 (71.0%) -51.3
Educational Specialist 26 (4.0%) 20.0 (3.1%) 6.0
Doctorate 78 (12.1%) 119.1 (18.5%) -41.1
Other 40 (6.2%) 6.1 (0.95%) 33.9
Chi-Square (4, N=645) = 274.237, p = .000
Current Position
Administrator 49 (7.5%) 42.6 (4.7%) 6.4
Counselor 373 (57.1%) 535.0 (59.0%) -162.0
Counselor educator 67 (10.3%) 68.0 (7.5%) -1.0
Counselor supervisor 63 (9.6%) 35.4 (3.9%) 27.6
Student 213 (32.6%) 127.0 (14%) 86.0
Other 121 (18.5%) 78.0 (10.6%) 43.0
Chi-Square (5, N=653) = 153.665, p = .000
Work Setting
Business/Industry 23 (3.5%) 19.6 (2.5%) 3.4
College/university 159 (24.5%) 150.1 (19.1%) 8.9
Community agency 163 (25.1%) 110.8 (14.1%) 51.2
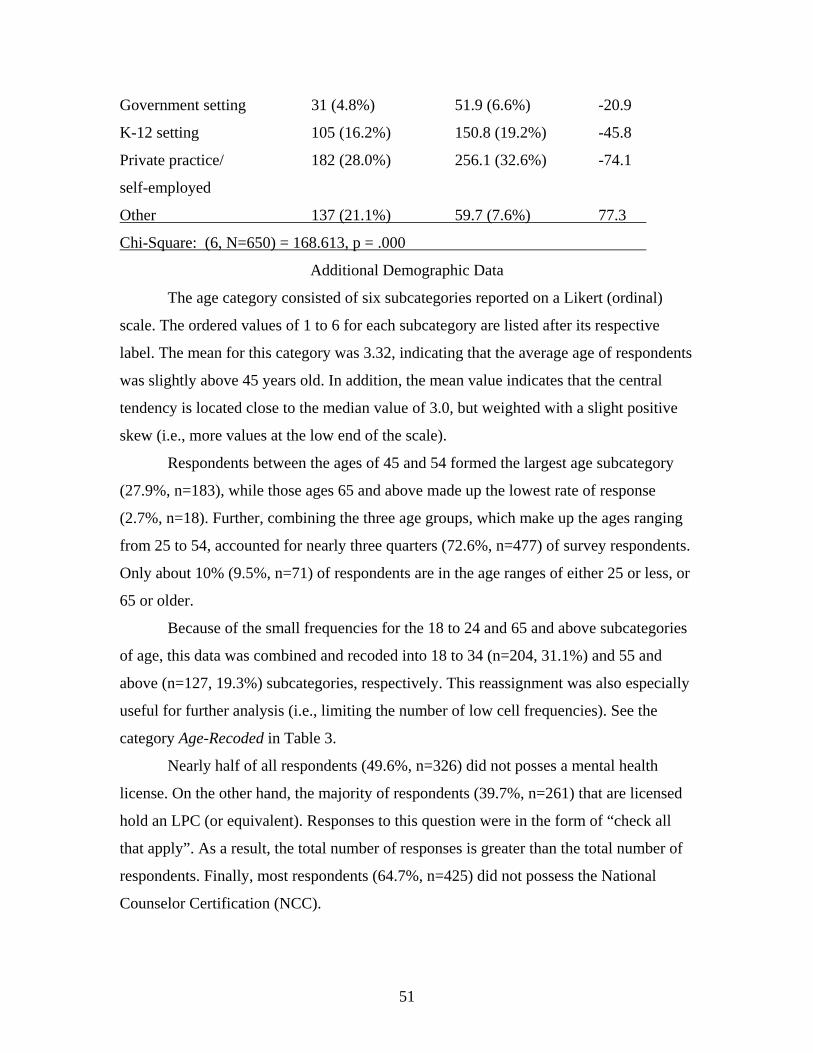
51
Government setting 31 (4.8%) 51.9 (6.6%) -20.9
K-12 setting 105 (16.2%) 150.8 (19.2%) -45.8
Private practice/ 182 (28.0%) 256.1 (32.6%) -74.1
self-employed
Other 137 (21.1%) 59.7 (7.6%) 77.3
Chi-Square: (6, N=650) = 168.613, p = .000
Additional Demographic Data
The age category consisted of six subcategories reported on a Likert (ordinal)
scale. The ordered values of 1 to 6 for each subcategory are listed after its respective
label. The mean for this category was 3.32, indicating that the average age of respondents
was slightly above 45 years old. In addition, the mean value indicates that the central
tendency is located close to the median value of 3.0, but weighted with a slight positive
skew (i.e., more values at the low end of the scale).
Respondents between the ages of 45 and 54 formed the largest age subcategory
(27.9%, n=183), while those ages 65 and above made up the lowest rate of response
(2.7%, n=18). Further, combining the three age groups, which make up the ages ranging
from 25 to 54, accounted for nearly three quarters (72.6%, n=477) of survey respondents.
Only about 10% (9.5%, n=71) of respondents are in the age ranges of either 25 or less, or
65 or older.
Because of the small frequencies for the 18 to 24 and 65 and above subcategories
of age, this data was combined and recoded into 18 to 34 (n=204, 31.1%) and 55 and
above (n=127, 19.3%) subcategories, respectively. This reassignment was also especially
useful for further analysis (i.e., limiting the number of low cell frequencies). See the
category Age-Recoded in Table 3.
Nearly half of all respondents (49.6%, n=326) did not posses a mental health
license. On the other hand, the majority of respondents (39.7%, n=261) that are licensed
hold an LPC (or equivalent). Responses to this question were in the form of “check all
that apply”. As a result, the total number of responses is greater than the total number of
respondents. Finally, most respondents (64.7%, n=425) did not possess the National
Counselor Certification (NCC).
52
The years practicing category consisted of four subcategories reported on a Likert
(ordinal) scale. The ordered values of 1 to 4 for each subcategory are listed after its label.
The mean for this category is 1.76, which indicates that respondents average slightly less
than six years practicing as a counselor. The median value of 1.0 indicates that the
distribution is positively skewed. In this case, the median provides a better representation
of the central tendency of the distribution, which is zero to six years practicing as a
counselor.
Specifically, the majority of respondents (59.2%, n=389) have practiced less than
six years as a counselor. However, only 9.9% of respondents reported practicing as a
counselor from 13 to 19 years.
The average number of clients seen per week category consisted of four
subcategories reported on a Likert (ordinal) scale. The ordered values of 1 to 4 for each
subcategory are listed after its label. The mean for this category is 2.24, indicating that
respondents saw slightly more than seven clients per week, on average, during the past
year. The mean value’s close correspondence with the median value of 2.0 indicates that
the center of the distribution is close to the median, but slightly skewed toward the
positive dimension.
In terms of the average number of clients seen per week, between one and six
clients was the most common response (28.9%, n=190). Respondents reported seeing 13
to 19 clients with the least frequency (15.5%, n=102). Just over half of respondents’ saw
one to 12 clients, on average, per week (50.2%, n=330).
“Individual therapy” was the most often provided mental health service (70.2%,
n=461). On the other hand, “Alcohol/substance abuse counseling” was cited by slightly
more than one quarter of respondents (26.6%, n=175). However, it should be noted that
less than 15% of respondents did not provide any mental health services (14.6%, n=96).
Responses to this question were in the form of “check all that apply”. As a result, the
total number of responses is greater than the total number of respondents.
With regard to theoretical orientation, “Cognitive/behavioral” was indicated by
the majority of respondents (70.3%, n=462). This was followed by “Person-centered”
(53.9%, n=354) and “Solution focused” (44.6%, n=293) theoretical orientations,
respectively. Finally, the equivocal category of “Other”, was the least frequently cited
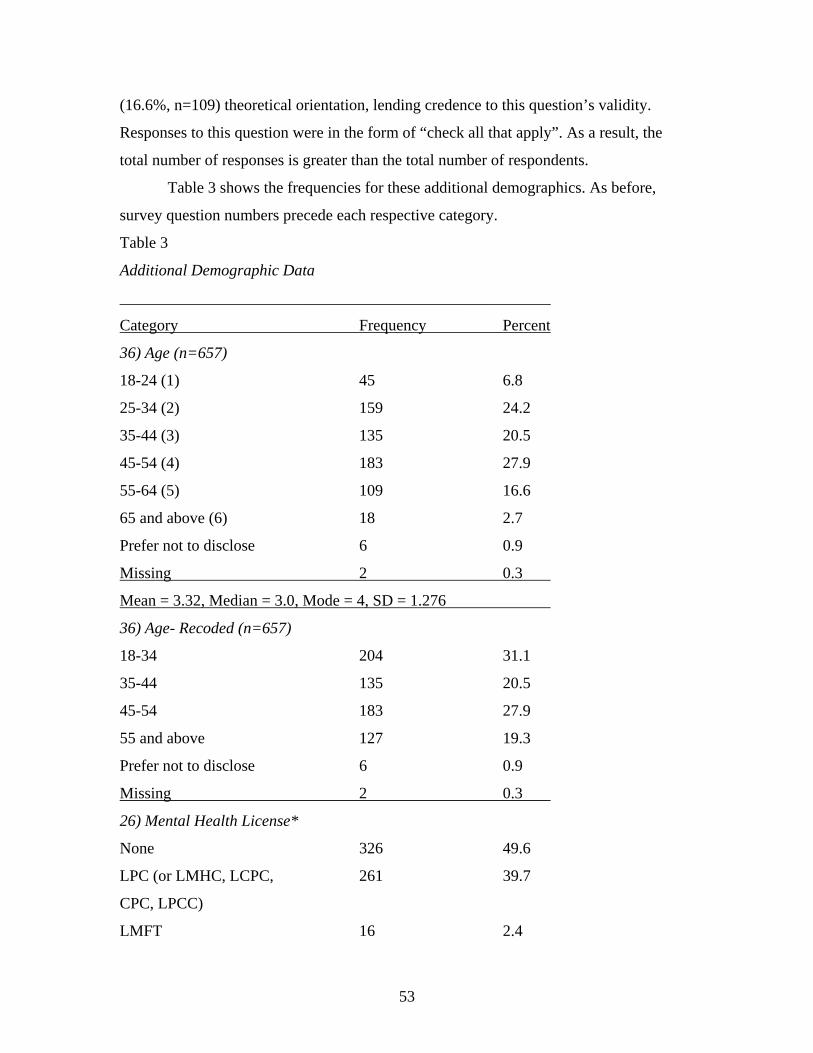
53
(16.6%, n=109) theoretical orientation, lending credence to this question’s validity.
Responses to this question were in the form of “check all that apply”. As a result, the
total number of responses is greater than the total number of respondents.
Table 3 shows the frequencies for these additional demographics. As before,
survey question numbers precede each respective category.
Table 3
Additional Demographic Data
______________________________________________________
Category Frequency Percent
36) Age (n=657)
18-24 (1) 45 6.8
25-34 (2) 159 24.2
35-44 (3) 135 20.5
45-54 (4) 183 27.9
55-64 (5) 109 16.6
65 and above (6) 18 2.7
Prefer not to disclose 6 0.9
Missing 2 0.3
Mean = 3.32, Median = 3.0, Mode = 4, SD = 1.276
36) Age- Recoded (n=657)
18-34 204 31.1
35-44 135 20.5
45-54 183 27.9
55 and above 127 19.3
Prefer not to disclose 6 0.9
Missing 2 0.3
26) Mental Health License*
None 326 49.6
LPC (or LMHC, LCPC, 261 39.7
CPC, LPCC)
LMFT 16 2.4
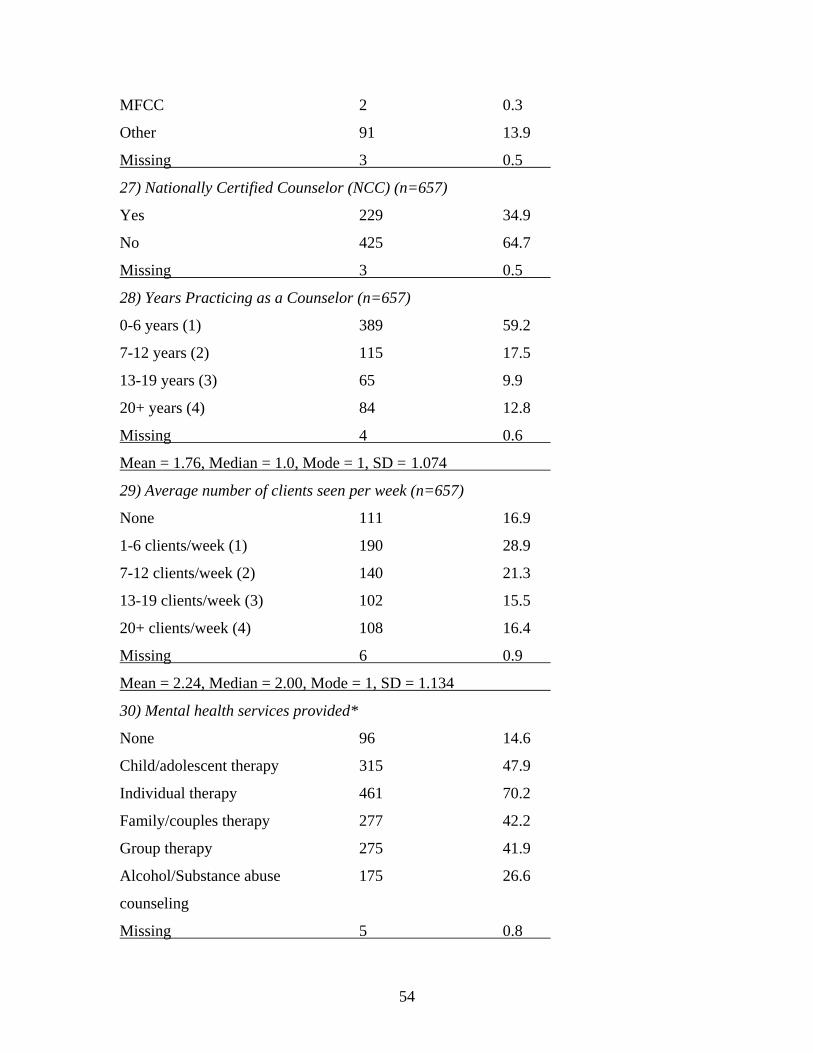
54
MFCC 2 0.3
Other 91 13.9
Missing 3 0.5
27) Nationally Certified Counselor (NCC) (n=657)
Yes 229 34.9
No 425 64.7
Missing 3 0.5
28) Years Practicing as a Counselor (n=657)
0-6 years (1) 389 59.2
7-12 years (2) 115 17.5
13-19 years (3) 65 9.9
20+ years (4) 84 12.8
Missing 4 0.6
Mean = 1.76, Median = 1.0, Mode = 1, SD = 1.074
29) Average number of clients seen per week (n=657)
None 111 16.9
1-6 clients/week (1) 190 28.9
7-12 clients/week (2) 140 21.3
13-19 clients/week (3) 102 15.5
20+ clients/week (4) 108 16.4
Missing 6 0.9
Mean = 2.24, Median = 2.00, Mode = 1, SD = 1.134
30) Mental health services provided*
None 96 14.6
Child/adolescent therapy 315 47.9
Individual therapy 461 70.2
Family/couples therapy 277 42.2
Group therapy 275 41.9
Alcohol/Substance abuse 175 26.6
counseling
Missing 5 0.8
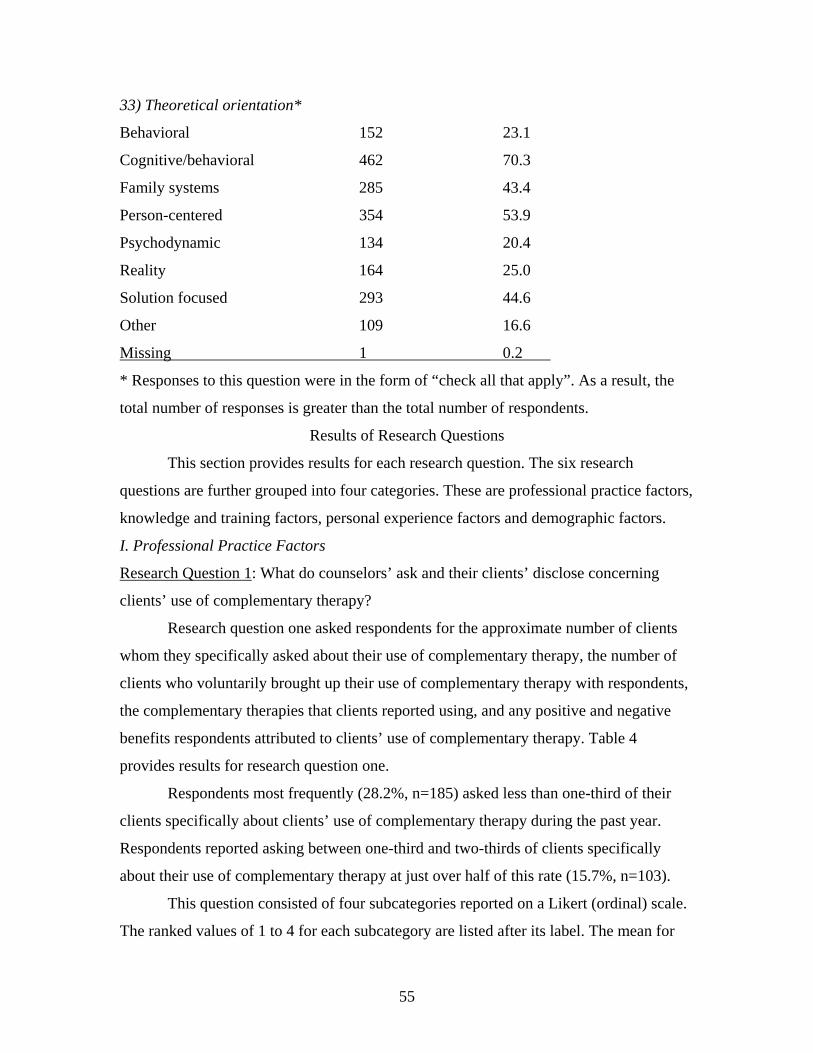
55
33) Theoretical orientation*
Behavioral 152 23.1
Cognitive/behavioral 462 70.3
Family systems 285 43.4
Person-centered 354 53.9
Psychodynamic 134 20.4
Reality 164 25.0
Solution focused 293 44.6
Other 109 16.6
Missing 1 0.2
* Responses to this question were in the form of “check all that apply”. As a result, the
total number of responses is greater than the total number of respondents.
Results of Research Questions
This section provides results for each research question. The six research
questions are further grouped into four categories. These are professional practice factors,
knowledge and training factors, personal experience factors and demographic factors.
I. Professional Practice Factors
Research Question 1: What do counselors’ ask and their clients’ disclose concerning
clients’ use of complementary therapy?
Research question one asked respondents for the approximate number of clients
whom they specifically asked about their use of complementary therapy, the number of
clients who voluntarily brought up their use of complementary therapy with respondents,
the complementary therapies that clients reported using, and any positive and negative
benefits respondents attributed to clients’ use of complementary therapy. Table 4
provides results for research question one.
Respondents most frequently (28.2%, n=185) asked less than one-third of their
clients specifically about clients’ use of complementary therapy during the past year.
Respondents reported asking between one-third and two-thirds of clients specifically
about their use of complementary therapy at just over half of this rate (15.7%, n=103).
This question consisted of four subcategories reported on a Likert (ordinal) scale.
The ranked values of 1 to 4 for each subcategory are listed after its label. The mean for
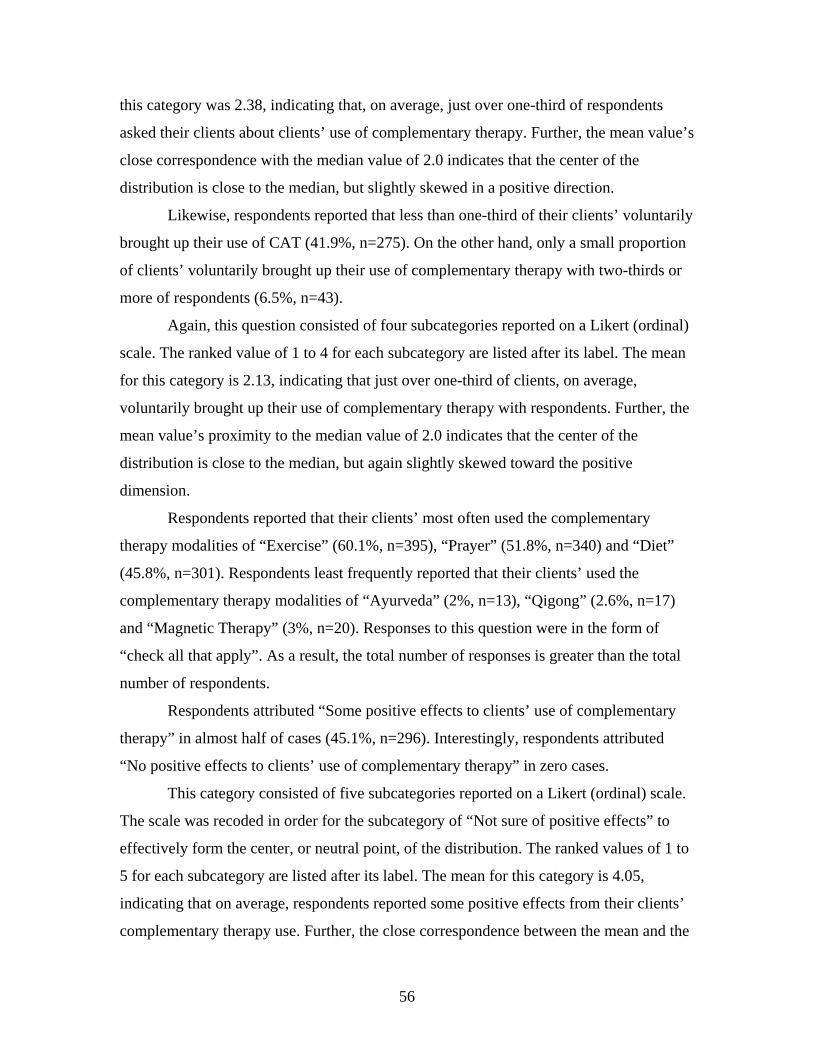
56
this category was 2.38, indicating that, on average, just over one-third of respondents
asked their clients about clients’ use of complementary therapy. Further, the mean value’s
close correspondence with the median value of 2.0 indicates that the center of the
distribution is close to the median, but slightly skewed in a positive direction.
Likewise, respondents reported that less than one-third of their clients’ voluntarily
brought up their use of CAT (41.9%, n=275). On the other hand, only a small proportion
of clients’ voluntarily brought up their use of complementary therapy with two-thirds or
more of respondents (6.5%, n=43).
Again, this question consisted of four subcategories reported on a Likert (ordinal)
scale. The ranked value of 1 to 4 for each subcategory are listed after its label. The mean
for this category is 2.13, indicating that just over one-third of clients, on average,
voluntarily brought up their use of complementary therapy with respondents. Further, the
mean value’s proximity to the median value of 2.0 indicates that the center of the
distribution is close to the median, but again slightly skewed toward the positive
dimension.
Respondents reported that their clients’ most often used the complementary
therapy modalities of “Exercise” (60.1%, n=395), “Prayer” (51.8%, n=340) and “Diet”
(45.8%, n=301). Respondents least frequently reported that their clients’ used the
complementary therapy modalities of “Ayurveda” (2%, n=13), “Qigong” (2.6%, n=17)
and “Magnetic Therapy” (3%, n=20). Responses to this question were in the form of
“check all that apply”. As a result, the total number of responses is greater than the total
number of respondents.
Respondents attributed “Some positive effects to clients’ use of complementary
therapy” in almost half of cases (45.1%, n=296). Interestingly, respondents attributed
“No positive effects to clients’ use of complementary therapy” in zero cases.
This category consisted of five subcategories reported on a Likert (ordinal) scale.
The scale was recoded in order for the subcategory of “Not sure of positive effects” to
effectively form the center, or neutral point, of the distribution. The ranked values of 1 to
5 for each subcategory are listed after its label. The mean for this category is 4.05,
indicating that on average, respondents reported some positive effects from their clients’
complementary therapy use. Further, the close correspondence between the mean and the
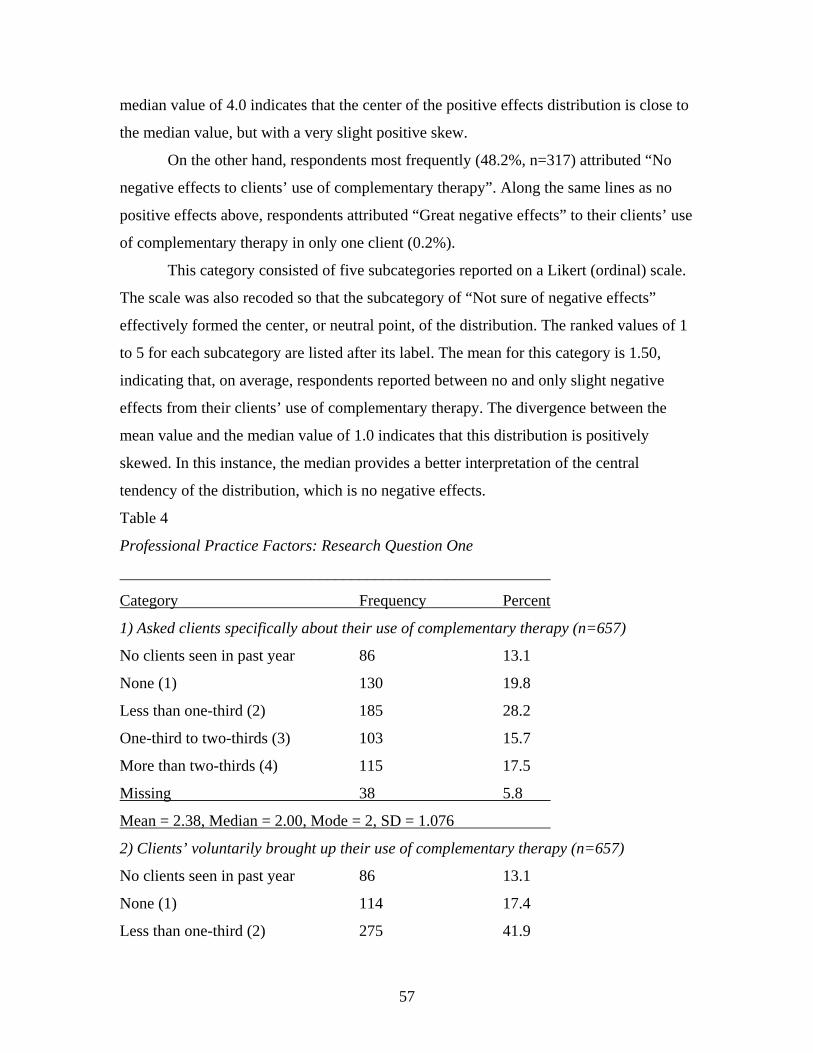
57
median value of 4.0 indicates that the center of the positive effects distribution is close to
the median value, but with a very slight positive skew.
On the other hand, respondents most frequently (48.2%, n=317) attributed “No
negative effects to clients’ use of complementary therapy”. Along the same lines as no
positive effects above, respondents attributed “Great negative effects” to their clients’ use
of complementary therapy in only one client (0.2%).
This category consisted of five subcategories reported on a Likert (ordinal) scale.
The scale was also recoded so that the subcategory of “Not sure of negative effects”
effectively formed the center, or neutral point, of the distribution. The ranked values of 1
to 5 for each subcategory are listed after its label. The mean for this category is 1.50,
indicating that, on average, respondents reported between no and only slight negative
effects from their clients’ use of complementary therapy. The divergence between the
mean value and the median value of 1.0 indicates that this distribution is positively
skewed. In this instance, the median provides a better interpretation of the central
tendency of the distribution, which is no negative effects.
Table 4
Professional Practice Factors: Research Question One
______________________________________________________
Category Frequency Percent
1) Asked clients specifically about their use of complementary therapy (n=657)
No clients seen in past year 86 13.1
None (1) 130 19.8
Less than one-third (2) 185 28.2
One-third to two-thirds (3) 103 15.7
More than two-thirds (4) 115 17.5
Missing 38 5.8
Mean = 2.38, Median = 2.00, Mode = 2, SD = 1.076
2) Clients’ voluntarily brought up their use of complementary therapy (n=657)
No clients seen in past year 86 13.1
None (1) 114 17.4
Less than one-third (2) 275 41.9
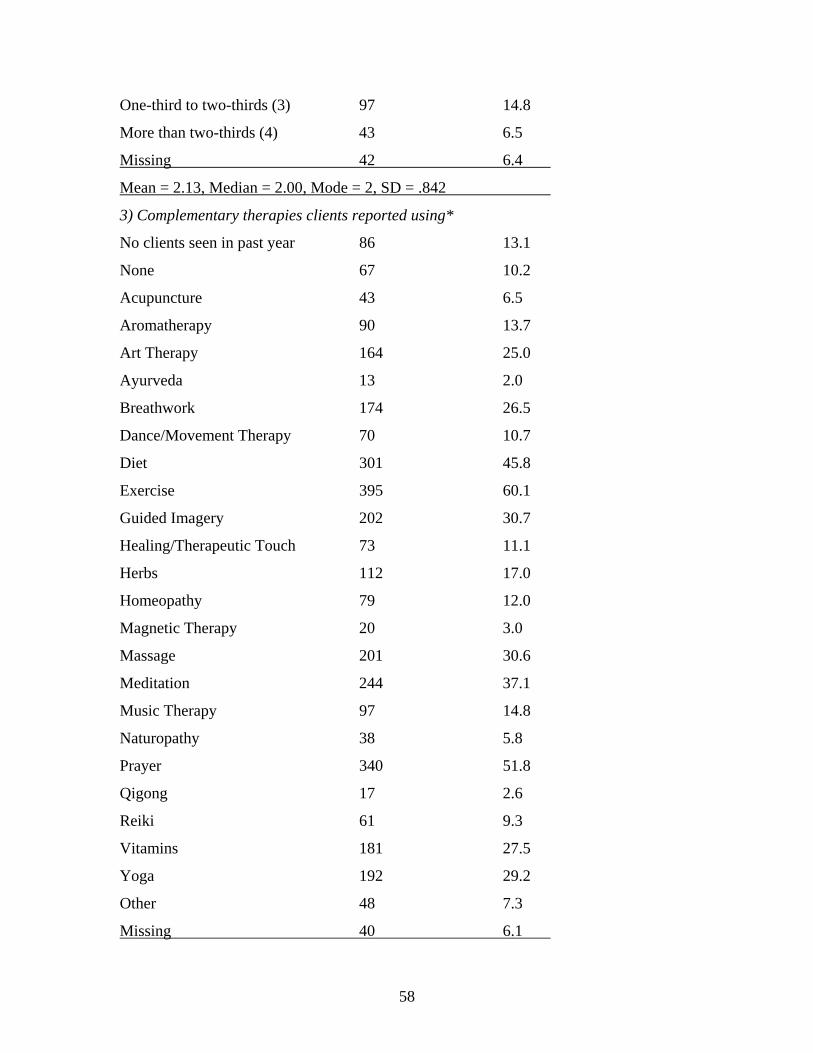
58
One-third to two-thirds (3) 97 14.8
More than two-thirds (4) 43 6.5
Missing 42 6.4
Mean = 2.13, Median = 2.00, Mode = 2, SD = .842
3) Complementary therapies clients reported using*
No clients seen in past year 86 13.1
None 67 10.2
Acupuncture 43 6.5
Aromatherapy 90 13.7
Art Therapy 164 25.0
Ayurveda 13 2.0
Breathwork 174 26.5
Dance/Movement Therapy 70 10.7
Diet 301 45.8
Exercise 395 60.1
Guided Imagery 202 30.7
Healing/Therapeutic Touch 73 11.1
Herbs 112 17.0
Homeopathy 79 12.0
Magnetic Therapy 20 3.0
Massage 201 30.6
Meditation 244 37.1
Music Therapy 97 14.8
Naturopathy 38 5.8
Prayer 340 51.8
Qigong 17 2.6
Reiki 61 9.3
Vitamins 181 27.5
Yoga 192 29.2
Other 48 7.3
Missing 40 6.1
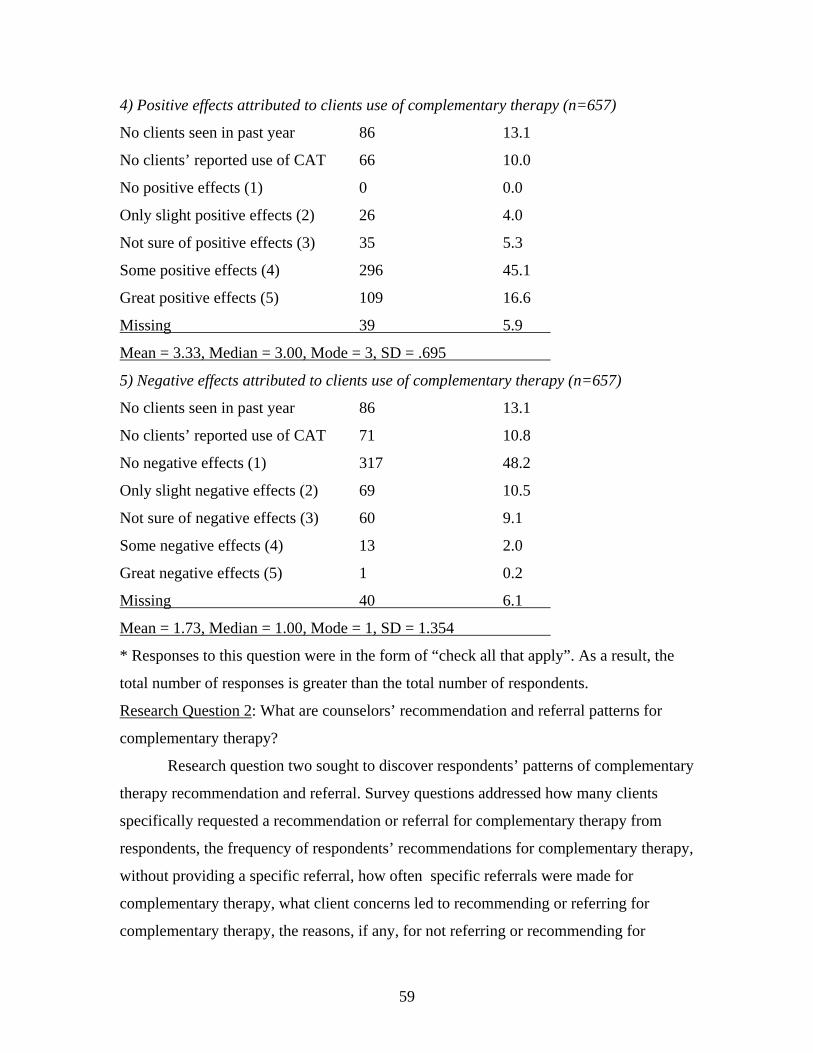
59
4) Positive effects attributed to clients use of complementary therapy (n=657)
No clients seen in past year 86 13.1
No clients’ reported use of CAT 66 10.0
No positive effects (1) 0 0.0
Only slight positive effects (2) 26 4.0
Not sure of positive effects (3) 35 5.3
Some positive effects (4) 296 45.1
Great positive effects (5) 109 16.6
Missing 39 5.9
Mean = 3.33, Median = 3.00, Mode = 3, SD = .695
5) Negative effects attributed to clients use of complementary therapy (n=657)
No clients seen in past year 86 13.1
No clients’ reported use of CAT 71 10.8
No negative effects (1) 317 48.2
Only slight negative effects (2) 69 10.5
Not sure of negative effects (3) 60 9.1
Some negative effects (4) 13 2.0
Great negative effects (5) 1 0.2
Missing 40 6.1
Mean = 1.73, Median = 1.00, Mode = 1, SD = 1.354
* Responses to this question were in the form of “check all that apply”. As a result, the
total number of responses is greater than the total number of respondents.
Research Question 2: What are counselors’ recommendation and referral patterns for
complementary therapy?
Research question two sought to discover respondents’ patterns of complementary
therapy recommendation and referral. Survey questions addressed how many clients
specifically requested a recommendation or referral for complementary therapy from
respondents, the frequency of respondents’ recommendations for complementary therapy,
without providing a specific referral, how often specific referrals were made for
complementary therapy, what client concerns led to recommending or referring for
complementary therapy, the reasons, if any, for not referring or recommending for
60
complementary therapy, and the importance that referrals are to licensed or certified
complementary therapy practitioners. Table 5 shows the results for research question two.
It was most common (46.4%, n=305) for no clients to specifically request a
recommendation or referral for complementary therapy from respondents. Least common
(2%, n=13), was the case where more than two-thirds of clients specifically requested a
recommendation or referral for complementary therapy from respondents.
This category consisted of four subcategories reported on a Likert (ordinal) scale.
The ordered values of 1 to 4 for each subcategory are listed after its label. The mean for
this category is 1.53, indicating that between none and one-third of clients specifically
requested a recommendation or referral for complementary therapy from respondents.
The difference between the mean value and the median value of 1.0 indicates that the
distribution is positively skewed. In this instance, the median provides a better
interpretation of the central tendency of the distribution, which is that no clients
specifically requested a recommendation or referral for complementary therapy from
respondents
Most often, less than one-third of respondents (n=218, 33.4%) recommended
complementary therapy to a client, without providing a specific referral. On the other
hand, respondents were least likely (2.1%, n=14) to recommended complementary
therapy to a client, without providing a specific referral for two-thirds or more of clients.
This category consisted of four subcategories reported on a Likert (ordinal) scale.
The ordered values of 1 to 4 for each subcategory are listed after its label. The mean for
this category is 2.03, indicating that indicating that less than one-third of the time
respondents recommended complementary therapy for a client without providing a
specific referral. Further, the mean value’s close correspondence with the median value
of 2.0 indicates that the center of the distribution is very close to the median.
When asked how often they provided clients with a specific referral for
complementary therapy, the greatest percentage of respondents answered “Never”
(38.5%, n=253). Only a few respondents (2.1%, n=14) provided more than two-thirds of
clients with a specific referral for complementary therapy.
Again, this category consisted of four subcategories reported on a Likert (ordinal)
scale. The ordered values of 1 to 4 for each subcategory are listed after its label. The
61
mean for this category is 1.67, indicating that less than one-third of the time respondents
provided clients with a specific referral for complementary therapy. The difference
between the mean value and the median value of 1.0 indicates that the center of the
income distribution is negatively skewed. In this instance, the median provides a better
interpretation of the central tendency of the distribution, which is that respondents never
provided clients with a specific referral for complementary therapy.
The most common client concerns for which respondents provided
complementary therapy recommendations or referrals were “Anxiety” (52.7%, n=346),
followed closely by “Depression” (51.6%, n=339). The least common client concern for
which respondents provided a complementary therapy recommendation or referral was
“Personality disorder” (9.4%, n=62). Note that the ubiquitous “Other” category of client
concerns actually resulted in only a 7% (n=46) recommendation or referral rate.
Responses to this question were in the form of “check all that apply”. As a result, the
total number of responses is greater than the total number of respondents.
The most common reasons for not referring or recommending complementary
therapy to clients were “Not having it come up as a client concern” (32.4%, n=213),
followed closely by “Client discomfort with complementary therapy” (28.6%, n=188),
“Lack of knowledge and/or training in complementary therapy” (26.6%, n=175) and “Not
sure who to refer to” (26.2%, n=172). Least frequently cited reasons for not referring or
recommending complementary therapy to clients were “Incongruence with beliefs about
client change” (2.1%, n=14) and “Poor acceptance by counseling profession” (3%, n=20).
Again, responses to this question were in the form of “check all that apply”. As a result,
the total number of responses is greater than the total number of respondents.
Almost half of respondents (46.4%, n=305) reported that it was “Very important”
that any referrals they provide are to licensed or certified complementary therapy
practitioners. Not surprisingly, only a small percentage of respondents (2.7%, n=18)
stated that it was “Not important at all” that referrals were to licensed or certified
complementary therapy practitioners.
Lastly, this category consisted of four subcategories reported on a Likert (ordinal)
scale. The scale was recoded so that the subcategory of “Not sure of importance”
effectively formed the center, or neutral point, of the distribution. The ordered values of 1
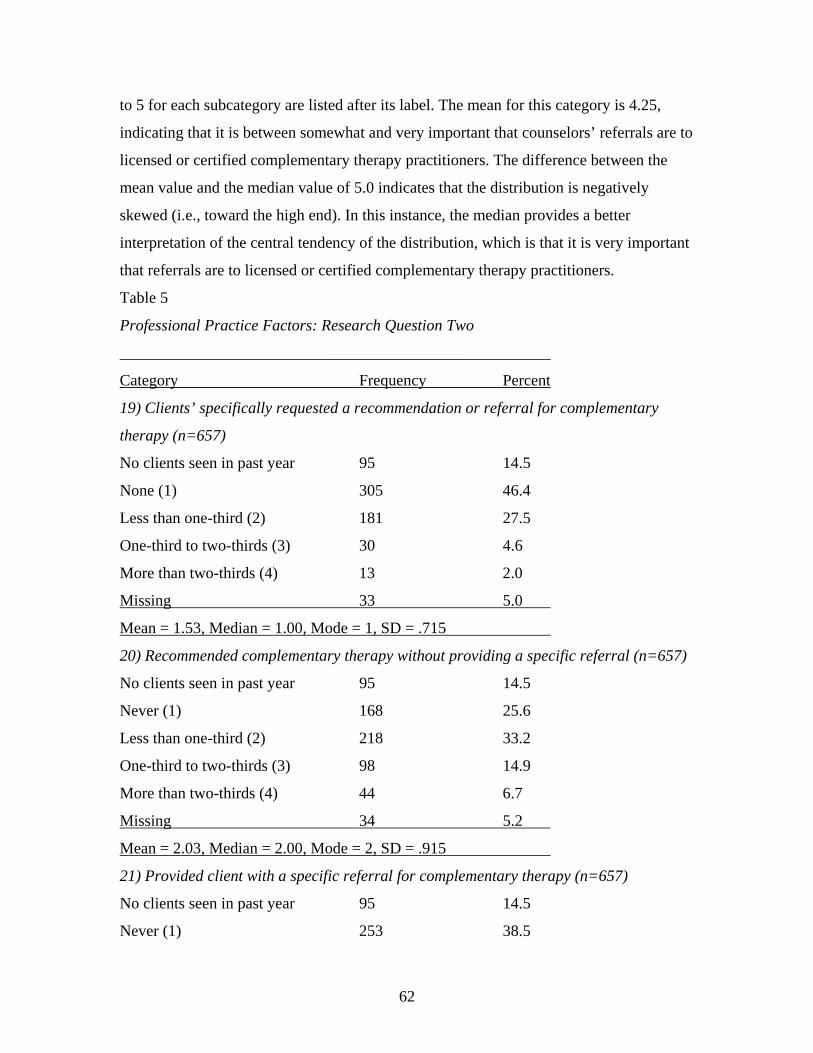
62
to 5 for each subcategory are listed after its label. The mean for this category is 4.25,
indicating that it is between somewhat and very important that counselors’ referrals are to
licensed or certified complementary therapy practitioners. The difference between the
mean value and the median value of 5.0 indicates that the distribution is negatively
skewed (i.e., toward the high end). In this instance, the median provides a better
interpretation of the central tendency of the distribution, which is that it is very important
that referrals are to licensed or certified complementary therapy practitioners.
Table 5
Professional Practice Factors: Research Question Two
______________________________________________________
Category Frequency Percent
19) Clients’ specifically requested a recommendation or referral for complementary
therapy (n=657)
No clients seen in past year 95 14.5
None (1) 305 46.4
Less than one-third (2) 181 27.5
One-third to two-thirds (3) 30 4.6
More than two-thirds (4) 13 2.0
Missing 33 5.0
Mean = 1.53, Median = 1.00, Mode = 1, SD = .715
20) Recommended complementary therapy without providing a specific referral (n=657)
No clients seen in past year 95 14.5
Never (1) 168 25.6
Less than one-third (2) 218 33.2
One-third to two-thirds (3) 98 14.9
More than two-thirds (4) 44 6.7
Missing 34 5.2
Mean = 2.03, Median = 2.00, Mode = 2, SD = .915
21) Provided client with a specific referral for complementary therapy (n=657)
No clients seen in past year 95 14.5
Never (1) 253 38.5
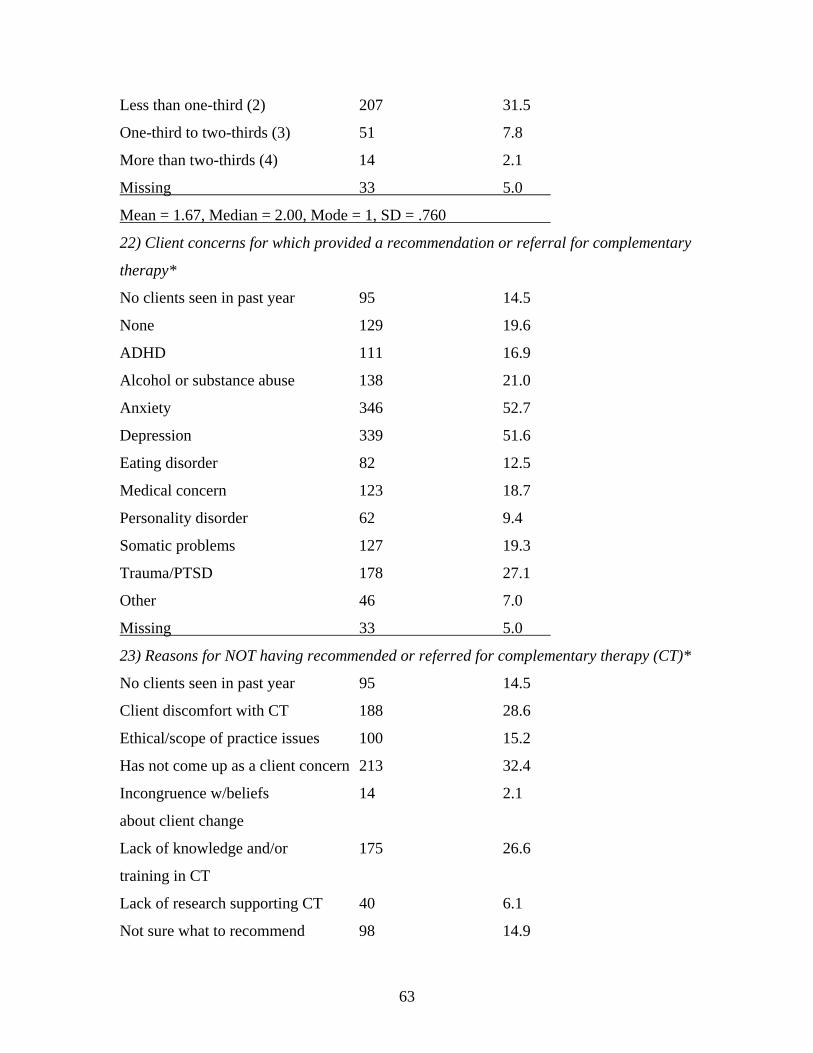
63
Less than one-third (2) 207 31.5
One-third to two-thirds (3) 51 7.8
More than two-thirds (4) 14 2.1
Missing 33 5.0
Mean = 1.67, Median = 2.00, Mode = 1, SD = .760
22) Client concerns for which provided a recommendation or referral for complementary
therapy*
No clients seen in past year 95 14.5
None 129 19.6
ADHD 111 16.9
Alcohol or substance abuse 138 21.0
Anxiety 346 52.7
Depression 339 51.6
Eating disorder 82 12.5
Medical concern 123 18.7
Personality disorder 62 9.4
Somatic problems 127 19.3
Trauma/PTSD 178 27.1
Other 46 7.0
Missing 33 5.0
23) Reasons for NOT having recommended or referred for complementary therapy (CT)*
No clients seen in past year 95 14.5
Client discomfort with CT 188 28.6
Ethical/scope of practice issues 100 15.2
Has not come up as a client concern 213 32.4
Incongruence w/beliefs 14 2.1
about client change
Lack of knowledge and/or 175 26.6
training in CT
Lack of research supporting CT 40 6.1
Not sure what to recommend 98 14.9
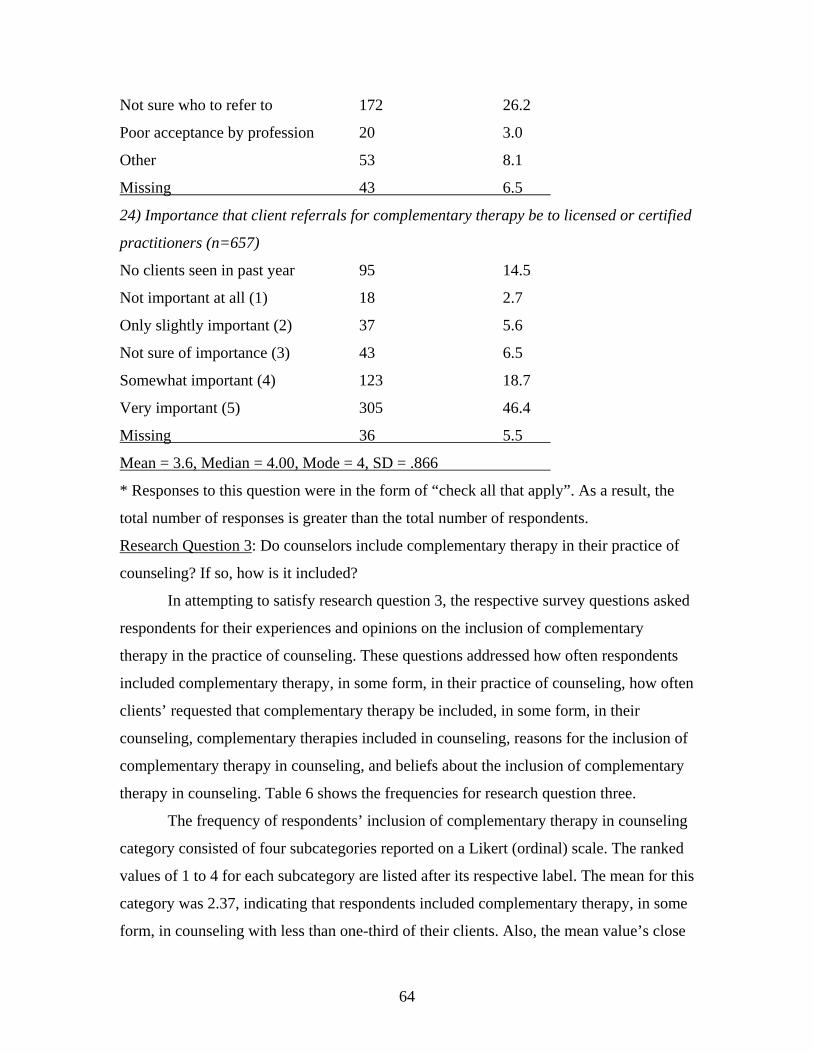
64
Not sure who to refer to 172 26.2
Poor acceptance by profession 20 3.0
Other 53 8.1
Missing 43 6.5
24) Importance that client referrals for complementary therapy be to licensed or certified
practitioners (n=657)
No clients seen in past year 95 14.5
Not important at all (1) 18 2.7
Only slightly important (2) 37 5.6
Not sure of importance (3) 43 6.5
Somewhat important (4) 123 18.7
Very important (5) 305 46.4
Missing 36 5.5
Mean = 3.6, Median = 4.00, Mode = 4, SD = .866
* Responses to this question were in the form of “check all that apply”. As a result, the
total number of responses is greater than the total number of respondents.
Research Question 3: Do counselors include complementary therapy in their practice of
counseling? If so, how is it included?
In attempting to satisfy research question 3, the respective survey questions asked
respondents for their experiences and opinions on the inclusion of complementary
therapy in the practice of counseling. These questions addressed how often respondents
included complementary therapy, in some form, in their practice of counseling, how often
clients’ requested that complementary therapy be included, in some form, in their
counseling, complementary therapies included in counseling, reasons for the inclusion of
complementary therapy in counseling, and beliefs about the inclusion of complementary
therapy in counseling. Table 6 shows the frequencies for research question three.
The frequency of respondents’ inclusion of complementary therapy in counseling
category consisted of four subcategories reported on a Likert (ordinal) scale. The ranked
values of 1 to 4 for each subcategory are listed after its respective label. The mean for this
category was 2.37, indicating that respondents included complementary therapy, in some
form, in counseling with less than one-third of their clients. Also, the mean value’s close
65
correspondence with the median value of 2.0 indicates that the center of the distribution
is close to the median, but somewhat skewed in a positive direction (i.e., more results at
the low end of the scale).
Over one-third of respondents (34.7%, n=228) included complementary therapy,
in some form, in their counseling with just one-third or less of clients. Only 12.5%
(n=82) of respondents included complementary therapy, in some form, with two-thirds or
more of their clients.
The frequency of clients’ requesting the inclusion of complementary therapy in
their counseling category consisted of four subcategories reported on a Likert (ordinal)
scale. The values of 1 to 4 for each subcategory are listed after its respective label. The
mean for this category was 1.83, indicating that slightly less than one-third of clients
requested the inclusion of complementary therapy, in some form, in their counseling.
Also, the mean value’s close correspondence with the median value of 2.0 indicates that
the center of the distribution is close to the median, but with a slight negative skew.
Once again, over one-third of respondents (36.2%, n=238) reported that their
clients requested the inclusion of complementary therapy, in some form, in their
counseling. In fact, if consideration is given the number of clients that “Never” requested
the inclusion of complementary therapy, over two-thirds of clients (67.1%, n=441) made
requests of this nature to their counselors less than one third of the time. Furthermore,
only a small percentage of respondents (4.1%, n=27) had two-thirds or greater of their
clients request the inclusion of complementary therapy in their counseling.
For respondents who included complementary therapy in their practice of
counseling, “Guided Imagery” was most frequently cited (40.5%, n=266), followed
closely by “Exercise” (39.3%, n=258). The least number of respondents employed the
complementary therapy modalities of “Ayurveda” and “Magnetic Therapy” in counseling
(0.3%, n=2, each). Responses to this question were in the form of “check all that apply”.
As a result, the total number of responses is greater than the total number of respondents.
The principal motivations for respondents to include complementary therapy in
their practice of counseling was “Congruence with beliefs about client change” (43.2%,
n=284), followed by “Personal experience with complementary therapy” (38.5%, n=253).
On the other hand, respondents were least likely to be motivated to include
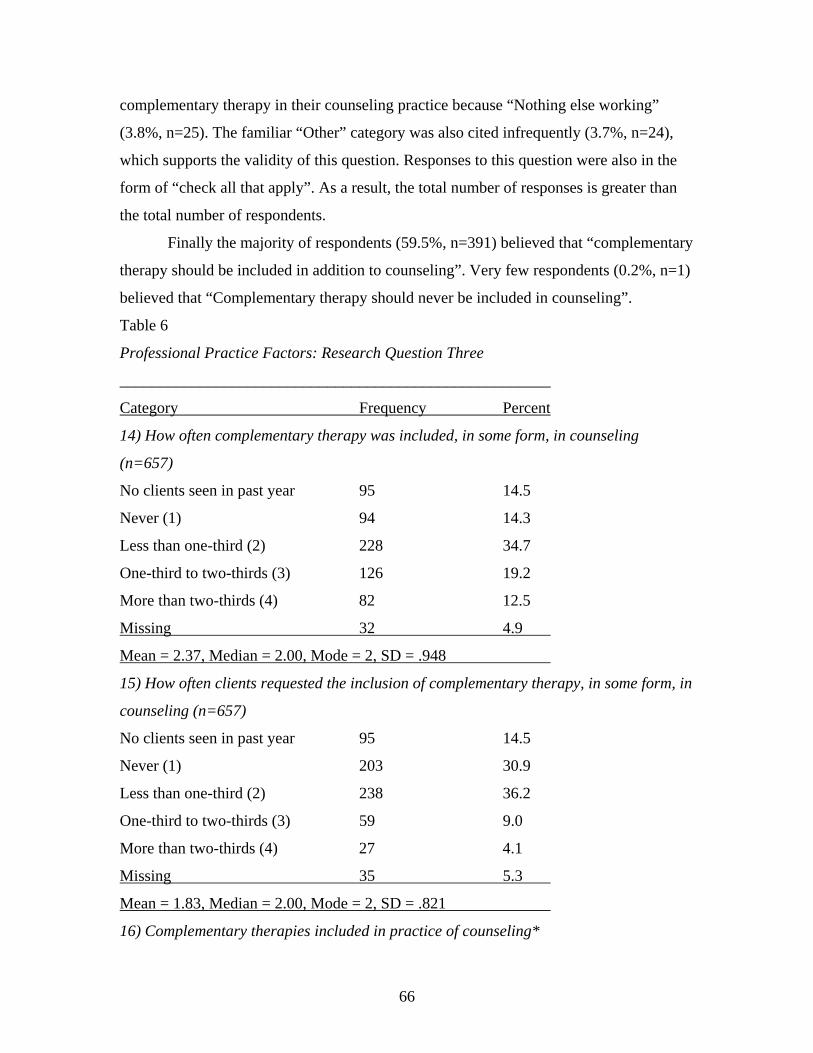
66
complementary therapy in their counseling practice because “Nothing else working”
(3.8%, n=25). The familiar “Other” category was also cited infrequently (3.7%, n=24),
which supports the validity of this question. Responses to this question were also in the
form of “check all that apply”. As a result, the total number of responses is greater than
the total number of respondents.
Finally the majority of respondents (59.5%, n=391) believed that “complementary
therapy should be included in addition to counseling”. Very few respondents (0.2%, n=1)
believed that “Complementary therapy should never be included in counseling”.
Table 6
Professional Practice Factors: Research Question Three
______________________________________________________
Category Frequency Percent
14) How often complementary therapy was included, in some form, in counseling
(n=657)
No clients seen in past year 95 14.5
Never (1) 94 14.3
Less than one-third (2) 228 34.7
One-third to two-thirds (3) 126 19.2
More than two-thirds (4) 82 12.5
Missing 32 4.9
Mean = 2.37, Median = 2.00, Mode = 2, SD = .948
15) How often clients requested the inclusion of complementary therapy, in some form, in
counseling (n=657)
No clients seen in past year 95 14.5
Never (1) 203 30.9
Less than one-third (2) 238 36.2
One-third to two-thirds (3) 59 9.0
More than two-thirds (4) 27 4.1
Missing 35 5.3
Mean = 1.83, Median = 2.00, Mode = 2, SD = .821
16) Complementary therapies included in practice of counseling*
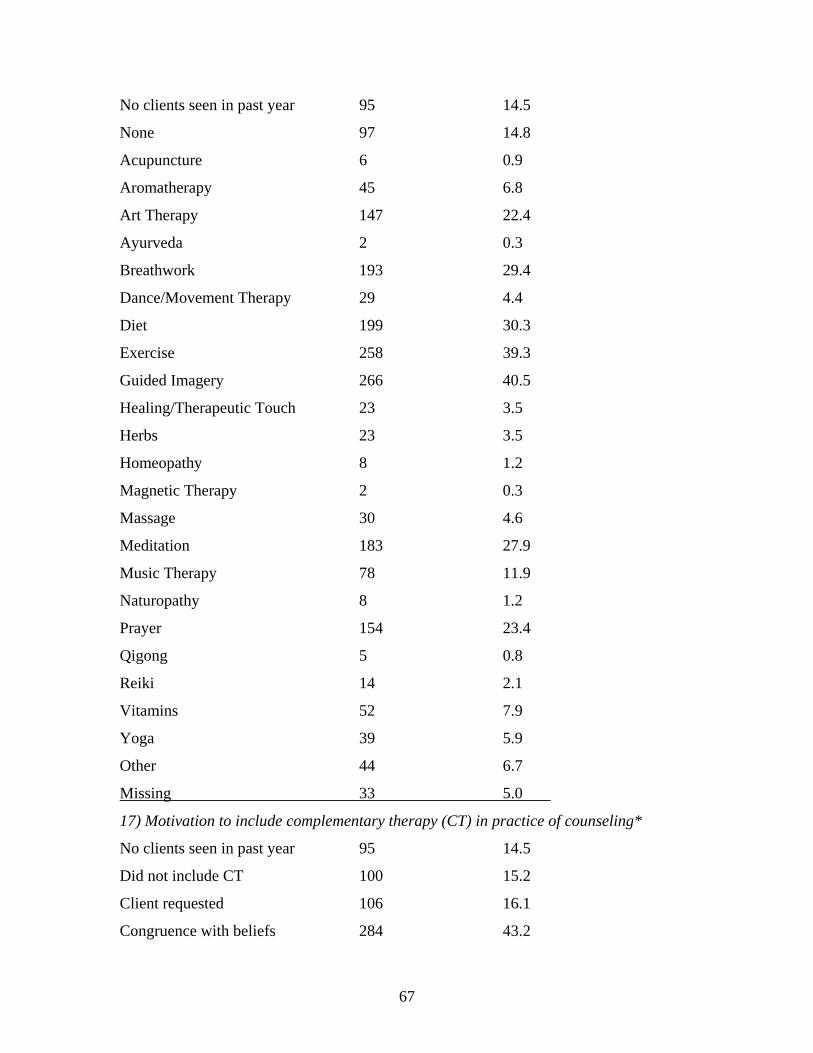
67
No clients seen in past year 95 14.5
None 97 14.8
Acupuncture 6 0.9
Aromatherapy 45 6.8
Art Therapy 147 22.4
Ayurveda 2 0.3
Breathwork 193 29.4
Dance/Movement Therapy 29 4.4
Diet 199 30.3
Exercise 258 39.3
Guided Imagery 266 40.5
Healing/Therapeutic Touch 23 3.5
Herbs 23 3.5
Homeopathy 8 1.2
Magnetic Therapy 2 0.3
Massage 30 4.6
Meditation 183 27.9
Music Therapy 78 11.9
Naturopathy 8 1.2
Prayer 154 23.4
Qigong 5 0.8
Reiki 14 2.1
Vitamins 52 7.9
Yoga 39 5.9
Other 44 6.7
Missing 33 5.0
17) Motivation to include complementary therapy (CT) in practice of counseling*
No clients seen in past year 95 14.5
Did not include CT 100 15.2
Client requested 106 16.1
Congruence with beliefs 284 43.2
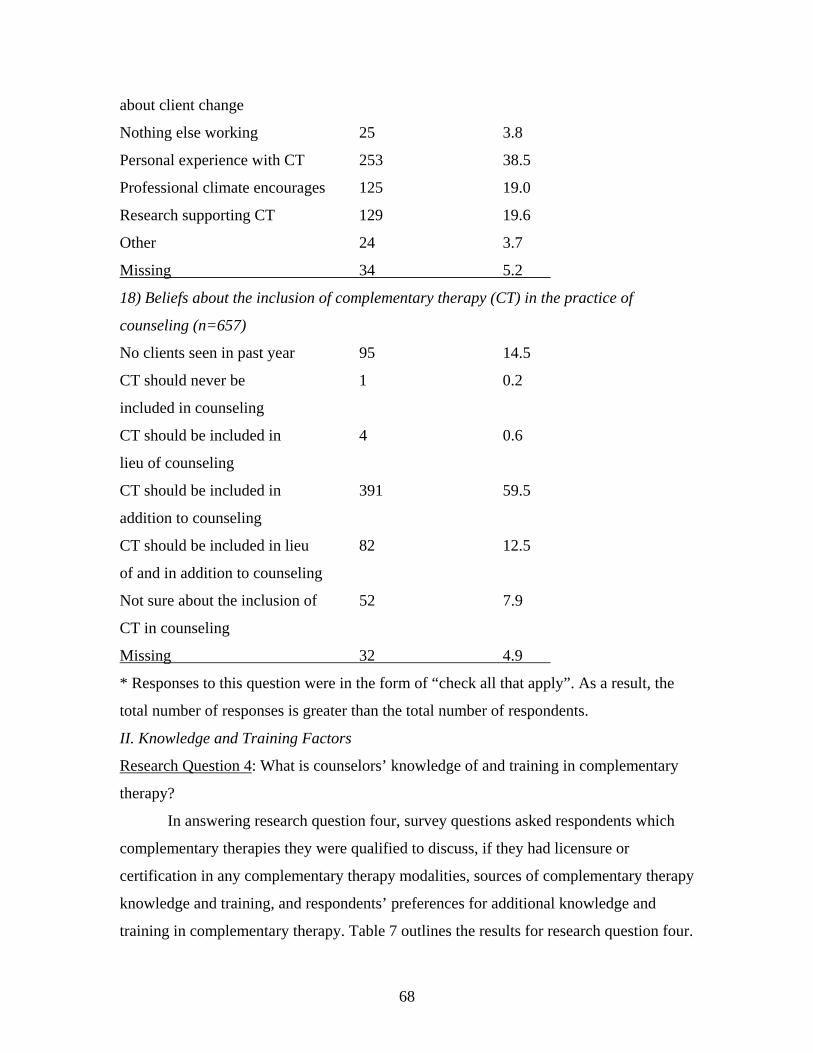
68
about client change
Nothing else working 25 3.8
Personal experience with CT 253 38.5
Professional climate encourages 125 19.0
Research supporting CT 129 19.6
Other 24 3.7
Missing 34 5.2
18) Beliefs about the inclusion of complementary therapy (CT) in the practice of
counseling (n=657)
No clients seen in past year 95 14.5
CT should never be 1 0.2
included in counseling
CT should be included in 4 0.6
lieu of counseling
CT should be included in 391 59.5
addition to counseling
CT should be included in lieu 82 12.5
of and in addition to counseling
Not sure about the inclusion of 52 7.9
CT in counseling
Missing 32 4.9
* Responses to this question were in the form of “check all that apply”. As a result, the
total number of responses is greater than the total number of respondents.
II. Knowledge and Training Factors
Research Question 4: What is counselors’ knowledge of and training in complementary
therapy?
In answering research question four, survey questions asked respondents which
complementary therapies they were qualified to discuss, if they had licensure or
certification in any complementary therapy modalities, sources of complementary therapy
knowledge and training, and respondents’ preferences for additional knowledge and
training in complementary therapy. Table 7 outlines the results for research question four.
69
Note that this research question contained no ordinal variables and, therefore, did not
make use of Likert scales.
The majority of respondents reported that they were qualified to discuss the
complementary therapies of “Exercise” (46.9%, n=306), “Guided Imagery” (43.7%,
n=287) and “Prayer” (39.9%, n=260). Only a few respondents declared themselves
qualified to discuss the complementary therapies of “Magnetic Therapy” (1.4%, n=9),
“Ayurveda (1.5%, n=10), or “Qigong” (2.1%, n=14). Interestingly, almost one-fourth of
respondents (23.5%, n=153) felt they were not qualified to discuss any complementary
therapy modalities. Responses to this question were in the form of “check all that apply”.
As a result, the total number of responses is greater than the total number of respondents.
Regarding complementary therapy licensure or certification, almost 80 percent of
respondents (79.9%, n=525) are not licensed or certified in any complementary therapy
Modality. For those respondents that do possess a complementary therapy license or
certification, the ubiquitous “Other” category was most frequently cited (6.1%, n=40).
Otherwise, the specific complementary therapy modalities of “Reiki” (3.7%, n=24),
“Guided Imagery” and “Meditation” (both 2.3%, n=15) were most common. A total of
eight complementary therapy modalities did not have any respondents reporting they
were either licensed or certified. These included, “Acupuncture”, “Aromatherapy”,
“Herbs”, “Homeopathy”, “Magnetic Therapy”, “Music Therapy”, “Naturopathy”, and
“Vitamins”. Responses to this question were in the form of “check all that apply”. As a
result, the total number of responses is greater than the total number of respondents.
For most respondents (62.3%, n=409), “Books” served as a source of knowledge
or training in complementary therapy. This was followed by “Personal experience with
complementary therapy” as a source of knowledge or training in just less than half of
respondents (47.8%, n=314). Fewer that 13 percent (12.9%, n=85) of respondents used
“Video/DVD” to enhance their complementary therapy knowledge or training. The now
familiar “Other” category was the least frequently cited (2.9%, n=19) source of
knowledge or training in complementary therapy, furthering the validity of this question.
Again, responses to this question were in the form of “check all that apply”. As a result,
the total number of responses is greater than the total number of respondents.
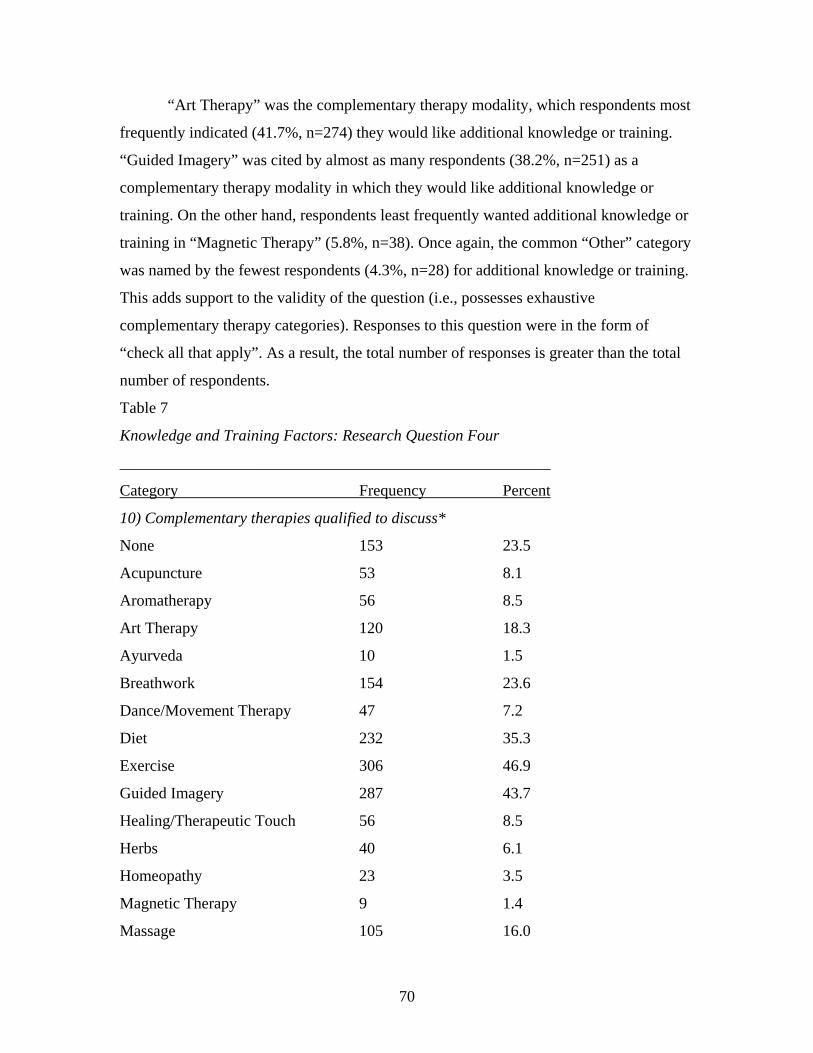
70
“Art Therapy” was the complementary therapy modality, which respondents most
frequently indicated (41.7%, n=274) they would like additional knowledge or training.
“Guided Imagery” was cited by almost as many respondents (38.2%, n=251) as a
complementary therapy modality in which they would like additional knowledge or
training. On the other hand, respondents least frequently wanted additional knowledge or
training in “Magnetic Therapy” (5.8%, n=38). Once again, the common “Other” category
was named by the fewest respondents (4.3%, n=28) for additional knowledge or training.
This adds support to the validity of the question (i.e., possesses exhaustive
complementary therapy categories). Responses to this question were in the form of
“check all that apply”. As a result, the total number of responses is greater than the total
number of respondents.
Table 7
Knowledge and Training Factors: Research Question Four
______________________________________________________
Category Frequency Percent
10) Complementary therapies qualified to discuss*
None 153 23.5
Acupuncture 53 8.1
Aromatherapy 56 8.5
Art Therapy 120 18.3
Ayurveda 10 1.5
Breathwork 154 23.6
Dance/Movement Therapy 47 7.2
Diet 232 35.3
Exercise 306 46.9
Guided Imagery 287 43.7
Healing/Therapeutic Touch 56 8.5
Herbs 40 6.1
Homeopathy 23 3.5
Magnetic Therapy 9 1.4
Massage 105 16.0
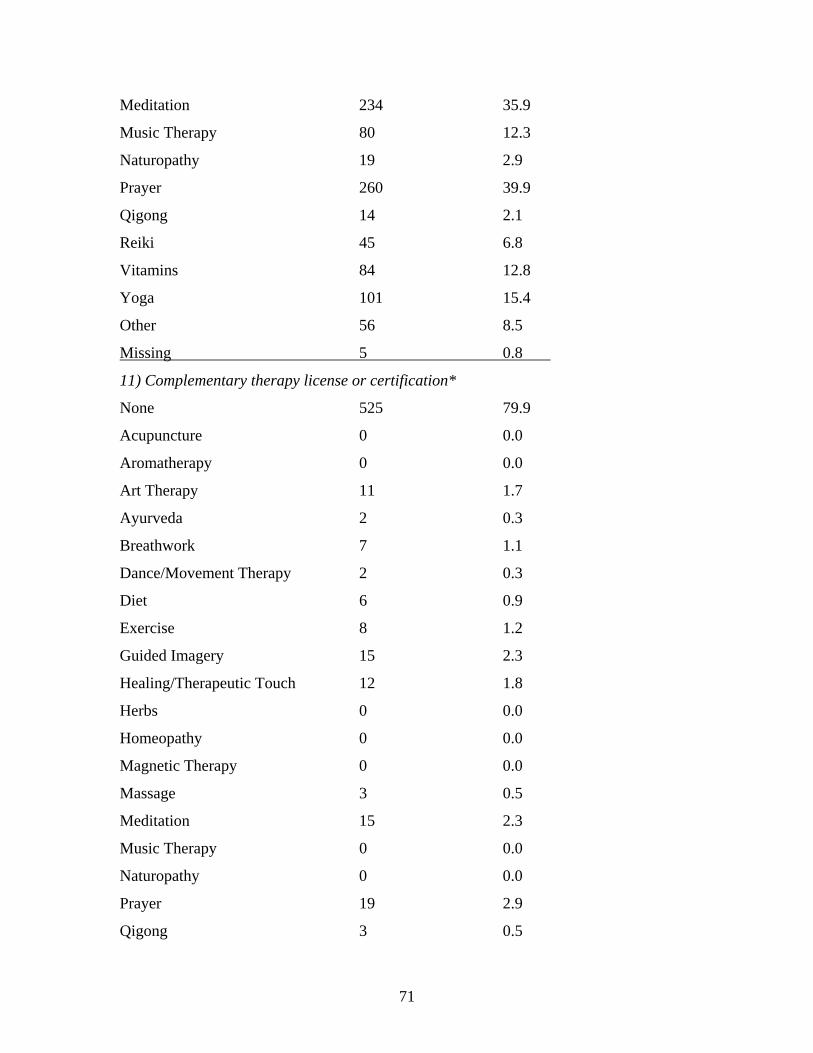
71
Meditation 234 35.9
Music Therapy 80 12.3
Naturopathy 19 2.9
Prayer 260 39.9
Qigong 14 2.1
Reiki 45 6.8
Vitamins 84 12.8
Yoga 101 15.4
Other 56 8.5
Missing 5 0.8
11) Complementary therapy license or certification*
None 525 79.9
Acupuncture 0 0.0
Aromatherapy 0 0.0
Art Therapy 11 1.7
Ayurveda 2 0.3
Breathwork 7 1.1
Dance/Movement Therapy 2 0.3
Diet 6 0.9
Exercise 8 1.2
Guided Imagery 15 2.3
Healing/Therapeutic Touch 12 1.8
Herbs 0 0.0
Homeopathy 0 0.0
Magnetic Therapy 0 0.0
Massage 3 0.5
Meditation 15 2.3
Music Therapy 0 0.0
Naturopathy 0 0.0
Prayer 19 2.9
Qigong 3 0.5
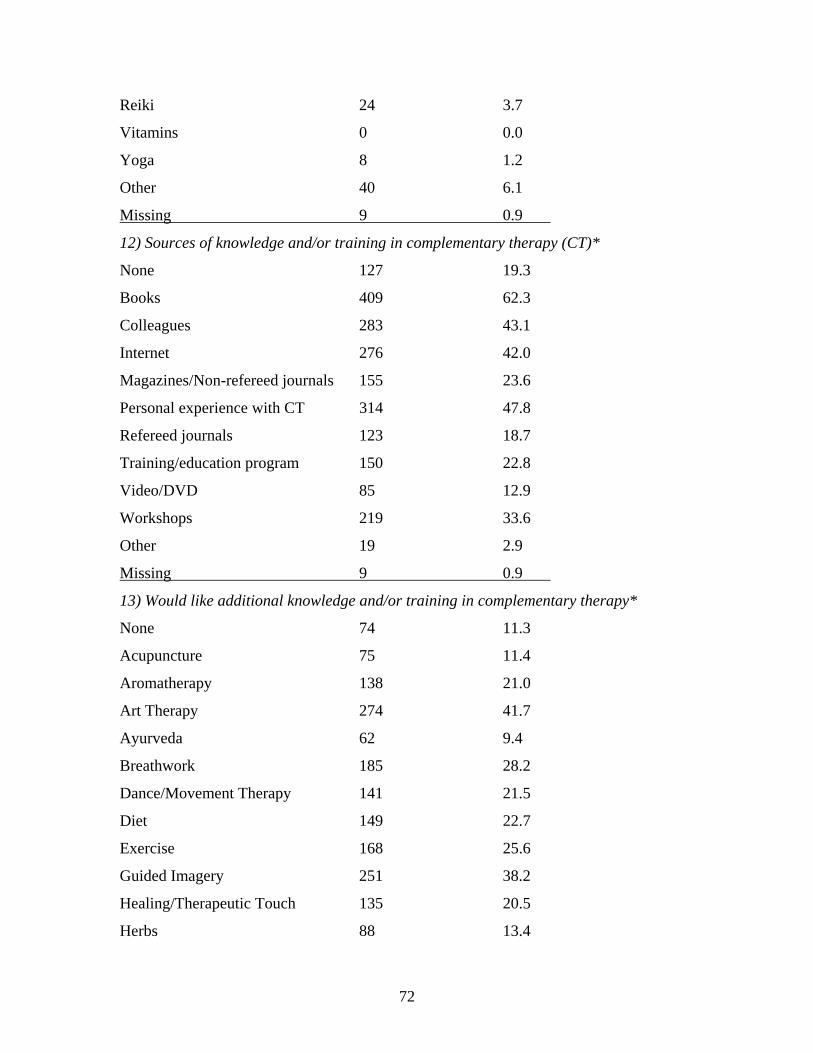
72
Reiki 24 3.7
Vitamins 0 0.0
Yoga 8 1.2
Other 40 6.1
Missing 9 0.9
12) Sources of knowledge and/or training in complementary therapy (CT)*
None 127 19.3
Books 409 62.3
Colleagues 283 43.1
Internet 276 42.0
Magazines/Non-refereed journals 155 23.6
Personal experience with CT 314 47.8
Refereed journals 123 18.7
Training/education program 150 22.8
Video/DVD 85 12.9
Workshops 219 33.6
Other 19 2.9
Missing 9 0.9
13) Would like additional knowledge and/or training in complementary therapy*
None 74 11.3
Acupuncture 75 11.4
Aromatherapy 138 21.0
Art Therapy 274 41.7
Ayurveda 62 9.4
Breathwork 185 28.2
Dance/Movement Therapy 141 21.5
Diet 149 22.7
Exercise 168 25.6
Guided Imagery 251 38.2
Healing/Therapeutic Touch 135 20.5
Herbs 88 13.4
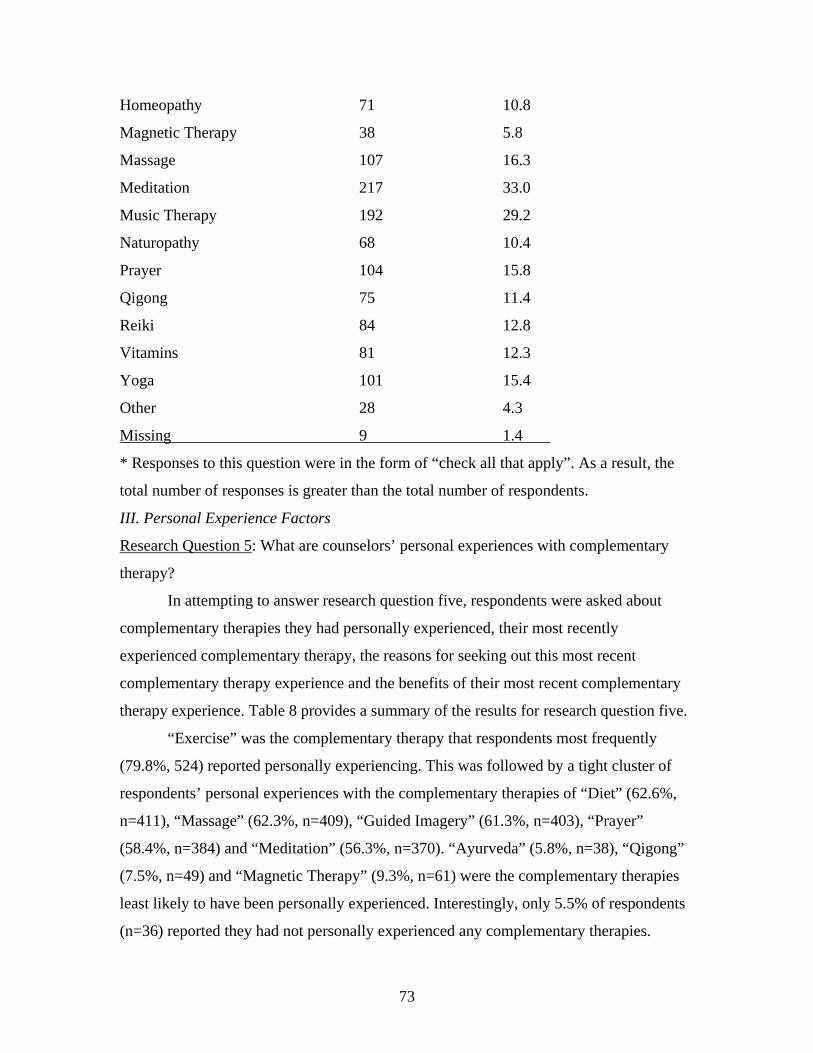
73
Homeopathy 71 10.8
Magnetic Therapy 38 5.8
Massage 107 16.3
Meditation 217 33.0
Music Therapy 192 29.2
Naturopathy 68 10.4
Prayer 104 15.8
Qigong 75 11.4
Reiki 84 12.8
Vitamins 81 12.3
Yoga 101 15.4
Other 28 4.3
Missing 9 1.4
* Responses to this question were in the form of “check all that apply”. As a result, the
total number of responses is greater than the total number of respondents.
III. Personal Experience Factors
Research Question 5: What are counselors’ personal experiences with complementary
therapy?
In attempting to answer research question five, respondents were asked about
complementary therapies they had personally experienced, their most recently
experienced complementary therapy, the reasons for seeking out this most recent
complementary therapy experience and the benefits of their most recent complementary
therapy experience. Table 8 provides a summary of the results for research question five.
“Exercise” was the complementary therapy that respondents most frequently
(79.8%, 524) reported personally experiencing. This was followed by a tight cluster of
respondents’ personal experiences with the complementary therapies of “Diet” (62.6%,
n=411), “Massage” (62.3%, n=409), “Guided Imagery” (61.3%, n=403), “Prayer”
(58.4%, n=384) and “Meditation” (56.3%, n=370). “Ayurveda” (5.8%, n=38), “Qigong”
(7.5%, n=49) and “Magnetic Therapy” (9.3%, n=61) were the complementary therapies
least likely to have been personally experienced. Interestingly, only 5.5% of respondents
(n=36) reported they had not personally experienced any complementary therapies.
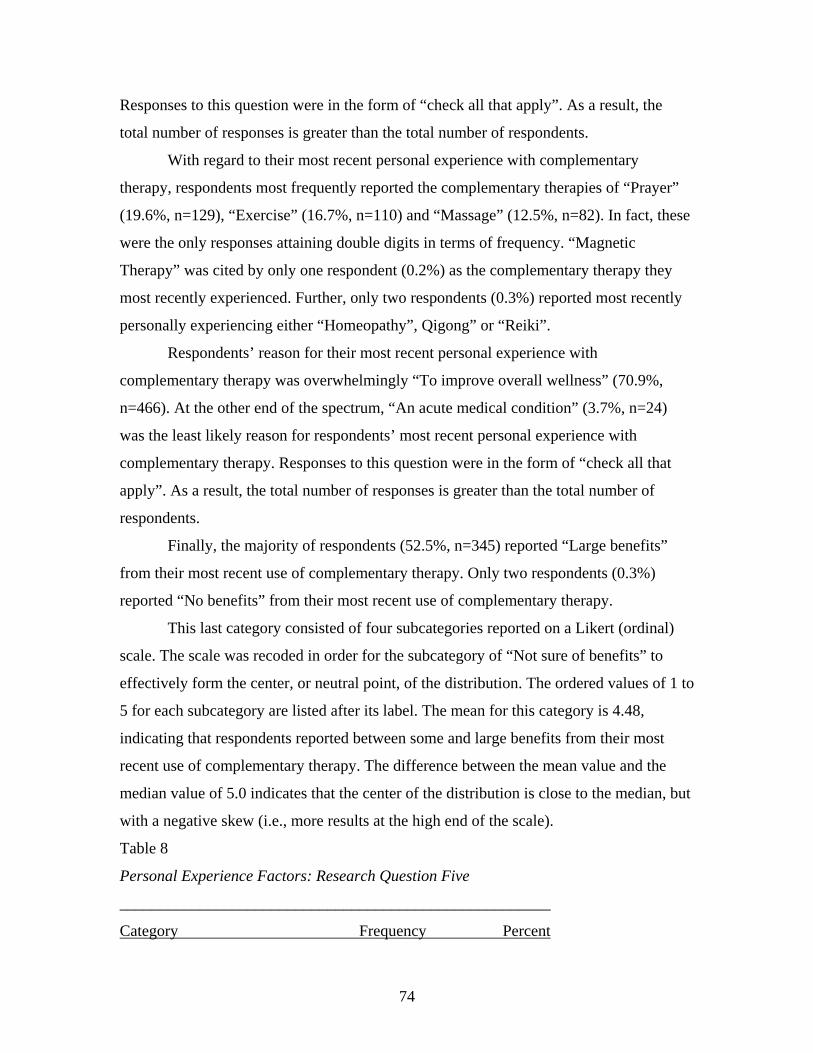
74
Responses to this question were in the form of “check all that apply”. As a result, the
total number of responses is greater than the total number of respondents.
With regard to their most recent personal experience with complementary
therapy, respondents most frequently reported the complementary therapies of “Prayer”
(19.6%, n=129), “Exercise” (16.7%, n=110) and “Massage” (12.5%, n=82). In fact, these
were the only responses attaining double digits in terms of frequency. “Magnetic
Therapy” was cited by only one respondent (0.2%) as the complementary therapy they
most recently experienced. Further, only two respondents (0.3%) reported most recently
personally experiencing either “Homeopathy”, Qigong” or “Reiki”.
Respondents’ reason for their most recent personal experience with
complementary therapy was overwhelmingly “To improve overall wellness” (70.9%,
n=466). At the other end of the spectrum, “An acute medical condition” (3.7%, n=24)
was the least likely reason for respondents’ most recent personal experience with
complementary therapy. Responses to this question were in the form of “check all that
apply”. As a result, the total number of responses is greater than the total number of
respondents.
Finally, the majority of respondents (52.5%, n=345) reported “Large benefits”
from their most recent use of complementary therapy. Only two respondents (0.3%)
reported “No benefits” from their most recent use of complementary therapy.
This last category consisted of four subcategories reported on a Likert (ordinal)
scale. The scale was recoded in order for the subcategory of “Not sure of benefits” to
effectively form the center, or neutral point, of the distribution. The ordered values of 1 to
5 for each subcategory are listed after its label. The mean for this category is 4.48,
indicating that respondents reported between some and large benefits from their most
recent use of complementary therapy. The difference between the mean value and the
median value of 5.0 indicates that the center of the distribution is close to the median, but
with a negative skew (i.e., more results at the high end of the scale).
Table 8
Personal Experience Factors: Research Question Five
______________________________________________________
Category Frequency Percent
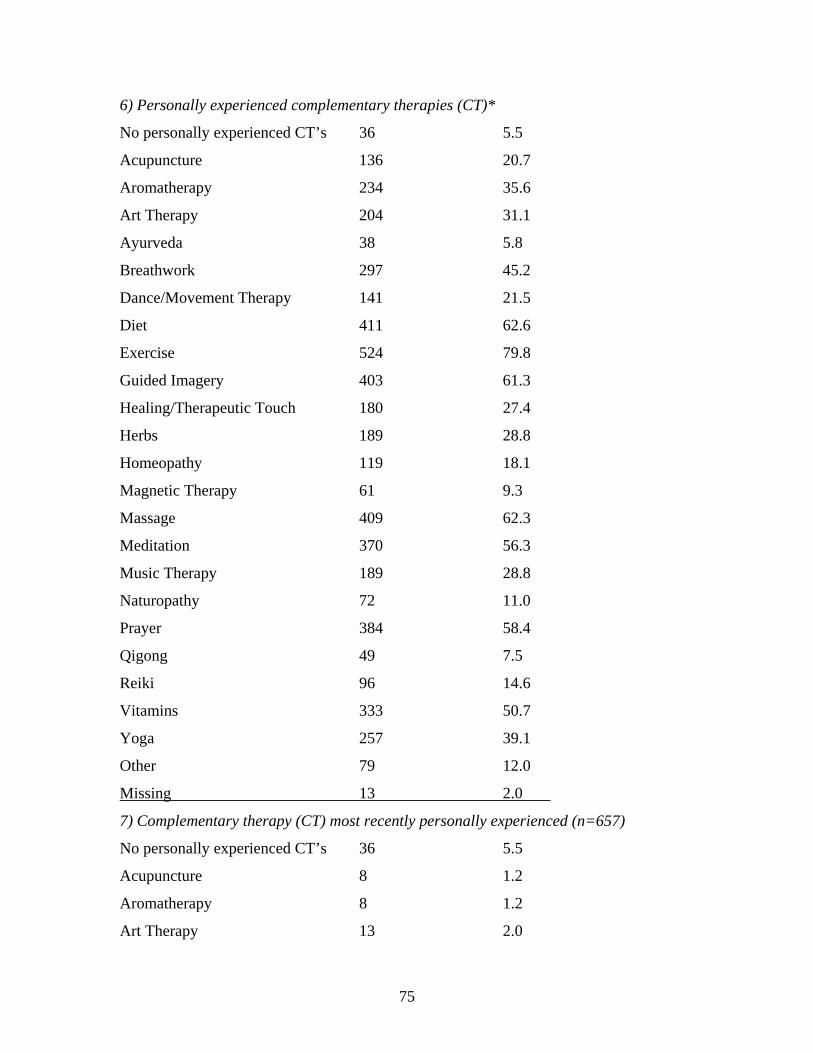
75
6) Personally experienced complementary therapies (CT)*
No personally experienced CT’s 36 5.5
Acupuncture 136 20.7
Aromatherapy 234 35.6
Art Therapy 204 31.1
Ayurveda 38 5.8
Breathwork 297 45.2
Dance/Movement Therapy 141 21.5
Diet 411 62.6
Exercise 524 79.8
Guided Imagery 403 61.3
Healing/Therapeutic Touch 180 27.4
Herbs 189 28.8
Homeopathy 119 18.1
Magnetic Therapy 61 9.3
Massage 409 62.3
Meditation 370 56.3
Music Therapy 189 28.8
Naturopathy 72 11.0
Prayer 384 58.4
Qigong 49 7.5
Reiki 96 14.6
Vitamins 333 50.7
Yoga 257 39.1
Other 79 12.0
Missing 13 2.0
7) Complementary therapy (CT) most recently personally experienced (n=657)
No personally experienced CT’s 36 5.5
Acupuncture 8 1.2
Aromatherapy 8 1.2
Art Therapy 13 2.0
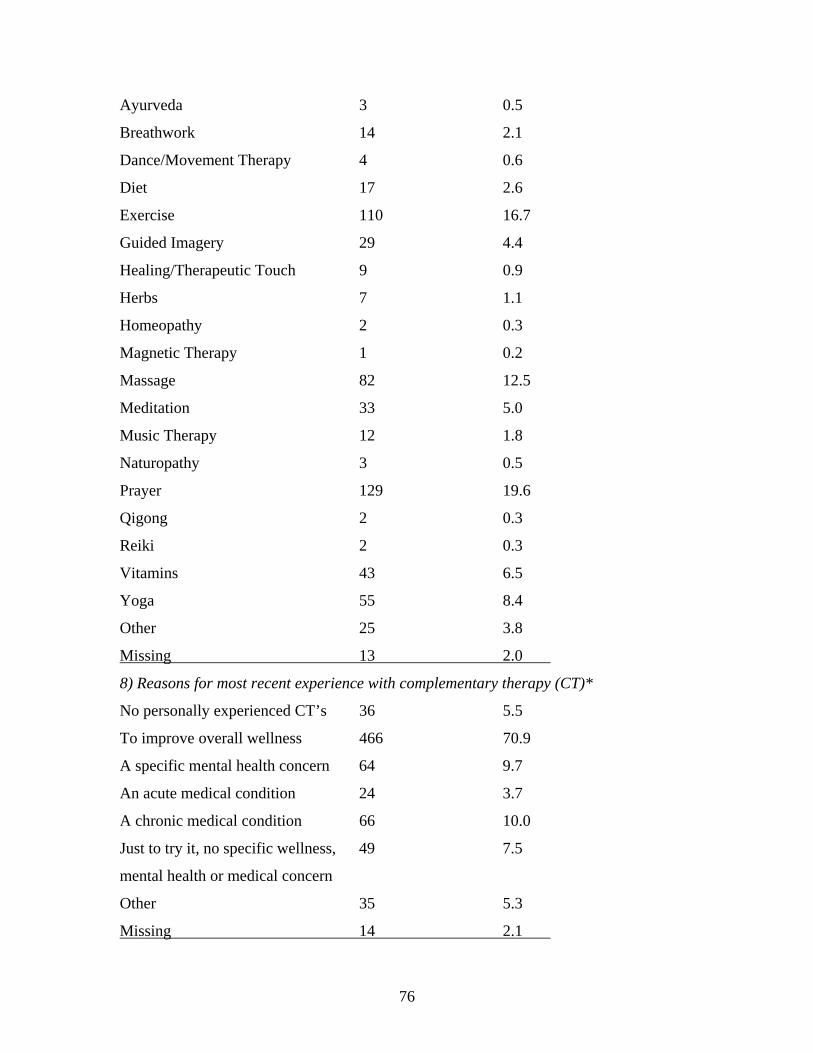
76
Ayurveda 3 0.5
Breathwork 14 2.1
Dance/Movement Therapy 4 0.6
Diet 17 2.6
Exercise 110 16.7
Guided Imagery 29 4.4
Healing/Therapeutic Touch 9 0.9
Herbs 7 1.1
Homeopathy 2 0.3
Magnetic Therapy 1 0.2
Massage 82 12.5
Meditation 33 5.0
Music Therapy 12 1.8
Naturopathy 3 0.5
Prayer 129 19.6
Qigong 2 0.3
Reiki 2 0.3
Vitamins 43 6.5
Yoga 55 8.4
Other 25 3.8
Missing 13 2.0
8) Reasons for most recent experience with complementary therapy (CT)*
No personally experienced CT’s 36 5.5
To improve overall wellness 466 70.9
A specific mental health concern 64 9.7
An acute medical condition 24 3.7
A chronic medical condition 66 10.0
Just to try it, no specific wellness, 49 7.5
mental health or medical concern
Other 35 5.3
Missing 14 2.1
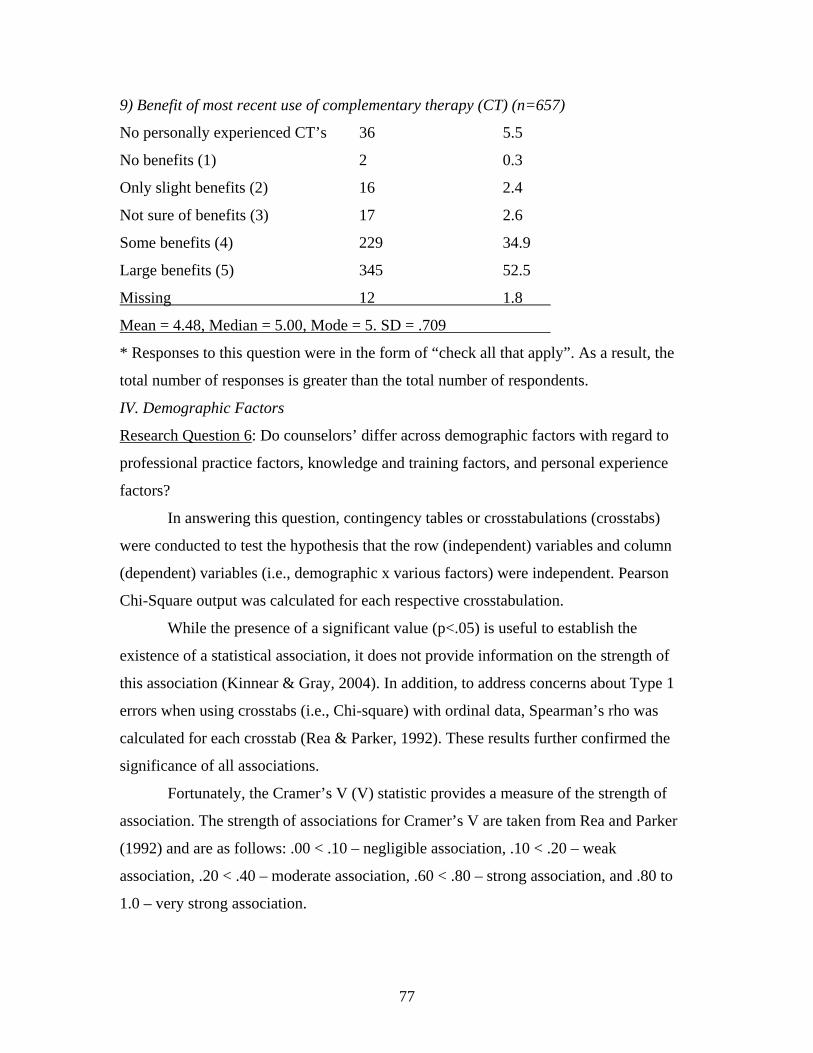
77
9) Benefit of most recent use of complementary therapy (CT) (n=657)
No personally experienced CT’s 36 5.5
No benefits (1) 2 0.3
Only slight benefits (2) 16 2.4
Not sure of benefits (3) 17 2.6
Some benefits (4) 229 34.9
Large benefits (5) 345 52.5
Missing 12 1.8
Mean = 4.48, Median = 5.00, Mode = 5. SD = .709
* Responses to this question were in the form of “check all that apply”. As a result, the
total number of responses is greater than the total number of respondents.
IV. Demographic Factors
Research Question 6: Do counselors’ differ across demographic factors with regard to
professional practice factors, knowledge and training factors, and personal experience
factors?
In answering this question, contingency tables or crosstabulations (crosstabs)
were conducted to test the hypothesis that the row (independent) variables and column
(dependent) variables (i.e., demographic x various factors) were independent. Pearson
Chi-Square output was calculated for each respective crosstabulation.
While the presence of a significant value (p<.05) is useful to establish the
existence of a statistical association, it does not provide information on the strength of
this association (Kinnear & Gray, 2004). In addition, to address concerns about Type 1
errors when using crosstabs (i.e., Chi-square) with ordinal data, Spearman’s rho was
calculated for each crosstab (Rea & Parker, 1992). These results further confirmed the
significance of all associations.
Fortunately, the Cramer’s V (V) statistic provides a measure of the strength of
association. The strength of associations for Cramer’s V are taken from Rea and Parker
(1992) and are as follows: .00 < .10 – negligible association, .10 < .20 – weak
association, .20 < .40 – moderate association, .60 < .80 – strong association, and .80 to
1.0 – very strong association.
78
In addition, the greater the expected frequencies, especially for larger contingency
tables, the more valid the results (Kinnear & Gray, 2004). The rule of thumb employed in
this study was one of questioning the results if more than 20% of cells had expected
counts of less than five (Green, Salkino, & Akey, 2000).
There were a total of 1127 possible associations between variables (i.e., 23
columns x 49 rows). Of this number, 275 crosstabulations were significant at the alpha
less than .05 level. These significances can be further broken down as follows: p < .001
in 116 cases (42.2%), p < .01 in 72 cases (26.2%), and p < .05 in 87 cases (31.6%). In
addition, a total of 66 crosstabulations (24% of 275 total) resulted in Cramer’s V values
indicative of a “moderate” strength of association. Out of these significant findings,
questionable results were found to be present in 63 cases (22.9%), due to 20% or more of
cells having expected counts of less than five. The result of this data sifting was that only
44 crosstabulations (4% of 1127 total cells) were found to be both significant (p<.05) and
have a Cramer’s V value indicative of a moderate strength of association (V>.200).
The independent variables were represented by 49 rows. With respect to
significance, 41 rows or independent variables were found to contain at least one
significant statistical association (p<.05). The independent variables of “Position-
Graduate student (Doctoral)”, “Position-Other”, “Work setting-College/university”,
“Work setting-Community agency”, “Work setting-Government setting”, “Work setting-
Other”, “Services provided-Testing” and “Theoretical orientation-Behavioral” did not
have any significant statistical associations.
Cramer’s V was at least moderate (V>.200) down 18 of the independent
variables/rows, including questionable associations with 20% or more of cells having
expected counts of less than five. Removing these questionable associations resulted in
just 10 independent variables/rows with a Cramer’s V value indicative of a moderate
association. These independent variables were, in order of frequency, “Work setting-
Private practice/Self-employed” (n=8), “Position-Outpatient counselor” (n=7), “Services
provided-Individual counseling” (n=6), “Work setting-K-12 setting” (n=5), “Services
provided-Family/couples counseling” (n=5), “Mental health license-None” (n=3),
“Mental health license-LPC”, (n=3), “Services provided-Alcohol/Substance abuse
79
counseling” (n=3), “Theoretical Orientation-Psychodynamic” (n=2) and “Position-
Graduate student (Master’s)” (n=2).
The five most frequent independent/row variables accounted for over 70 percent
(n=31) of the 44 significant and moderate strength of associations. In other words, just
10% (i.e., 5/49*100%) of the independent/row variables were present in 70% of crosstabs
with both significant and moderate strength of associations.
The dependent variables were represented by 23 columns. With respect to
significance, all 23 columns or dependent variables were found to contain at least one
significant statistical association (p<.05). Cramer’s V was at least moderate (V>.200)
across 13 of the dependent variables/columns, including associations with 20% or more
of cells having expected counts of less than five. Removing these questionable
associations resulted in nine dependent variables/columns with a moderate strength of
association.
Research question five, consisting of survey questions 6 to 9, did not have any
significant and moderate strength of associations. Research question four, which was
made up of survey questions 10 to 13, had only one significant and moderate strength of
association (Work setting-private practice x Complementary therapy modalities qualified
to discuss).
Of the 44 significant and moderate strength of associations, most frequently the
dependent variable was “Counselor asked client about use of complementary therapy”
(n=8), followed by “Included complementary therapy in counseling” (n=7), “Client
requested inclusion of complementary therapy” (n=7), “Provided client with a specific
referral for complementary therapy” (n=7), “Client voluntarily brought up use of
complementary therapy” (n=5), “Client requested a recommendation or referral for
complementary therapy” (n=4), “Client concerns for which recommended or referred for
complementary therapy” (n=4), “ Complementary therapy modalities qualified to
discuss” (n=1) and “Recommended complementary therapy without providing a referral”
(n=1).
The five most frequent dependent/column variables were present in over 84
percent (n=37) of the 44 significant and moderate strength of associations. In other
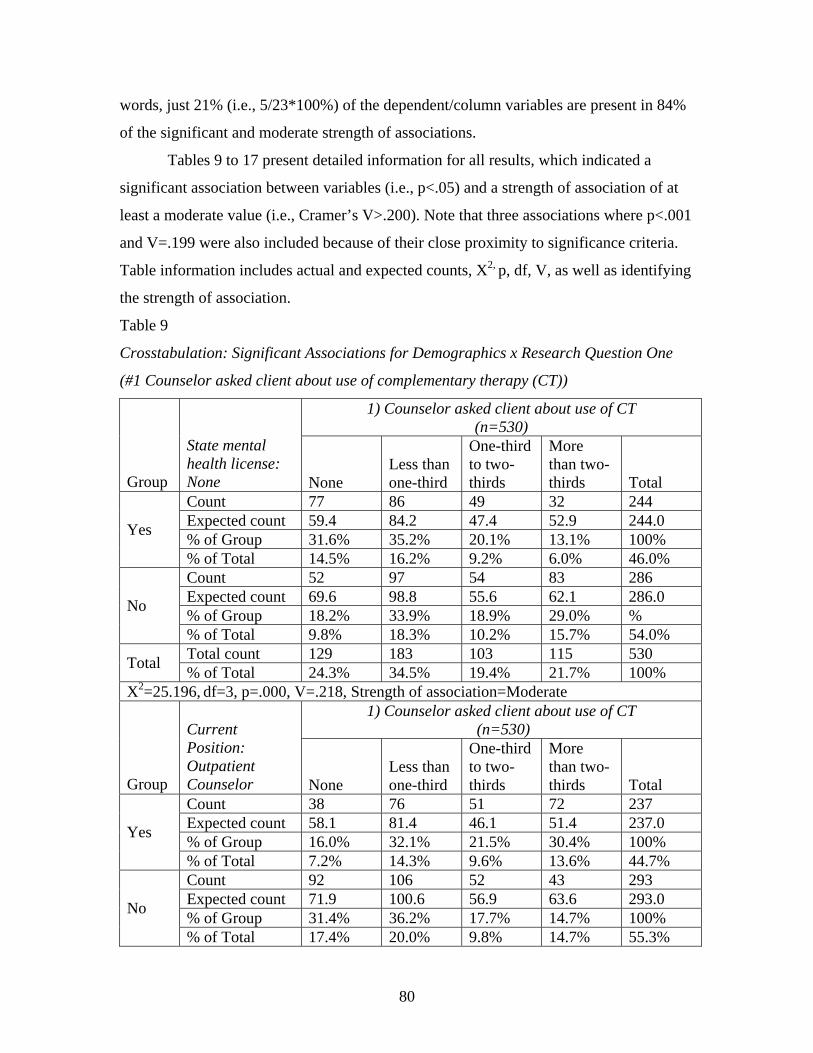
80
words, just 21% (i.e., 5/23*100%) of the dependent/column variables are present in 84%
of the significant and moderate strength of associations.
Tables 9 to 17 present detailed information for all results, which indicated a
significant association between variables (i.e., p<.05) and a strength of association of at
least a moderate value (i.e., Cramer’s V>.200). Note that three associations where p<.001
and V=.199 were also included because of their close proximity to significance criteria.
Table information includes actual and expected counts, X2, p, df, V, as well as identifying
the strength of association.
Table 9
Crosstabulation: Significant Associations for Demographics x Research Question One
(#1 Counselor asked client about use of complementary therapy (CT))
1) Counselor asked client about use of CT (n=530)
Group
State mental health license: None None
Less than one-third
One-third to two-thirds
More than two-thirds Total
Count 77 86 49 32 244 Expected count 59.4 84.2 47.4 52.9 244.0 % of Group 31.6% 35.2% 20.1% 13.1% 100% Yes
% of Total 14.5% 16.2% 9.2% 6.0% 46.0% Count 52 97 54 83 286 Expected count 69.6 98.8 55.6 62.1 286.0 % of Group 18.2% 33.9% 18.9% 29.0% % No
% of Total 9.8% 18.3% 10.2% 15.7% 54.0% Total count 129 183 103 115 530 Total % of Total 24.3% 34.5% 19.4% 21.7% 100%
X2=25.196, df=3, p=.000, V=.218, Strength of association=Moderate 1) Counselor asked client about use of CT
(n=530) Group
Current Position: Outpatient Counselor
None
Less than one-third
One-third to two-thirds
More than two-thirds
Total
Count 38 76 51 72 237 Expected count 58.1 81.4 46.1 51.4 237.0 % of Group 16.0% 32.1% 21.5% 30.4% 100% Yes
% of Total 7.2% 14.3% 9.6% 13.6% 44.7% Count 92 106 52 43 293 Expected count 71.9 100.6 56.9 63.6 293.0 % of Group 31.4% 36.2% 17.7% 14.7% 100% No
% of Total 17.4% 20.0% 9.8% 14.7% 55.3%
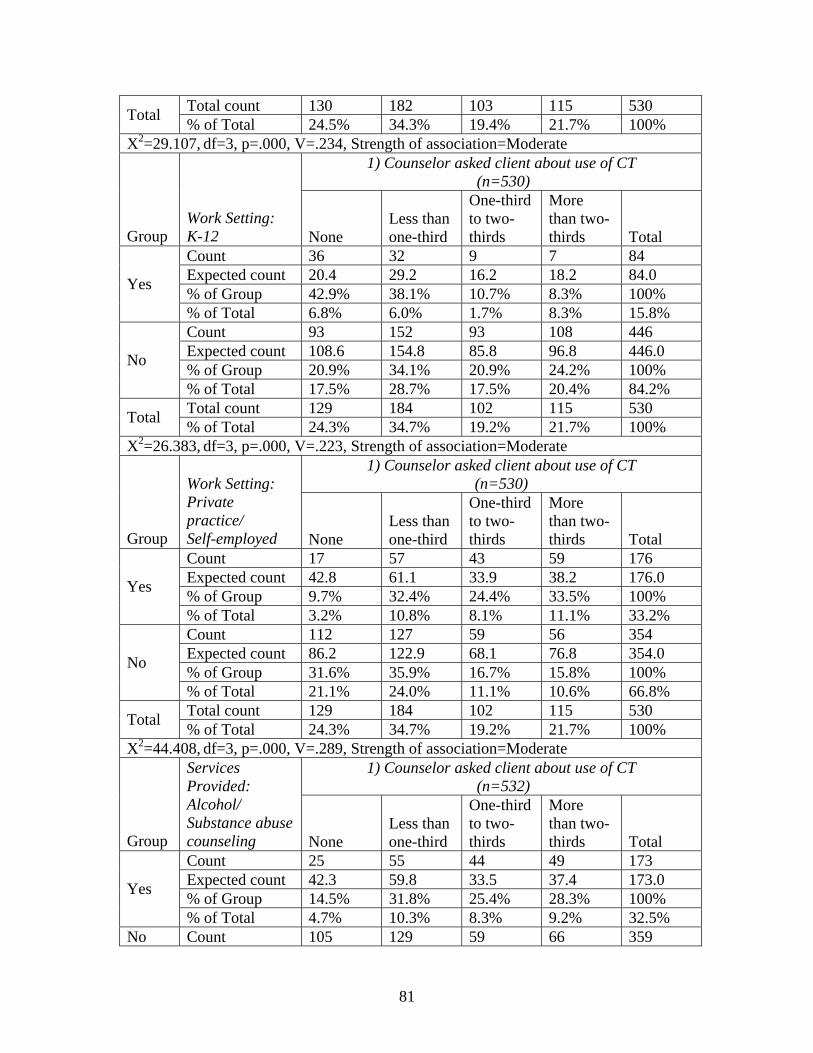
81
Total count 130 182 103 115 530 Total % of Total 24.5% 34.3% 19.4% 21.7% 100% X2=29.107, df=3, p=.000, V=.234, Strength of association=Moderate
1) Counselor asked client about use of CT (n=530)
Group Work Setting: K-12 None
Less than one-third
One-third to two-thirds
More than two-thirds Total
Count 36 32 9 7 84 Expected count 20.4 29.2 16.2 18.2 84.0 % of Group 42.9% 38.1% 10.7% 8.3% 100% Yes
% of Total 6.8% 6.0% 1.7% 8.3% 15.8% Count 93 152 93 108 446 Expected count 108.6 154.8 85.8 96.8 446.0 % of Group 20.9% 34.1% 20.9% 24.2% 100% No
% of Total 17.5% 28.7% 17.5% 20.4% 84.2% Total count 129 184 102 115 530 Total % of Total 24.3% 34.7% 19.2% 21.7% 100%
X2=26.383, df=3, p=.000, V=.223, Strength of association=Moderate 1) Counselor asked client about use of CT
(n=530)
Group
Work Setting: Private practice/ Self-employed None
Less than one-third
One-third to two-thirds
More than two-thirds Total
Count 17 57 43 59 176 Expected count 42.8 61.1 33.9 38.2 176.0 % of Group 9.7% 32.4% 24.4% 33.5% 100% Yes
% of Total 3.2% 10.8% 8.1% 11.1% 33.2% Count 112 127 59 56 354 Expected count 86.2 122.9 68.1 76.8 354.0 % of Group 31.6% 35.9% 16.7% 15.8% 100% No
% of Total 21.1% 24.0% 11.1% 10.6% 66.8% Total count 129 184 102 115 530 Total % of Total 24.3% 34.7% 19.2% 21.7% 100%
X2=44.408, df=3, p=.000, V=.289, Strength of association=Moderate 1) Counselor asked client about use of CT
(n=532) Group
Services Provided: Alcohol/ Substance abuse counseling None
Less than one-third
One-third to two-thirds
More than two-thirds Total
Count 25 55 44 49 173 Expected count 42.3 59.8 33.5 37.4 173.0 % of Group 14.5% 31.8% 25.4% 28.3% 100% Yes
% of Total 4.7% 10.3% 8.3% 9.2% 32.5% No Count 105 129 59 66 359
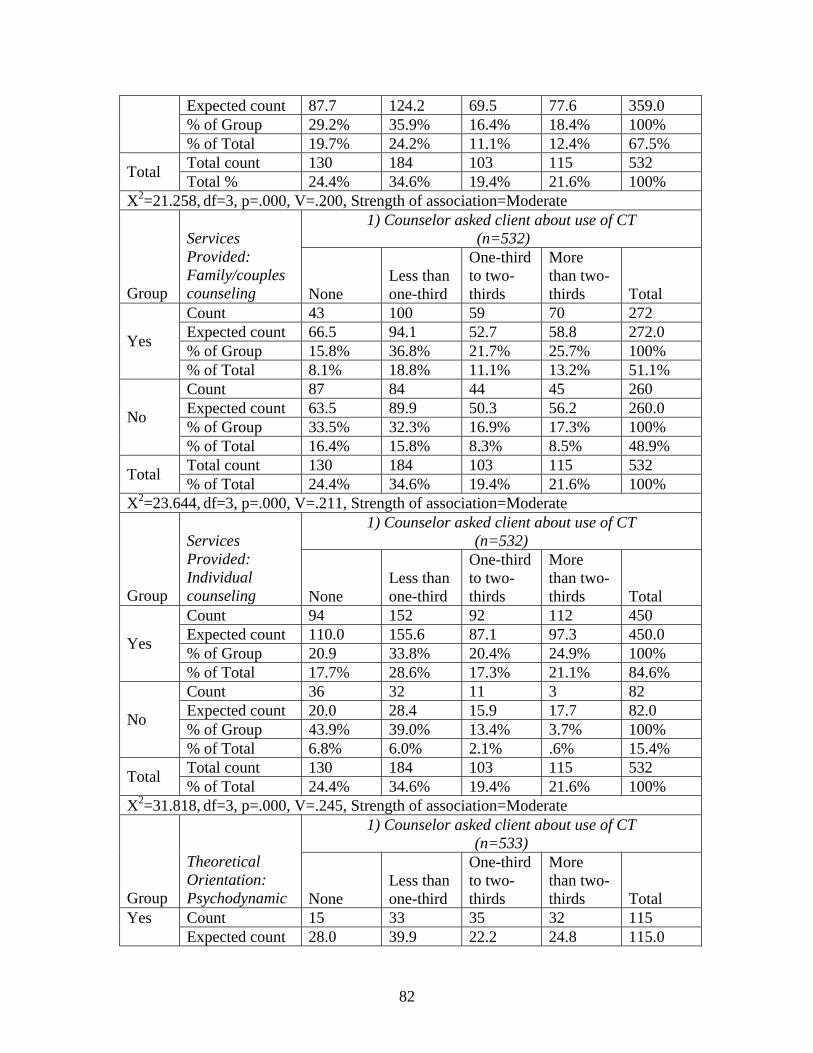
82
Expected count 87.7 124.2 69.5 77.6 359.0 % of Group 29.2% 35.9% 16.4% 18.4% 100%
% of Total 19.7% 24.2% 11.1% 12.4% 67.5% Total count 130 184 103 115 532 Total Total % 24.4% 34.6% 19.4% 21.6% 100%
X2=21.258, df=3, p=.000, V=.200, Strength of association=Moderate 1) Counselor asked client about use of CT
(n=532)
Group
Services Provided: Family/couples counseling None
Less than one-third
One-third to two-thirds
More than two-thirds Total
Count 43 100 59 70 272 Expected count 66.5 94.1 52.7 58.8 272.0 % of Group 15.8% 36.8% 21.7% 25.7% 100% Yes
% of Total 8.1% 18.8% 11.1% 13.2% 51.1% Count 87 84 44 45 260 Expected count 63.5 89.9 50.3 56.2 260.0 % of Group 33.5% 32.3% 16.9% 17.3% 100% No
% of Total 16.4% 15.8% 8.3% 8.5% 48.9% Total count 130 184 103 115 532 Total % of Total 24.4% 34.6% 19.4% 21.6% 100%
X2=23.644, df=3, p=.000, V=.211, Strength of association=Moderate 1) Counselor asked client about use of CT
(n=532)
Group
Services Provided: Individual counseling None
Less than one-third
One-third to two-thirds
More than two-thirds Total
Count 94 152 92 112 450 Expected count 110.0 155.6 87.1 97.3 450.0 % of Group 20.9 33.8% 20.4% 24.9% 100% Yes
% of Total 17.7% 28.6% 17.3% 21.1% 84.6% Count 36 32 11 3 82 Expected count 20.0 28.4 15.9 17.7 82.0 % of Group 43.9% 39.0% 13.4% 3.7% 100% No
% of Total 6.8% 6.0% 2.1% .6% 15.4% Total count 130 184 103 115 532 Total % of Total 24.4% 34.6% 19.4% 21.6% 100%
X2=31.818, df=3, p=.000, V=.245, Strength of association=Moderate 1) Counselor asked client about use of CT
(n=533)
Group
Theoretical Orientation: Psychodynamic None
Less than one-third
One-third to two-thirds
More than two-thirds Total
Count 15 33 35 32 115 Yes Expected count 28.0 39.9 22.2 24.8 115.0
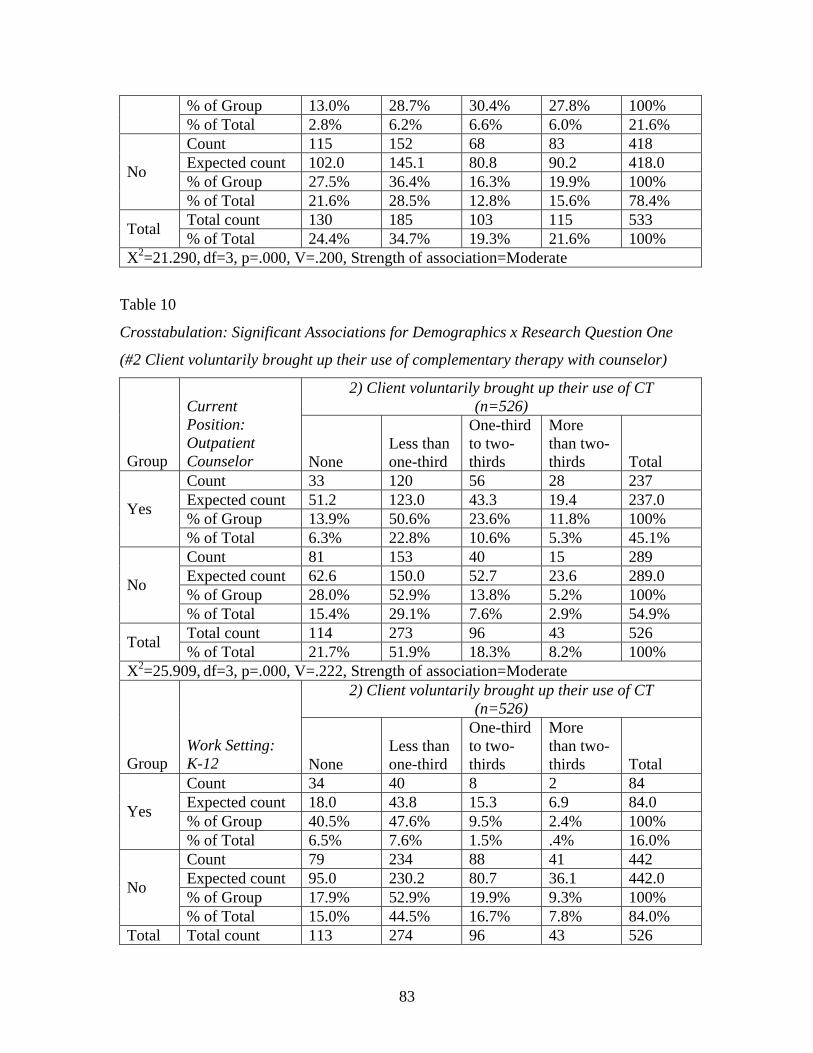
83
% of Group 13.0% 28.7% 30.4% 27.8% 100% % of Total 2.8% 6.2% 6.6% 6.0% 21.6% Count 115 152 68 83 418 Expected count 102.0 145.1 80.8 90.2 418.0 % of Group 27.5% 36.4% 16.3% 19.9% 100% No
% of Total 21.6% 28.5% 12.8% 15.6% 78.4% Total count 130 185 103 115 533 Total % of Total 24.4% 34.7% 19.3% 21.6% 100%
X2=21.290, df=3, p=.000, V=.200, Strength of association=Moderate
Table 10
Crosstabulation: Significant Associations for Demographics x Research Question One
(#2 Client voluntarily brought up their use of complementary therapy with counselor)
2) Client voluntarily brought up their use of CT (n=526)
Group
Current Position: Outpatient Counselor None
Less than one-third
One-third to two-thirds
More than two-thirds Total
Count 33 120 56 28 237 Expected count 51.2 123.0 43.3 19.4 237.0 % of Group 13.9% 50.6% 23.6% 11.8% 100% Yes
% of Total 6.3% 22.8% 10.6% 5.3% 45.1% Count 81 153 40 15 289 Expected count 62.6 150.0 52.7 23.6 289.0 % of Group 28.0% 52.9% 13.8% 5.2% 100% No
% of Total 15.4% 29.1% 7.6% 2.9% 54.9% Total count 114 273 96 43 526 Total % of Total 21.7% 51.9% 18.3% 8.2% 100%
X2=25.909, df=3, p=.000, V=.222, Strength of association=Moderate 2) Client voluntarily brought up their use of CT
(n=526)
Group Work Setting: K-12 None
Less than one-third
One-third to two-thirds
More than two-thirds Total
Count 34 40 8 2 84 Expected count 18.0 43.8 15.3 6.9 84.0 % of Group 40.5% 47.6% 9.5% 2.4% 100% Yes
% of Total 6.5% 7.6% 1.5% .4% 16.0% Count 79 234 88 41 442 Expected count 95.0 230.2 80.7 36.1 442.0 % of Group 17.9% 52.9% 19.9% 9.3% 100% No
% of Total 15.0% 44.5% 16.7% 7.8% 84.0% Total Total count 113 274 96 43 526
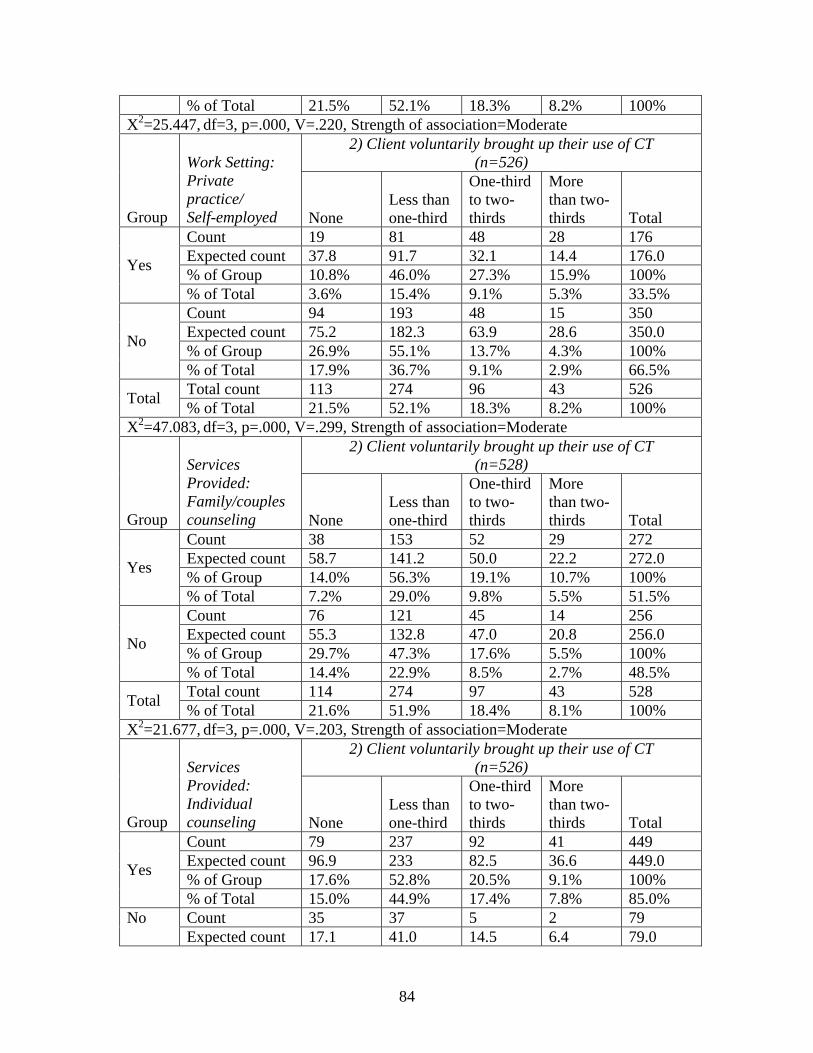
84
% of Total 21.5% 52.1% 18.3% 8.2% 100% X2=25.447, df=3, p=.000, V=.220, Strength of association=Moderate
2) Client voluntarily brought up their use of CT (n=526)
Group
Work Setting: Private practice/ Self-employed None
Less than one-third
One-third to two-thirds
More than two-thirds Total
Count 19 81 48 28 176 Expected count 37.8 91.7 32.1 14.4 176.0 % of Group 10.8% 46.0% 27.3% 15.9% 100% Yes
% of Total 3.6% 15.4% 9.1% 5.3% 33.5% Count 94 193 48 15 350 Expected count 75.2 182.3 63.9 28.6 350.0 % of Group 26.9% 55.1% 13.7% 4.3% 100% No
% of Total 17.9% 36.7% 9.1% 2.9% 66.5% Total count 113 274 96 43 526 Total % of Total 21.5% 52.1% 18.3% 8.2% 100%
X2=47.083, df=3, p=.000, V=.299, Strength of association=Moderate 2) Client voluntarily brought up their use of CT
(n=528)
Group
Services Provided: Family/couples counseling None
Less than one-third
One-third to two-thirds
More than two-thirds Total
Count 38 153 52 29 272 Expected count 58.7 141.2 50.0 22.2 272.0 % of Group 14.0% 56.3% 19.1% 10.7% 100% Yes
% of Total 7.2% 29.0% 9.8% 5.5% 51.5% Count 76 121 45 14 256 Expected count 55.3 132.8 47.0 20.8 256.0 % of Group 29.7% 47.3% 17.6% 5.5% 100% No
% of Total 14.4% 22.9% 8.5% 2.7% 48.5% Total count 114 274 97 43 528 Total % of Total 21.6% 51.9% 18.4% 8.1% 100%
X2=21.677, df=3, p=.000, V=.203, Strength of association=Moderate 2) Client voluntarily brought up their use of CT
(n=526)
Group
Services Provided: Individual counseling None
Less than one-third
One-third to two-thirds
More than two-thirds Total
Count 79 237 92 41 449 Expected count 96.9 233 82.5 36.6 449.0 % of Group 17.6% 52.8% 20.5% 9.1% 100% Yes
% of Total 15.0% 44.9% 17.4% 7.8% 85.0% Count 35 37 5 2 79 No Expected count 17.1 41.0 14.5 6.4 79.0
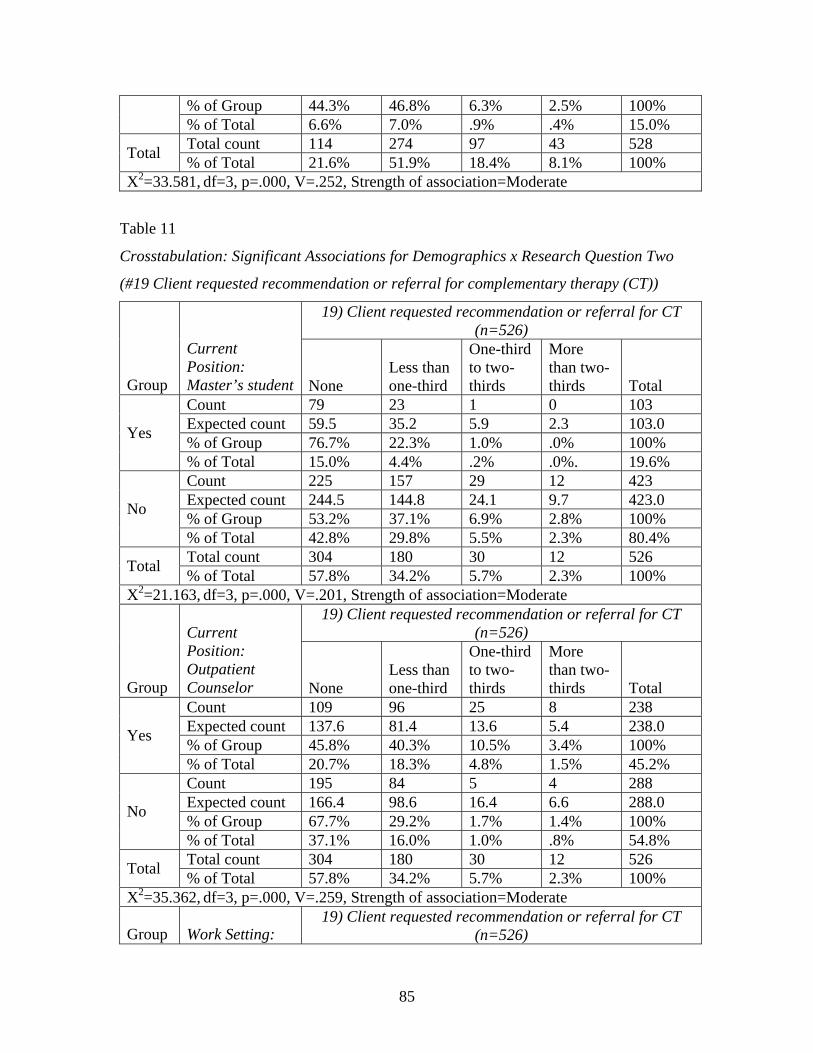
85
% of Group 44.3% 46.8% 6.3% 2.5% 100% % of Total 6.6% 7.0% .9% .4% 15.0% Total count 114 274 97 43 528 Total % of Total 21.6% 51.9% 18.4% 8.1% 100%
X2=33.581, df=3, p=.000, V=.252, Strength of association=Moderate
Table 11
Crosstabulation: Significant Associations for Demographics x Research Question Two
(#19 Client requested recommendation or referral for complementary therapy (CT))
19) Client requested recommendation or referral for CT (n=526)
Group
Current Position: Master’s student None
Less than one-third
One-third to two-thirds
More than two-thirds Total
Count 79 23 1 0 103 Expected count 59.5 35.2 5.9 2.3 103.0 % of Group 76.7% 22.3% 1.0% .0% 100% Yes
% of Total 15.0% 4.4% .2% .0%. 19.6% Count 225 157 29 12 423 Expected count 244.5 144.8 24.1 9.7 423.0 % of Group 53.2% 37.1% 6.9% 2.8% 100% No
% of Total 42.8% 29.8% 5.5% 2.3% 80.4% Total count 304 180 30 12 526 Total % of Total 57.8% 34.2% 5.7% 2.3% 100%
X2=21.163, df=3, p=.000, V=.201, Strength of association=Moderate 19) Client requested recommendation or referral for CT
(n=526)
Group
Current Position: Outpatient Counselor None
Less than one-third
One-third to two-thirds
More than two-thirds Total
Count 109 96 25 8 238 Expected count 137.6 81.4 13.6 5.4 238.0 % of Group 45.8% 40.3% 10.5% 3.4% 100% Yes
% of Total 20.7% 18.3% 4.8% 1.5% 45.2% Count 195 84 5 4 288 Expected count 166.4 98.6 16.4 6.6 288.0 % of Group 67.7% 29.2% 1.7% 1.4% 100% No
% of Total 37.1% 16.0% 1.0% .8% 54.8% Total count 304 180 30 12 526 Total % of Total 57.8% 34.2% 5.7% 2.3% 100%
X2=35.362, df=3, p=.000, V=.259, Strength of association=Moderate
Group Work Setting: 19) Client requested recommendation or referral for CT
(n=526)
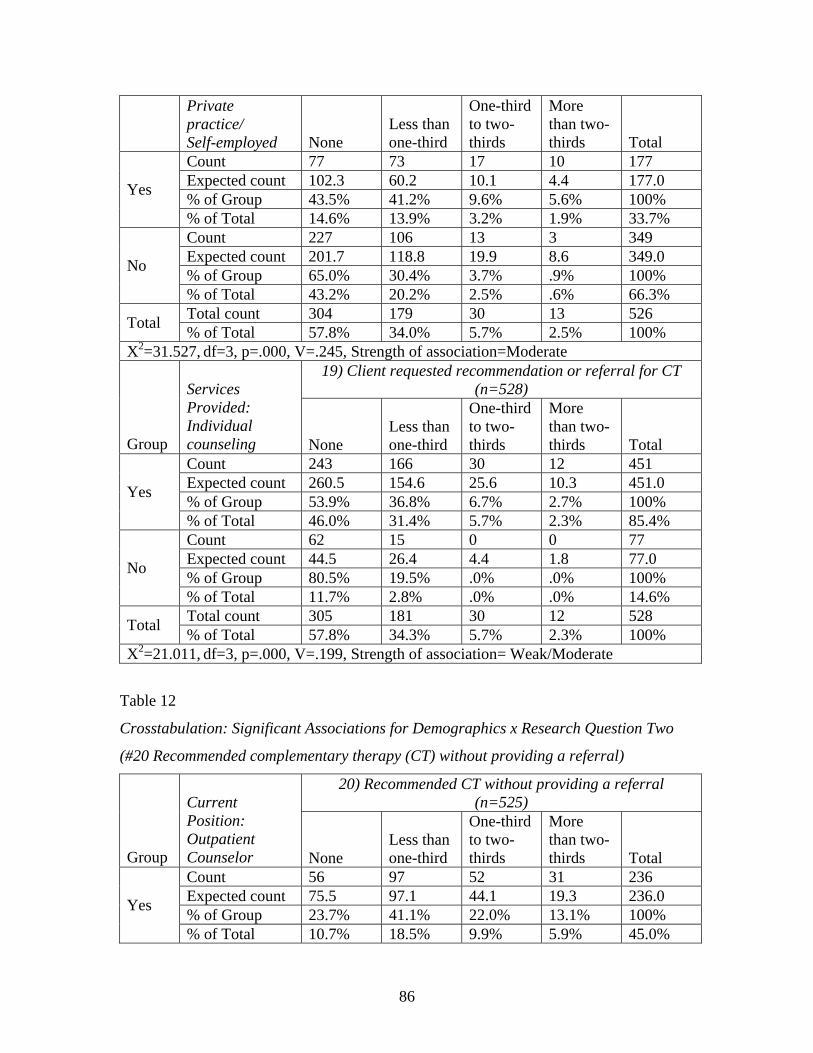
86
Private practice/ Self-employed None
Less than one-third
One-third to two-thirds
More than two-thirds Total
Count 77 73 17 10 177 Expected count 102.3 60.2 10.1 4.4 177.0 % of Group 43.5% 41.2% 9.6% 5.6% 100% Yes
% of Total 14.6% 13.9% 3.2% 1.9% 33.7% Count 227 106 13 3 349 Expected count 201.7 118.8 19.9 8.6 349.0 % of Group 65.0% 30.4% 3.7% .9% 100% No
% of Total 43.2% 20.2% 2.5% .6% 66.3% Total count 304 179 30 13 526 Total % of Total 57.8% 34.0% 5.7% 2.5% 100%
X2=31.527, df=3, p=.000, V=.245, Strength of association=Moderate 19) Client requested recommendation or referral for CT
(n=528)
Group
Services Provided: Individual counseling None
Less than one-third
One-third to two-thirds
More than two-thirds Total
Count 243 166 30 12 451 Expected count 260.5 154.6 25.6 10.3 451.0 % of Group 53.9% 36.8% 6.7% 2.7% 100% Yes
% of Total 46.0% 31.4% 5.7% 2.3% 85.4% Count 62 15 0 0 77 Expected count 44.5 26.4 4.4 1.8 77.0 % of Group 80.5% 19.5% .0% .0% 100% No
% of Total 11.7% 2.8% .0% .0% 14.6% Total count 305 181 30 12 528 Total % of Total 57.8% 34.3% 5.7% 2.3% 100%
X2=21.011, df=3, p=.000, V=.199, Strength of association= Weak/Moderate
Table 12
Crosstabulation: Significant Associations for Demographics x Research Question Two
(#20 Recommended complementary therapy (CT) without providing a referral)
20) Recommended CT without providing a referral (n=525)
Group
Current Position: Outpatient Counselor None
Less than one-third
One-third to two-thirds
More than two-thirds Total
Count 56 97 52 31 236 Expected count 75.5 97.1 44.1 19.3 236.0 % of Group 23.7% 41.1% 22.0% 13.1% 100% Yes
% of Total 10.7% 18.5% 9.9% 5.9% 45.0%
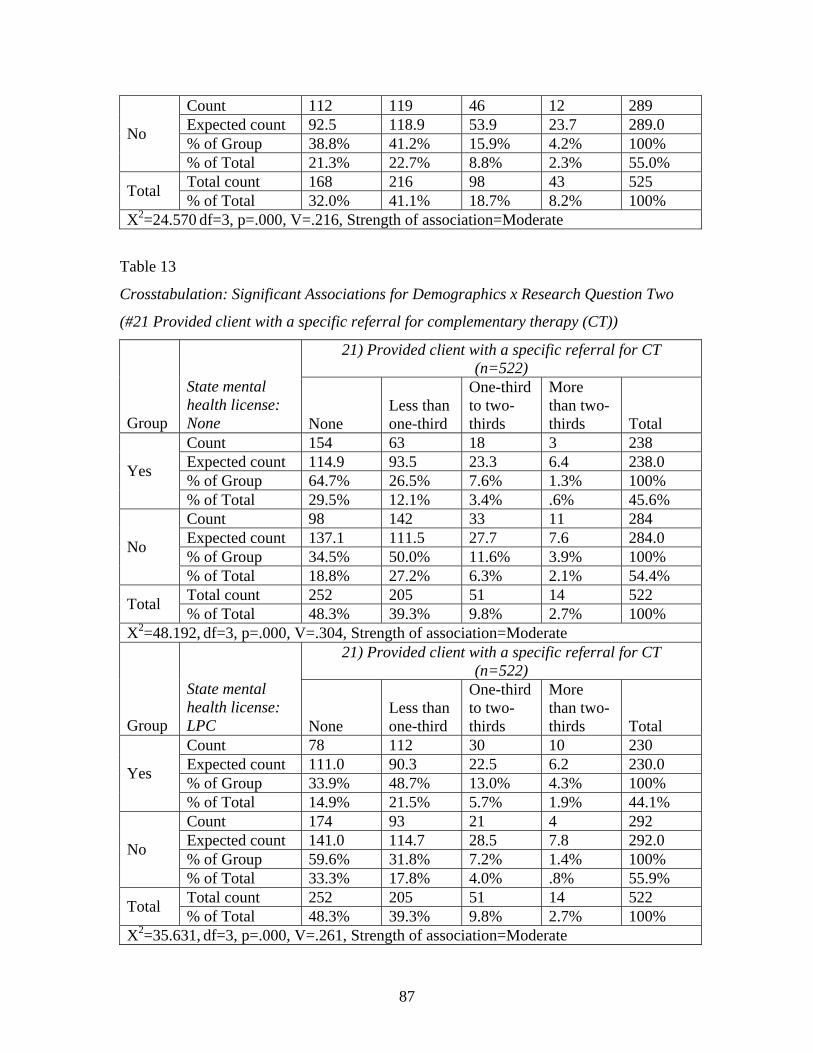
87
Count 112 119 46 12 289 Expected count 92.5 118.9 53.9 23.7 289.0 % of Group 38.8% 41.2% 15.9% 4.2% 100% No
% of Total 21.3% 22.7% 8.8% 2.3% 55.0% Total count 168 216 98 43 525 Total % of Total 32.0% 41.1% 18.7% 8.2% 100%
X2=24.570 df=3, p=.000, V=.216, Strength of association=Moderate
Table 13
Crosstabulation: Significant Associations for Demographics x Research Question Two
(#21 Provided client with a specific referral for complementary therapy (CT))
21) Provided client with a specific referral for CT (n=522)
Group
State mental health license: None None
Less than one-third
One-third to two-thirds
More than two-thirds Total
Count 154 63 18 3 238 Expected count 114.9 93.5 23.3 6.4 238.0 % of Group 64.7% 26.5% 7.6% 1.3% 100% Yes
% of Total 29.5% 12.1% 3.4% .6% 45.6% Count 98 142 33 11 284 Expected count 137.1 111.5 27.7 7.6 284.0 % of Group 34.5% 50.0% 11.6% 3.9% 100% No
% of Total 18.8% 27.2% 6.3% 2.1% 54.4% Total count 252 205 51 14 522 Total % of Total 48.3% 39.3% 9.8% 2.7% 100%
X2=48.192, df=3, p=.000, V=.304, Strength of association=Moderate 21) Provided client with a specific referral for CT
(n=522)
Group
State mental health license: LPC None
Less than one-third
One-third to two-thirds
More than two-thirds Total
Count 78 112 30 10 230 Expected count 111.0 90.3 22.5 6.2 230.0 % of Group 33.9% 48.7% 13.0% 4.3% 100% Yes
% of Total 14.9% 21.5% 5.7% 1.9% 44.1% Count 174 93 21 4 292 Expected count 141.0 114.7 28.5 7.8 292.0 % of Group 59.6% 31.8% 7.2% 1.4% 100% No
% of Total 33.3% 17.8% 4.0% .8% 55.9% Total count 252 205 51 14 522 Total % of Total 48.3% 39.3% 9.8% 2.7% 100%
X2=35.631, df=3, p=.000, V=.261, Strength of association=Moderate
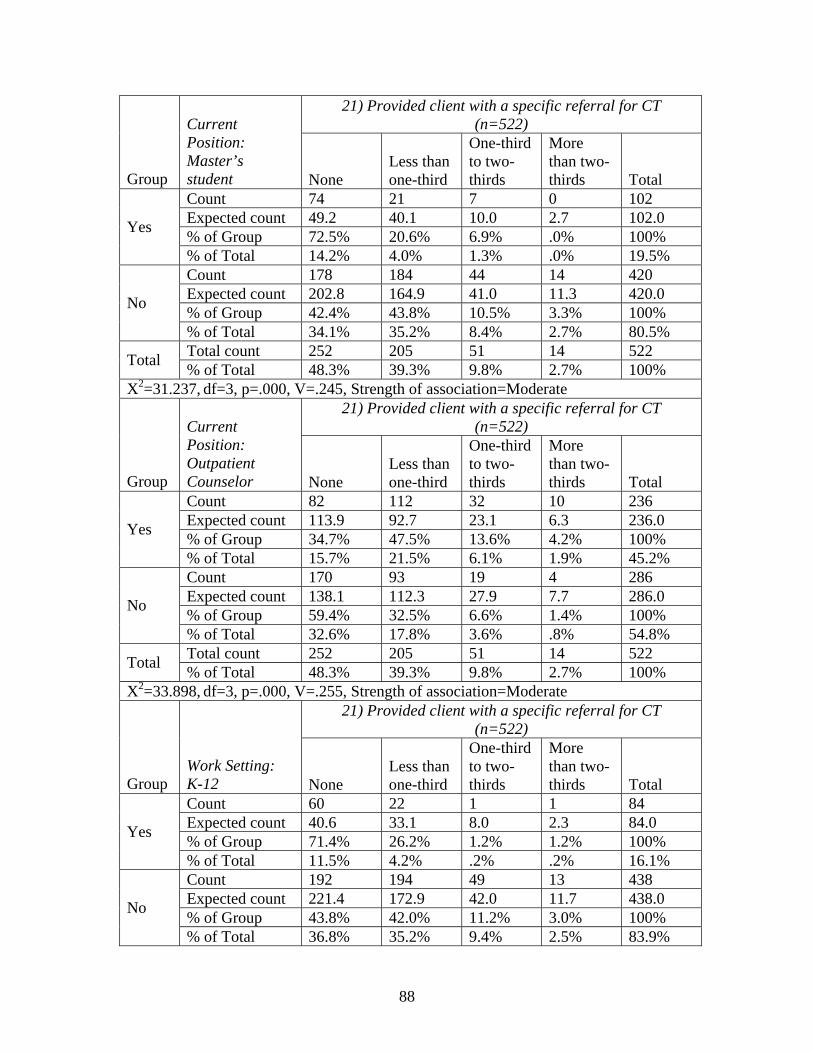
88
21) Provided client with a specific referral for CT (n=522)
Group
Current Position: Master’s student None
Less than one-third
One-third to two-thirds
More than two-thirds Total
Count 74 21 7 0 102 Expected count 49.2 40.1 10.0 2.7 102.0 % of Group 72.5% 20.6% 6.9% .0% 100% Yes
% of Total 14.2% 4.0% 1.3% .0% 19.5% Count 178 184 44 14 420 Expected count 202.8 164.9 41.0 11.3 420.0 % of Group 42.4% 43.8% 10.5% 3.3% 100% No
% of Total 34.1% 35.2% 8.4% 2.7% 80.5% Total count 252 205 51 14 522 Total % of Total 48.3% 39.3% 9.8% 2.7% 100%
X2=31.237, df=3, p=.000, V=.245, Strength of association=Moderate 21) Provided client with a specific referral for CT
(n=522)
Group
Current Position: Outpatient Counselor None
Less than one-third
One-third to two-thirds
More than two-thirds Total
Count 82 112 32 10 236 Expected count 113.9 92.7 23.1 6.3 236.0 % of Group 34.7% 47.5% 13.6% 4.2% 100% Yes
% of Total 15.7% 21.5% 6.1% 1.9% 45.2% Count 170 93 19 4 286 Expected count 138.1 112.3 27.9 7.7 286.0 % of Group 59.4% 32.5% 6.6% 1.4% 100% No
% of Total 32.6% 17.8% 3.6% .8% 54.8% Total count 252 205 51 14 522 Total % of Total 48.3% 39.3% 9.8% 2.7% 100%
X2=33.898, df=3, p=.000, V=.255, Strength of association=Moderate 21) Provided client with a specific referral for CT
(n=522)
Group Work Setting: K-12 None
Less than one-third
One-third to two-thirds
More than two-thirds Total
Count 60 22 1 1 84 Expected count 40.6 33.1 8.0 2.3 84.0 % of Group 71.4% 26.2% 1.2% 1.2% 100% Yes
% of Total 11.5% 4.2% .2% .2% 16.1% Count 192 194 49 13 438 Expected count 221.4 172.9 42.0 11.7 438.0 % of Group 43.8% 42.0% 11.2% 3.0% 100% No
% of Total 36.8% 35.2% 9.4% 2.5% 83.9%
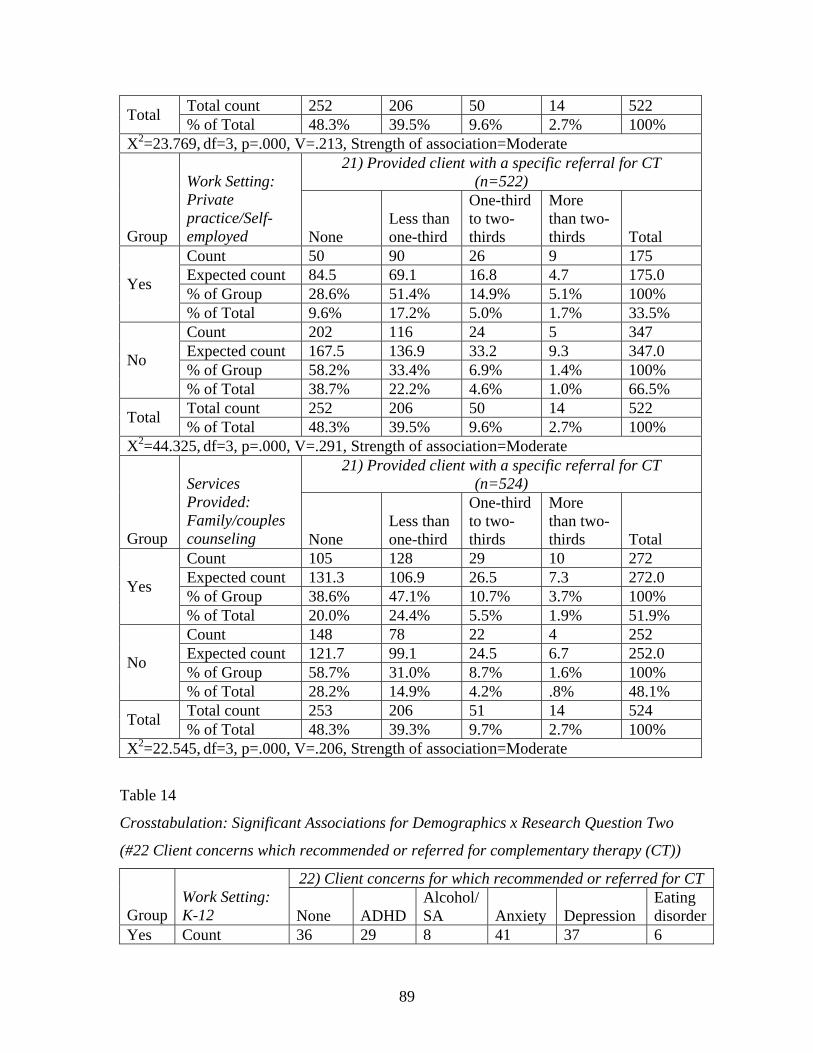
89
Total count 252 206 50 14 522 Total % of Total 48.3% 39.5% 9.6% 2.7% 100% X2=23.769, df=3, p=.000, V=.213, Strength of association=Moderate
21) Provided client with a specific referral for CT (n=522)
Group
Work Setting: Private practice/Self-employed None
Less than one-third
One-third to two-thirds
More than two-thirds Total
Count 50 90 26 9 175 Expected count 84.5 69.1 16.8 4.7 175.0 % of Group 28.6% 51.4% 14.9% 5.1% 100% Yes
% of Total 9.6% 17.2% 5.0% 1.7% 33.5% Count 202 116 24 5 347 Expected count 167.5 136.9 33.2 9.3 347.0 % of Group 58.2% 33.4% 6.9% 1.4% 100% No
% of Total 38.7% 22.2% 4.6% 1.0% 66.5% Total count 252 206 50 14 522 Total % of Total 48.3% 39.5% 9.6% 2.7% 100%
X2=44.325, df=3, p=.000, V=.291, Strength of association=Moderate 21) Provided client with a specific referral for CT
(n=524)
Group
Services Provided: Family/couples counseling None
Less than one-third
One-third to two-thirds
More than two-thirds Total
Count 105 128 29 10 272 Expected count 131.3 106.9 26.5 7.3 272.0 % of Group 38.6% 47.1% 10.7% 3.7% 100% Yes
% of Total 20.0% 24.4% 5.5% 1.9% 51.9% Count 148 78 22 4 252 Expected count 121.7 99.1 24.5 6.7 252.0 % of Group 58.7% 31.0% 8.7% 1.6% 100% No
% of Total 28.2% 14.9% 4.2% .8% 48.1% Total count 253 206 51 14 524 Total % of Total 48.3% 39.3% 9.7% 2.7% 100%
X2=22.545, df=3, p=.000, V=.206, Strength of association=Moderate
Table 14
Crosstabulation: Significant Associations for Demographics x Research Question Two
(#22 Client concerns which recommended or referred for complementary therapy (CT))
22) Client concerns for which recommended or referred for CT
Group Work Setting: K-12
None ADHD
Alcohol/ SA Anxiety Depression
Eating disorder
Yes Count 36 29 8 41 37 6
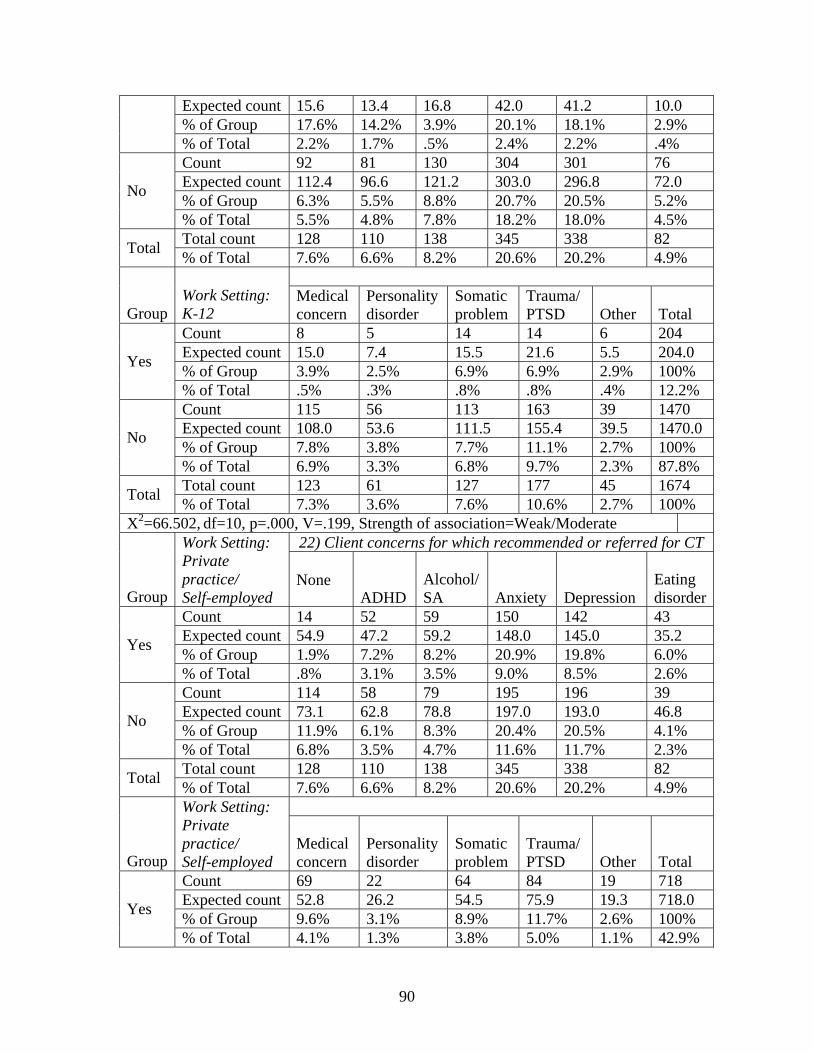
90
Expected count 15.6 13.4 16.8 42.0 41.2 10.0 % of Group 17.6% 14.2% 3.9% 20.1% 18.1% 2.9%
% of Total 2.2% 1.7% .5% 2.4% 2.2% .4% Count 92 81 130 304 301 76 Expected count 112.4 96.6 121.2 303.0 296.8 72.0 % of Group 6.3% 5.5% 8.8% 20.7% 20.5% 5.2% No
% of Total 5.5% 4.8% 7.8% 18.2% 18.0% 4.5% Total count 128 110 138 345 338 82 Total % of Total 7.6% 6.6% 8.2% 20.6% 20.2% 4.9%
Group Work Setting: K-12
Medical concern
Personality disorder
Somatic problem
Trauma/ PTSD Other Total
Count 8 5 14 14 6 204 Expected count 15.0 7.4 15.5 21.6 5.5 204.0 % of Group 3.9% 2.5% 6.9% 6.9% 2.9% 100% Yes
% of Total .5% .3% .8% .8% .4% 12.2% Count 115 56 113 163 39 1470 Expected count 108.0 53.6 111.5 155.4 39.5 1470.0 % of Group 7.8% 3.8% 7.7% 11.1% 2.7% 100% No
% of Total 6.9% 3.3% 6.8% 9.7% 2.3% 87.8% Total count 123 61 127 177 45 1674 Total % of Total 7.3% 3.6% 7.6% 10.6% 2.7% 100%
X2=66.502, df=10, p=.000, V=.199, Strength of association=Weak/Moderate 22) Client concerns for which recommended or referred for CT
Group
Work Setting: Private practice/ Self-employed
None
ADHD Alcohol/ SA Anxiety Depression
Eating disorder
Count 14 52 59 150 142 43 Expected count 54.9 47.2 59.2 148.0 145.0 35.2 % of Group 1.9% 7.2% 8.2% 20.9% 19.8% 6.0% Yes
% of Total .8% 3.1% 3.5% 9.0% 8.5% 2.6% Count 114 58 79 195 196 39 Expected count 73.1 62.8 78.8 197.0 193.0 46.8 % of Group 11.9% 6.1% 8.3% 20.4% 20.5% 4.1% No
% of Total 6.8% 3.5% 4.7% 11.6% 11.7% 2.3% Total count 128 110 138 345 338 82 Total % of Total 7.6% 6.6% 8.2% 20.6% 20.2% 4.9%
Group
Work Setting: Private practice/ Self-employed
Medical concern
Personality disorder
Somatic problem
Trauma/ PTSD Other Total
Count 69 22 64 84 19 718 Expected count 52.8 26.2 54.5 75.9 19.3 718.0 % of Group 9.6% 3.1% 8.9% 11.7% 2.6% 100% Yes
% of Total 4.1% 1.3% 3.8% 5.0% 1.1% 42.9%
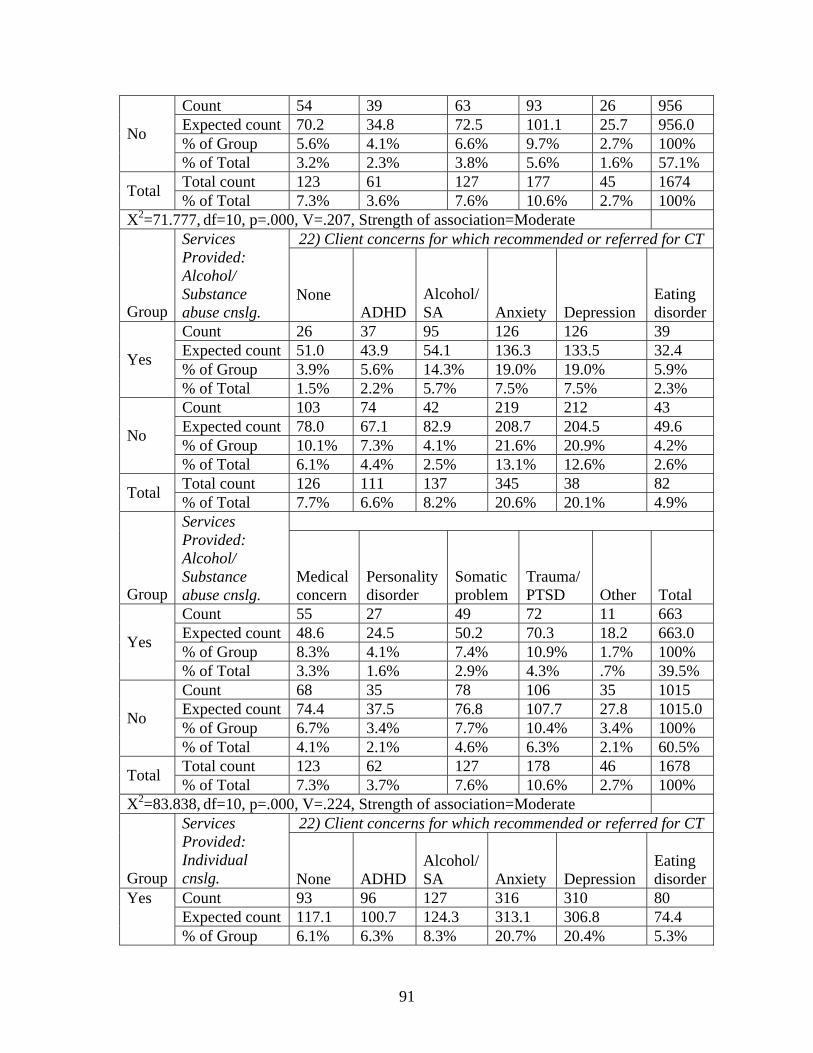
91
Count 54 39 63 93 26 956 Expected count 70.2 34.8 72.5 101.1 25.7 956.0 % of Group 5.6% 4.1% 6.6% 9.7% 2.7% 100% No
% of Total 3.2% 2.3% 3.8% 5.6% 1.6% 57.1% Total count 123 61 127 177 45 1674 Total % of Total 7.3% 3.6% 7.6% 10.6% 2.7% 100%
X2=71.777, df=10, p=.000, V=.207, Strength of association=Moderate 22) Client concerns for which recommended or referred for CT
Group
Services Provided: Alcohol/ Substance abuse cnslg.
None
ADHD Alcohol/ SA Anxiety Depression
Eating disorder
Count 26 37 95 126 126 39 Expected count 51.0 43.9 54.1 136.3 133.5 32.4 % of Group 3.9% 5.6% 14.3% 19.0% 19.0% 5.9% Yes
% of Total 1.5% 2.2% 5.7% 7.5% 7.5% 2.3% Count 103 74 42 219 212 43 Expected count 78.0 67.1 82.9 208.7 204.5 49.6 % of Group 10.1% 7.3% 4.1% 21.6% 20.9% 4.2% No
% of Total 6.1% 4.4% 2.5% 13.1% 12.6% 2.6% Total count 126 111 137 345 38 82 Total % of Total 7.7% 6.6% 8.2% 20.6% 20.1% 4.9%
Group
Services Provided: Alcohol/ Substance abuse cnslg.
Medical concern
Personality disorder
Somatic problem
Trauma/ PTSD Other Total
Count 55 27 49 72 11 663 Expected count 48.6 24.5 50.2 70.3 18.2 663.0 % of Group 8.3% 4.1% 7.4% 10.9% 1.7% 100% Yes
% of Total 3.3% 1.6% 2.9% 4.3% .7% 39.5% Count 68 35 78 106 35 1015 Expected count 74.4 37.5 76.8 107.7 27.8 1015.0 % of Group 6.7% 3.4% 7.7% 10.4% 3.4% 100% No
% of Total 4.1% 2.1% 4.6% 6.3% 2.1% 60.5% Total count 123 62 127 178 46 1678 Total % of Total 7.3% 3.7% 7.6% 10.6% 2.7% 100%
X2=83.838, df=10, p=.000, V=.224, Strength of association=Moderate 22) Client concerns for which recommended or referred for CT
Group
Services Provided: Individual cnslg.
None ADHD
Alcohol/ SA Anxiety Depression
Eating disorder
Count 93 96 127 316 310 80 Expected count 117.1 100.7 124.3 313.1 306.8 74.4
Yes
% of Group 6.1% 6.3% 8.3% 20.7% 20.4% 5.3%
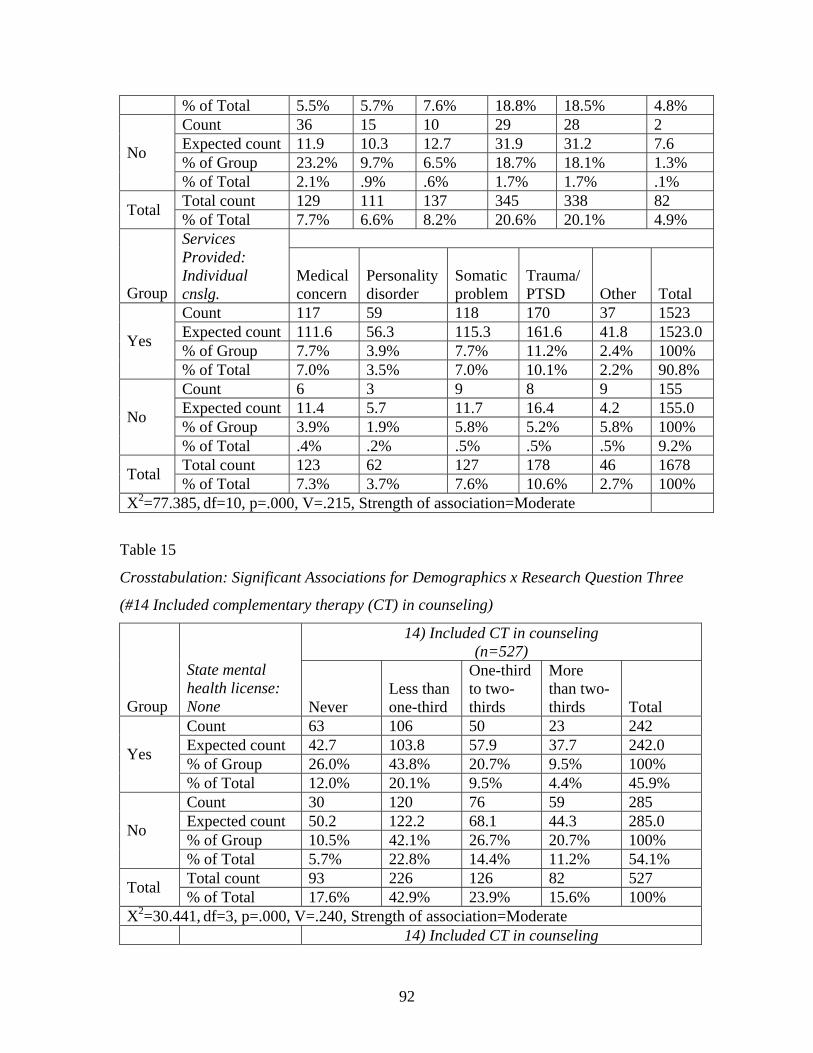
92
% of Total 5.5% 5.7% 7.6% 18.8% 18.5% 4.8% Count 36 15 10 29 28 2 Expected count 11.9 10.3 12.7 31.9 31.2 7.6 % of Group 23.2% 9.7% 6.5% 18.7% 18.1% 1.3% No
% of Total 2.1% .9% .6% 1.7% 1.7% .1% Total count 129 111 137 345 338 82 Total % of Total 7.7% 6.6% 8.2% 20.6% 20.1% 4.9%
Group
Services Provided: Individual cnslg.
Medical concern
Personality disorder
Somatic problem
Trauma/ PTSD Other Total
Count 117 59 118 170 37 1523 Expected count 111.6 56.3 115.3 161.6 41.8 1523.0 % of Group 7.7% 3.9% 7.7% 11.2% 2.4% 100% Yes
% of Total 7.0% 3.5% 7.0% 10.1% 2.2% 90.8% Count 6 3 9 8 9 155 Expected count 11.4 5.7 11.7 16.4 4.2 155.0 % of Group 3.9% 1.9% 5.8% 5.2% 5.8% 100% No
% of Total .4% .2% .5% .5% .5% 9.2% Total count 123 62 127 178 46 1678 Total % of Total 7.3% 3.7% 7.6% 10.6% 2.7% 100%
X2=77.385, df=10, p=.000, V=.215, Strength of association=Moderate
Table 15
Crosstabulation: Significant Associations for Demographics x Research Question Three
(#14 Included complementary therapy (CT) in counseling)
14) Included CT in counseling (n=527)
Group
State mental health license: None Never
Less than one-third
One-third to two-thirds
More than two-thirds Total
Count 63 106 50 23 242 Expected count 42.7 103.8 57.9 37.7 242.0 % of Group 26.0% 43.8% 20.7% 9.5% 100% Yes
% of Total 12.0% 20.1% 9.5% 4.4% 45.9% Count 30 120 76 59 285 Expected count 50.2 122.2 68.1 44.3 285.0 % of Group 10.5% 42.1% 26.7% 20.7% 100% No
% of Total 5.7% 22.8% 14.4% 11.2% 54.1% Total count 93 226 126 82 527 Total % of Total 17.6% 42.9% 23.9% 15.6% 100%
X2=30.441, df=3, p=.000, V=.240, Strength of association=Moderate 14) Included CT in counseling
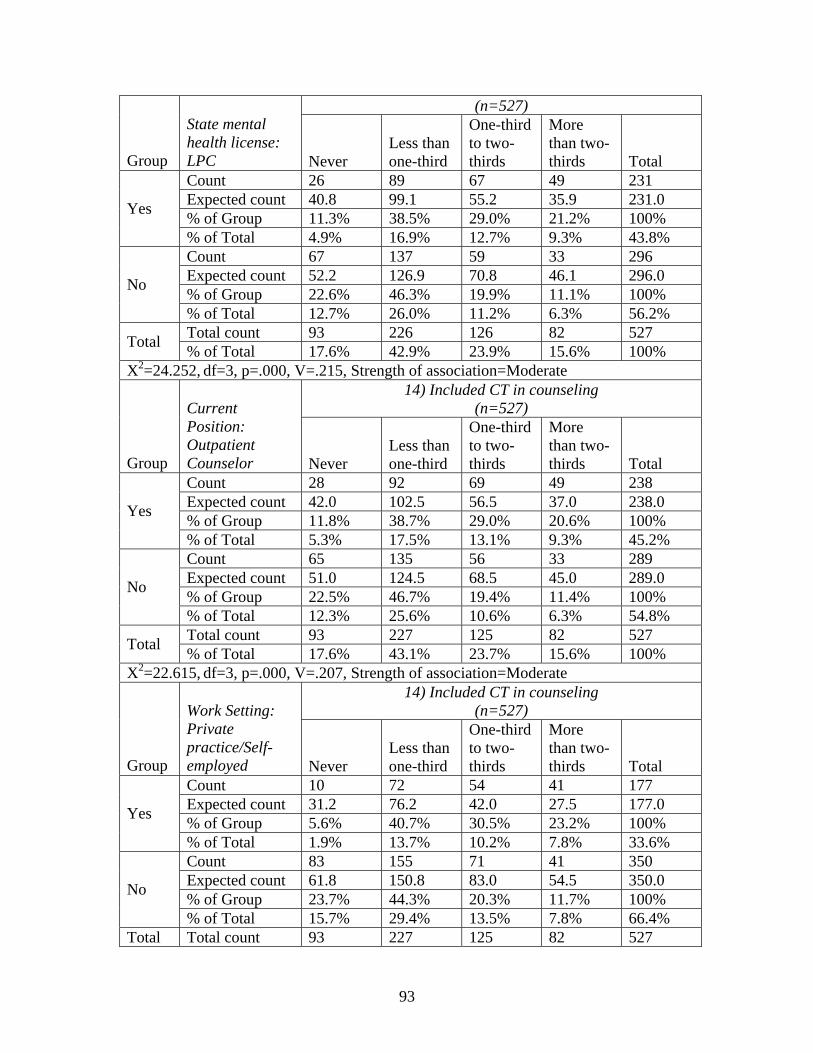
93
(n=527) Group
State mental health license: LPC Never
Less than one-third
One-third to two-thirds
More than two-thirds Total
Count 26 89 67 49 231 Expected count 40.8 99.1 55.2 35.9 231.0 % of Group 11.3% 38.5% 29.0% 21.2% 100% Yes
% of Total 4.9% 16.9% 12.7% 9.3% 43.8% Count 67 137 59 33 296 Expected count 52.2 126.9 70.8 46.1 296.0 % of Group 22.6% 46.3% 19.9% 11.1% 100% No
% of Total 12.7% 26.0% 11.2% 6.3% 56.2% Total count 93 226 126 82 527 Total % of Total 17.6% 42.9% 23.9% 15.6% 100%
X2=24.252, df=3, p=.000, V=.215, Strength of association=Moderate 14) Included CT in counseling
(n=527)
Group
Current Position: Outpatient Counselor Never
Less than one-third
One-third to two-thirds
More than two-thirds Total
Count 28 92 69 49 238 Expected count 42.0 102.5 56.5 37.0 238.0 % of Group 11.8% 38.7% 29.0% 20.6% 100% Yes
% of Total 5.3% 17.5% 13.1% 9.3% 45.2% Count 65 135 56 33 289 Expected count 51.0 124.5 68.5 45.0 289.0 % of Group 22.5% 46.7% 19.4% 11.4% 100% No
% of Total 12.3% 25.6% 10.6% 6.3% 54.8% Total count 93 227 125 82 527 Total % of Total 17.6% 43.1% 23.7% 15.6% 100%
X2=22.615, df=3, p=.000, V=.207, Strength of association=Moderate 14) Included CT in counseling
(n=527)
Group
Work Setting: Private practice/Self-employed Never
Less than one-third
One-third to two-thirds
More than two-thirds Total
Count 10 72 54 41 177 Expected count 31.2 76.2 42.0 27.5 177.0 % of Group 5.6% 40.7% 30.5% 23.2% 100% Yes
% of Total 1.9% 13.7% 10.2% 7.8% 33.6% Count 83 155 71 41 350 Expected count 61.8 150.8 83.0 54.5 350.0 % of Group 23.7% 44.3% 20.3% 11.7% 100% No
% of Total 15.7% 29.4% 13.5% 7.8% 66.4% Total Total count 93 227 125 82 527
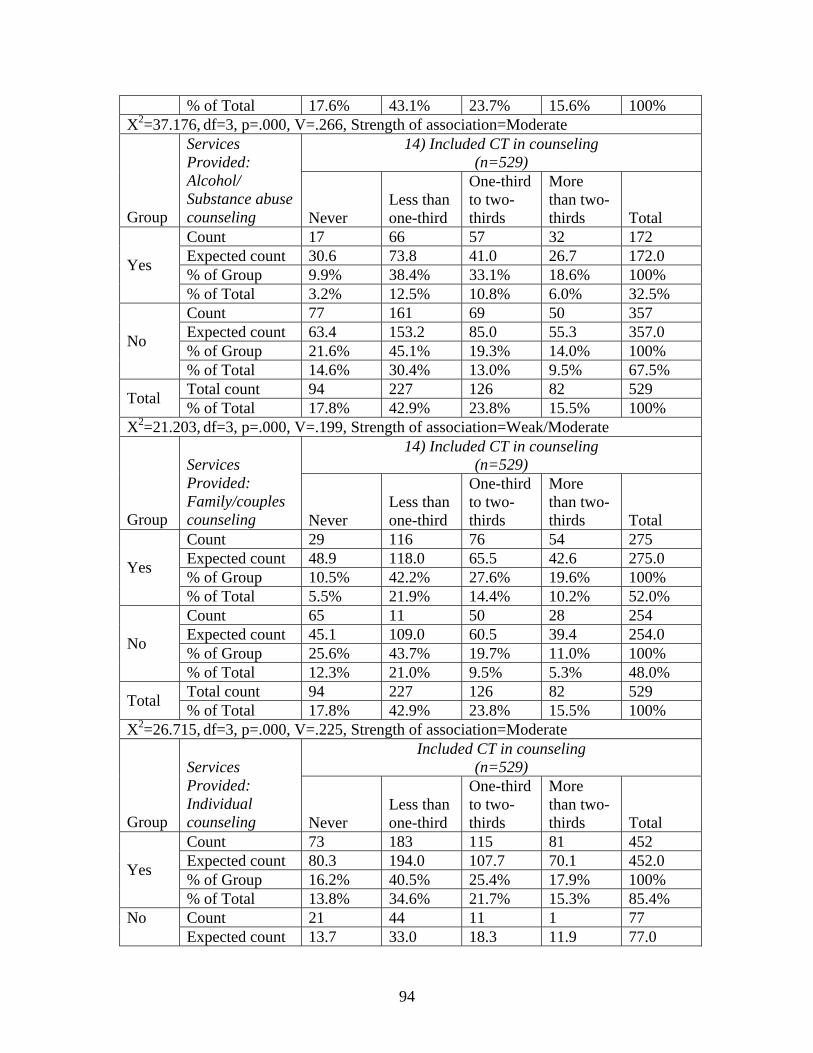
94
% of Total 17.6% 43.1% 23.7% 15.6% 100% X2=37.176, df=3, p=.000, V=.266, Strength of association=Moderate
14) Included CT in counseling (n=529)
Group
Services Provided: Alcohol/ Substance abuse counseling Never
Less than one-third
One-third to two-thirds
More than two-thirds Total
Count 17 66 57 32 172 Expected count 30.6 73.8 41.0 26.7 172.0 % of Group 9.9% 38.4% 33.1% 18.6% 100% Yes
% of Total 3.2% 12.5% 10.8% 6.0% 32.5% Count 77 161 69 50 357 Expected count 63.4 153.2 85.0 55.3 357.0 % of Group 21.6% 45.1% 19.3% 14.0% 100% No
% of Total 14.6% 30.4% 13.0% 9.5% 67.5% Total count 94 227 126 82 529 Total % of Total 17.8% 42.9% 23.8% 15.5% 100%
X2=21.203, df=3, p=.000, V=.199, Strength of association=Weak/Moderate 14) Included CT in counseling
(n=529)
Group
Services Provided: Family/couples counseling Never
Less than one-third
One-third to two-thirds
More than two-thirds Total
Count 29 116 76 54 275 Expected count 48.9 118.0 65.5 42.6 275.0 % of Group 10.5% 42.2% 27.6% 19.6% 100% Yes
% of Total 5.5% 21.9% 14.4% 10.2% 52.0% Count 65 11 50 28 254 Expected count 45.1 109.0 60.5 39.4 254.0 % of Group 25.6% 43.7% 19.7% 11.0% 100% No
% of Total 12.3% 21.0% 9.5% 5.3% 48.0% Total count 94 227 126 82 529 Total % of Total 17.8% 42.9% 23.8% 15.5% 100%
X2=26.715, df=3, p=.000, V=.225, Strength of association=Moderate Included CT in counseling
(n=529)
Group
Services Provided: Individual counseling Never
Less than one-third
One-third to two-thirds
More than two-thirds Total
Count 73 183 115 81 452 Expected count 80.3 194.0 107.7 70.1 452.0 % of Group 16.2% 40.5% 25.4% 17.9% 100% Yes
% of Total 13.8% 34.6% 21.7% 15.3% 85.4% Count 21 44 11 1 77 No Expected count 13.7 33.0 18.3 11.9 77.0
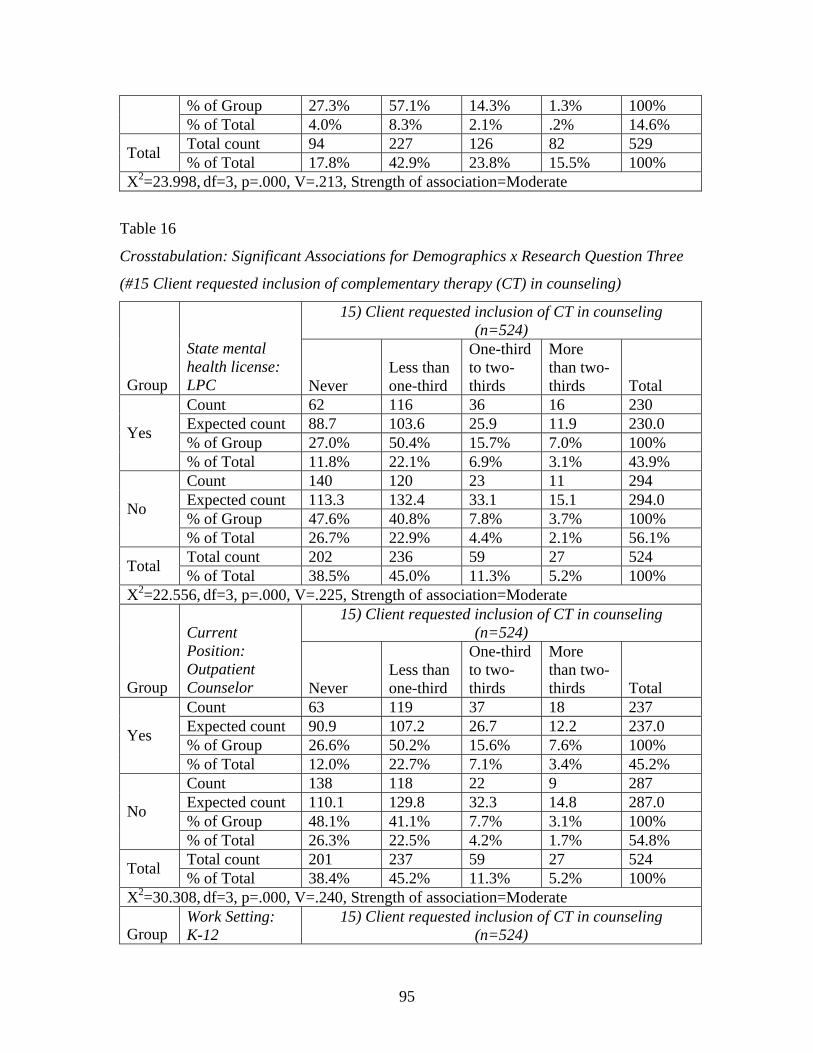
95
% of Group 27.3% 57.1% 14.3% 1.3% 100% % of Total 4.0% 8.3% 2.1% .2% 14.6% Total count 94 227 126 82 529 Total % of Total 17.8% 42.9% 23.8% 15.5% 100%
X2=23.998, df=3, p=.000, V=.213, Strength of association=Moderate
Table 16
Crosstabulation: Significant Associations for Demographics x Research Question Three
(#15 Client requested inclusion of complementary therapy (CT) in counseling)
15) Client requested inclusion of CT in counseling (n=524)
Group
State mental health license: LPC Never
Less than one-third
One-third to two-thirds
More than two-thirds Total
Count 62 116 36 16 230 Expected count 88.7 103.6 25.9 11.9 230.0 % of Group 27.0% 50.4% 15.7% 7.0% 100% Yes
% of Total 11.8% 22.1% 6.9% 3.1% 43.9% Count 140 120 23 11 294 Expected count 113.3 132.4 33.1 15.1 294.0 % of Group 47.6% 40.8% 7.8% 3.7% 100% No
% of Total 26.7% 22.9% 4.4% 2.1% 56.1% Total count 202 236 59 27 524 Total % of Total 38.5% 45.0% 11.3% 5.2% 100%
X2=22.556, df=3, p=.000, V=.225, Strength of association=Moderate 15) Client requested inclusion of CT in counseling
(n=524)
Group
Current Position: Outpatient Counselor Never
Less than one-third
One-third to two-thirds
More than two-thirds Total
Count 63 119 37 18 237 Expected count 90.9 107.2 26.7 12.2 237.0 % of Group 26.6% 50.2% 15.6% 7.6% 100% Yes
% of Total 12.0% 22.7% 7.1% 3.4% 45.2% Count 138 118 22 9 287 Expected count 110.1 129.8 32.3 14.8 287.0 % of Group 48.1% 41.1% 7.7% 3.1% 100% No
% of Total 26.3% 22.5% 4.2% 1.7% 54.8% Total count 201 237 59 27 524 Total % of Total 38.4% 45.2% 11.3% 5.2% 100%
X2=30.308, df=3, p=.000, V=.240, Strength of association=Moderate
Group Work Setting: K-12
15) Client requested inclusion of CT in counseling (n=524)
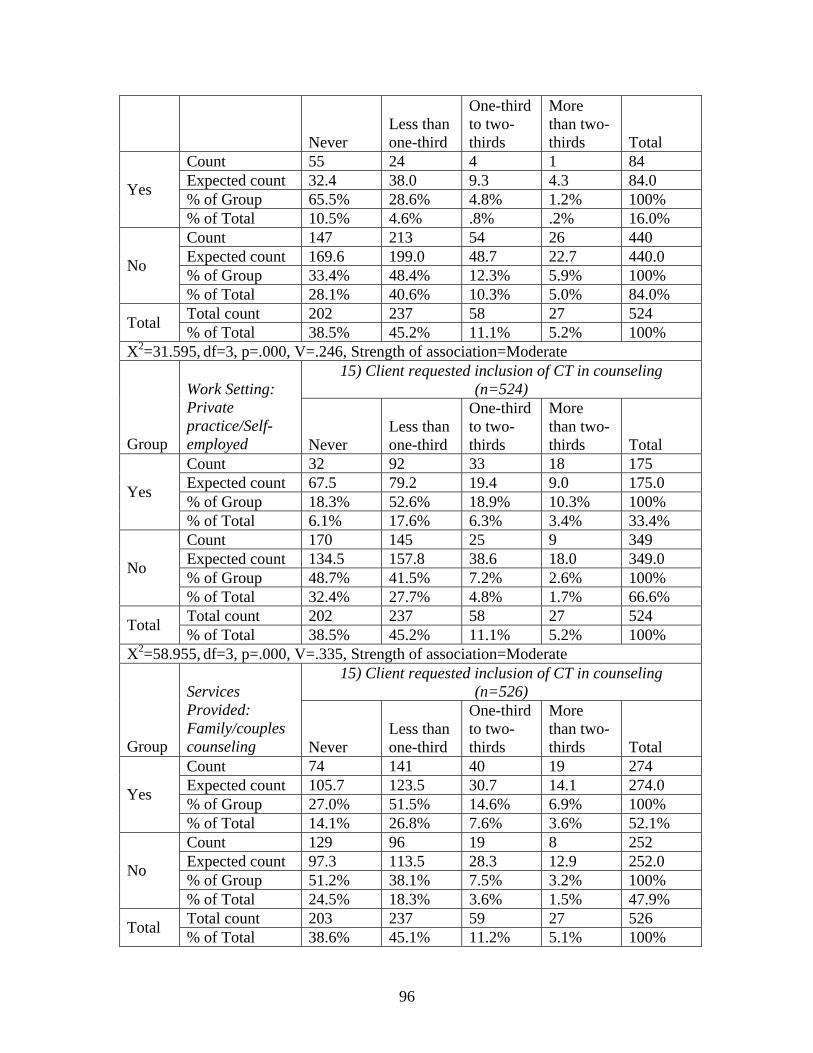
96
Never Less than one-third
One-third to two-thirds
More than two-thirds Total
Count 55 24 4 1 84 Expected count 32.4 38.0 9.3 4.3 84.0 % of Group 65.5% 28.6% 4.8% 1.2% 100% Yes
% of Total 10.5% 4.6% .8% .2% 16.0% Count 147 213 54 26 440 Expected count 169.6 199.0 48.7 22.7 440.0 % of Group 33.4% 48.4% 12.3% 5.9% 100% No
% of Total 28.1% 40.6% 10.3% 5.0% 84.0% Total count 202 237 58 27 524 Total % of Total 38.5% 45.2% 11.1% 5.2% 100%
X2=31.595, df=3, p=.000, V=.246, Strength of association=Moderate 15) Client requested inclusion of CT in counseling
(n=524)
Group
Work Setting: Private practice/Self-employed Never
Less than one-third
One-third to two-thirds
More than two-thirds Total
Count 32 92 33 18 175 Expected count 67.5 79.2 19.4 9.0 175.0 % of Group 18.3% 52.6% 18.9% 10.3% 100% Yes
% of Total 6.1% 17.6% 6.3% 3.4% 33.4% Count 170 145 25 9 349 Expected count 134.5 157.8 38.6 18.0 349.0 % of Group 48.7% 41.5% 7.2% 2.6% 100% No
% of Total 32.4% 27.7% 4.8% 1.7% 66.6% Total count 202 237 58 27 524 Total % of Total 38.5% 45.2% 11.1% 5.2% 100%
X2=58.955, df=3, p=.000, V=.335, Strength of association=Moderate 15) Client requested inclusion of CT in counseling
(n=526)
Group
Services Provided: Family/couples counseling Never
Less than one-third
One-third to two-thirds
More than two-thirds Total
Count 74 141 40 19 274 Expected count 105.7 123.5 30.7 14.1 274.0 % of Group 27.0% 51.5% 14.6% 6.9% 100% Yes
% of Total 14.1% 26.8% 7.6% 3.6% 52.1% Count 129 96 19 8 252 Expected count 97.3 113.5 28.3 12.9 252.0 % of Group 51.2% 38.1% 7.5% 3.2% 100% No
% of Total 24.5% 18.3% 3.6% 1.5% 47.9% Total count 203 237 59 27 526 Total % of Total 38.6% 45.1% 11.2% 5.1% 100%
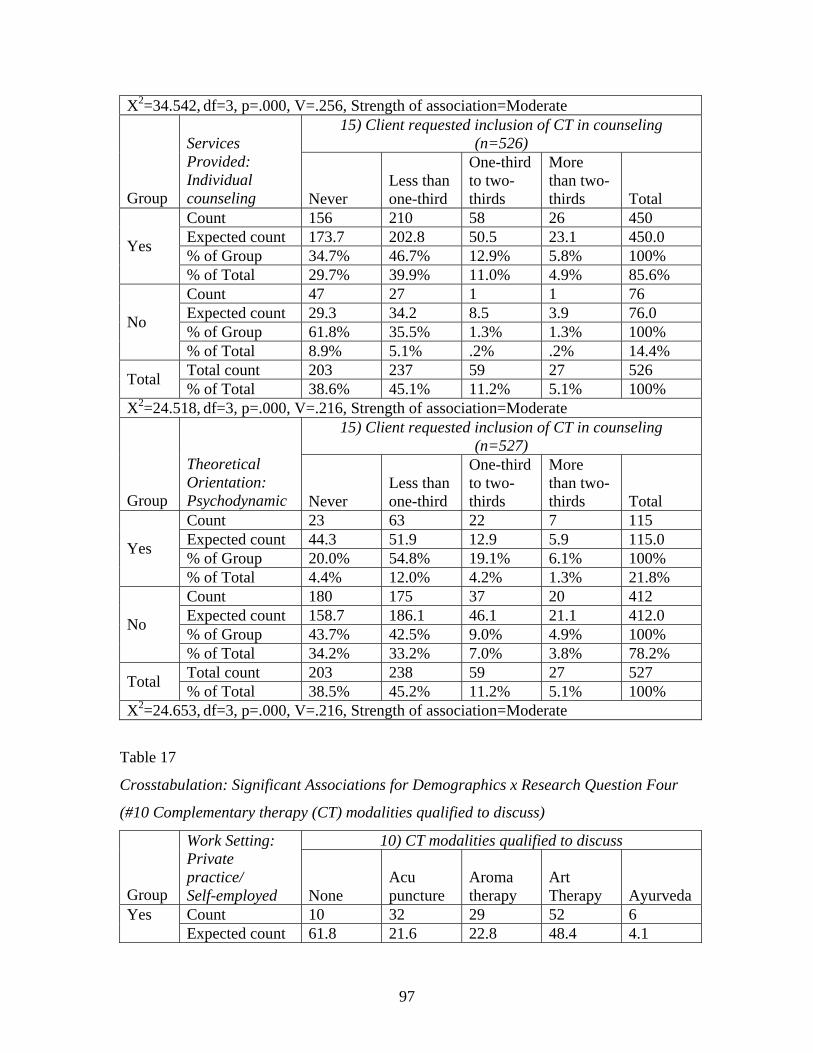
97
X2=34.542, df=3, p=.000, V=.256, Strength of association=Moderate 15) Client requested inclusion of CT in counseling
(n=526)
Group
Services Provided: Individual counseling Never
Less than one-third
One-third to two-thirds
More than two-thirds Total
Count 156 210 58 26 450 Expected count 173.7 202.8 50.5 23.1 450.0 % of Group 34.7% 46.7% 12.9% 5.8% 100% Yes
% of Total 29.7% 39.9% 11.0% 4.9% 85.6% Count 47 27 1 1 76 Expected count 29.3 34.2 8.5 3.9 76.0 % of Group 61.8% 35.5% 1.3% 1.3% 100% No
% of Total 8.9% 5.1% .2% .2% 14.4% Total count 203 237 59 27 526 Total % of Total 38.6% 45.1% 11.2% 5.1% 100%
X2=24.518, df=3, p=.000, V=.216, Strength of association=Moderate 15) Client requested inclusion of CT in counseling
(n=527)
Group
Theoretical Orientation: Psychodynamic Never
Less than one-third
One-third to two-thirds
More than two-thirds Total
Count 23 63 22 7 115 Expected count 44.3 51.9 12.9 5.9 115.0 % of Group 20.0% 54.8% 19.1% 6.1% 100% Yes
% of Total 4.4% 12.0% 4.2% 1.3% 21.8% Count 180 175 37 20 412 Expected count 158.7 186.1 46.1 21.1 412.0 % of Group 43.7% 42.5% 9.0% 4.9% 100% No
% of Total 34.2% 33.2% 7.0% 3.8% 78.2% Total count 203 238 59 27 527 Total % of Total 38.5% 45.2% 11.2% 5.1% 100%
X2=24.653, df=3, p=.000, V=.216, Strength of association=Moderate
Table 17
Crosstabulation: Significant Associations for Demographics x Research Question Four
(#10 Complementary therapy (CT) modalities qualified to discuss)
10) CT modalities qualified to discuss
Group
Work Setting: Private practice/ Self-employed None
Acu puncture
Aroma therapy
Art Therapy Ayurveda
Count 10 32 29 52 6 Yes Expected count 61.8 21.6 22.8 48.4 4.1
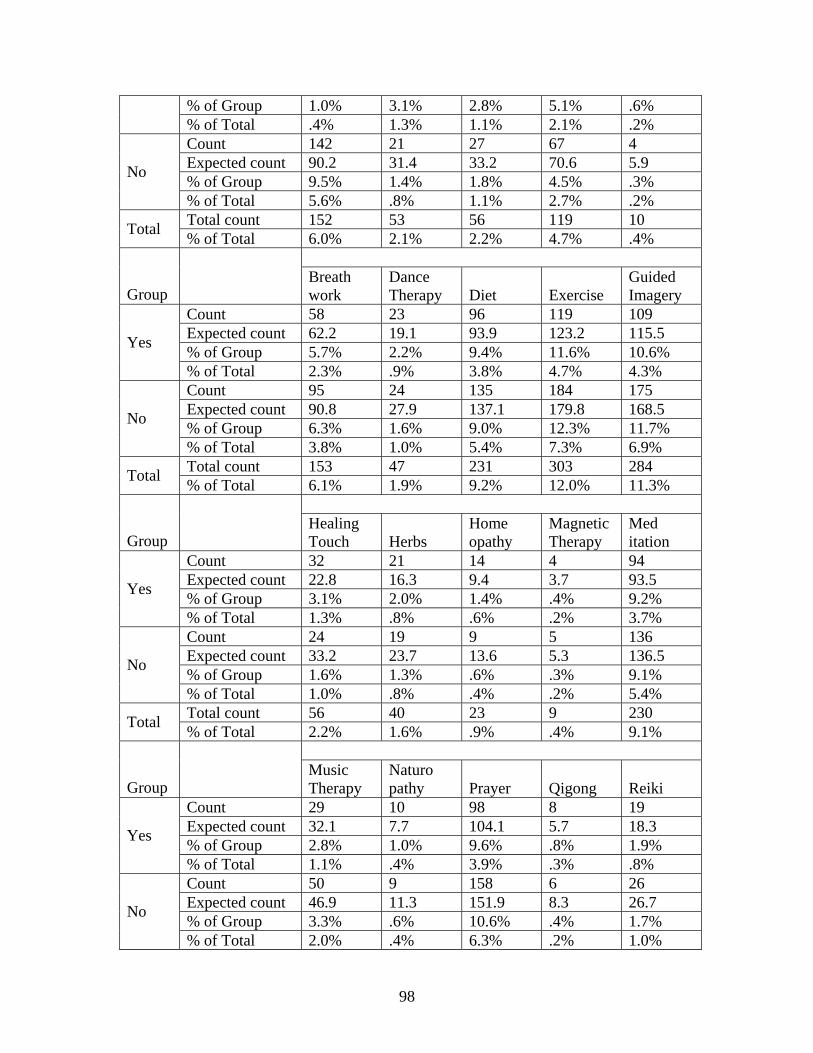
98
% of Group 1.0% 3.1% 2.8% 5.1% .6% % of Total .4% 1.3% 1.1% 2.1% .2% Count 142 21 27 67 4 Expected count 90.2 31.4 33.2 70.6 5.9 % of Group 9.5% 1.4% 1.8% 4.5% .3% No
% of Total 5.6% .8% 1.1% 2.7% .2% Total count 152 53 56 119 10 Total % of Total 6.0% 2.1% 2.2% 4.7% .4%
Group Breath work
Dance Therapy Diet Exercise
Guided Imagery
Count 58 23 96 119 109 Expected count 62.2 19.1 93.9 123.2 115.5 % of Group 5.7% 2.2% 9.4% 11.6% 10.6% Yes
% of Total 2.3% .9% 3.8% 4.7% 4.3% Count 95 24 135 184 175 Expected count 90.8 27.9 137.1 179.8 168.5 % of Group 6.3% 1.6% 9.0% 12.3% 11.7% No
% of Total 3.8% 1.0% 5.4% 7.3% 6.9% Total count 153 47 231 303 284 Total % of Total 6.1% 1.9% 9.2% 12.0% 11.3%
Group Healing Touch Herbs
Home opathy
Magnetic Therapy
Med itation
Count 32 21 14 4 94 Expected count 22.8 16.3 9.4 3.7 93.5 % of Group 3.1% 2.0% 1.4% .4% 9.2% Yes
% of Total 1.3% .8% .6% .2% 3.7% Count 24 19 9 5 136 Expected count 33.2 23.7 13.6 5.3 136.5 % of Group 1.6% 1.3% .6% .3% 9.1% No
% of Total 1.0% .8% .4% .2% 5.4% Total count 56 40 23 9 230 Total % of Total 2.2% 1.6% .9% .4% 9.1%
Group Music Therapy
Naturo pathy Prayer Qigong Reiki
Count 29 10 98 8 19 Expected count 32.1 7.7 104.1 5.7 18.3 % of Group 2.8% 1.0% 9.6% .8% 1.9% Yes
% of Total 1.1% .4% 3.9% .3% .8% Count 50 9 158 6 26 Expected count 46.9 11.3 151.9 8.3 26.7 % of Group 3.3% .6% 10.6% .4% 1.7% No
% of Total 2.0% .4% 6.3% .2% 1.0%
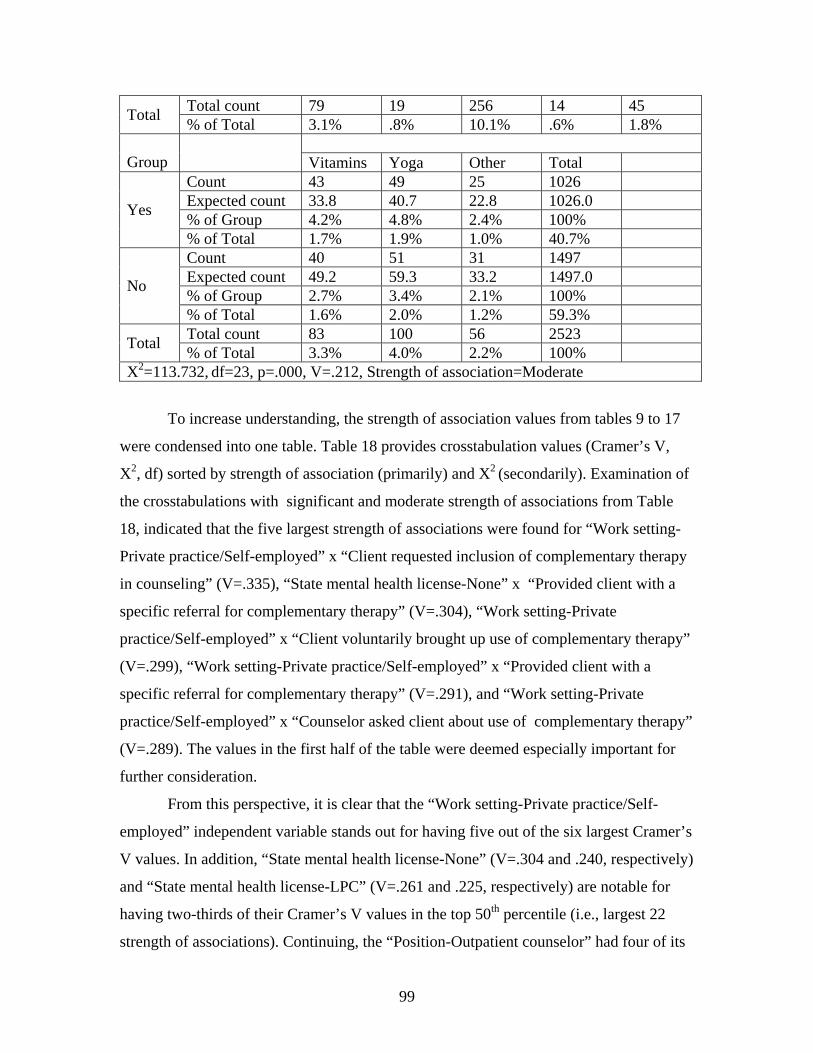
99
Total count 79 19 256 14 45 Total % of Total 3.1% .8% 10.1% .6% 1.8%
Group Vitamins Yoga Other Total Count 43 49 25 1026 Expected count 33.8 40.7 22.8 1026.0 % of Group 4.2% 4.8% 2.4% 100% Yes
% of Total 1.7% 1.9% 1.0% 40.7% Count 40 51 31 1497 Expected count 49.2 59.3 33.2 1497.0 % of Group 2.7% 3.4% 2.1% 100% No
% of Total 1.6% 2.0% 1.2% 59.3% Total count 83 100 56 2523 Total % of Total 3.3% 4.0% 2.2% 100%
X2=113.732, df=23, p=.000, V=.212, Strength of association=Moderate
To increase understanding, the strength of association values from tables 9 to 17
were condensed into one table. Table 18 provides crosstabulation values (Cramer’s V,
X2, df) sorted by strength of association (primarily) and X2 (secondarily). Examination of
the crosstabulations with significant and moderate strength of associations from Table
18, indicated that the five largest strength of associations were found for “Work setting-
Private practice/Self-employed” x “Client requested inclusion of complementary therapy
in counseling” (V=.335), “State mental health license-None” x “Provided client with a
specific referral for complementary therapy” (V=.304), “Work setting-Private
practice/Self-employed” x “Client voluntarily brought up use of complementary therapy”
(V=.299), “Work setting-Private practice/Self-employed” x “Provided client with a
specific referral for complementary therapy” (V=.291), and “Work setting-Private
practice/Self-employed” x “Counselor asked client about use of complementary therapy”
(V=.289). The values in the first half of the table were deemed especially important for
further consideration.
From this perspective, it is clear that the “Work setting-Private practice/Self-
employed” independent variable stands out for having five out of the six largest Cramer’s
V values. In addition, “State mental health license-None” (V=.304 and .240, respectively)
and “State mental health license-LPC” (V=.261 and .225, respectively) are notable for
having two-thirds of their Cramer’s V values in the top 50th percentile (i.e., largest 22
strength of associations). Continuing, the “Position-Outpatient counselor” had four of its
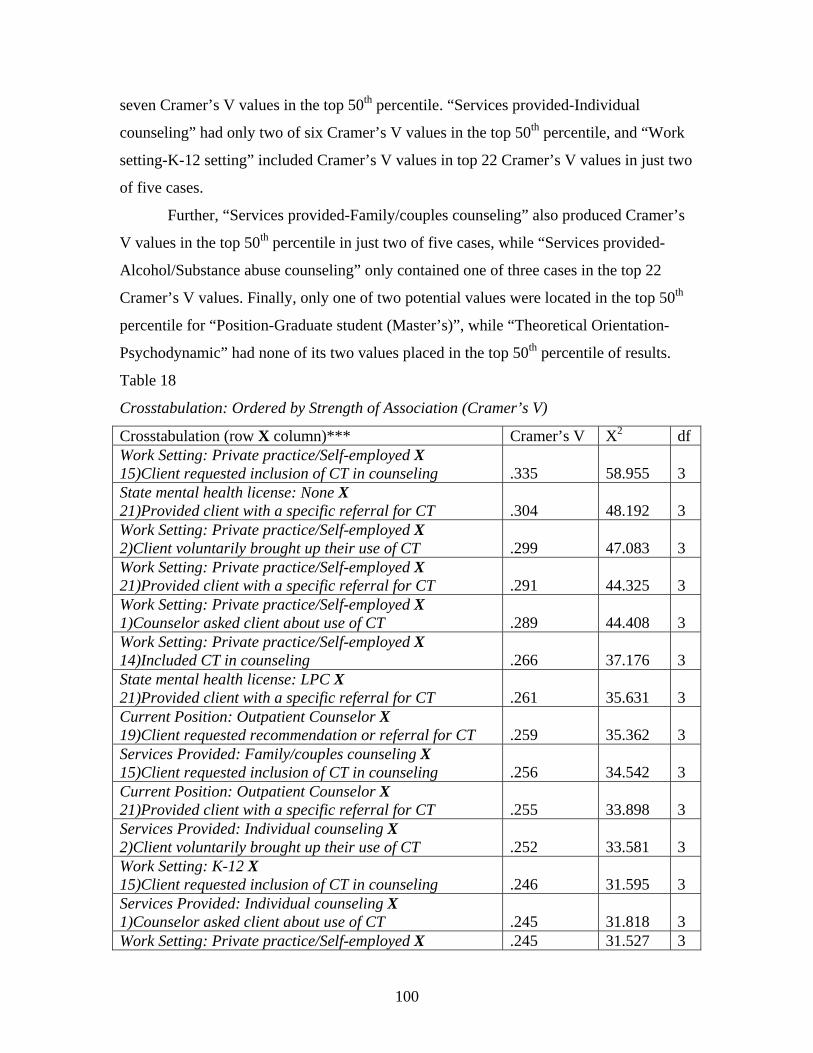
100
seven Cramer’s V values in the top 50th percentile. “Services provided-Individual
counseling” had only two of six Cramer’s V values in the top 50th percentile, and “Work
setting-K-12 setting” included Cramer’s V values in top 22 Cramer’s V values in just two
of five cases.
Further, “Services provided-Family/couples counseling” also produced Cramer’s
V values in the top 50th percentile in just two of five cases, while “Services provided-
Alcohol/Substance abuse counseling” only contained one of three cases in the top 22
Cramer’s V values. Finally, only one of two potential values were located in the top 50th
percentile for “Position-Graduate student (Master’s)”, while “Theoretical Orientation-
Psychodynamic” had none of its two values placed in the top 50th percentile of results.
Table 18
Crosstabulation: Ordered by Strength of Association (Cramer’s V)
Crosstabulation (row X column)*** Cramer’s V X2 df Work Setting: Private practice/Self-employed X 15)Client requested inclusion of CT in counseling .335 58.955 3 State mental health license: None X 21)Provided client with a specific referral for CT .304 48.192 3 Work Setting: Private practice/Self-employed X 2)Client voluntarily brought up their use of CT .299 47.083 3 Work Setting: Private practice/Self-employed X 21)Provided client with a specific referral for CT .291 44.325 3 Work Setting: Private practice/Self-employed X 1)Counselor asked client about use of CT .289 44.408 3 Work Setting: Private practice/Self-employed X 14)Included CT in counseling .266 37.176 3 State mental health license: LPC X 21)Provided client with a specific referral for CT .261 35.631 3 Current Position: Outpatient Counselor X 19)Client requested recommendation or referral for CT .259 35.362 3 Services Provided: Family/couples counseling X 15)Client requested inclusion of CT in counseling .256 34.542 3 Current Position: Outpatient Counselor X 21)Provided client with a specific referral for CT .255 33.898 3 Services Provided: Individual counseling X 2)Client voluntarily brought up their use of CT .252 33.581 3 Work Setting: K-12 X 15)Client requested inclusion of CT in counseling .246 31.595 3 Services Provided: Individual counseling X 1)Counselor asked client about use of CT .245 31.818 3 Work Setting: Private practice/Self-employed X .245 31.527 3
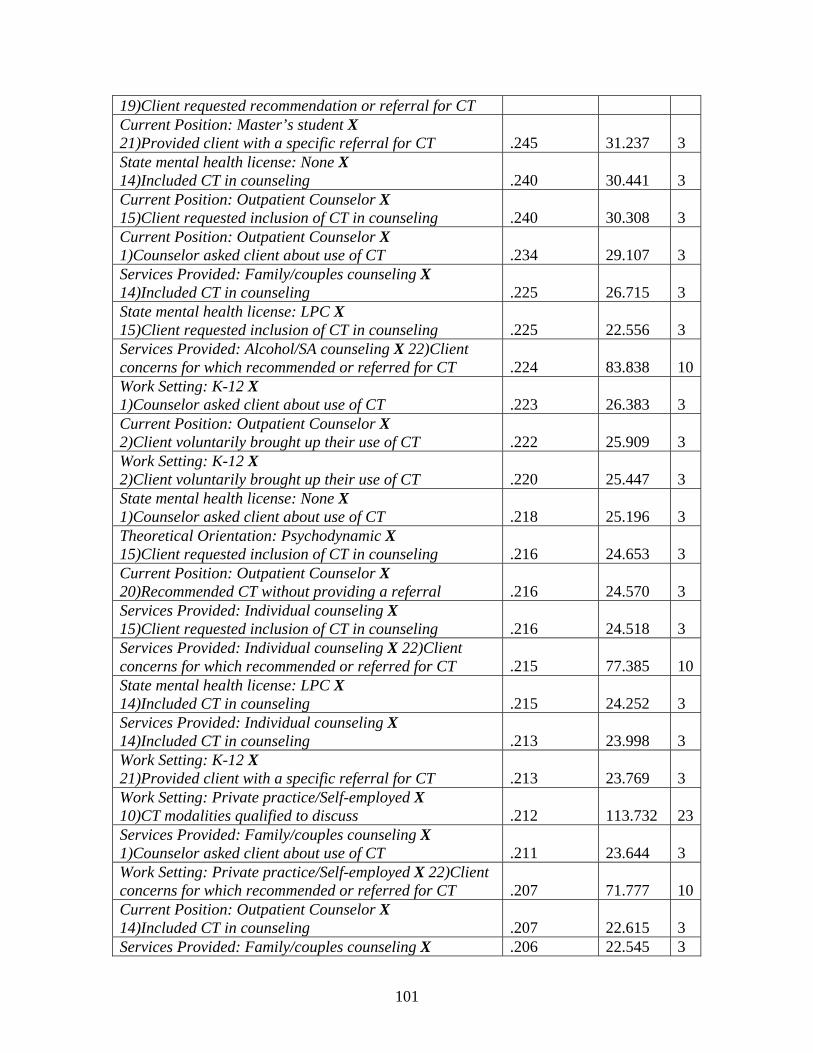
101
19)Client requested recommendation or referral for CT Current Position: Master’s student X 21)Provided client with a specific referral for CT .245 31.237 3 State mental health license: None X 14)Included CT in counseling .240 30.441 3 Current Position: Outpatient Counselor X 15)Client requested inclusion of CT in counseling .240 30.308 3 Current Position: Outpatient Counselor X 1)Counselor asked client about use of CT .234 29.107 3 Services Provided: Family/couples counseling X 14)Included CT in counseling .225 26.715 3 State mental health license: LPC X 15)Client requested inclusion of CT in counseling .225 22.556 3 Services Provided: Alcohol/SA counseling X 22)Client concerns for which recommended or referred for CT .224 83.838 10Work Setting: K-12 X 1)Counselor asked client about use of CT .223 26.383 3 Current Position: Outpatient Counselor X 2)Client voluntarily brought up their use of CT .222 25.909 3 Work Setting: K-12 X 2)Client voluntarily brought up their use of CT .220 25.447 3 State mental health license: None X 1)Counselor asked client about use of CT .218 25.196 3 Theoretical Orientation: Psychodynamic X 15)Client requested inclusion of CT in counseling .216 24.653 3 Current Position: Outpatient Counselor X 20)Recommended CT without providing a referral .216 24.570 3 Services Provided: Individual counseling X 15)Client requested inclusion of CT in counseling .216 24.518 3 Services Provided: Individual counseling X 22)Client concerns for which recommended or referred for CT .215 77.385 10State mental health license: LPC X 14)Included CT in counseling .215 24.252 3 Services Provided: Individual counseling X 14)Included CT in counseling .213 23.998 3 Work Setting: K-12 X 21)Provided client with a specific referral for CT .213 23.769 3 Work Setting: Private practice/Self-employed X 10)CT modalities qualified to discuss .212 113.732 23Services Provided: Family/couples counseling X 1)Counselor asked client about use of CT .211 23.644 3 Work Setting: Private practice/Self-employed X 22)Client concerns for which recommended or referred for CT .207 71.777 10Current Position: Outpatient Counselor X 14)Included CT in counseling .207 22.615 3 Services Provided: Family/couples counseling X .206 22.545 3
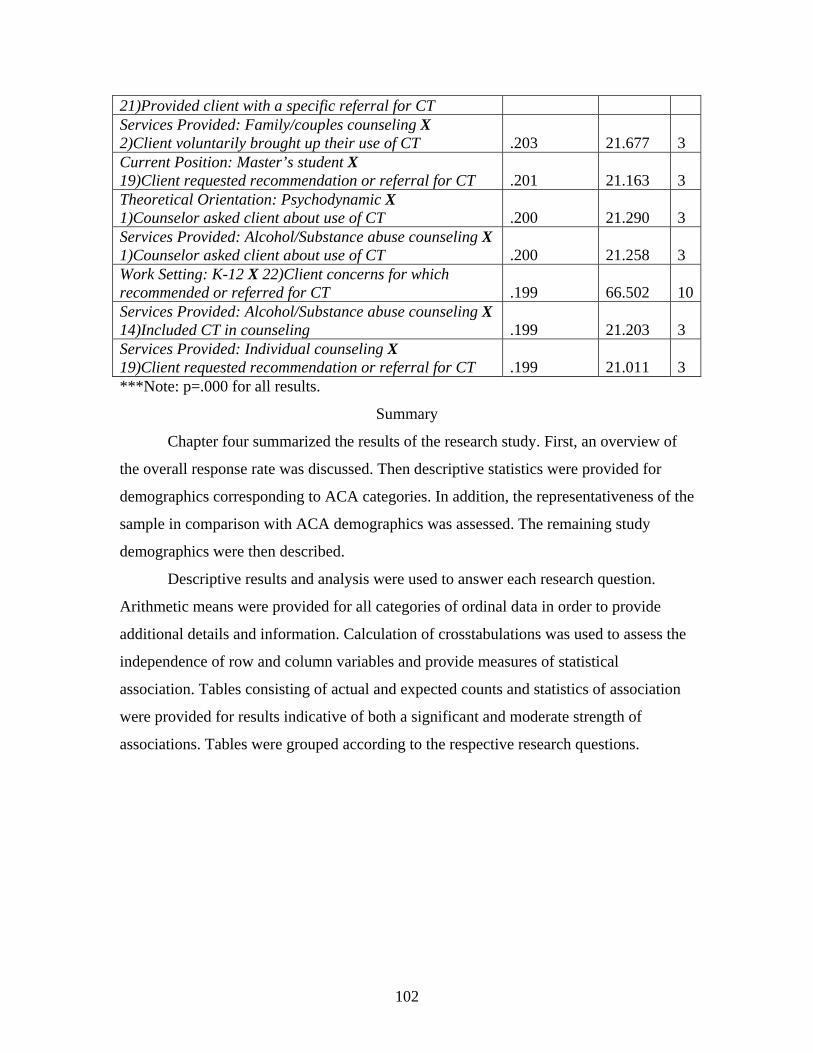
102
21)Provided client with a specific referral for CT Services Provided: Family/couples counseling X 2)Client voluntarily brought up their use of CT .203 21.677 3 Current Position: Master’s student X 19)Client requested recommendation or referral for CT .201 21.163 3 Theoretical Orientation: Psychodynamic X 1)Counselor asked client about use of CT .200 21.290 3 Services Provided: Alcohol/Substance abuse counseling X 1)Counselor asked client about use of CT .200 21.258 3 Work Setting: K-12 X 22)Client concerns for which recommended or referred for CT .199 66.502 10Services Provided: Alcohol/Substance abuse counseling X 14)Included CT in counseling .199 21.203 3 Services Provided: Individual counseling X 19)Client requested recommendation or referral for CT .199 21.011 3 ***Note: p=.000 for all results.
Summary
Chapter four summarized the results of the research study. First, an overview of
the overall response rate was discussed. Then descriptive statistics were provided for
demographics corresponding to ACA categories. In addition, the representativeness of the
sample in comparison with ACA demographics was assessed. The remaining study
demographics were then described.
Descriptive results and analysis were used to answer each research question.
Arithmetic means were provided for all categories of ordinal data in order to provide
additional details and information. Calculation of crosstabulations was used to assess the
independence of row and column variables and provide measures of statistical
association. Tables consisting of actual and expected counts and statistics of association
were provided for results indicative of both a significant and moderate strength of
associations. Tables were grouped according to the respective research questions.
103
CHAPTER FIVE
DISCUSSION AND RECOMMENDATIONS
This chapter summarizes and discusses the findings of the study. First, an
overview of research participants is provided. Then, the results are discussed with respect
to each research question, with implications from the literature. The limitations of the
study and recommendations emerging from the study are then presented. Finally, a
summary is given.
Profile of Participants
The typical respondent to the survey was female (77%), Caucasian (84%) and
hold a Master’s (61%) as their highest earned degree. They have an income between
$40,000 and 59,999 (21%), earned from work as an outpatient counselor (37%) in a
private practice/self-employed (28%) or community agency (25%) setting. Respondents
may also earn below $12,500 (25%), as a master’s student (24%) in a college/university
(24%) setting. Somewhat fewer, but a still significant number of respondents work in K-
12 setting (16%), probably as a school counselor (15%).
The external validity of the sample was examined through comparison of the
survey demographics with the equivalent ACA statistics. The sample was found to
closely represent ACA demographics with regards to race/ethnicity. On the other hand,
the results suggest that the sample does not correspond to ACA membership according to
highest degree, gender, salary, work setting and position.
Table 2 shows the differences between the sample (i.e., Observed N(f)) and the
ACA population (i.e., Expected N(f)). A significant difference was there were 5.5% more
females than males in the sample (78.9%) versus the ACA population (73.4%). In
addition, respondents making less than $40,000 annually outnumber those reported by
ACA by almost eight percentage points, while the differences at the income level of
$60,000 and above were 2.5% in favor of ACA members. Over eight percent more of
respondents have only a Bachelor’s degree as compared to ACA membership. On the
other hand, more ACA members have earned a Master’s degree (71% vs. 63%) or
Doctorate degree (18.5% vs. 12.1%) in comparison to respondents. Further, over 18%
more survey respondents reported being a student as opposed to the ACA membership.
Finally, work setting was more commonly a community agency (25.1% vs. 14.1%)
104
college/university (24.5% vs. 19.1%), or the now familiar “Other” setting (21.1% vs.
7.6%) when comparing respondents to the ACA population.
One possible explanation for the discrepancies between these two populations
may be the greater number of students in the survey sample as compared to ACA. It
seems reasonable that students have not finished their terminal (practitioner) degree, earn
less income and work in a wider variety of settings.
Additional demographic data indicated that respondents are most likely to be
between 45 and 54 years of age (27.9%) and hold no state mental health license (49.6%)
or National Certified Counselor credential (64.7%). Respondents are relatively new (0-6
years) to counseling (59.2%), and see less than six clients per week (28.9%).
Respondents reported that they most frequently provide individual therapy (70.2%),
frequently from a cognitive-behavioral theoretical perspective (70.3%).
In concluding this section, it is interesting to note the congruence between
respondent demographics and those factors reported in chapter two as being consistently
associated with the use of complementary therapy. Studies correlating the use of
complementary therapy with being female, Caucasian, ages 35 to 64, having a higher
socioeconomic status and being college educated are in agreement with the typical
respondent to this survey (Astin, 1998; Eisenberg, et al., 1993, 1998; Paramor, 1996;
Unutzer et al., 2000). However, allowance does need to be made for the significant
number of survey respondents claiming student status.
Overview of Findings
The six research questions provide a logical platform for discussion of the results
of the study. Implications from the literature provide an additional context for the present
research.
Research Question One
Research question one considered respondents’ inquiries and clients’ disclosures
of clients’ complementary therapy use. Respondents answered in this matter via survey
questions 1 to 5.
It is clear from the responses to survey question 1 that few respondents asked their
clients about clients’ use of complementary therapy. In fact, almost half of respondents
(46.4%) asked less than one-third of their clients specifically about their use of
105
complementary therapy. This included a significant number of respondents (27.5%) that
asked none of their clients about clients’ use of complementary therapy. These findings
are congruent with the literature, which reported that broaching the subject of clients’
complementary therapy use was a challenge for caregivers (Haller, 2001).
Along the same lines, the minority of clients voluntarily brought up their use of
complementary therapy with respondents, according to the results of survey question 2.
Almost 59% of respondents had less than one-third of their clients bring up this issue
with them. The literature is clear that clients’ are reluctant about sharing their
complementary therapy use with their caregivers (Eisenberg, et al., 1993, 1998; Knaudt,
et al., 1999). Clearly, this reticence extends to the experiences of respondents with regard
to clients’ volunteering their use of complementary therapy.
It is discouraging that respondents appear to be similar to other professional
caregivers who tended to dramatically underestimate their clients use of complementary
therapy (Baumrucker, 2002). Given that over 50% of mental health clients with common
disorders reported using complementary therapy in the past year (Kessler, et al., 2001),
the present study suggests that over half of respondents are unaware of their clients’
complementary therapy use (i.e., 17.4% who had no clients’ volunteer use and 41.9%
who had less than one-third of clients’ volunteer use). Counselors would be wise to
question this two-way lack of communication as it is in stark contrast with professional
viewpoints of client-centeredness (Glauser & Bozarth, 2001).
Respondents reported via survey question 3 that clients were most likely to have
used the complementary therapies of “Exercise” (60.1%), “Prayer” (51.8%) and/or “Diet”
(45.8%). These three categories were reported, on average, by over half of clients. These
findings are encouraging given the substantial and compelling research supporting the
efficacy of both exercise (Ernst, et al., 1998) and diet (Miller, 1996) in the treatment of
mental illness.
Over 65% of respondents attributed at least “Some positive effect” to their clients’
use of complementary therapy (survey question 4). On the other hand, almost as many
respondents (58.7%) reported there were “No” or only “Slight negative effects” from
their clients’ use of complementary therapy (survey question 5). In addition, less than 4%
of respondents credited complementary therapy with only a “Slight positive effect” and
106
no respondents cited “No positive effects”. Likewise, only 2% of respondents claimed
“Slight negative effects” from their clients’ use of complementary therapy, while only
one respondent reported a “Great negative effect”. In essence, respondents are reporting
that for the majority of their clients complementary therapy provides at least some
positive and few negative consequences.
The proportion of respondents reporting positive client responses are in line with
pertinent research concerning psychiatric patients’ responses to complementary therapy
(Kessler, et al., 2001; Knaudt, et al., 1999). In contrast, there was no direct corollary
found in the literature addressing negative outcomes resulting from the use of
complementary therapy.
Research Question Two
This research question explored respondents’ complementary therapy
recommendation and referral patterns. Survey questions 19 to 24 were employed to
address these concerns.
For most respondents (61.9%), less than one-third of their clients specifically
requested a recommendation or referral for complementary therapy, according to survey
question 19. This result is in line with research, which showed that client requests are one
of the most important determinants of caregiver complementary therapy referral patterns
(Berman, et al., 1999).
Similarly, 58.5% respondents recommended complementary therapy without
providing a specific referral to less than one-third of their clients, according to data from
survey question 20. Furthermore, the data from survey question 21 showed that less than
10% of respondents provided their clients with a specific referral for complementary
therapy more than one-third of the time. The corollary to this statistic is that 70% of the
time less than one-third of clients were given a specific referral for complementary
therapy.
In other words, clients infrequently asked for complementary therapy
recommendations or referrals, while respondents only occasionally recommended, and
even less frequently, specifically provide a referral for complementary therapy. These
results are interesting when compared with reports that greater than 60% of physicians
made at least one complementary therapy referral in the past year (Borkan, et al., 1994).
107
Anxiety (52.7%) and depression (51.6%) were by far the most common client
concerns which prompted respondents to recommend or refer for complementary therapy,
according to survey question 22. Several researchers have reported similar frequencies
for complementary therapy usage in clients with anxiety disorders and depression
(Kessler, et al., 2001; Unutzer, et al., 2000). It makes sense that if, as Borkan, et al.
(1994) established, referrals are generally based on client requests, then the referral
patterns for client concerns in this study are in line with client usage.
Respondents’ answers to survey question 23 regarding reasons for not
recommending or referring complementary therapy were fairly evenly divided among
“Has not come up as a client concern” (32.4%), “Client discomfort with complementary
therapy” (28.6%), “Lack of knowledge and/or training in complementary therapy”
(26.5%) and “Not sure who to refer to” (26.2%). It is not surprising that “Has not come
up as a client concern”, was the most common negative attribution for referrals, given it
was previously established that the majority of clients do not bring up their
complementary therapy usage. It also makes sense that clients would express
“discomfort” with complementary therapy if they are not bringing this issue up and
respondents are not asking. Eisenberg (1997) provided a strong admonishment against the
medical profession’s “don’t ask, don’t tell” policy that has distinguished physician-
patient communication in this matter.
Concerns about “Lack of knowledge and/or training in complementary therapy”
echo Berman et al.’s (1999) report that physicians were more likely to provide referrals
for modalities in which they had training. It therefore seems obvious that a lack of
training (or knowledge) would emerge as a primary determinant for respondents not
recommending or referring clients for complementary therapy. In fact, Bassman and
Uellendahl (2003) attributed much of the scarcity of therapists integrating complementary
therapies into their practice to a lack of training.
The “Not sure who to refer to” category may be indicative of a “gap” between
counselors and the complementary therapy community. A similar disengagement has
been reported between physicians and complementary therapy practitioners (Mainous, et
al., 2000).
108
On the other hand, it is encouraging that “Lack of research” (6.1%) and “Poor
acceptance by profession” (3.0%) were not deemed significant barriers to referring clients
for complementary therapy. This may indicate that respondents are more open than other
caregivers to complementary interventions.
Lastly, respondents overwhelmingly reported (65.1%) in answering survey
question 24 that it was somewhat to very important that client referrals for
complementary therapy be to licensed or certified practitioners. This is congruent with
the expectations that counselors place on their own professional credentials and identity
(Glauser & Bozarth, 2001; Magnuson, 2000; McAuliffe & Eriksen, 1999).
Bassman and Uellendahl (2003) offer a succinct summary of the challenge
complementary therapy referrals present for counselors. They said, “Because so few
psychotherapists have training in alternative healing arts, the process of referral to
qualified practitioners is crucial” (p. 267).
Research Question Three
This research question surveyed respondents concerning their inclusion patterns
for complementary therapy in the practice of counseling. Survey questions 14 to 18 were
employed in this informational quest. Unfortunately, few comparable studies were found
in the literature corresponding to the concerns of this research question.
According to responses to survey question 14, the majority of respondents
(66.6%) included complementary therapy in their practice of counseling with at least one
client during the past year. However, many respondents (12.5%) included complementary
therapy with greater than two-thirds of their clients. As a corollary, a survey of 1000
members of the American Psychological Association, found that indeed it was quite
infrequent for practitioners to include the direct use of complementary therapy in their
practice, although the researchers failed to provide specific data (Bassman & Uellendahl,
2003).
Responses to survey question 15 indicated that the majority of clients (67.1%) did
not request the inclusion of complementary therapy in their counseling. Once again, it is
clear that respondents and their clients often lack open communication regarding
complementary therapy – whether this impasse involves issues of usage, referral or
inclusion (see also research questions one and two).
109
Survey question 16 asked respondents to cite any complementary therapies, which
they may have included in their practice of counseling. “Guided Imagery” (40.5%) and
“Exercise” (39.3%) were the most frequently mentioned modalities. Following were the
complementary therapies of “Diet” (30.3%), “Breathwork” (29.4%), “Meditation”
(27.9%), “Prayer” (23.4%), “Art Therapy” (22.4%), and “Music Therapy” (11.9%). No
other complementary therapies received double-digit mention. These numbers indicate
that for those respondents that do include complementary therapies in their practice of
counseling, they are incorporating a diversity of modalities. Finally, it should be noted
that in terms of “Never” including or including “None” of complementary therapies in
practice, questions 14 and 16 are in basic agreement (n=94 vs. n=97).
Responses to question 17 indicated that respondents were most likely motivated
to include complementary therapy in their counseling work by “Congruence with beliefs
about client change” (43.2%) and “Personal experience with complementary therapy”
(38.5%). These responses are encouraging that respondents may be actively embracing
(i.e., including) the holistic foundation of counseling, as it is aligns with complementary
therapy (Myers, 1992; Shannon, 2002; Witmer & Sweeney, 1992).
Survey question 18 also provided additional evidence that counselors are
consciously moving toward a more holistic mode of practice. In sharing their beliefs
about the inclusion of complementary therapy, most respondents (59.5%) reported that
complementary therapy should be included in addition to counseling. Less than 1% of
respondents felt that complementary therapy should be included in lieu of counseling.
Respondents are essentially saying that counseling and complementary therapy well,
“complement” one another – neither should be exclusive nor eliminated. Fear and Woolfe
(1996) posited that, “perhaps the counsellor’s striving for theoretical integration reflects
the central, if unconscious, therapeutic goal of each and every one of our clients” (p.
410).
Research Question Four
This research question explored respondents’ knowledge and training in
complementary therapy. Survey questions 10 through 13 addressed these concerns.
Responses may be considered exploratory, based on the fact that the literature lacks data
affording useful comparisons.
110
Respondents indicated via survey question 19 that they were most qualified to
discuss “Exercise” (46.9%), “Guided Imagery” (43.7%), “Prayer” (39.9%), “Diet”
(35.3%) and “Meditation” (23.6%). Interestingly, these responses closely parallel the
answers to survey question 14, concerning which complementary therapies respondents
have included in counseling (i.e., “Guided Imagery” (40.5%), “Exercise” (39.3%), “Diet”
(30.3%), “Breathwork” (29.4%), “Meditation” (27.9%) and “Prayer” (23.4%),
respectively).
Not surprisingly, few respondents possessed licensure or certification in
complementary therapy. For those respondents that did indicate having a license or
certification, “Reiki” (3.7%), “Meditation” (2.3%) and “Guided Imagery” (2.3%) were
most common. However, these were the only modalities receiving a greater than 2%
response frequency and amounted to only 54 respondents. In fact, the overwhelming
majority of respondents (79.9%) indicated they hold no license or certification in
complementary therapy. While some medical professionals have begun to acquire dual
credentials (e.g., medical acupuncture), apparently few counselors are willing (or able), to
make this commitment.
Regarding sources of knowledge or training in complementary therapy (survey
question 12), “Books” (62.3%), “Personal experience with complementary therapy”
(47.8%), Colleagues” (43.1%) and the “Internet” (42.0%) were most commonly
mentioned. These responses indicate a trend of informal, self-study by respondents to
gain additional proficiency in complementary therapy. The responses to the categories of
“Workshops” (33.6%) and “Training/education program” (22.3%) are discouraging for
counselor education, given the tremendous interest in developing formal complementary
therapy curricula within medical education (Bhattacharya, 2000; Wetzel, et al., 1998,
2003).
Finally, according to research question 13, respondents most likely want
additional knowledge or training in “Art Therapy” (41.7%), “Guided Imagery” (38.2%),
“Meditation” (33.0%), “Music Therapy” (29.2%) and/or “Breathwork” (28.2%).
Interestingly, much fewer respondents indicated they would like additional proficiency in
the (more) medically oriented modalities of “Acupuncture” (11.4%), “Ayurveda” (9.4%),
“Herbs” (13.4%), “Homeopathy” (10.8%) or “Naturopathy” (10.4%).
111
Research Question Five
This research question explored respondents’ personal experiences with
complementary therapy via survey question 6 to 9. These responses continue to provide a
baseline of data that has been relatively unaccounted for in previous research.
Responses to research question 6 showed that “Exercise” (79.8%), “Diet”
(62.6%), “Massage” (62.3%), “Guided Imagery” (61.3%), “Prayer” (58.4%) and/or
“Meditation” (56.3%) were the most frequent personally experienced complementary
therapies. In addition, 94.5% of respondents have personally experienced at least one
complementary therapy.
One related research study was found, which reported on personal use of
alternative medicine by health science center faculty (Burg, et al., 1998). In this study,
massage (32%), relaxation techniques (24%), dietary supplements (23%) and chiropractic
(16%) were most frequently reported as having been personally used. In comparison,
respondents to the present study were more likely to have personal experience with
complementary therapy. Perhaps counselors are less likely to subscribe to the medical
profession’s emphasis on “the scientific” as the ultimate determinant of a therapy’s
legitimacy or usefulness (Baumrucker, 2002; Caspi, et al., 2000; Grollman, 2001;
Marcus, 2001)
Respondents most recently personally experienced the complementary therapies
of “Prayer” (19.6%), “Exercise” (16.7%) or “Massage” (12.5%), according to survey
question 7. Responses to question 8 indicated that respondents’ reason for their most
recent personal experience with complementary therapy was overwhelmingly “To
improve overall wellness” (70.9%). Finally, most respondents (87.4%) to survey question
9 reported receiving “Some” to “Large benefits” from their most recent use of
complementary therapy.
In summary, it seems that the majority of respondents are employing relatively
easily accessed complementary therapies in their own lives and reporting successful
outcomes. In addition, respondents are using complementary therapy to improve their
overall wellness, versus a focus on a specific mental or physical health concern. They are
also employing modalities that may be considered part of a basic self care strategy and to
a large degree do not require professional intervention/practitioners (excepting massage).
112
Respondents find they receive at least some, and often large, benefits from their personal
experience with complementary therapy.
Research Question Six
This research question examined whether there were any associations across
demographic variables and research questions 1 to 5. Crosstabulations were conducted
for all possible combinations of demographic (dependent/row) variables and research
questions 1 through 5 (independent/column) variables.
The significant dependent variables are divided into, client usage,
recommendation and referral, inclusion, and knowledge factors, aligned along research
questions 1 to 4. Note that there were no significant associations for dependent variables
that addressed research question five (personal experience factors).
Client usage factors include “Counselor asked client about use of complementary
therapy”. Recommendation and referral pattern factors comprise “Provided client with a
specific referral for complementary therapy”, “Client voluntarily brought up use of
complementary therapy”, “Client requested a recommendation or referral for
complementary therapy”, “Client concerns for which recommended or referred for
complementary therapy” and “Recommended complementary therapy without providing
a referral”. Inclusion factors are “Included complementary therapy in counseling” and
“Client requested inclusion of complementary therapy”. Knowledge factors include
“Complementary therapy modalities qualified to discuss”.
Significant associations are grouped according to a “pattern of difference”
between the actual and expected counts. There was a distinct positive or negative
difference between the actual and expected counts depending on the degree of
respondents’ (greater or lesser) involvement/interaction with complementary therapy.
Positive associations emerged for the independent variables, “Work setting-
Private practice/Self-employed”, “Position-Outpatient counselor”, “Services provided-
Individual counseling”, “Services provided-Family/couples counseling”, “Services
provided-Alcohol/Substance abuse counseling” “Mental health license-LPC” and
“Theoretical Orientation-Psychodynamic”. Negative associations emerged for the
independent variables “Work setting-K-12 setting”, “Mental health license-None”, and
“Position-Graduate student (Master’s)”.
113
For example, examination of the positive association for the crosstabulation
“Work setting-Private practice/Self-employed” x “Client voluntarily brought up their use
of complementary therapy” (see Table 10) shows that the actual count of “None” is half
of the expected count (19 vs. 37.8). Moving “up” this scale, the actual counts increase in
(positive) proportion to the expected counts, until the actual counts are nearly double the
expected counts (28 vs. 14.4) for the scale response of “More than two-thirds”.
On the other hand, examination of the negative association for the crosstabulation
“Work setting-K-12 setting” x “Client voluntarily brought up their use of complementary
therapy” (see Table 10) shows that the actual count of “None” is almost 1.9 times the
expected count (34 vs. 18.0). Continuing “up” this scale, the actual counts decrease in
(negative) relation to the expected counts until the actual counts are only 30% of the
expected counts (2 vs. 6.9) for the “More than two-thirds” scale.
Further evidence for this pattern comes from the results found in Table 14. This
table indicates that the “Private practice/self-employed” respondent provided a
recommendation or referral for complementary therapy for “None” of their clients’
concerns in less than 25% of expected cases (14 vs. 54.9). Meanwhile, respondents in K-
12 settings provided a recommendation or referral for complementary therapy for “None”
of their clients’ concerns at more than 2.3 times the expected counts (36 vs. 15.6).
Crosstabulations possessing the largest Cramer’s V values are examined next. It
was pointed out in chapter four that the row/independent variable of “Work setting-
Private practice/Self-employed” independent variable stood out for having five out of the
six largest Cramer’s V values (see Table 18). This variable was moderately associated
with client usage, recommendation and referral patterns, inclusion, and knowledge
factors. Furthermore, comparison of the expected and actual counts for the variable of
“Work setting-Private practice/Self-employed”, confirms a consistently positive pattern
across all significant associations. This was also the only independent variable
significantly associated with knowledge factors. (See Tables 9, 10, 11, 13, 15, 16 and 17.)
One reason for these consistently greater associations may be that counselors who
work in private practice, or are otherwise self-employed, simply have more autonomy to
integrate complementary therapy in their practice. In addition, practitioners in private
practice almost assuredly have greater professional experience,along with which comes
114
more flexibility and openness to alternative approaches (Glauser & Bozarth, 2001; Miars,
2002).
This positive pattern repeats itself for the variable “Position-Outpatient
counselor”, although with less differential between the actual and expected counts than
for the “Work setting-Private practice/Self-employed” variable. For example, the
crosstabulation “Position-Outpatient counselor” x “Client voluntarily brought up their use
of complementary therapy” (see Table 10) shows that the actual count of “None” is 64%
of the expected count (33 vs. 51.2). Continuing “up” this scale, the actual counts increase
in relation to the expected counts until the actual counts are almost 1.5 times the expected
counts (28 vs. 19.4) for the scale response of “More than two-thirds”. Lastly, this variable
was moderately associated with client usage, recommendation and referral patterns, and
inclusion factors.
This positive association may be explained by the fact that the majority of
respondents may be considered to be effectively working in an outpatient position, since
less than 5% reported working in an inpatient position. This leads to the conclusion that
the “Position-Outpatient counselor” variable may be redundant and is included within
other associations.
For the “Services provided-Individual counseling” variable, the positive pattern of
association remained constant, although the differential between actual and expected
counts again decreased. This variable was also moderately associated with client usage,
recommendation and referral, and inclusion factors.
For example, the crosstabulation “Services provided-Individual counseling” x
“Client voluntarily brought up their use of complementary therapy” (see Table 10) shows
that the actual count of “None” is 81% of the expected count (79 vs. 96.9). At the other
end of the scale, the actual count is 1.1 times the expected count (41 vs. 36.6) for the
scale response of “More than two-thirds”. The lower differential between the actual and
expected counts is reflected in the fact that only two of the six Cramer’s V values for
“Services provided-Individual counseling” are located in the top 50th percentile of results.
In considering associations related to this variable, note that most respondents
(70.2%) reported providing individual counseling services. Therefore, as with the
outpatient position above, the provision of individual therapy may be less of a distinct
115
marker of associations and more properly considered within the context of other
associations. In fact, the term, “individual counseling” reflects a redundancy, in that most
counseling services (e.g., child/adolescent, family/couples, alcohol/substance abuse) may
be individual at times - especially, since the primary “focus” of counseling must usually
be assigned to only one person.
The “Services provided-Family/couples counseling” variable maintains the
positive pattern of greater involvement in complementary therapy than expected. Once
again, this variable was moderately associated with client usage, recommendation and
referral, and inclusion factors. Continuing with the same dependent variable (see Table
10), the association between “Services provided-Family/couples counseling” x “Client
voluntarily brought up their use of complementary therapy” shows that the actual count
of “None” is 64% of the expected count (38 vs. 58.7). Continuing “up” this scale, the
actual counts increase in relation to the expected counts until the actual counts are 1.3
times the “More than two-thirds” expected counts (29 vs. 22.2). This association may be
partially explained by the family therapy tradition of eclectic and “complementary”
approaches (Napier, 1978; Nichols & Schwartz, 1998).
The variable “Services provided-Alcohol/Substance abuse counseling” was
moderately associated with client usage, recommendation and referral, and inclusion
factors, in the now familiar positive valence. For example, an examination of the
crosstabulation “Services provided-Alcohol/Substance abuse counseling” x “Counselor
asked client about use of complementary therapy” (see Table 9) shows that the actual
count of “None” is only 59% of the expected count (25 vs. 42.3). Continuing “up” this
scale, the actual counts increase in relation to the expected counts until the actual counts
are over 1.3 times the expected counts (49 vs. 37.4) for the “More than two-thirds” scale.
The well-known low rates of success and significant recidivism associated with alcohol
and substance abuse counseling may encourage greater openness to complementary
therapy approaches (Meng, Luo & Halbreich, 2002).
The “Mental health license-LPC” variable persists with the initially established
positive pattern of increasing involvement with complementary therapy. However, the
differential continues to remain lower than for the conspicuous “Work setting-Private
practice/Self-employed” variable. An examination of the crosstabulation “Mental health
116
license-LPC” and “Provided client with a specific referral for complementary therapy”
(see Table 13) shows that the actual count of “None” is only 70% of the expected count
(78 vs. 111.0). Continuing “up” this scale, the actual counts increase in relation to the
expected counts until the actual counts are over 1.6 times the expected counts (10 vs. 6.2)
for the “More than two-thirds” scale.
This variable was moderately associated with both recommendation and referral
and inclusion factors. Along the same lines as the “Work setting-Private practice/Self-
employed” variable, these positive associations may be shaped by the greater professional
experience of LPC’s. Once again, increased autonomy may contribute to greater
openness to inclusion and referrals for complementary therapy (Bien, 2004).
Finally, the “Theoretical Orientation-Psychodynamic” variable continues the
positive pattern of greater than expected involvement in complementary therapy. This
variable was moderately associated with client usage and inclusion factors. The
association between “Theoretical Orientation-Psychodynamic” x “Client requested
inclusion of complementary therapy” (see Table 16) shows that the actual count of
“None” is just over 50% of the expected count (23 vs. 44.3). The actual counts then
increase in relation to the expected counts until the actual counts are almost 1.2 times the
“More than two-thirds” expected counts (7 vs. 5.9). This positive association may be
related to the historical involvement of psychodynamic oriented pracitioners with
complementary therapies, especially body-centered approaches (Bridges, 2002; Miller,
2000).
For the “Work setting-K-12 setting” variable, the previously established pattern is
repeated, but this time in a negative manner. In a diminishing sense, this variable was
moderately associated with client usage, recommendation and referral, and inclusion
factors. For example, the association between “Work setting-K-12 setting” and “Provided
client with a specific referral for complementary therapy” (see Table 13) shows that the
actual count of “None” is almost 1.5 times the expected count (60 vs. 40.6). Continuing
“up” this scale, the actual counts decrease in relation to the expected counts until the
actual counts are only 43% of the expected counts (1 vs. 2.3) for the “More than two-
thirds” scale. This negative association may be explained in part by increasingly
restrictive working conditions found in modern K-12 counseling settings (Beale, 2003).
117
It was also interesting to note the moderate associations between K-12 based
respondents and referrals for Alcohol/Substance abuse (8 vs. 16.8) and Medical concerns
(8 vs. 15.0) were at around one-half the expected rate (see Table 14). On the other hand,
K-12 respondents were more than twice as likely as expected (29 vs. 13.4) to have
recommended or referred for the client concern of ADHD. This result is in keeping with
the K-12 environment and its ever-present concerns about student inattentiveness
(Brown, 2000; Schwiebert, Sealander, & Dennison, 2002).
For the “Mental health license-None” variable, the negative pattern of less than
expected involvement in complementary therapy continues. For example, the association
between “Mental health license-None” and “Provided client with a specific referral for
complementary therapy” (see Table 13) shows that the actual count of “None” is more
than 1.3 times the expected count (154 vs. 114.9). Continuing “up” this scale, the actual
counts again decrease in relation to the expected counts until the actual counts are less
than 50% of the expected counts (3 vs. 6.4) for the “More than two-thirds” scale. Finally,
this variable was moderately associated with client usage, recommendation and referral,
and inclusion factors. It seems reasonable that respondents who do not hold any state
mental health license would have less practical experience, and therefore, be less likely to
embrace a complementary therapy paradigm.
Finally, for the “Position-Graduate student (Master’s)” variable, this negative
pattern is maintained. For example, the association between “Position-Graduate student
(Master’s)” and “Provided client with a specific referral for complementary therapy” (see
Table 13) shows that the actual count of “None” is greater than 1.5 times the expected
count (74 vs. 49.2). Continuing “up” this scale, the actual counts diminish in relation to
the expected counts until the actual counts are only 70% of the expected counts (7 vs.
10.0) for the “One-third to two-thirds” scale and actually 0% of the expected counts (0
vs. 2.7) for the “More than two-thirds” scale. This variable was moderately associated
with just recommendation and referral factors. Again, it seems logical that respondents
enrolled as a Master’s degree student have less practical experience, which corresponds
with lessened involvement with complementary therapy.
Summary of Findings
118
There were moderately positive associations between counselors who worked in a
private practice/self-employed setting, as an outpatient counselor, were licensed as an
LPC, provided individual, family/couples, or alcohol/substance abuse counseling and
possessed a psychodynamic perspective. These variables were positively associated with
client usage, recommendation and referral, inclusion, and knowledge factors. There were
moderately negative associations between counselors who worked in a K-12 setting, did
not possess a mental health license, and were a Master’s student with client usage,
recommendation and referral, and inclusion factors.
Work Setting Matters
It seems reasonable to conclude that among respondents to this study, work
setting had the greatest single influence on the existence of significant associations.
Specifically, reporting a private practice/self-employed work setting was related to
positive associations, while working in a K-12 setting was linked to negative
associations.
Mental Health Licensure is Critical
Having, or not having, a mental health license was connected with a divergence in
significant associations. Specifically, possessing LPC licensure (or equivalent) led to
positive associations, while not possessing a mental health license led to negative
associations.
Position, Services Provided and Theoretical Orientation Play Key Roles
Respondents reporting being in the position of an outpatient counselor, provided
individual, family/couples, or alcohol/substance abuse counseling, and had a
psychodynamic orientation contributed to positive associations. On the other hand,
respondents who reported being in the position of a Master’s gradute student contributed
to negative associations.
Alternative Analysis of Associations
These variables and their corresponding associations may also be categorized
according to the degree professional experience and openness to a diversity of therapeutic
approaches. Greater or lesser professional experience and openness to a diversity of
therapeutic approaches equated with positive or negative associations.
119
In particular, working in a private practice setting and having LPC licensure (or
equivalent) was related to greater professional experience. These two variables were
positively associated with client usage, recommendation and referral, inclusion, and
knowledge factors. In fact, a private practice work setting was the only variable that was
aligned in a significant manner with knowledge factors.
Less clear are positive associations between working as an outpatient counselor
andr providing individual counseling services. However, it was proposed earlier that
these associations may be redundant and, essentially, incorporated within other
associations.
In contrast, being a Master’s student and not possessing mental health licensure
accorded with less professional experience. Consequently, these variables were
negatively associated with client usage, recommendation and referral, and inclusion
factors.
It is also clear from the results that respondents’ degree of openness to a variety of
therapeutic approaches results in greater or lesser associations. Specifically, increased
openness to diverse therapeutic approaches was connected with positive associations,
whereas decreased openness was related to negative associations
In the case of alcohol and substance abuse counseling, this openness may
originate from the necessity of trying to come up with effective interventions for this
notoriously difficult clinical population. In addition, the psychodynamic and
family/couples traditions are also distinguished by their openness to diverse therapeutic
approaches.
Conversely, K-12 work settings are notable for their restrictive work
environments and have negative associations with various complementary therapy
factors. Note that this lack of openness to nontraditional therapeutic approaches is not
necessarily related to professional experience. Finally, a private practice work setting and
having LPC licensure (or equivalent) may also be indicative of greater openness to a
diversity of counseling approaches.
Implications for Clinical Practice
The present study has significant implications for clinical practice. The use of
complementary therapy seems to be reflective of a paradigm shift for the counseling
120
profession. Along with this shift comes an imperative for counselors to commit to a,
“proactive stance in relation to wellness issues” (Meyers, 1992, p. 136).
In this study, respondents who possessed greater professional experience and
openness to innovative ways to intervene in clients’ problems seem to be embracing this
transformation in mental health care. These types of counselors have a unique
opportunity, and responsibility, to further the commitment of the profession to holistic
change across the lifespan (McAuliffe & Eriksen, 1999).
These paradigm-shifting counselors should be advocates for complementary
therapy within the profession and help to inform inexperienced counselors. This may be
accomplished in part through the provision of educational opportunities for novice (in
terms of complementary therapy experience) counselors. However, it is especially critical
for these counselors to share their experience with the counselor education community.
It remains unclear how counselors lacking professional experience or impetus to
engage with complementary therapy interventions will align with this critical issue.
While this responsibility ultimately belongs to future counselors, their charge is in the
hands of today’s counselor educators.
Implications for Counselor Education
Therefore, it behooves counselor educators to give serious consideration to how
this issue should be addressed among the next generation of counselors. Indeed, given the
unique contributions of the counseling profession toward a “philosophy” of wellness
(Meyers, 1992), counselor educators should be actively guiding new counselors in the
direction of learning to “practice” from a holistic perspective.
If, as the present study indicates, those inexperienced with complementary
therapy are generally unlicensed counselors and graduate students, then counselor
educators are clearly in a unique position to provide leadership toward realizing this end.
Clearly, these educators must begin this process by bringing themselves up to speed in
understanding and setting educational standards and professional examples in alignment
with fundamental professional principles.
Given the difficulties and complexities of simply meeting current educational
standards in counselor education (i.e., CACREP), this is certainly no small task. One
121
possible solution is to increase the collaboration between counseling professionals with
experience in complementary therapy and the counselor education community.
However, it is important for counselor educators to recognize that the process of
paradigm change takes time, sometimes measured in terms of generations (Kuhn, 1970).
Along the way, old paradigms are not necessarily invalidated, but rather superseded
under newer, more inclusive, approaches (Shannon, 2002). Furthermore, a paradigm shift
can generate extremes of emotion, especially when these changes appear to threaten
secure and comfortable ways of (professional) being. This can be a positive sign if, as
Shannon, puts it, “paradigm crisis, … precedes a paradigm shift” (p. 10).
The medical education community has been embroiled in just such a controversy
over the past decade, debating the role of complementary therapy within their particular
profession (Baumrucker, 2002; Caspi, et al., 2000; Marcus, 2001; Grollman, 2001;
Wetzel, et al., 2003). Counselor education would do well to learn from this example and
courageously begin the process of examining the “imperative that these topics be
included in medical [counselor] education from the preclinical years through residency
and beyond” (Wetzel, et al., p. 191).
Limitations
The results of this study should be considered in light of the following limitations:
1. It was assumed, though not necessarily the case, that respondents reported accurate
information, represented themselves honestly and only completed the survey once.
2. Respondents were all required to be members of the American Counseling
Association (ACA). As a result, the results cannot necessarily be extended to
counselors who are not ACA members.
3. The majority of respondent demographics were found to be incongruent with those
reported by the ACA. Therefore, the results are limited in their representativeness of
ACA membership. As reported earlier, respondents were significantly more likely to
report a student status, which resulted in a cascade affect across other variables (i.e.,
lower income and earned degree, and a greater variety of work settings).
4. While the final survey response rate of almost 22% is more than acceptable from an
online survey perspective, it is still low in comparison with traditional mail based
approaches to data collection (Dillman, 2000).
122
5. The survey was only open for data collection for a short time during the month of
November. Because of this brief window of opportunity, a number of respondents
may not have had a chance to participate in the survey.
6. Counselors with a previous interest in complementary therapy may have been more
likely to complete the survey. They may also have had greater training, knowledge
and professional and personal experience with complementary therapy than non-
respondents.
7. Respondents more comfortable with electronic communication may have possibly
outnumbered non-respondents. This issue may also have negatively contributed to the
generalizability of the results.
8. The list of complementary therapies employed in the survey cannot be considered
complete. In addition, knowledge and training categories, motivations for inclusion,
client concerns, and reasons for not having recommended or referred complementary
therapy may not be comprehensive.
Recommendations for Research, Practice and Education
Recommendations emerging from the present study are grouped according to the
categories of research methodology and recommendations specific to practice and
education.
Research Methodology
1. The survey should be expanded to include counselors that are not members of the
ACA.
2. Statistical import would be improved by employing Likert/ordinal or interval scales
in place of the numerous nominal scales.
3. The use of a multimodal approach to data collection (i.e., Internet and postal mail)
may increase the response rate.
4. Future analysis should be conducted to account for the large number of respondents
who reported a student status. This may enhance the representativeness of the sample.
Practice and Education
5. Counselors should ask clients about their use of complementary therapy as a matter of
course. It is safest to assume that all clients potentially avail themselves of
complementary therapy.
123
6. Counselors need to be aware of the efficacy of particular complementary therapies
and the complementary therapies most likely to be used by clients for specific mental
health concerns.
7. It is essential that all counselors begin the process of familiarizing themselves with
complementary therapy resources and establishing a network of qualified
practitioners for referrals.
8. Continuing education should be offered, which provides counselors with a working
knowledge of complementary therapies and guidelines for recommendation and
referral.
9. Counselor educators should encourage active dialog concerning complementary
therapy throughout the counseling curriculum.
10. Counselors in private practice should reach out to inexperienced counselors and the
counselor education community.
11. Counselors in K-12 settings and those without licensure need support and
encouragement to become more engaged with complementary therapy.
Conclusion
The data from this study is, for the most part, encouraging in its implication that
counselors are beginning to shift toward a paradigm, which “focuses on the unique
phenomenological world of the client while engaging the client as an equal partner in the
therapeutic process” (Gerber & Basham, 1999, p. 418). This collaborative attitude takes
full advantage of clients’ abilities and preferences in designing intervention strategies.
There is little reason to think that clients will necessarily limit themselves to
“conventional” approaches – unless counselors are unconsciously encouraging these
limitations in their clients. Recall that Knaudt, et al. (1999) found that clients were able to
cite very specific advantages for their use of complementary therapy. Their research
established that clients’ believe that salutogenic (i.e., health enhancing) effects are a
cornerstone of the complementary therapy milieu.
However, discussion of client-counselor communication specific to
complementary therapy suggests that the profession still has a good deal of work to do
before it can be considered truly holistic. In addition, lack of knowledge and training in
124
complementary therapy further contributes to the gap between counselors and
complementary therapy.
These factors combine to create a “paradigm lag”, where the basic tenants of
counseling, including wellness, prevention, and client-centeredness become lost. The
irony is that as modern market pressures increase the demand to be accountable for
therapeutic outcomes, the counselor is left in a double bind with regards to effective
interventions. Paradoxically, this reality presents an opportunity for the counseling
profession to decide whether to expend the energy to commit to a truly comprehensive
approach to therapy – one that would by definition include complementary therapy.
The most efficacious psychotherapy would ideally incorporate all of one’s being
and social system (Schaef, 1994). The therapist of the future will more and more find
ways to incorporate complementary therapy into counseling. Therefore, exposure to
complementary therapy is recommended in the training of all counselors.
Counseling is at a crossroads where it can no longer afford to ignore the holistic
interplay of our world, cultures, individual minds, emotions and the phenomenon of
being. According to Myers (1992), counseling has realized a paradigm shift with regard
to its philosophy. However, the counseling profession has yet to commit this philosophy
fully into practice.
There exists a great urgency for healing within our world. Science continues to
provide many answers for why we hurt and what might help to heal our individual and
collective pains. Yet, to conclude with the words of Sam Keen (1995, p. 335), counseling
is, in the end, about the “questions”.
One day, as we move through the process of preparing ourselves, we will discover that, without realizing it, we have already come a long distance in our journey together. The preparations will have fused with the journey. Then we will find, to our surprise, that theory and practice have embraced each other, that our contemplation of the self has become inseparable from our compassionate action for others, that our patient waiting in the fertile darkness has become our manner of trusting in the Unknown God, that our questions have become our joy.
Summary
Chapter 5 summarized the results of the study. Special emphasis was given to the
providing a context of the results within the extant literature. In addition, where no such
or limited literature was found, theoretical constructs were engaged. A summary of the

125
key findings of the study were then deliberated. The implications of the study for clinical
practice and counselor education were then presented. Finally, limitations and
recommendations were offered.
126
REFERENCES
Adams, K.E., Cohen, M.H., Eisenberg, D., & Jonsen, A.R. (2002). Ethical considerations
of complementary and alternative medical therapies in conventional medical
settings. Annals of Internal Medicine, 137(8), 660-664.
American Academy of Pediatrics: Committee on Children with Disabilities. (2001).
Counseling families who choose complementary and alternative medicine for
their child with chronic illness or disability. Pediatrics, 107(3), 598-601.
American Counseling Association. (2004, May). Membership Report for ACA.
Alexandria, VA: Author.
Astin, J.A. (1998). Why patients use alternative medicine: Results of a national study.
Journal of the American Medical Association, 279(19), 1548-1553.
Astin, J.A., Marie, A., Pelletier, K.R., Hansen, E., & Haskel, W.L., (1998). A
review of the incorporation of complementary and alternative medicine by
mainstream physicians. Archives of Internal Medicine, 158, 2303-2310.
Bachmann, D., Elfrink, J., & Vazzana, G. (1996). Tracking the progress of e-mail vs.
snail-mail. Marketing Research, 8, 31-35.
Balneaves, L.G., Kristjanson, L.J., & Tataryn, D. (1999). Beyond convention: Describing
complementary therapy use by women living with breast cancer. Patient
Education and Counseling, 38, 143-153.
Bankart, C.P. (1997). Talking cures: A history of Western and Eastern psychotherapies.
Pacific Grove, CA: Brookes/Cole.
Barnes, J., Abbot, N.C., Harkness, E.F. & Ernst, E. (1999). Articles on complementary
medicine in the mainstream medical literature. Archives of Internal Medicine,
159, 1721-1725.
Bassman, L.E., & Uellendahl, G. (2003). Complementary/alternative medicine: Ethical,
professional, and practical challenges for psychologists. Professional Psychology:
Research and Practice, 34(3), 264-270.
Baumrucker, S.J. (2002). Complementary medicine and the scientific method:
Mainstreaming proven alternative therapies. American Journal of Hospice &
Palliative Care, 19(6), 369-371.
Bausel, R.B., Lee, W.L., & Berman, B.M. (2001). Demographic and health-related
127
correlates of visits to complementary and alternative medical providers. Medical
Care, 39(2), 190-196.
Beale, A.V. (2003), The indispensable school counselor. Principal Leadership (High
School Ed.), 4(1), 68-71.
Beaubrun G. & Gray, G.E. (2000). A review of herbal medicines for psychiatric
disorders. Psychiatric Services, 51(9), 1130-1134.
Benson, H. (1996). Timeless healing. New York: Fireside.
Berman, B.M., Bausell, R.B., Hartnoll, S.M. Beckner, M., & Bareta, J. (1999).
Compliance with requests for complementary-alternative medicine referrals: A
survey of primary care physicians. Integrative Medicine, 2(1), 11-17.
Berman, B.M., Singh, B.K., Lao, L., Singh, B.B., Ferentx, K.S., & Hartnoll, S.M.
(1995). Physicians’ attitudes toward complementary or alternative medicine: A
regional survey. The Journal of the American Board of Family Practice, 8(5),
361-366.
Berman, M. (1990). Coming to our senses: Body and spirit in the hidden history of the
West. New York: Bantam.
Bhattacharya, B. (2000). M.D. programs in the United States with complementary and
alternative medicine education opportunities: An ongoing list. The Journal of
Alternative and Complementary Medicine, 6(1), 77-90.
Bien, T.H. (2004). Quantum change and psychotherapy. JCLP/In Session, 60(5), 493-
501.
Bier, M.C., Sherblom, S.A., & Gallo, M.A. (1996). Ethical issues in a study of Internet
use: Uncertainty, responsibility, and the spirit of research relationships. Ethics &
Behavior, 6(2), 141-151.
Bodeker, G., & Kronenberg, F. (2002). A public health agenda for traditional,
complementary, and alternative medicine. American Journal of Public Health,
92(10), 1582-1591.
Bonett, D.G. (2002). Sample size requirements for testing and estimating coefficient
alpha. Journal of Educational and Behavioral Statistics, 27(4), 335-240.
Borkan, J., Neher, J.O., Anson, O., & Smoker, B. (1994). Referrals for alternative
therapies. The Journal of Family Practice, 39(6), 550.
128
Borysenko, J. (1988). Minding the body, mending the mind. New York: Bantam.
Bridges, M. (2002). Emotional expression and experience in body-focused
psychodynamic psychotherapy: A single case design utilizing empirically
validated methods. The Third National Conference of the United States
Association for Body Psychotherapy, 423-445
Brolinson, P.G., Price, J.H., Ditmyer, M., & Reis, D. (2001). Nurses’ perceptions of
complementary and alternative medical therapies. Journal of Community Health,
26(3), 175-189.
Brown, C.M., & Segal, R. (1996). The effects of health and treatment perceptions on the
use of prescribed medication and home remedies among African American and
White American hypertensives. Social Science Medicine, 43(60), 903-917.
Brown, M.B. (2000). Diagnosis and treatment of children and adolescents with Attention-
Deficit/Hyperactivity Disorder. Journal of Counseling and Development, 78(2),
195-203.
Brown, W.S. (2002). Nonreductive physicalism and soul: Finding resonance between
theology and neuroscience. American Behavioral Scientist, 45(12), 1812-
1821.
Burg, M.A., Kosch, S.G., Neims, A.H., & Stoller, E.P. (1998). Personal use of alternative
medicine therapies by health science center faculty. Journal of the American
Medical Association, 280(18), 1563.
Caspi, O., Bell, I.R., Rychener, D., Gaudet, T.W., & Weil, A.T. (2000). The tower of
Babel: Communication and medicine. Archives of Internal Medicine, 160, 3193-
3195.
Chez, R.A., & Jonas, W.B. (1997). The challenge of complementary and alternative
medicine. American Journal of Obstetrics and Gynecology, 177, 1156-1161.
Cohen, J. (1994). The earth is round (p < .05). American Psychologist, 49(12), 997-1003.
Cohen, M.H., & Eisenberg, D.M. (2002). Potential physician malpractice liability
associated with complementary and integrative medical therapies. Annals of
Internal Medicine, 136(8), 596-603.
Cook, C., Heath, F., & Thompson, R.L. (2000). A meta-analysis of response rates in web-
or Internet-based surveys. Educational and Psychological Measurement, 60(6),
129
821-836.
Coomber, R. (1997). Using the internet for survey research. Sociological Research
Online, 2(2). Retrieved December 11, 2003, from
0H0Hhttp://www.socresonline.org.uk/2/2/2.html.
Cuijpers, P. (1997). Bibliotherapy in unipolar depression: A meta-analysis. Journal of
Behavior Therapy and Experimental Psychiatry, 28(2), 139-147.
Cumming, G., & Finch, S. (2001). A primer on the understanding, use, and calculation of
confidence intervals that are based on central and noncentral distributions.
Educational and Psychological Measurement, 61(4), 532-574.
Davidson, J.R.T., Rampes, H., Eisen, M., Fisher, P., Smith, R.D., & Malik, M. (1998).
Psychiatric disorders in primary care patients receiving complementary medical
treatments. Comprehensive Psychiatry, 39(1), 16-20.
Delucchi, K.L. (2004). Sample size estimation in research with dependent measures and
dichotomous outcomes. American Journal of Public Health, 94(3), 372-377.
Demasio, A.R. (1994). Descartes’ error: Emotion, reason, and the human brain. New
York: G.P. Putnam’s Sons.
Diamond, W.J. (2001). The clinical practice of complementary, alternative, and western
medicine. Boca Raton, FL: CRC Press.
Dillman, D.A. (1991). The design and administration of mail surveys. Annual Review of
Sociology, 17, 225-249.
Dillman, D.A. (2000). Mail and internet surveys: The tailored design method. New York:
John Wiley & Sons.
Dillman, D.A., Christenson, J.A., Carpenter, E.H., & Brooks, R.M. (1977). Increasing
mail questionnaire response: A four state comparison. American Sociological
Review, 39, 744-756.
Druss, B.G., & Rosenheck, R.A. (2000). Use of practitioner-based complementary
therapies by persons reporting mental conditions in the United States. Archives of
General Psychiatry, 57, 708-714.
Druss, B.G., Rohrbaugh, R., Kosten, T., Hoff, R., & Rosenheck, R.A. (1998). Use of
alternative medicine in major depression. Psychiatric Services, 49(11), 1397.
Duffy, M.E. (2002). Methodological issues on web-based research. Journal of Nursing
130
Scholarship, 34(1), 83-88.
Earle, W.J. (1992). Introduction to philosophy. New York: McGraw-Hill.
Eisenberg, D.M. (1997) Advising patients who seek alternative medical therapies. Annals
of Internal Medicine, 127(1), 61-78.
Eisenberg, D.M., Davis, R.B., Ettner, S.L., Appel, S., Wilkey, S. Rompey, M.V., &
Kessler, R.C. (1998). Unconventional medicine in the United States: Prevalence,
costs, and patterns of use. The New England Journal of Medicine, 328(4), 246-
252.
Eisenberg, D.M., Kessler, R.C., Foster, C., Norlock, F.E., Calkins, D.R., & Delbanco,
T.L. (1993). Trends in alternative medicine use in the United States,
1990-1997. Journal of the American Medical Association, 280(18), 1569-1575.
Eisenberg, D.M., Kessler, R.C., Van Rompay, M.I., Kaptchuck, T.J., Wilkwy, S.A.,
Appel, S., & Davis, R.B. (2001). Perceptions about complementary therapies
relative to conventional therapies among adults who use both: Results from a
national survey. Annals of Internal Medicine, 135(5), 344-351.
Ernst, E., Rand, J.I., & Stevinson, C. (1998). Complementary therapies for depression:
An overview. Archives of General Psychiatry, 55, 1026-1032.
Eskinazi, D.P. (1998). Factors that shape alternative medicine. Journal of the American
Medical Association, 280(18), 1621-1623.
Fear, R., & Woolfe, R. (1996). Searching for integration in counselling practice. British
Journal of Guidance and Counselling, 24(3), 399-411.
Findling, R.L., Feeny, N.C., Stansbrey, R.J., DelPorto-Bedoya, D., & Demeter, C.
(2002). Somatic treatment for depressive illnesses in children and adolescents.
Child and Adolescent Psychiatric Clinics of North America, 11, 555-578.
Fontanarosa, P.B., & Lundberg, G.D. (1998a). Alternative medicine meets science.
Journal of the American Medical Association, 280(18), 1618-1619.
Fontanarosa, P.B., & Lundberg, G.D. (Eds.). (1998b). Alternative medicine theme issue.
Journal of the American Medical Association, 280(18), 1551-1640. pp. 1551-
Ford, C.W. (1989). Where healing waters meet: Touching mind and emotion through the
body. Barrytown, NY: Station Hill Press.
Fowler, F.J. (2002). Survey Research Methods. Thousand Oaks: CA: Sage Publications.
131
Frenkel, M.A., & Borkan, J.M. (2003). An approach for integrating complementary-
alternative medicine into primary care. Family Practice, 20(3), 324-332.
Furnham, A., & Forey, J. (1994). The attitudes, behaviors and beliefs of patients of
conventional vs. alternative medicine. Journal of Clinical Psychology, 50(3), 458-
469.
Gerber, S., & Basham, A. (1999). Responsive therapy and motivational interviewing:
Postmodernist paradigms. Journal of Counseling and Development, 77(4), 418-
422.
Gergen, K.J., & Thatchenkery, T.J. (1996). Organization science as social construction:
Postmodern potentials. The Journal of Applied Behavioral Science, 32(4), 356-
278
Glauser, A.S., & Bozarth, J.D. (2001). Person-centered counseling: The culture within.
Journal of Counseling and Development, 79(2), 142-147.
Gordon, R.J., Nienstedt, B.C., & Gesler, W.M. (1998). Alternative therapies: Expanding
options in health care. New York: Springer Publishing.
Graham, C., Franses, A., Kenwright, M., & Marks, I. (2001). Problem severity in people
using alternative therapies for anxiety difficulties. Psychiatric Bulletin, 25, 12-14
Granello, P. (2000). Integrating wellness work into mental health private practice.
Journal of Psychotherapy in Independent Practice, 1(1), 3-16.
Green, S.B., Salkino, N.J., & Akey, T.M. (2000). Understanding SPSS for Windows:
Analyzing and understanding data. Upper Saddle, River, NJ: Prentice-Hall.
Greene, R.T. (2003). Clinical counselors and the Internet: A national survey evaluating
the impact of the Internet on the counseling profession. Unpublished doctoral
dissertation, Virginia Polytechnic Institute and State University, Blacksburg.
Greub, B.L., & McNamara, J.R. (2000). Alternative therapies in psychological
treatment: When is consultation with a physician warranted? Professional
Psychology: Research and Practice. 31(1). 58-63
Grollman, A.P. (2001). Is there wheat among the chaff? Academic Medicine, 76(3), 221-
223.
Haller, C.A. (2001). Why we should always ask our patients about unconventional
treatments. Western Journal of Medicine, 174, 164.
132
Halpern, S.D., Karlawish, J.H.T., & Berlin, J.A. (2002). The continuing unethical
conduct of underpowered clinical trials. Journal of the American Medical
Association, 288(3), 358-362.
Harris, S.M., & Dersch, C.A. (1999). Conducting research on the Internet: Potential,
concerns, and reflections. Kappa Omicron Nu FORUM, 11(1). Retrieved
December 9, 2003, from 1H1Hhttp://www.kon.org/archives/forum/11-1/harris.html.
Hayes, K.F. (1999). Working it out: Using exercise in psychotherapy. Washington, DC:
American Psychological Association.
Health Canada. (2001). Perspectives on complementary and alternative health care: A
collection of papers prepared for Health Canada. Ottowa, Ontario: Author.
Heerwegh, D., & Loosveldt, G. (2002). Web surveys: The effect of controlling survey
access using PIN numbers. Social Science Computer Review, 20(1), 10-21.
Herman, S., Khatri, P., Doraiswamy, M., Moore, K., Craighead, E. Baldewicz, T.T., &
Krishnan, K.R. (2000). Exercise treatment for major depression: Maintenance of
therapeutic benefit at 10 months. Psychosomatic Medicine, 62, 633-638.
Hermon, D.A., & Hazler, R.J. (1999). Adherence to a wellness model and perceptions of
psychological well-being. Journal of Counseling and Development, 77(3), 339-
343.
Hoenig, J.M., & Heisey, D.M. (2001). The abuse of power: The pervasive fallacy of
power calculations for data analysis. The American Statistician, 55(1), 19-24.
Houston, J.D., & Fiore, D.C. (1998). Online medical surveys: Using the Internet as a
research tool. M.D. Computing, 15(2), 116-120.
Jonas, W. (2000). The social dynamics of medical pleuralism: Forward. In M. Kelner &
B. Wellman (Eds.), Complementary and alternative medicine:
Challenge and change. (pp. xi-xv). Amsterdam: Harwood Academic Publishers.
Kabat-Zinn, J. (1990). Full catastrophe living. New York: Delacorte Press.
Kakai, H., Maskarinec, G., Shumay, D.M., Tatsumura, Y., & Tasaki, K. (2003). Ethnic
differences in choice of health information by cancer patients using
complementary and alternative medicine: An exploratory study with
correspondence analysis. Social Science and Medicine, 56, 851-862.
Kaptchuk, T.J., & Eisenberg, D.M. (2001). Varieties of Healing, 2: A taxonomy of
133
unconventional healing practices. Annals of Internal Medicine, 135, 196-204.
Katz, J.E., Rice, R.E., & Aspden, P. (2001). The Internet, 1995-2000. American
Behavioral Scientist, 45(3), 405-419.
Kaye, B.R., & Johnson, T.J. (1999). Research methodology: Taming the cyber frontier.
Social Science Computer Review, 17(3), 323-337.
Keen, S. (1995). Hymns to an Unknown God: Awakening the spirit in everyday life. New
York: Bantam.
Kehow, C.M., & Pitkow, J.E. (1996). Surveying the territory: GVU’s five WWW user
surveys. WWW Journal, 1(3). Retrieved February 1, 2004, from
2H2Hhttp://www.w3journal.com/3/s3.kehoe.html.
Kelner, M., & Wellman, B. (1997). Health care and consumer choice: Medical and
alternative therapies. Social Science Medicine, 45(2), 203-212.
Kendall, P.C. (1999). Clinical significance. Journal of Consulting and Clinical
Psychology, 67(3), 283-284.
Kessler, R.C., Soukup, J., Davis, R.B., Foster, D.F., Wilkey, S.A., Van Rompay, M.I., &
Eisenberg, D.M. (2001). The use of complementary and alternative therapies to
treat anxiety and depression in the United States. American Journal of Psychiatry,
158(2), 289-294.
Kinnear, P.R., & Gray, C.D. (2004). SPSS 12 made simple. New York: Psychology Press.
Knaudt, P.R., Conner, K.M., Weisler, R.H., Churchill, L.E., & Davidson, J.R.T. (1999).
Alternative therapy use by psychiatric outpatients. Journal of Nervous and Mental
Disease, 187(11), 692-695.
Kuhn, T. (1970). The Structure of Scientific Revolutions. Chicago: University of Chicago
Press.
Lee, M.M., Lin, S.S., Wrensch, M.R., Adler, S.R., & Eisenberg, D. (2000). Alternative
therapies used by women with breast cancer in four ethnic populations. Journal of
the National Cancer Institute, 92(1), 42-47.
Lenth, R.V. (2001). Some practical guidelines for effective sample size
determination. The American Statistician, 55(3), 187-193.
Lenth, R.V. (2004). Java Applets for power and sample size. Retrieved May 15, 2004,
from 3H3Hhttp://www.cs.uiowa.edu/~rlenth/Power/.
134
Lundberg, D.J., & Cobitz, C.I. (1999). Use of technology in counseling assessment: A
survey of practices, views, and outlook. Journal of Technology in Counseling,
3(1). Retrieved December 20, 2004, from
4H4Hhttp://jtc.colstate.edu/vol1_1/assessment.htm.
Magnuson, S. (2000). Clarifying counseling paradigms with statements of fundamental
professional assumptions. Journal of Humanistic Counseling, 38(4), 252-256.
Mainous, A.G., Gill, J.M., Zoller, J.S., & Wollman, M.G. (2000). Fragmentation of
patient care between chiropractors and family physicians. Archives of Family
Medicine, 9, 446-450.
Makinson, L.S., & Myers, J.E. (2003). Wellness: An alternative paradigm for violence
prevention. Journal of Humanistic Counseling, Education and Development,
42(2), 165-177.
Marwick, C. (1998). Alterations are ahead at the OAM. Journal of the American
Medical Association, 280(18), 1553-1554.
Marcus, D.M. (2001). How should alternative medicine be taught to medical students and
physicians? Academic Medicine, 76(3), 224-229.
Mathai, C.M. (2002). Surveying school counselors via the Internet regarding
their experiences and training needs in crisis intervention. Unpublished doctoral
dissertation, Virginia Polytechnic Institute and State University, Blacksburg.
McAuliffe, G.J., & Eriksen, K.P. (1999). Toward a constructivist and developmental
identity for the counseling profession: The context-phase-stage-style model.
Journal of Counseling and Development, 77(3), 267-280.
McGlothin, J.M. (2003). The infusion of Internet-based surveys and postal mail surveys:
Guidelines for counselors. Journal of Technology in Counseling, 3(1). Retrieved
December 20, 2004, from
5H5Hhttp://jtc.colstate.edu/vol3_1/McGothlin/McGothlin.htm.
McKendree-Smith, N.L., Floyd, M., & Scogin, F.R. (2003). Self-administered treatments
for depression: A review. Journal of Clinical Psychology, 59(3), 275-288.
Mendoza, J.L., & Stafford, K.L. (2001). Confidence intervals, power calculation, and
sample size estimation for the squared multiple correlation coefficient under the
fixed and random regression models: A computer program and useful tables.
135
Educational and Psychological Measurement, 61(4), 650-667.
Meng, F.G., Luo, H.C., & Halbreich, U. (2002). Concepts, techniques and clinical
applications of acupuncture. Psychiatric Annals, 32(1), 45-49.
Merton, T. (1965). The way of Chang- Tzu. Boston: Shambala.
Miars, R.D. (2002). Existential authenticity: A foundational value for counseling.
Counseling and Values, 46(3), 218-225.
Miller, J.A. (2000). The fear of the body in psychotherapy. Psychodynamic Counseling,
6(4), 437-450.
Miller, M. (1996). Diet and psychological health. Alternative Therapies, 2(5), 40-48.
Muehsam, P., Eskinazi, D., Park, C., & Daly, D. (1997). What is complementary
and alternative medicine? Retrieved November 29, 2003, from
6H6Hhttp://www.rosenthal.hs.columbia.edu/cancer/info/whatis.html.
Murphy, M. (1992). The future of the body: Explorations into the further evolution of
human nature. Los Angeles: Jeremy P. Tarcher.
Myers, J.E. (1992). Wellness, prevention, development: The cornerstone of the
profession. Journal of Counseling and Development, 71(2), 136-139.
Myers, J.E., Sweeney, T.J., & Witmer, J.M. (2000). The wheel of wellness counseling for
wellness: A holistic model for treatment planning. Journal of Counseling and
Development, 78(3), 221-266.
Napier, A. (1978). The family crucible. New York: Harper & Row.
National Center for Complementary and Alternative Medicine. (2002). What is
complementary and alternative medicine? Retrieved November 29, 2003, from
7H7Hhttp://nccam.nih.gov/health/whatiscam/.
Ngoma, M.C., Prince, M., & Mann, A. (2003). Common mental health disorders among
those attending primary health clinics and traditional healers in urban Tanzania.
British Journal of Psychiatry, 183, 349-355.
Nichols, M.P., & Schwartz, R.C. (1998). Family therapy: Concepts and methods. Boston:
Allyn & Bacon.
Novak, T.P., & Hoffman, D.L. (1998). Bridging the racial divide on the Internet. Science,
280(5362), 390-391.
Olejnik, S., & Algina, J. (2000). Measures of effect size for comparative studies:
136
Applications, interpretations, and limitations. Contemporary Educational
Psychology, 25, 241-286.
O’Mathuna, D.O. (2001). The best of both approaches: The role of science in
complementary and alternative medicine. EMBO Reports, 2(12), 1054-1057.
Owen, D.K., Lewith, G., & Stephens, C.R. (2001). Can doctors respond to patients’
increasing interest in complementary and alternative medicine? British Medical
Journal, 322, 154-158.
Owen, D.W., & Weikel, W.J. (1999). Computer utilization by school counselors.
Professional School Counseling, 2(3), 179-182.
Paramor, L.C. (1996). Use of alternative therapies: Estimates from the 1994 Robert
Wood Johnson Foundation National Access to Care Survey. Journal of Pain
Symptom Management, 13(2), 83-89.
Pelletier, K.R. (1977). Mind as healer, mind as slayer. New York: Dell.
Pert, C.B. (1997). Molecules of emotion: The science behind mind-body medicine. New
York: Simon and Schuster.
Pollock, K.M. (2001). Exercise in treating depression: Broadening the psychotherapist’s
role. Journal of Clinical Psychology, 57, 1289-1300.
Rand, M.L. (1996). As it was in the beginning: The significance of infant bonding in the
development of self and relationships. Journal of Child and Youth Care, 10(4) 1-
8.
Rappaport, B.S. (1975). Carnal knowledge: What the wisdom of the body has to offer
psychotherapy. Journal of Humanistic Psychology, 15(1), 49-70.
Rea, L.M., & Parker, R.A. (1992). Designing and conducting survey research. San
Francisco: Jossey-Bass.
Richardson, M.A., Sanders, T., Palmer, J.L., Greisinger, A., & Singletary, S.E. (2000).
Complementary/alternative medicine use in a comprehensive cancer center and
the implications for oncology. Journal of Clinical Oncology, 18(13), 2505-2514.
Roberts, S.A., Kiselica, M.S., & Fredrickson, S.A. (2002). Quality of life of persons with
medical illnesses: Counseling’s holistic contribution. Journal of Counseling and
Development, 80(4), 422-432.
Rogers, C.R. (1957). The necessary and sufficient conditions of therapeutic
137
personality change. Journal of Consulting Psychology, 21(2), 95-103.
Rossi, E.L. (1986). The psychobiology of mind-body healing. New York: Norton.
Shaef, A.W. (1994). Beyond therapy, beyond science. New York: HarperCollins
Publishers.
Schaefer, D.R., & Dillman, D.A. (1998). Development of a standard email methodology:
Results of an experiment. Public Opinion Quarterly, 62, 378-397.
Schaffer, H.J., LaSalvia, T.A., & Stein, J.P. (1997). Comparing Hatha Yoga with
dynamic group psychotherapy for enhancing methadone maintenance treatment:
A randomized clinical trial. Alternative Therapies, 3(4), 57-66.
Schlesinger, H.J., & Appelbaum, A.H. (2000). When words are not enough.
Psychoanalytic Inquiry, 20(1), 124-143.
Schonlau, M., Fricker, Jr., R.D., & Elliott, M.N. (2002). Conducting research surveys
via E-mail and the Web. Santa Monica, CA: Rand Corporation.
Schwiebert, V.L., Sealander, K.A., & Dennison, J.L. (2002). Strategies for counselors
working with high school students with Attention-Deficit/Hyperactivity Disorder,
Journal of Counseling and Development 80(1), 3-10.
Shannon, S. (Ed.). (2002). Handbook of complementary and alternative therapies in
mental health. San Diego: Academic Press.
Sheehan, K.M., & Hoy, M.G. (1999). Using email to survey Internet users in the United
States: Methodology and assessment. Journal of Computer Mediated
Communication, 4(3). Retrieved April 24, 2004, from
8H8Hhttp://jcmc.indiana.edu/vol4/issue3/sheehan.html.
Sikand, A., & Laken, M. (1998). Pediatricians’ experience with and attitudes toward
complementary/alternative medicine. Archives of Pediatric and Adolescent
Medicine, 152, 1059-1064.
Sills, S.J., & Song, C. (2002). Innovations in survey research: An application of web-
based surveys. Social Science Computer Review, 20(1), 22-30.
Smith, C.B. (1997). Casting the net: Surveying an Internet population. Journal of
Computer Mediated Communications, 3(1). Retrieved February 1, 2004, from
9H9Hhttp://www.ascusc.org/jcmc/vol3/issue1/smith.html.
Smithson, M. (2003). Confidence Intervals. Thousand Oaks, CA: Sage Publications.
138
Stross, R.E. (2000). Digital divide hooey. U.S. News & World Report, 128(15), 45.
Studdert, D.M., Eisenberg, D.M., Miller, F.H., Curto, D.A., Kaptchuk, T.J., & Brennen,
T.A. (1998). Medical malpractice implications of alternative medicine. Journal of
the American Medical Association, 280(18), 1610-1615.
Swoboda, W.J., Muhlberger, N., Weitkunat, R., & Schneeweiss, S. (1997). Internet
surveys by direct mailing: An innovative way of collecting data. Social Science
Computer Review, 15(3), 242-255.
Teeguarden, I.M. (1988). The joy of feeling: Bodymind acupressure. Tokyo: Japan
Publications.
Teyber, E. (1997). Interpersonal process in psychotherapy: A relational approach.
Pacific Grove, CA: Brookes/Cole.
Thompson, B. (2002a). “Statistical,” “Practical,” and “Clinical”: How many kinds of
significance do counselors need to consider? Journal of Counseling and
Development, 80(1), 64-71.
Thompson, B. (2002b). What the future of quantitative social science research could look
like: Confidence intervals for effect sizes. Educational Researcher, 31(3), 25-32.
Trachtenberg, D. (2002). Alternative therapies and public health: Crisis or opportunity?
American Journal of Public Health, 92(10), 1566-1567.
Truell, A.D., Bartlett, J.E., & Alexander, M.W. (2002). Response rate, speed, and
completeness: A comparison of Internet-based and mail surveys. Behavior
Research Methods, Instruments, & Computers, 34(1), 46-49.
Truant, T., & Bottorff, J.L. (1999). Decision making related to complementary therapies:
A process of regaining control. Patient Education and Counseling, 38, 131-142.
Turner, J.L., & Turner, D.B. (1998, November/December). Using the Internet to perform
survey research. Syllabus, 58-61.
Unutzer, J., Klap, R., Sturm, R., Young, A.S., Marmon, T., Shatkin, J., & Wells, K.B.
(2000). Mental disorders and the use of alternative medicine: Results from a
national survey. American Journal of Psychiatry, 157(11), 1851-1857.
Verhoff, M.J., & Sutherland, L.R. (1995). General practitioners’ assessment of and
interest in alternative medicine in Canada. Social Science Medicine, 41(4), 511-
515.
139
Watt, J. (1997, June). Using the Internet for quantitative survey research. Quirk’s
Marketing Research Review, 248. Retrieved December 9, 2003, from
10H10Hhttp://www.quirks.com/articles/article.asp?arg_ArticleId=248.
Weil, A. (1997). Eight weeks to optimum health. New York: Alfred A. Knopf.
West, W. (1997). Integrating counseling, psychotherapy and healing: An inquiry into
counsellors whose work includes healing. British Journal of Guidance and
Counselling, 25(3), 291-311.
Wetzel, M.S., Eisenberg, D.M., & Kaptchuk, T.J. (1998). Courses involving
complementary and alternative medicine at US medical schools. Journal of the
American Medical Association, 280(9), 784-787.
Wetzel, M.S., Kaptchuk, T.J., Haramati, A, & Eisenberg, D.M., (2003). Complementary
and alternative medical therapies: Implications for medical education. Annals of
Internal Medicine, 138, 191-196.
White, J.A., Carey, L.M., & Dailey, K.A. (2001). Web-based instrumentation in
educational survey research. WebNet Journal, 1, 46-50.
White, K.P. (2000). Psychology and complementary and alternative medicine.
Professional Psychology: Research and Practice, 31(6), 671-681.
Wilber, K. (1991). No boundary. Boston: Shambala.
Wilkinson, D.Y. (1987). Traditional medicine in American families: Reliance on the
wisdom of elders. In D.Y. Wilkinson, & M.B. Sussman (Eds.), Alternative health
maintenance and healing systems for families (pp. 65-76). New York: The
Haworth Press.
Wilkinson, L., & APA Task Force on Statistical Inference. (1999). Statistical methods in
psychology journals: Guidelines and explanations. American Psychologist, 54(8),
594-604.
Winkelman, M. (2002). Shamanism as neurotheology and evolutionary psychology.
American Behavioral Scientist, 45(12), 1875-1887.
Witmer, J.M., & Sweeney, T.J. (1992). A holistic model for wellness and prevention over
the life span. Journal of Counseling and Development, 71(2), 140-148.
World Health Organization. (2002). WHO Traditional Medicine Strategy 2002-2005.
Geneva, Switzerland: Author.
140
Yager, J., Siefried, S.L., & DiMatteo, T.L. (1999). Use of alternative therapies by
psychiatric patients: Illustrative vignettes and a discussion of the issues. American
Journal of Psychiatry, 156(9), 1432-1438.
Yamey, G. (2000). Can complementary medicine be evidence-based? Western Journal of
Medicine, 173, 4-5.
Young, A.S., Klap, R., Sherbourne, C.D., & Well, K.B. (2001). The quality of care for
depressive and anxiety disorders in the United States. Archives of General
Psychiatry, 58, 55-61.
Zollman, C., & Vickers, A. (1999). ABC of complementary medicine: Complementary
medicine and the patient. British Medical Journal, 319, 1486-1489.
141
APPENDIX A
Survey Instrument
Welcome to the Online Survey of
Counselors’ Experiences with Complementary and Alternative Therapy!
Your responses are important, as there has been little research to date, which specifically addresses counselors' experiences with complementary and alternative therapy. This study has importance for research, policy, education and practice in counseling. It will support the counseling profession in furthering its commitment to mental health from a holistic perspective of wellness across the lifespan.
Your responses are confidential. No response can be linked to an individual participant.
The risks to participating in this study are minimal. In rare instances, some participants may experience some discomfort associated with their self-disclosure about their experiences with complementary and alternative therapy. If during or after the participation in this research you experience any psychological discomfort, you may contact Trent Davis, who is a trained therapist (contact information listed below).
You have the freedom to withdraw from the research at any time without being penalized in any capacity. There will be no monetary compensation for participants involved in this study.
This research project has been approved, as required, by the Institutional Review Board (IRB) for Research Involving Human Subjects at Virginia Polytechnic Institute and State University. Submission of the survey is evidence of your voluntary willingness to participate. Should you have any questions or concerns about this research or its conduct, research participants rights, and whom to contact in the event of a research-related injury, you may contact: Trent A. Davis, EdS, 540-951-7230 ([email protected]) Hildy Getz, Faculty Advisor, 540-231-8194 ([email protected]) David M. Moore, Chair, IRB, 540-231-4991 ([email protected]) Instructions for completing the survey:
• The survey includes [39] questions and should take about [10-15] minutes to complete. • PLEASE ANSWER EVERY QUESTION! Incomplete surveys may not be included in the results
(due to limitations of the software used to create the survey). • You may use the scroll bar to move through the questions. • For each question, use your mouse to click on the appropriate answer. • For those questions that require you to enter a number or type your answer, use your mouse to
click in the text box first, then begin typing. • When you are finished, use your mouse to click on the “Submit” button at the end of the survey.
You will then see a page telling you that your answers have been submitted.
Note: Please complete the survey only once.
Below is a list of Complementary and Alternative Therapy (CAT) modalities, which may be helpful in completing the survey: Acupuncture Aromatherapy Art therapy
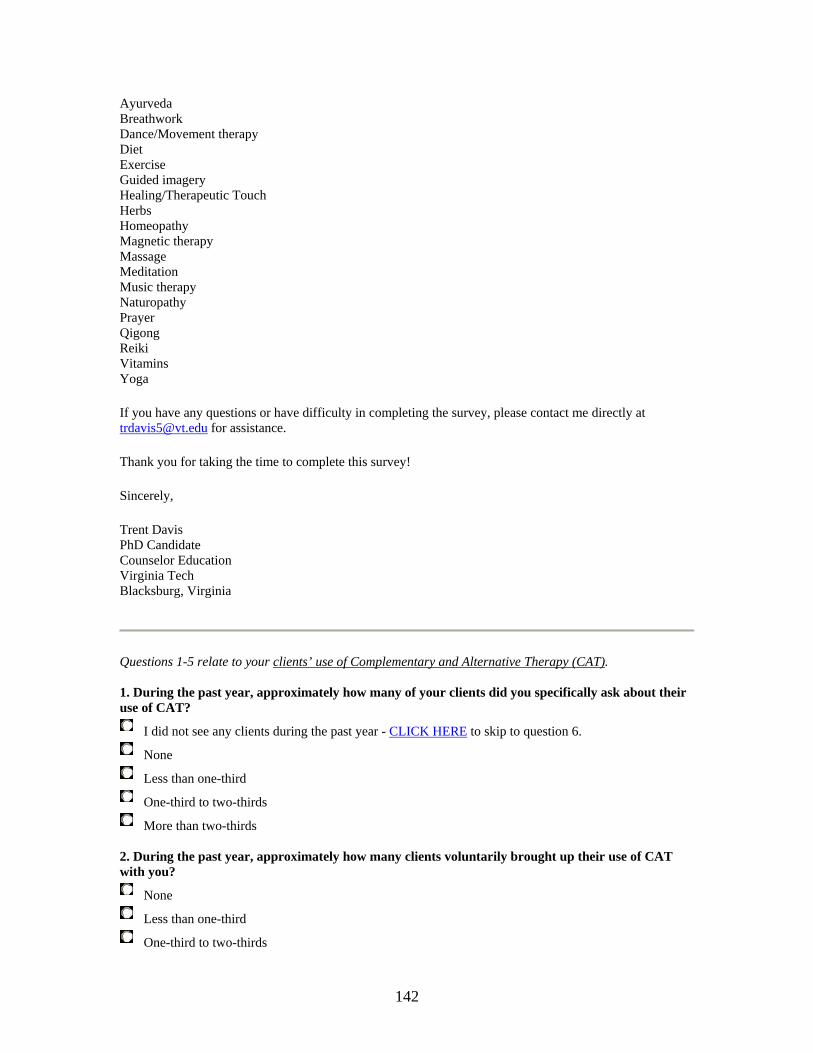
142
Ayurveda Breathwork Dance/Movement therapy Diet Exercise Guided imagery Healing/Therapeutic Touch Herbs Homeopathy Magnetic therapy Massage Meditation Music therapy Naturopathy Prayer Qigong Reiki Vitamins Yoga
If you have any questions or have difficulty in completing the survey, please contact me directly at [email protected] for assistance.
Thank you for taking the time to complete this survey!
Sincerely,
Trent Davis PhD Candidate Counselor Education Virginia Tech Blacksburg, Virginia
Questions 1-5 relate to your clients’ use of Complementary and Alternative Therapy (CAT). 1. During the past year, approximately how many of your clients did you specifically ask about their use of CAT?
I did not see any clients during the past year - 12H12HCLICK HERE to skip to question 6.
None
Less than one-third
One-third to two-thirds
More than two-thirds 2. During the past year, approximately how many clients voluntarily brought up their use of CAT with you?
None
Less than one-third
One-third to two-thirds
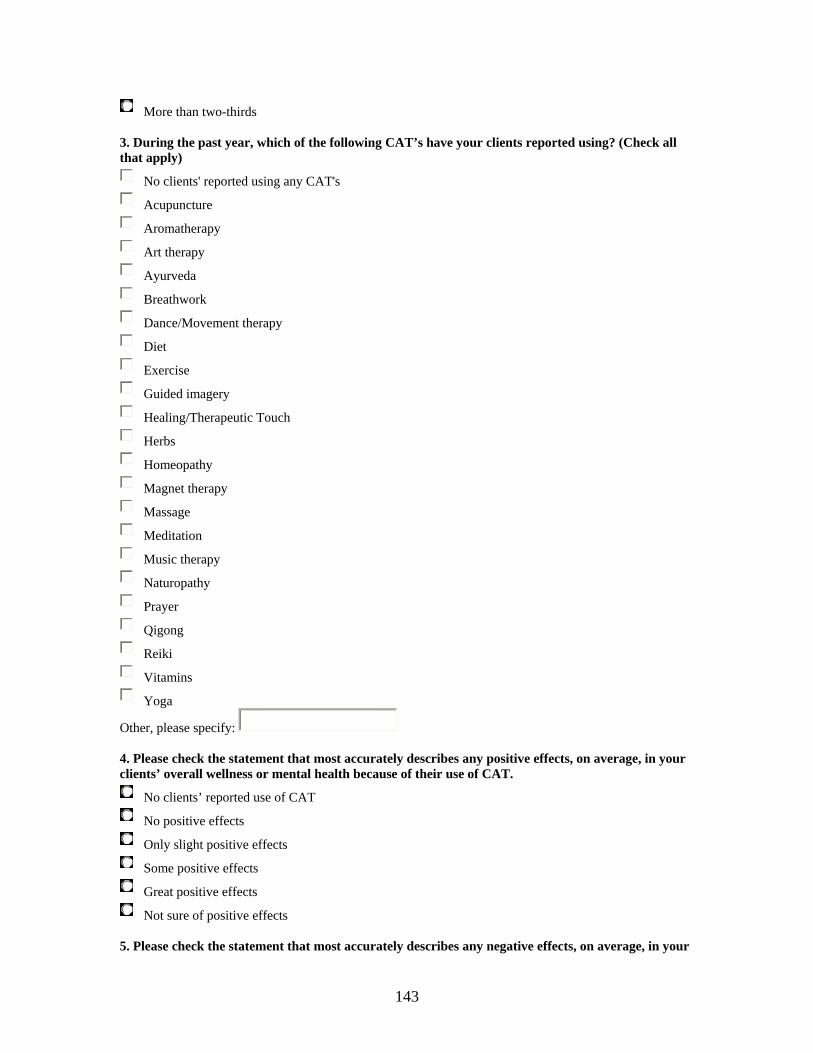
143
More than two-thirds 3. During the past year, which of the following CAT’s have your clients reported using? (Check all that apply)
No clients' reported using any CAT's
Acupuncture
Aromatherapy
Art therapy
Ayurveda
Breathwork
Dance/Movement therapy
Diet
Exercise
Guided imagery
Healing/Therapeutic Touch
Herbs
Homeopathy
Magnet therapy
Massage
Meditation
Music therapy
Naturopathy
Prayer
Qigong
Reiki
Vitamins
Yoga
Other, please specify: 4. Please check the statement that most accurately describes any positive effects, on average, in your clients’ overall wellness or mental health because of their use of CAT.
No clients’ reported use of CAT
No positive effects
Only slight positive effects
Some positive effects
Great positive effects
Not sure of positive effects 5. Please check the statement that most accurately describes any negative effects, on average, in your
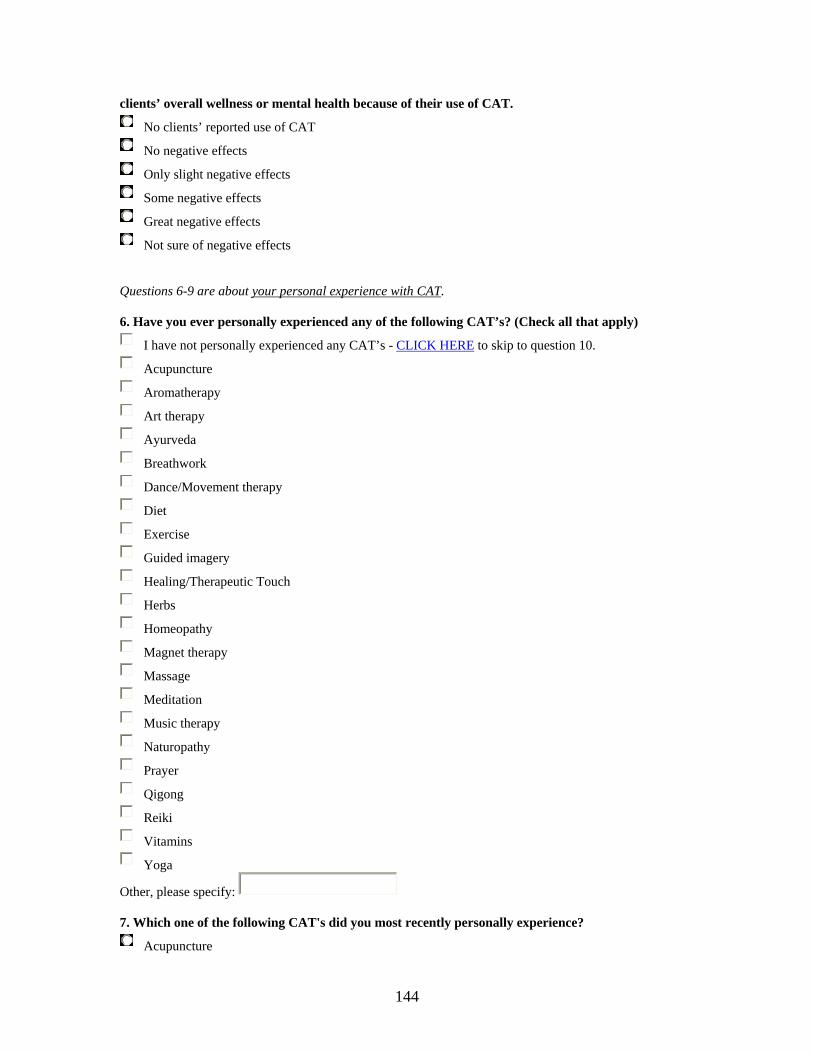
144
clients’ overall wellness or mental health because of their use of CAT.
No clients’ reported use of CAT
No negative effects
Only slight negative effects
Some negative effects
Great negative effects
Not sure of negative effects Questions 6-9 are about your personal experience with CAT. 6. Have you ever personally experienced any of the following CAT’s? (Check all that apply)
I have not personally experienced any CAT’s - 13H13HCLICK HERE to skip to question 10.
Acupuncture
Aromatherapy
Art therapy
Ayurveda
Breathwork
Dance/Movement therapy
Diet
Exercise
Guided imagery
Healing/Therapeutic Touch
Herbs
Homeopathy
Magnet therapy
Massage
Meditation
Music therapy
Naturopathy
Prayer
Qigong
Reiki
Vitamins
Yoga
Other, please specify: 7. Which one of the following CAT's did you most recently personally experience?
Acupuncture
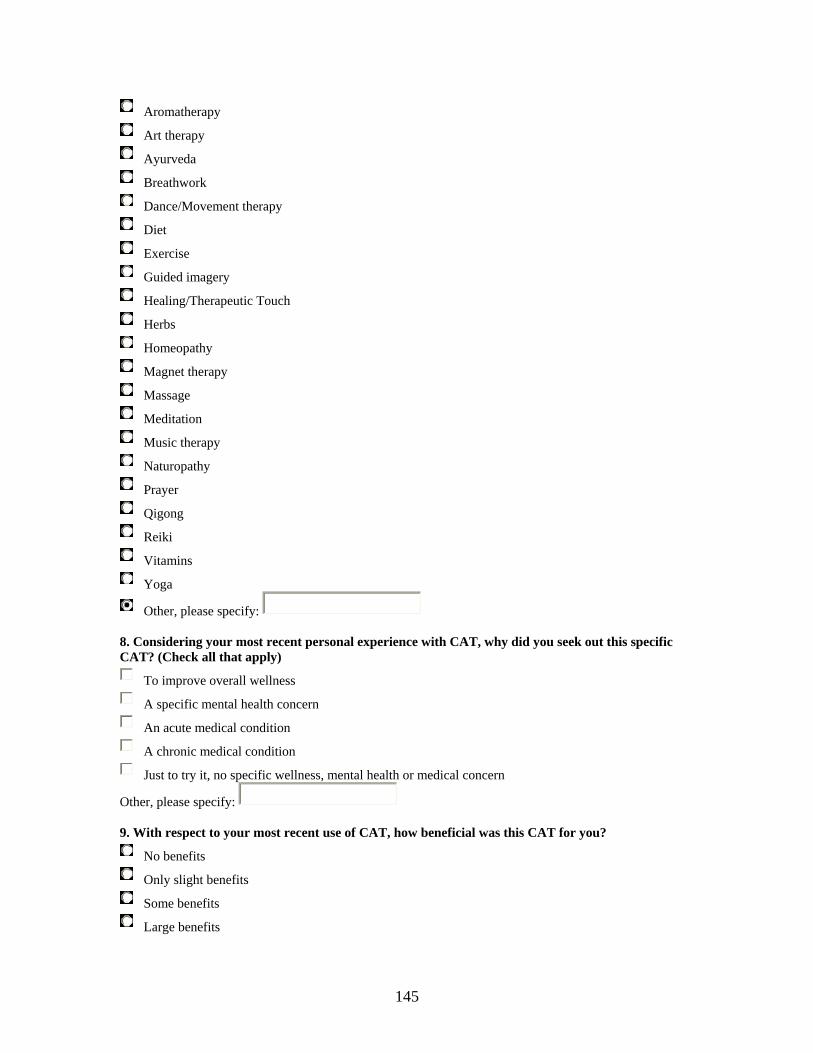
145
Aromatherapy
Art therapy
Ayurveda
Breathwork
Dance/Movement therapy
Diet
Exercise
Guided imagery
Healing/Therapeutic Touch
Herbs
Homeopathy
Magnet therapy
Massage
Meditation
Music therapy
Naturopathy
Prayer
Qigong
Reiki
Vitamins
Yoga
Other, please specify:
8. Considering your most recent personal experience with CAT, why did you seek out this specific CAT? (Check all that apply)
To improve overall wellness
A specific mental health concern
An acute medical condition
A chronic medical condition
Just to try it, no specific wellness, mental health or medical concern
Other, please specify: 9. With respect to your most recent use of CAT, how beneficial was this CAT for you?
No benefits
Only slight benefits
Some benefits
Large benefits
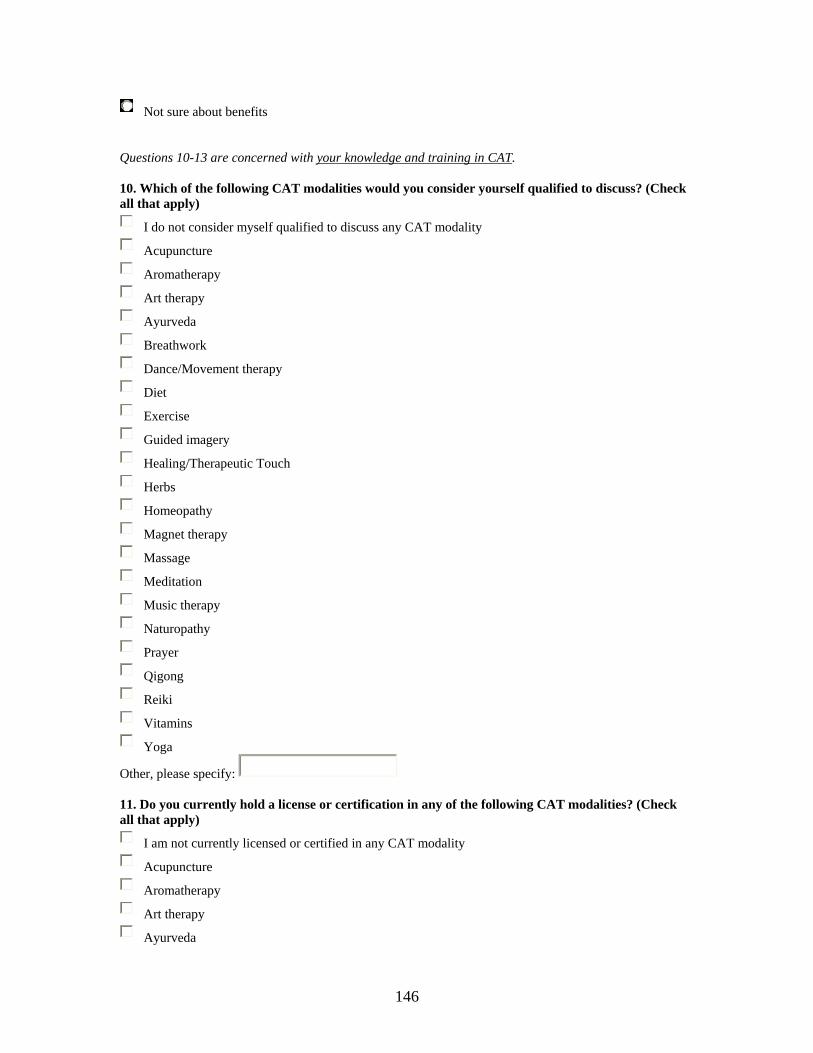
146
Not sure about benefits Questions 10-13 are concerned with your knowledge and training in CAT. 10. Which of the following CAT modalities would you consider yourself qualified to discuss? (Check all that apply)
I do not consider myself qualified to discuss any CAT modality
Acupuncture
Aromatherapy
Art therapy
Ayurveda
Breathwork
Dance/Movement therapy
Diet
Exercise
Guided imagery
Healing/Therapeutic Touch
Herbs
Homeopathy
Magnet therapy
Massage
Meditation
Music therapy
Naturopathy
Prayer
Qigong
Reiki
Vitamins
Yoga
Other, please specify: 11. Do you currently hold a license or certification in any of the following CAT modalities? (Check all that apply)
I am not currently licensed or certified in any CAT modality
Acupuncture
Aromatherapy
Art therapy
Ayurveda
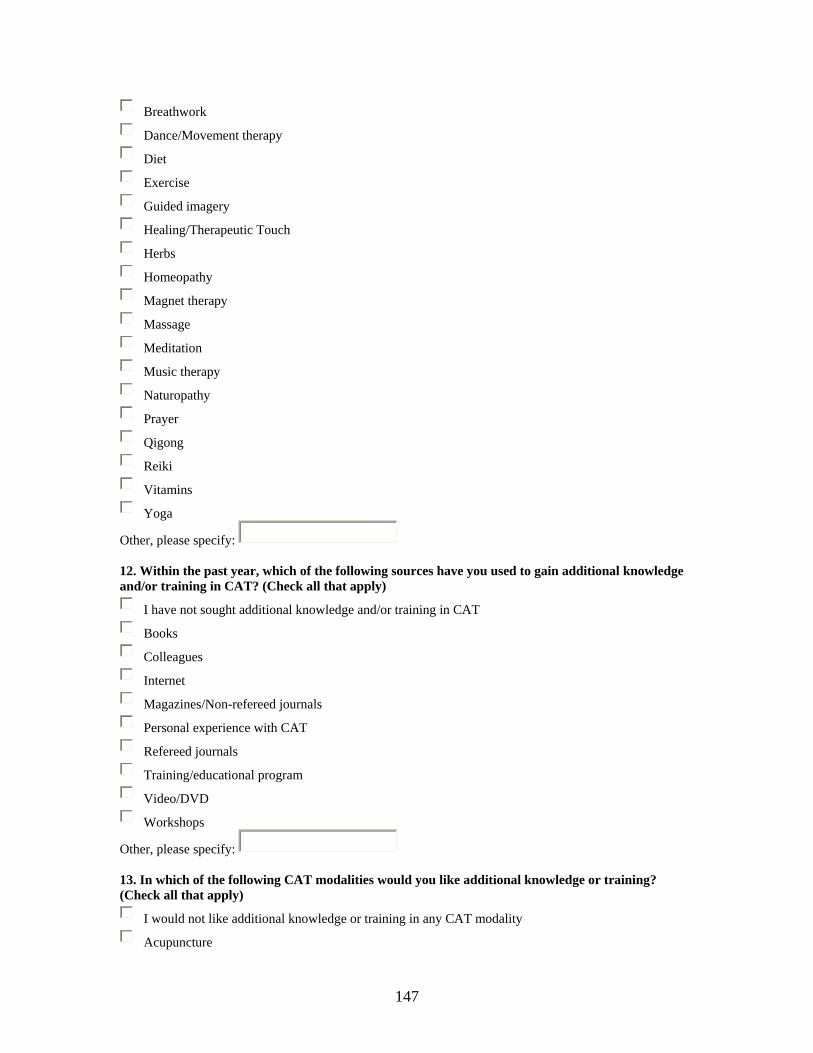
147
Breathwork
Dance/Movement therapy
Diet
Exercise
Guided imagery
Healing/Therapeutic Touch
Herbs
Homeopathy
Magnet therapy
Massage
Meditation
Music therapy
Naturopathy
Prayer
Qigong
Reiki
Vitamins
Yoga
Other, please specify: 12. Within the past year, which of the following sources have you used to gain additional knowledge and/or training in CAT? (Check all that apply)
I have not sought additional knowledge and/or training in CAT
Books
Colleagues
Internet
Magazines/Non-refereed journals
Personal experience with CAT
Refereed journals
Training/educational program
Video/DVD
Workshops
Other, please specify: 13. In which of the following CAT modalities would you like additional knowledge or training? (Check all that apply)
I would not like additional knowledge or training in any CAT modality
Acupuncture
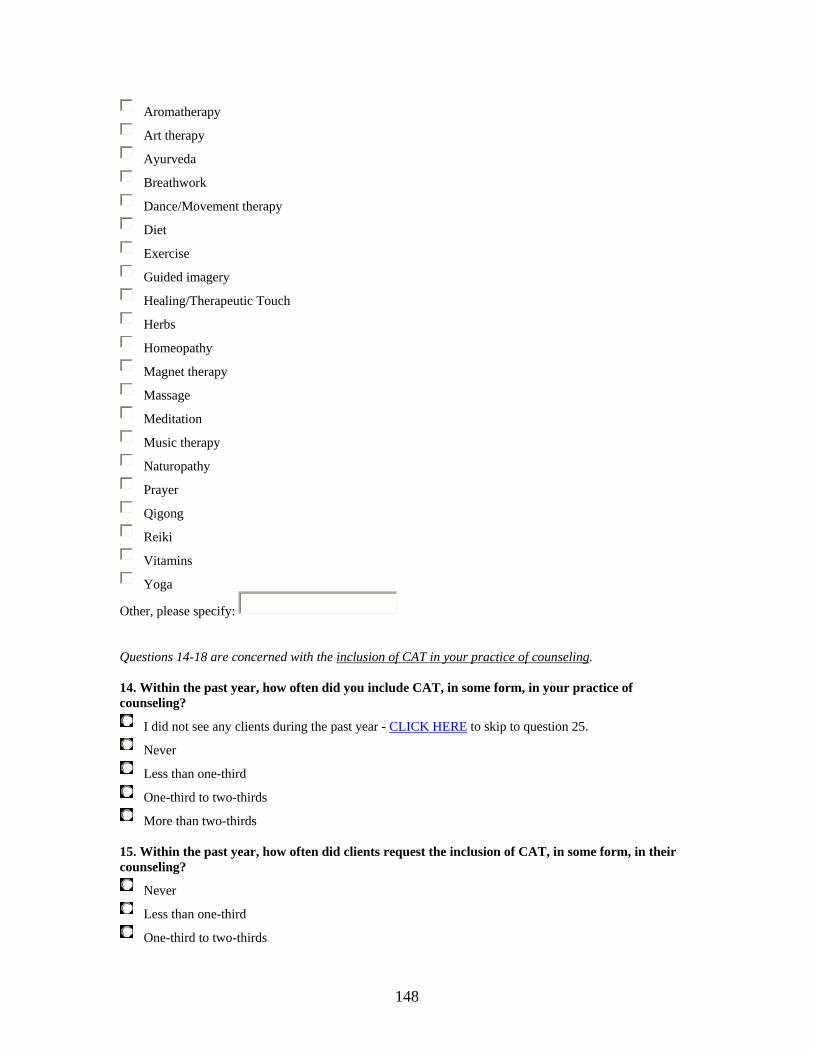
148
Aromatherapy
Art therapy
Ayurveda
Breathwork
Dance/Movement therapy
Diet
Exercise
Guided imagery
Healing/Therapeutic Touch
Herbs
Homeopathy
Magnet therapy
Massage
Meditation
Music therapy
Naturopathy
Prayer
Qigong
Reiki
Vitamins
Yoga
Other, please specify: Questions 14-18 are concerned with the inclusion of CAT in your practice of counseling. 14. Within the past year, how often did you include CAT, in some form, in your practice of counseling?
I did not see any clients during the past year - 14H14HCLICK HERE to skip to question 25.
Never
Less than one-third
One-third to two-thirds
More than two-thirds 15. Within the past year, how often did clients request the inclusion of CAT, in some form, in their counseling?
Never
Less than one-third
One-third to two-thirds
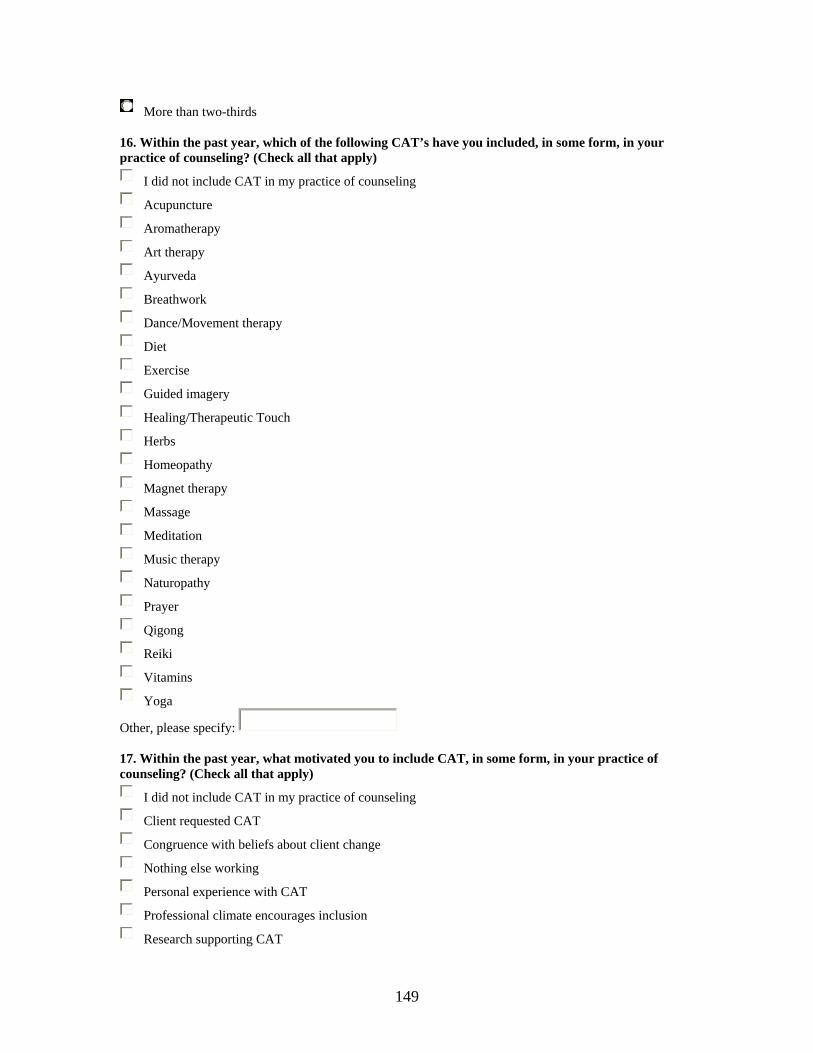
149
More than two-thirds 16. Within the past year, which of the following CAT’s have you included, in some form, in your practice of counseling? (Check all that apply)
I did not include CAT in my practice of counseling
Acupuncture
Aromatherapy
Art therapy
Ayurveda
Breathwork
Dance/Movement therapy
Diet
Exercise
Guided imagery
Healing/Therapeutic Touch
Herbs
Homeopathy
Magnet therapy
Massage
Meditation
Music therapy
Naturopathy
Prayer
Qigong
Reiki
Vitamins
Yoga
Other, please specify: 17. Within the past year, what motivated you to include CAT, in some form, in your practice of counseling? (Check all that apply)
I did not include CAT in my practice of counseling
Client requested CAT
Congruence with beliefs about client change
Nothing else working
Personal experience with CAT
Professional climate encourages inclusion
Research supporting CAT
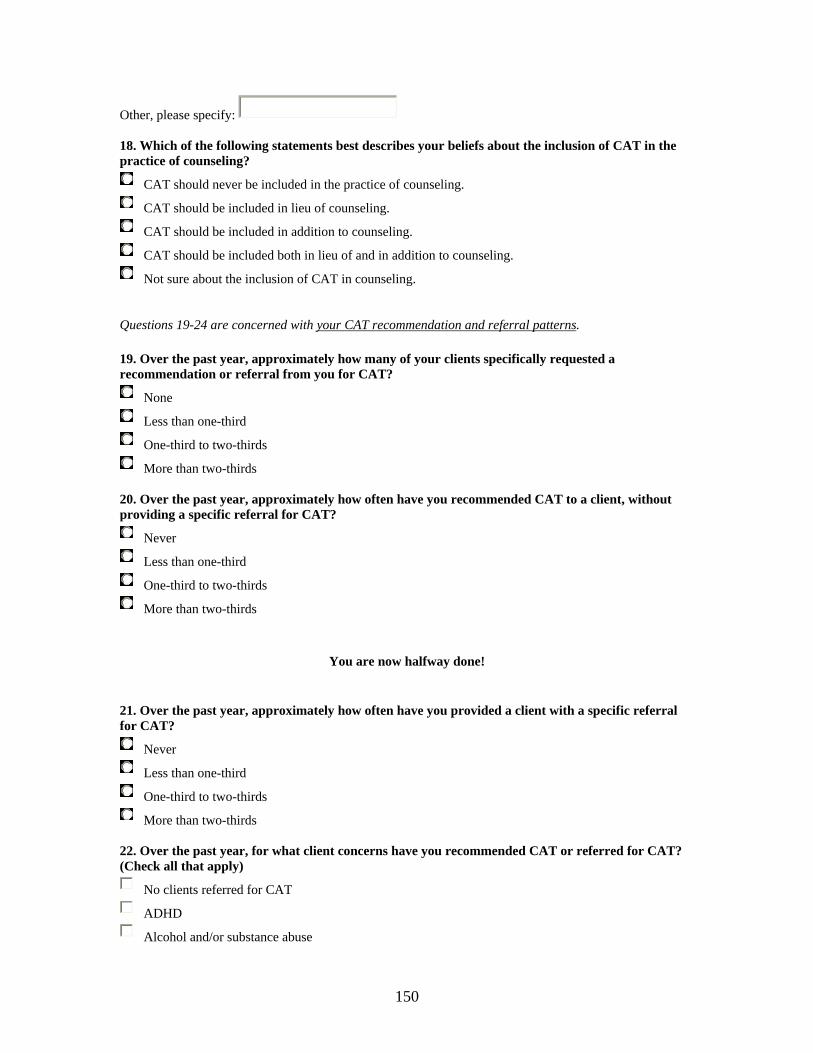
150
Other, please specify: 18. Which of the following statements best describes your beliefs about the inclusion of CAT in the practice of counseling?
CAT should never be included in the practice of counseling.
CAT should be included in lieu of counseling.
CAT should be included in addition to counseling.
CAT should be included both in lieu of and in addition to counseling.
Not sure about the inclusion of CAT in counseling. Questions 19-24 are concerned with your CAT recommendation and referral patterns.
19. Over the past year, approximately how many of your clients specifically requested a recommendation or referral from you for CAT?
None
Less than one-third
One-third to two-thirds
More than two-thirds 20. Over the past year, approximately how often have you recommended CAT to a client, without providing a specific referral for CAT?
Never
Less than one-third
One-third to two-thirds
More than two-thirds
You are now halfway done!
21. Over the past year, approximately how often have you provided a client with a specific referral for CAT?
Never
Less than one-third
One-third to two-thirds
More than two-thirds 22. Over the past year, for what client concerns have you recommended CAT or referred for CAT? (Check all that apply)
No clients referred for CAT
ADHD
Alcohol and/or substance abuse
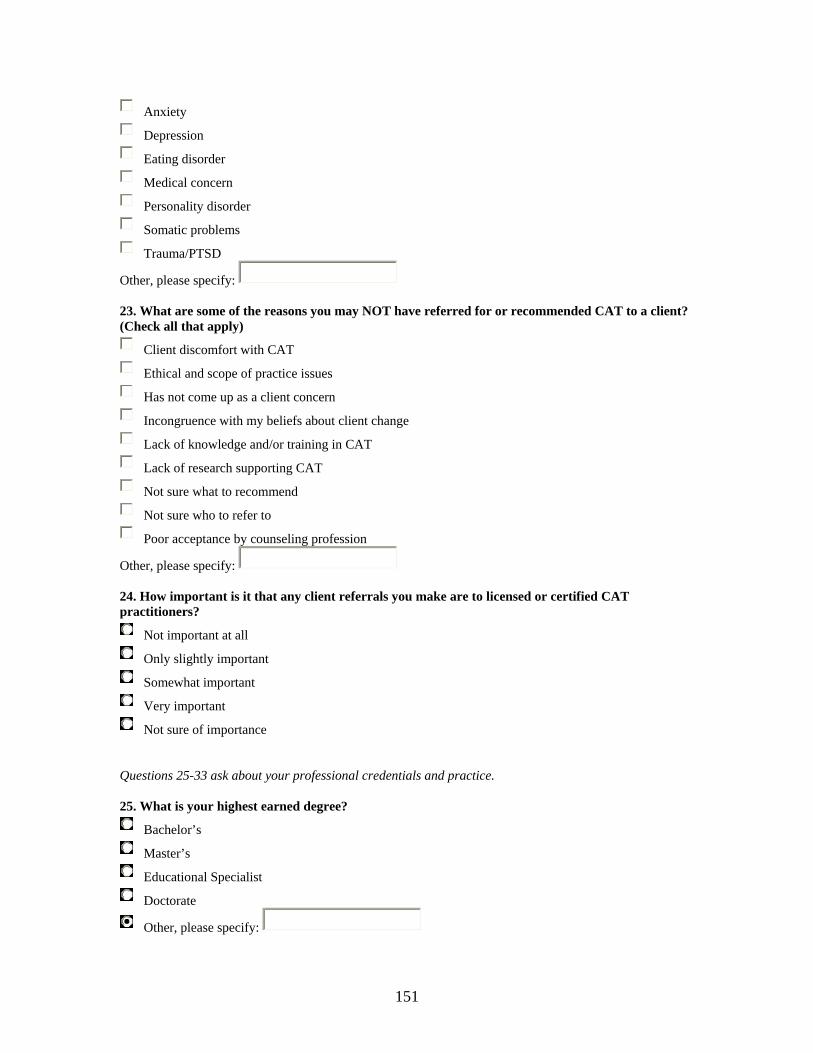
151
Anxiety
Depression
Eating disorder
Medical concern
Personality disorder
Somatic problems
Trauma/PTSD
Other, please specify: 23. What are some of the reasons you may NOT have referred for or recommended CAT to a client? (Check all that apply)
Client discomfort with CAT
Ethical and scope of practice issues
Has not come up as a client concern
Incongruence with my beliefs about client change
Lack of knowledge and/or training in CAT
Lack of research supporting CAT
Not sure what to recommend
Not sure who to refer to
Poor acceptance by counseling profession
Other, please specify: 24. How important is it that any client referrals you make are to licensed or certified CAT practitioners?
Not important at all
Only slightly important
Somewhat important
Very important
Not sure of importance Questions 25-33 ask about your professional credentials and practice. 25. What is your highest earned degree?
Bachelor’s
Master’s
Educational Specialist
Doctorate
Other, please specify:
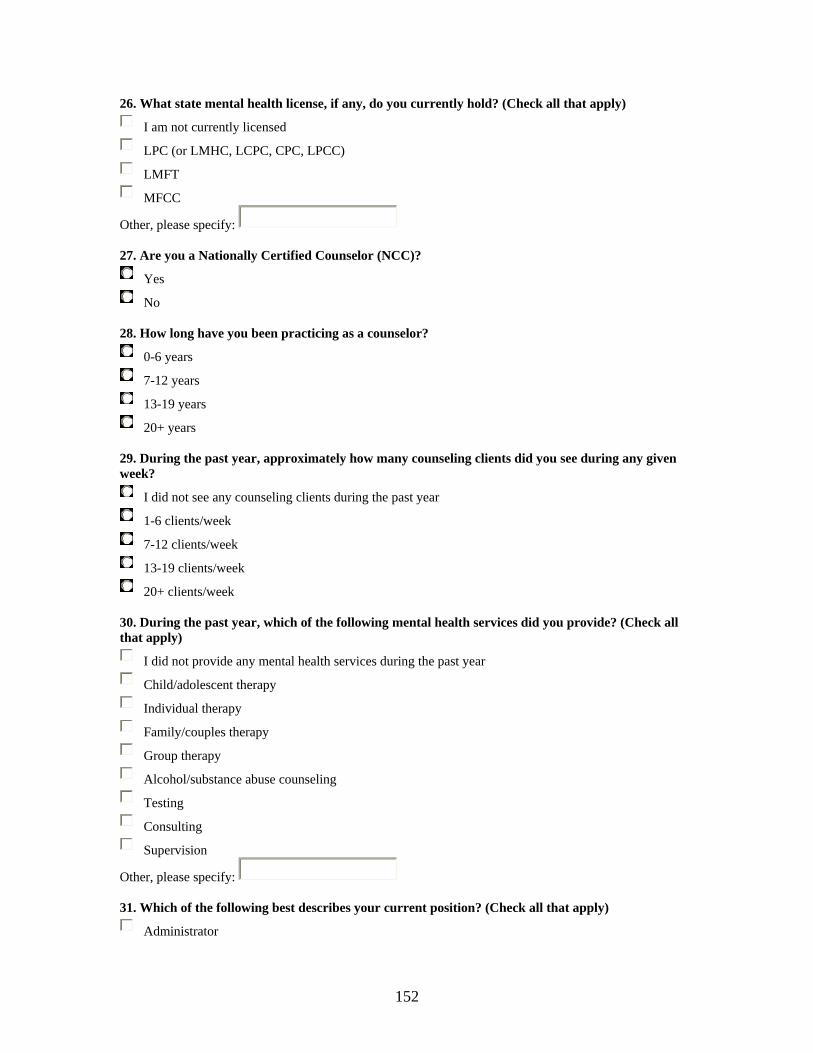
152
26. What state mental health license, if any, do you currently hold? (Check all that apply)
I am not currently licensed
LPC (or LMHC, LCPC, CPC, LPCC)
LMFT
MFCC
Other, please specify: 27. Are you a Nationally Certified Counselor (NCC)?
Yes
No 28. How long have you been practicing as a counselor?
0-6 years
7-12 years
13-19 years
20+ years 29. During the past year, approximately how many counseling clients did you see during any given week?
I did not see any counseling clients during the past year
1-6 clients/week
7-12 clients/week
13-19 clients/week
20+ clients/week 30. During the past year, which of the following mental health services did you provide? (Check all that apply)
I did not provide any mental health services during the past year
Child/adolescent therapy
Individual therapy
Family/couples therapy
Group therapy
Alcohol/substance abuse counseling
Testing
Consulting
Supervision
Other, please specify: 31. Which of the following best describes your current position? (Check all that apply)
Administrator
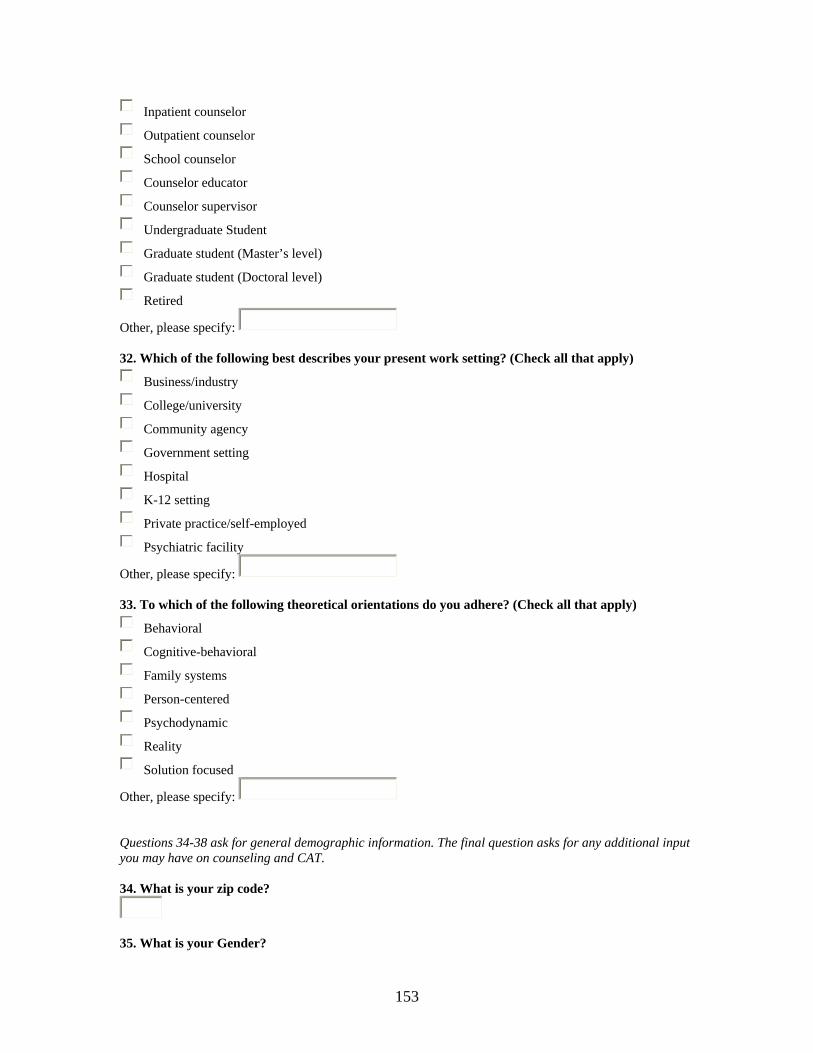
153
Inpatient counselor
Outpatient counselor
School counselor
Counselor educator
Counselor supervisor
Undergraduate Student
Graduate student (Master’s level)
Graduate student (Doctoral level)
Retired
Other, please specify: 32. Which of the following best describes your present work setting? (Check all that apply)
Business/industry
College/university
Community agency
Government setting
Hospital
K-12 setting
Private practice/self-employed
Psychiatric facility
Other, please specify: 33. To which of the following theoretical orientations do you adhere? (Check all that apply)
Behavioral
Cognitive-behavioral
Family systems
Person-centered
Psychodynamic
Reality
Solution focused
Other, please specify: Questions 34-38 ask for general demographic information. The final question asks for any additional input you may have on counseling and CAT. 34. What is your zip code?
35. What is your Gender?
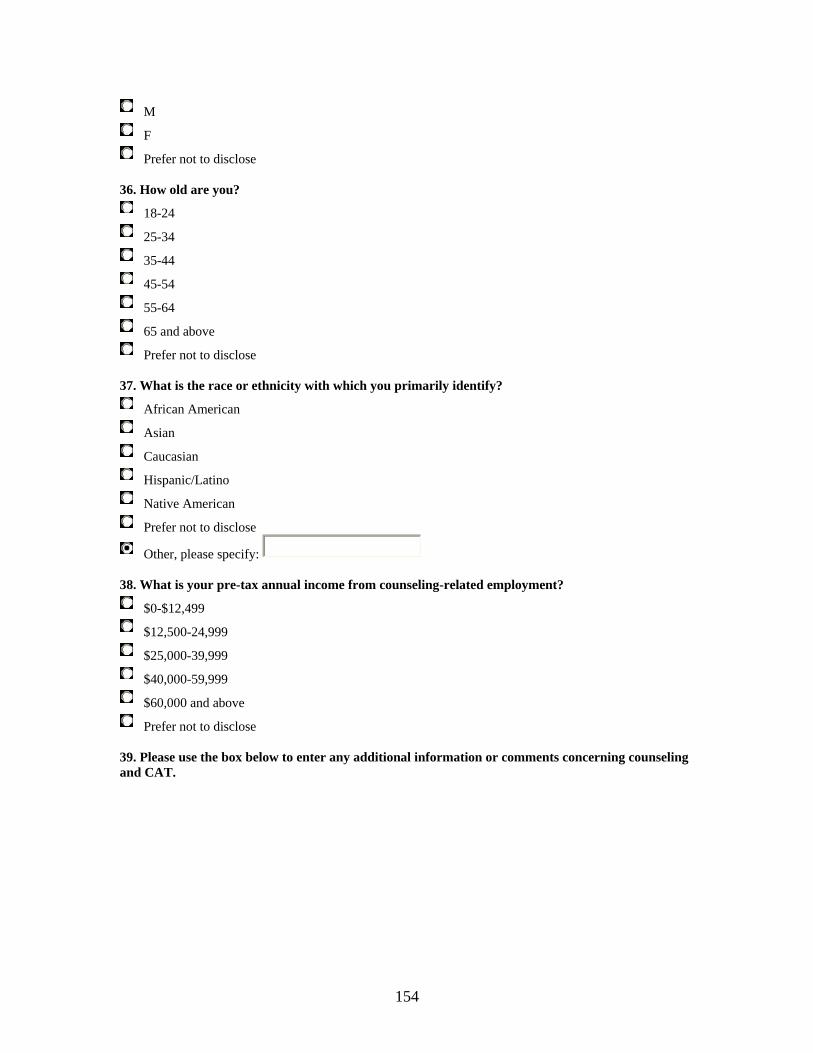
154
M
F
Prefer not to disclose 36. How old are you?
18-24
25-34
35-44
45-54
55-64
65 and above
Prefer not to disclose 37. What is the race or ethnicity with which you primarily identify?
African American
Asian
Caucasian
Hispanic/Latino
Native American
Prefer not to disclose
Other, please specify:
38. What is your pre-tax annual income from counseling-related employment?
$0-$12,499
$12,500-24,999
$25,000-39,999
$40,000-59,999
$60,000 and above
Prefer not to disclose 39. Please use the box below to enter any additional information or comments concerning counseling and CAT.
155
Congratulations... you have now completed the survey!
Please read below and then click the "Submit" button to send your survey: All information filled out in this survey will be kept strictly confidential. No identifying information will be used in reporting the results of this project. By submitting your answers to this survey, you are volunteering to be a participant in the survey and you are giving an implied consent.
Submit
156
APPENDIX B
First contact: Email announcing research study
Subject: Help with dissertation Dear Counseling Colleague, I am writing to ask for your help with my dissertation research. The purpose of this research is to explore the Experiences of Mental Health Counselors with Complementary and Alternative Therapy. I have specifically contacted you because of your membership in the American Counseling Association (ACA), which also provided your email address. Within the next couple of days, you will be receiving a follow-up email with a request to complete an online survey. (Look for an email with the subject line “Complementary Therapy Survey”.) Thank you in advance for your time and consideration. It is only with the generous help of counselors like yourself that this research will be successful. If you have any questions, feel free to contact me directly at [email protected]. Sincerely, Trent Davis PhD Candidate Counselor Education Virginia Tech Blacksburg, VA P.S. As a token of appreciation for your help, I created a useful webpage listing of Complementary and Alternative Therapy Web Resources for Counselors. To access the list, simply click on the following link: 15H15Hhttp://filebox.vt.edu/users/trdavis5/CAT/index.htm
157
APPENDIX C
Second contact: Email announcing study is open for data collection
Subject: Complementary Therapy Survey Dear Counseling Colleague, Here is the link to the online survey of Counselors’ Experiences with Complementary and Alternative Therapy. It should only take 10-15 minutes to complete the survey! Note: This study is applicable to all counseling disciplines, including counseling students. The survey is now open for data collection and will remain available for approximately three weeks. During this period, you may access the survey at your convenience, 24 hours per day. To access the survey, simply click on the following link: 16H16Hhttp://survey.vt.edu/survey/entry.jsp?id=1079639313264 This should open the survey in a new browser window (i.e., Netscape, Internet Explorer). If this does not work, then you may have to open your browser and copy the above link directly into the address line. When the survey opens, you will be prompted for the password listed below. This step was taken to insure the validity of the data. Password: summer I will also be sending two additional email reminders approximately one week apart to encourage those who have not taken the opportunity, to contribute to this research. Please ignore these reminders if you already completed the survey. (Due to the anonymous nature of the survey, I have no way of knowing who has responded or not). If you have any questions, feel free to contact me directly at [email protected]. Thank you very much for helping with this important study. Sincerely, Trent Davis PhD Candidate Counselor Education Virginia Tech Blacksburg, VA

158
P.S. As a token of appreciation for your help, I have created a useful webpage listing of Complementary and Alternative Therapy Web Resources for Counselors. To access the list, simply click on the following link: 17H17Hhttp://filebox.vt.edu/users/trdavis5/CAT/index.htm
159
APPENDIX D
Third contact: 1st thank you and reminder to complete survey
Subject: Reminder: Complementary Therapy Survey Dear Counseling Colleague, Last week you were sent an email with a link to an online survey concerning the Experiences Of Counselors with Complementary And Alternative Therapy. (Note: This study is applicable to all counseling disciplines, including counseling students.) If you have already completed the survey, please accept my sincere THANKS! You may simply ignore this reminder. If not, please take the opportunity to contribute your valuable input to this research. (Due to the anonymous nature of the survey, I have no way of knowing who has responded or not). I am especially grateful for your help, because it is only by asking counselors like you to share their experiences that researchers can understand the experiences of counselors with Complementary and Alternative Therapy. The survey is still open for data collection at your convenience (24 hours per day). It should only take about 10-15 minutes to complete the survey. To access the survey, simply click on the following link: 18H18Hhttp://survey.vt.edu/survey/entry.jsp?id=1079639313264 This should open the survey in a new browser window (i.e., Netscape, Internet Explorer). If this does not work, then you may have to open your browser and copy the above link directly into the address line. When the survey opens, you will be prompted for the password listed below. (This step was taken to insure the validity of the data.) Password: summer If you have any questions, feel free to contact me directly at [email protected]. I sincerely hope to hear from you soon, Trent Davis PhD Candidate Counselor Education Virginia Tech

160
P.S. As a token of appreciation for your help, I created a useful webpage listing of Complementary and Alternative Therapy Web Resources for Counselors. To access the list, simply click on the following link: 19H19Hhttp://filebox.vt.edu/users/trdavis5/CAT/index.htm
161
APPENDIX E
Fourth contact: 2nd thank you, reminder to complete survey,
and announcement of closing of data collection period Subject: Last Reminder: Complementary Therapy Survey Dear Counseling Colleague, This a final request for help with my dissertation research on Counselors’ Experiences with Complementary and Alternative Therapy. I sincerely hope you will choose to contribute to this important study. (Note: This study is applicable to ALL counseling disciplines, including counseling students.) THE SURVEY WILL REMAIN OPEN FOR ONLY THREE MORE DAYS AND WILL CLOSE ON WEDNESDAY, NOVEMBER 24 AT 12 PM! It should only take about 10-15 minutes to complete the survey. If you have already completed the survey, THANK YOU! You may simply ignore this reminder. If not, please take the opportunity to contribute your valuable input to this research. (Due to the anonymous nature of the survey, I have no way of knowing who has responded or not). I am happy to report the responses so far have been very informative regarding counselors’ experiences complementary and alternative therapy. Many respondents have emphatically stated this is an important area of research for our profession. I believe the results will serve as an important source of baseline data for professional practice, education, and policy decisions - and, most importantly, to inform future research efforts. I am writing you one last time because of the importance of having your experiences become a part of these results. It is only from hearing from every counselor that we can be sure the results are truly representative. YOU HAVE MY ASSURANCE THIS IS THE LAST E-MAIL YOU WILL RECEIVE ASKING FOR YOUR PARTICIPATION IN THIS STUDY! To access the survey, simply click on the following link: 20H20Hhttp://survey.vt.edu/survey/entry.jsp?id=1079639313264 This should open the survey in a new browser window (i.e., Netscape, Internet Explorer). If this does not work, then you may have to open your browser and copy the above link directly into the address line. When the survey opens, you will be prompted for the password listed below. This step
162
was taken to insure the validity of the data. Password: summer If you have any questions, feel free to contact me directly at [email protected]. Again, I sincerely hope to hear from you soon, Trent Davis PhD Candidate Counselor Education Virginia Tech Blacksburg, VA P.S. As a token of appreciation for your help, I created a useful webpage listing of Complementary and Alternative Therapy Web Resources for Counselors. To access the list, simply click on the following link: 21H21Hhttp://filebox.vt.edu/users/trdavis5/CAT/index.htm
163
APPENDIX F
Complementary and Alternative Therapy (CAT)
Web Resources for Counselors
Meta-sites: Please note that there is often a good deal of duplication across these sites. However, they each have their individual strengths and limitations. I have tried to highlight each site's notable qualities.
Alternative Medicine Foundation 22H22Hhttp://www.amfoundation.org/ "Providing consumers and professionals with responsible, evidence-based information on the integration of alternative and conventional medicine." Check out their Resource Guides (under "Main Projects").
Alternative Medicine Health Care Information Resources 23H23Hhttp://www-hsl.mcmaster.ca/tomflem/altmed.html#gen An encyclopedic resource for both general and specific information on CAT. Highly recommended, though not pretty to browse. (Compiled and maintained by Tom Flemming, McMaster University Health Sciences Library, Hamilton, Ontario, Canada.)
The Alternative Medicine Homepage 24H24Hhttp://www.pitt.edu/~cbw/altm.html Of note for its thorough listing of CAT databases and government resources. (Created and maintained by medical librarian, Charles B. Wessel, M.L.S., Health Sciences Library System, University of Pittsburgh.)
Association of College and Research Libraries (ACRL) 25H25Hhttp://www.ala.org/ala/acrl/acrlpubs/crlnews/backissues2002/september/complementary.htm Reliable meta-site. Notable for the global level of its CAT links
American Medical Student Association (AMSA) 26H26Hhttp://www.amsa.org/programs/gpit/compmed.cfm An interesting site which covers CAT from a (medical) student's perspective. Useful for mental health students as well. See their suggested activities for educating others about CAT.
The Cochrane Collaboration 27H27Hhttp://www.cochrane.org/index0.htm
164
"Produces and disseminates systematic reviews of healthcare interventions and promotes the search for evidence in the form of clinical trials and other studies of interventions." Check out the the Cochrane Library for reviews of CAT evidence. Complementary & Alternative Medicine (CAM) Resources 28H28Hhttp://www.library.tufts.edu/hsl/cam/cam_web.html A very nice lsiting of links for alternative medicine systems out of Tufts University. Not fancy, though.
Healing People 29H29Hhttp://www.healingpeople.com/ht/index.tmpl Coverage of Chinese/Oriental Medicine, Homeopathy, Aromatherapy, Bodywork, Ayurveda, and Western Herbalism. Notable for its professional advisory board and resources for professionals.
HealthWorld Online 30H30Hhttp://www.healthy.net/indexNet.asp A very well done site, which seems to cover it all. Wins the best looking site (and quote!) award.
HolisticOnline.com 31H31Hhttp://www.holisticonline.com/herb_home.htm Another good meta-resource. Notable for CAT guidance for a wide variety of concerns (see their Diseases and Conditions section).
National Center for Complementary and Alternative Medicine (NCCAM) 32H32Hhttp://nccam.nih.gov/ The federal government's primary organization for matters related to CAT; part of the National Institutes of Health. Provides an excellent overview of CAT. See the sections on "Treatment Information by Disease or Condition" and "Treatment Information by Treatment or Therapy" (under "Health Information").
New York Online Access to Health (NOAH) 33H33Hhttp://www.noah-health.org/en/alternative/index.html Excellent inventory of CAT approaches. Notable for its coverage of CAT for specific health conditions and concerns. And, its direct from New York City!
Sites for specific CAT's:
Acupuncture Acubriefs 34H34Hhttp://acubriefs.com/ A free searchable database with over 16,000 citations referencing acupuncture, supported in part by a grant from the Medical Acupuncture Research foundation. Especially for the scientist.
165
Acupuncture.com 35H35Hhttp://acupuncture.com/ Cover all matters acupuncture.
The Layman's Guide to Acupuncture 36H36Hhttp://acupuncture.edu/laymans/index.htm A very basic guide to acupuncture.
Aromatherapy AromaWeb 37H37Hhttp://www.aromaweb.com/default.asp Excellent recipes for using essential oils.
National Association for Holistic Aromatherapy (NAHA) 38H38Hhttp://www.naha.org/ Aromatherapy organization devoted to increasing the professionalism of the field.
Ayurveda AllAyurveda.com 39H39Hhttp://www.allayurveda.com/ Set up like an online resource book. (Note: after picking a topic from the index, scroll down to see the information).
National Institute of Ayurvedic Medicine (NIAM) 40H40Hhttp://niam.com/corp-web/index.htm "Recognized as the largest and most authentic resource of information on Ayurveda in the United States." Notable for its founder being both an MD and Ayurvedic practitioner.
Breathwork Breath-Directed Inner Healing & Transformation 41H41Hhttp://www.holisticmed.com/inner/breath.html Covers the main breathwork approaches.
Diet American Dietetic Association (ADA) 42H42Hhttp://www.eatright.org/Public/ Wide range of scientifically-based nutrition advice.
Kushi Institute: What is Macrobiotics ? 43H43Hhttp://www.kushiinstitute.org/whatismacro.html Promotes the "use of macrobiotic principles to address and adjust environmental, dietary and lifestyle influences" (on health). Shows the familar food pyramid with a healthy twist.
Exercise American Council on Exercise (ACE)
166
44H44Hhttp://www.acefitness.org/ Provides evidence-based exercise guidelines. Check out the Fit Facts one-page information sheets (under "Get Fit" heading).
Guided imagery Academy for Guided Imagery 45H45Hhttp://www.academyforguidedimagery.com/ Offers a bibliography of pertinent research, professional trainings and practitioner referrals.
Healing/Therapeutic Touch Barbara Brennan School of Healing 46H46Hhttp://www.barbarabrennan.com/ Hands-on energy healing.
Healing Touch International 47H47Hhttp://www.healingtouch.net/ Provides a professional certification program.
Herbs (also see the Traditional Chinese Medicine Herbal resources under Acupuncture.) Herb Research Foundation 48H48Hhttp://www.herbs.org/ Promotes scientific-based information on herbs. Go to HRF Research Reviews under "News & Views".
Homeopathy ABC Homeopathy 49H49Hhttp://www.abchomeopathy.com/ Am interesting site because of their "Online Remedy Finder".
National Center for Homeopathy 50H50Hhttp://www.homeopathic.org/index.html "By providing general education to the public about homeopathy, and specific education to homeopaths, we help to make homeopathy available throughout the United States." A good consumer resource.
Magnetic therapy Magnetic Therapy: Plausible Attraction? 51H51Hhttp://www.csicop.org/si/9807/magnet.html An interesting article on the possibility of magnetic therapy being more than a placebo. Published by Skeptical Inquirer magazine.
Using Magnets To Treat Pain 52H52Hhttp://www.nccam.nih.gov/health/magnet/magnet.htm
167
NCCAM research report "provides an overview of the use of magnets for pain, summarizes current scientific knowledge about their effectiveness for this purpose, and suggests additional sources of information".
Massage American Massage Therapy Association 53H53Hhttp://www.amtamassage.org/ The main professional association for massage therapists. A good source of information for consumers, including qualified referrals.
Associated Bodywork & Massage Professionals 54H54Hhttp://www.abmp.com/home/index.html Another professional association for massage therapists with additional information.
Meditation International Meditation Society 55H55Hhttp://www.vcn.bc.ca/ims-hq/ "Promoting World Peace through Meditation."
The World Wide Online Meditation Center 56H56Hhttp://www.meditationcenter.com/ A fun site! Straight-forward meditation instruction in a variety of techniques. Pick your room!
Transcendental Meditation program 57H57Hhttp://www.tm.org/index.html "A scientifically validated program." This is the one that started it all.
Movement therapy American Society for the Alexander Technique 58H58Hhttp://www.alexandertech.com/index.html "A proven approach to self-care, the Alexander Technique is a method that people of all ages and abilities can learn to relieve the pain and stress caused by everyday misuse of the body."
American Dance Therapy Association 59H59Hhttp://www.adta.org/ Professional organization, which promotes the "psychotherapeutic use of dance/movement as a process which furthers the emotional, cognitive, social and physical integration of the individual".
International Feldenkrais Federation 60H60Hhttp://www.feldenkrais-method.org/ Dr. Moshé Feldenkrais' contribution to the unity of body and mind.
168
Naturopathy American Association of Naturopathic Physicians 61H61Hhttp://www.naturopathic.org Professional society representing naturopathic physicians who are licensed or eligible for licensing as primary care providers.
Naturopathy Online 62H62Hhttp://www.naturopathyonline.com/ A consumer oriented site. Very nice.
Prayer Intercessory prayer (remote prayer with the intention of healing) remains extremely controversial. See Healing Words: The Power of Prayer and the Practice of Medicine by Larry Dossey (1993, HarperCollins: New York). Also see "Interview with Larry Dossey, M.D. On the role of prayer and meditation in medicine" in The Share Guide 63H63Hhttp://www.shareguide.com/Dossey.html
Qigong Qigong Association of America 64H64Hhttp://www.qi.org/index.html Basic information on Qigong. FYI, Qi (chi) means energy and gong (kung) means a skill or a practice. Qigong therefore means a skill or practice of cultivating energy.
National Qigong (Chi Kung) Association 65H65Hhttp://www.nqa.org/ An organization which promotes Qigong.
Reiki International Center for Reiki Training 66H66Hhttp://www.reiki.org/ All things Reiki. Disorganized site. Scroll down to get to site's table of contents.
Vitamins FDA Guide to Dietary Supplements 67H67Hhttp://www.cfsan.fda.gov/~dms/supplmnt.html No reference to vitamins would be complete without the FDA.
Health Supplements Information Service 68H68Hhttp://www.hsis.org/default.htm "Present facts about health supplementation in a simple, straightforward way." Check out their "Myths & Facts" section.
Yoga American Yoga Association
169
69H69Hhttp://www.americanyogaassociation.org/contents.html General information about yoga, how to choose a qualified teacher and the history of yoga.
International Association of Yoga Therapists 70H70Hhttp://www.iayt.org/ A nice site for those interested in Yoga research and education.
Other sites of interest American Art Therapy Association 71H71Hhttp://www.arttherapy.org/ "Art therapy is based on the belief that the creative process involved in the making of art is healing and life-enhancing."
American Music Therapy Association 72H72Hhttp://www.musictherapy.org/ "Through musical involvement in the therapeutic context, clients' abilities are strengthened and transferred to other areas of their lives."
Journals: Advances in Mind-Body Medicine 73H73Hhttp://www.advancesjournal.com/aj/login/index.jsp Some peer-reviewed monographs
Alternative Medicine Review 74H74Hhttp://www.thorne.com/alternative/alter_main.html Peer-reviewed monographs
Alternative Therapies in Health and Medicine 75H75Hhttp://www.alternative-therapies.com/at/login/index.jsp Peer-reviewed monographs
BMC Complementary and Alternative Medicine 76H76Hhttp://www.pubmedcentral.gov/tocrender.fcgi?action=archive&journal=10 Peer-reviewed monographs
Skeptical Inquirer: The Magazine for Science and Reason 77H77Hhttp://www.csicop.org/ The title says it all. A publication of the Committee for the Scientific Investigation of Claims of the Paranormal.
Consumer Health Digest 78H78Hhttp://www.ncahf.org/digest04/index.html Free weekly e-mail newsletter edited by Stephen Barrett, M.D., and cosponsored by
170
NCAHF and Quackwatch. It summarizes scientific reports and other information relevant to consumer protection and consumer decision-making.
Evidence-based Complementary and Alternative Medicine 79H79Hhttp://ecam.oupjournals.org/ Peer-reviewed monographs
Journal of Alternative and Complementary Medicine: Research on Paradigm, Practice, and Policy 80H80Hhttp://www.liebertpub.com/publication.aspx?pub_id=26 Peer-reviewed monographs
Scientific Review of Alternative Medicine 81H81Hhttp://www.sram.org/ Peer-reviewed monographs
Scientific Review of Mental Health Practice 82H82Hhttp://www.srmhp.org/index.html Peer-reviewed monographs
Townsend Letter for Doctors & Patients 83H83Hhttp://www.townsendletter.com/
Note: All of the listed sites were tested and found to be functional. Please let me know if you have any questions, comments or find any nonworking sites at [email protected]
171
V I T A
T R E N T A . D A V I S PHONE (540) 951-7230 E-MAIL [email protected]
1950 OILWELL ROAD BLACKSBURG, VIRGINIA 24060
EDUCATION
2001 - 2005 Virginia Tech Blacksburg, VA PhD in Counselor Education May, 2005 Dissertation: Counseling and Complementary Therapy: A National
Survey of Counselors’ Experiences.
1997 - 2001 James Madison University Harrisonburg, VAMA/EdS in Community Counseling Psychology 3.975 GPA for 66 credit hours Also completed 28 graduate credits in Computer Science
1985 - 1993 Virginia State University Petersburg, VA BS in Electronic Engineering Technology 3.65 GPA with Distinction
1982 - 1985 John Tyler Community College Chester, VA AAS in Electronic Engineering Technology
3.65 GPA – Magna Cum Laude
TEACHING EXPERIENCE
1996 - 2001 James Madison University Harrisonburg, VA Adjunct Instructor
Taught Lifetime Wellness and Fitness. This general education course addressed the multi-faceted components of personal wellness from a wholistic perspective. Lecture and lab components designed to help students take responsibility for making informed and thoughtful choices in creating a healthy lifestyle.
Taught Road and Mountain Cycling. Responsible for the safety and education of a diverse group of undergraduate students. Emphasis on personal development, as well as, skill building.
1994 - 1998 Virginia Community Colleges Various Locations Adjunct Instructor
Provided instruction for both credit and non-credit computer, engineering, and electronic classes at various community colleges, including: Blue Ridge Community College, Piedmont Virginia Community College, and Dabney S. Lancaster Community College.
172
PROFESSIONAL EXPERIENCE
2004 - Present New River Valley Community Services Blacksburg, VA Outpatient Clinician
Provided individual, group and family counseling, case management, psychoeducation, and crisis intervention services to clients with serious mental illness, substance use disorders, mental retardation and multiple problems. Performed diagnostic evaluations and prepared appropriate treatment plans, employing knowledge of theories of personality, psychology, psychopathology and therapeutic interventions. Interfaced with families/caregivers, and other agencies as necessary. Participated in and coordinated multi-disciplinary/community treatment planning for clients as needed to ensure continuity of care. Maintained community referral network. Maintained accurate chart documentation, including progress notes, treatment plans, and treatment plan reviews, to meet agency, state licensure and third party reimbursement standards. Addressed ethical and legal concerns as they related to outpatient clinical services.
2002 - 2004 Mental Health Association of the New River Valley Counselor Blacksburg, VA
Provided supervised short and long-term pro-bono counseling to uninsured, low to moderate income clients. Conducted individual therapy for clients presenting with a wide variety of issues, including the chronically mentally ill. Involved with community outreach activities such as National Depression Screening Day, suicide prevention, etc.
2002 - Present Virginia Tech Counselor Education Blacksburg, VA Graduate Assistant
Responsible for supervising Masters’ level counselor education students engaged in practicum and internship in both school and community settings. Interfaced as needed with supervisees’ onsite counseling liaisons. Provided one-to-one and triadic supervision to Masters’ students. Responsible for progress and process notes related to professional growth of supervisees. Participated in weekly group supervision-of-supervision meetings. Facilitated a personal growth group of Master’s students. Co-taught Counseling Theories and Internship for Master’s-level counseling students. Provided content and technical support for online courses and activities.
2001 - 2003 Virginia Tech - ADA Office Blacksburg, VA Assistant Grant Coordinator
Conducted research concerning issues facing upper class students with disabilities in higher education as part of a grant sponsored by the for the Virginia Board for People with Disabilities. Grant funded to obtain information about factors that facilitated or were barriers to student success in college from upperclassmen with disabilities. Responsible for
173
all aspects of research project including - coordinating and conducting focus groups at various universities, assimilating and analyzing qualitative data, preparing findings for publication, and presenting results to various stakeholders. Prepared quarterly budget and outcome reports for sponsor. Regularly involved with other outreach activities of ADA office, including College Bound and Real World Day.
2000 - 2002 Augusta Medical Center Fishersville, VA EAP Counselor
Provided supervised individual, couple, and family counseling services to employees of local industries, as well as the medical center as part of 700-hour internship experience in Community Wellness Department. Formulated client assessments and intervention strategies. Facilitated ongoing support groups for recovering medical patients. Taught stress management workshops to EAP clients, patients, and community groups. Originated, developed, and implemented a pilot stress reduction program for medical patients, counseling clients, and the general public; employing various holisitic techniques such as, mindfulness meditation, yoga, and guided imagery, among others.
Fall 1999 James Madison University Harrisonburg, VA Counselor
Provided supervised counseling services to a general undergraduate student population as part of a practicum experience at university counseling center. Assessed client needs, developed intervention plans, and maintained progress notes in client files. Participated in various in-service trainings and process groups.
1994 - 1996 James Madison University Harrisonburg, VA Graduate Assistant
Graduate assistant in University’s Center for Multimedia. Coordinated “House Calls” program which provided one-on-one instruction and support to faculty and staff in various computer technologies.
Graduate assistant in the Department of Computer Science. Assisted with general class duties and taught undergraduate classes as needed.
1994 - Present Private Practioner Blacksburg, VA Massage Therapist/Jin Shin Do Acupressurist
Provided a wide variety of ongoing remedial and preventative therapies to a diverse group of clients. Employed different modalities to suit each individual’s needs and presenting concern. Worked within strict legal and ethical guidelines.
1995 - 2001 Allegheny Outdoor Adventures White Sulfur Spg., WV Adventure Guide
174
Lead corporate and family groups in various outdoor activities, including mountain biking, canoeing, and hiking. Responsible for ensuring the safety and enjoyment of clients in challenging outdoor environments.
1994 - 2001 Private Practioner Harrisonburg, VA Yoga/Stress Management Instructor
Provided Yoga and stress management instruction to many local facilities and organizations, including, but not limited to: Valley Wellness Center, Rockingham Memorial Hospital, State of Virginia and James Madison University. Emphasis on relaxation and centering with an awareness of each individual’s unique experience.
SCHOLARLY CONTRIBUTIONS
Presentations February, 2003, The Role of Complementary and Alternative therapies in
Counseling and Counselor Education, Virginia Counseling Graduate Student Conference, Williamsburg, Va.
March, 2001, The Body in Psychotherapy. Virginia Counseling Graduate Student Conference, Williamsburg, Va.
Presentations related to Virginia Board for People with Disabilities grant - Upper Classmen with Disabilities in Higher Education: Academic Goals, Challenges, Triumphs: October, 2003, DCDT International Conference, Roanoke, VA, July, 2003, National AHEAD Conference, Dallas, TX. March, 2003, Virginia Transition Forum, Roanoke, VA. March 2003, International Dyslexia Association Conference, Richmond, VA. October, 2002, AHEAD in VA Conference, Richmond, VA. September, 2002, Virginia HELP, Richmond, VA.
Publications Reilly, V.J. & Davis, T.A (2005). ADA, 504, and the Office of Civil Rights:
Understanding the Regulatory Environment. In E. E. Getzel & P. H. Wehman (Eds.), Going to College. Brookes Publishing: Baltimore, MD.
Davis, T.A., & Reilly, V.J. (2003). Students see faculty, staff as biggest stumbling blocks to learning. Disability Compliance for Higher Education, 9(2), 1-2.
Davis, T.A., & Reilly, V.J. (2003). Upper Classmen with Disabilities in Higher Education: Academic Goals, Challenges, Triumphs. Manuscript under review.
Davis, T.A. (2002). The Role of Personal Therapy in the Training of Counselors. Manuscript under review.
Created and disseminated brochures summarizing Virginia Board for People with Disabilities Research Findings to Parent Resource Centers and other agencies throughout Virginia.
175
PROFESSIONAL MEMBERSHIPS AND AWARDS
American Counseling Association Chi Sigma Iota Honor Society Mental Health Association of the New River Valley, Rising Star Award,
2002 & 2003. United States Association for Body Psychotherapy Nationally Certified in Therapeautic Massage and Bodywork since 1994.
Recommended