EN EN
EUROPEAN COMMISSION
Brussels, 30.5.2012
SWD(2012) 320 final
COMMISSION STAFF WORKING DOCUMENT
Assessment of the 2012 national reform programme and convergence programme for
LATVIA
Accompanying the document
Recommendation for a
COUNCIL RECOMMENDATION
on Latvia's 2012 national reform programme and delivering a Council opinion on
Latvia's convergence programme, 2012-2015
{COM(2012) 320 final}
2
CONTENTS
1. INTRODUCTION ........................................................................................................... 4
2. ECONOMIC DEVELOPMENTS AND CHALLENGES .............................................. 4
2.1.Recent economic developments and outlook ........................................................ 4
2.2. Challenges ............................................................................................................ 5
3. ASSESSMENT OF THE POLICY AGENDA ............................................................... 7
3.1. Fiscal policy and taxation ..................................................................................... 7
3.2. Financial sector ................................................................................................... 11
3.3. Labour market, education and social policies .................................................... 12
3.4. Structural measures promoting growth and competitiveness ............................. 15
3.5. Modernisation of public administration ............................................................. 20
4. OVERVIEW TABLE .................................................................................................... 23
ANNEX ............................................................................................................................. 26
3
EXECUTIVE SUMMARY
After a strong rebound in 2011, Latvia's GDP growth is expected to decelerate to 2.2% in
2012. The rate of unemployment dropped substantially in 2011 and is expected to
decrease further to 14.8% in 2012 but youth and long-term unemployment rates remain
high.
The government has ensured financial stability and fiscal consolidation by over-
achieving its fiscal targets. In 2012, the general government deficit is expected to
decrease to 2.1% of GDP. In other areas, however, reform efforts have been limited,
particularly as regards the public administration and the unified wage grid, management
of state owned assets, strengthening of the competition framework, setting up of the
Development Bank and outlining proposals for managing the EU funds in the new
financing period.
Latvia continues to face important policy challenges: building on the significant progress
made regarding public finances, further fiscal consolidation is necessary to meet the
medium-term objective to maintain market confidence. Latvia has one of the highest
long-term and youth unemployment rates in the EU. There is a relatively high tax wedge
on low-wage earners and a high level of undeclared work. A high share of the population
is at risk of poverty or social exclusion. The coverage of unemployment benefits is low
and the impact of social transfers on poverty reduction is small. Inefficiencies in the civil
justice system have a negative impact on the business environment. The education and
training systems are not adapted to labour market needs and not geared to improving
Latvia’s innovation performance. Improving energy efficiency, in particular of the
building stock, would contribute to growth and jobs, while reducing energy dependence.
4
1. INTRODUCTION
Procedural aspects
In July 2011 the Council of the European Union adopted only one country-specific
recommendation for Latvia: implement the balance of payments programme conditions.
In November 2011 the Annual Growth Survey for 2012 (AGS 2012) presented the basis
for building the necessary common understanding about the priorities for action at
national and EU levels in 2012. It focused on five priorities — ensuring growth-friendly
fiscal consolidation, restoring normal lending to the economy, promoting growth and
competitiveness, tackling unemployment and social consequences of the crisis, and
modernising public administration — and encouraged Member States to implement them
in the 2012 European Semester.
Against this background, Latvia presented its national reform programme and
convergence programme in April 2012. The documents outline the fiscal consolidation
efforts in a consistent manner, based on medium-term macroeconomic projections and
key structural reforms. The national reform programme evaluates the progress made
towards meeting the national targets for employment, R&D, education, energy and
climate change, and poverty reduction for 2020. It also describes the measures Latvia
plans to take under the Euro Plus Pact.
This Staff Working Document assesses the state of implementation of the balance of
payments programme condition, as expressed in the latest Supplemental Memorandum of
Understanding, identifies current policy challenges and, in this light, examines the
country’s latest policy plans.
Overall assessment
Overall, the policy plans submitted by Latvia are adequate, but in some areas they lack
the ambition to address the challenges in a comprehensive way. The most pressing
challenges facing Latvia are to continue growth-friendly fiscal consolidation and
implement wide-ranging structural reforms to achieve sustainable growth and catch up
with other EU countries. In particular, strong implementation of the conditions outlined
in the latest Supplemental Memorandum of Understanding will be important, inter alia in
the fields of energy markets and energy efficiency, higher education and vocational
training, management of state-owned enterprises, public administration and the judicial
system, competition and public procurement policies, restructuring and sales of state-
owned banks and management of EU funds.
2. ECONOMIC DEVELOPMENTS AND CHALLENGES
2.1.Recent economic developments and outlook
Recent developments
After a severe economic contraction in 2008-09, the Latvian economy started to grow
again towards the end of 2010 and switched to a rapid recovery in 2011. The economy
expanded by 5.5 % in 2011 driven mainly by exports and investments and was quite
resilient to the adverse external demand shocks in the second half of the year. At the
beginning of 2012, industrial production, retail trade and transport services were also
performing relatively well, indicating some decoupling from the weak performance in
many EU Member States. The economic sentiment indicator rebounded to a four-year
high at the beginning of 2012 with improvements recorded in both the household and
corporate sectors. Unemployment remains among the highest in the EU after
deteriorating to about 20 % at the beginning of 2010 from 6-7 % in the pre-crisis period.
5
However, the unemployment rate dropped substantially to 16.1 % in 2011 and 15.0 % in
the last quarter of the year. The harmonised index of consumer prices (HICP) inflation
was in line with expectations at 4.2 % in 2011, including a large contribution from the
increase in VAT rates. The constant-tax price index is estimated at 2.7 % in 2011.
The current account balance turned to a deficit of 1.2 % of GDP in 2011 after surpluses in
2009 and 2010. The country remained in a net lender position, however, as the net
inflows in the capital account reached 2.1 % of GDP. The rebalancing of the economy
towards tradable sectors continued at a fast pace as the share of exports in GDP expanded
to 59 % in 2011 from 54 % in 2010. The net inflows of foreign direct investments
rebounded substantially in 2011 while the share of external debt to GDP decreased
further.
Outlook
The Commission spring forecast projects that Latvia’s growth rate will slow down to
2.2 % in 2012 due to weakening external demand in the first half of the year combined
with some downward correction of the consumption propensity of households as a result
of global economic uncertainties. However, in line with the expected improvement in
external demand, growth is set to regain momentum in the second half of 2012 and to
accelerate to 3.6 % in 2013. Unemployment is expected to decrease further in 2012-13
though at a relatively weak pace set by slower economic growth. Inflation is projected to
decelerate to 2.6 % in 2012 and 2.1 % in 2013 as the impact of the tax increases in 2011
weakens substantially. Uncertainties about prices of primary energy resources pose a
significant risk to the inflation forecast, as the country depends heavily on energy
imports.
Both the national reform programme and the convergence programme share the same
economic outlook, but neither of them gives any figures on the impact of the proposed
structural reforms on growth. The economic growth outlook for 2012-13 is broadly in
line with the most recent Commission forecast. In 2014-15, the annual growth rate is
expected to accelerate to 4 %, which is seen as the medium-term potential growth in the
country. This rate remains unchanged from the projections presented in the 2011
programmes but could be subject to slight downside risks as the results of the 2011
census show a faster decline in the population than previously estimated.
2.2. Challenges
Although growth has resumed after the financial crisis, Latvia should speed up its
reforms to improve growth potential. In particular, Latvia has amongst the highest long-
term and youth unemployment rates in the EU. This, along with the relatively high tax
wedge on low wage earners and the high level of undeclared work, indicates a need for
appropriate labour market policies, a review of the tax and benefit system and greater
efforts to tackle the grey economy (e.g. without effective activation and support
measures, the marginal tax rate for low-earners will remain discouragingly high,
increasing both unemployment and poverty). The high share of the population at risk of
poverty or social exclusion is also a cause for concern: families with children and the
unemployed are particularly affected. The coverage of unemployment benefits is low and
the impact of social transfers on poverty reduction is small. Ensuring an effective system
of social assistance to protect the most vulnerable while maintaining incentives to work
remains a challenge.
Despite relatively good overall educational attainment, the quality of tertiary and
vocational education remains a cause for concern. There is evidence of skills mismatches
6
on the labour market, including an insufficient number of graduates in science and
technical subjects. There is also a low degree of employment in knowledge-intensive
activities. More efforts to implement the necessary reforms in higher and vocational
education (in line with the commitment made in the Supplemental Memorandum of
Understanding) would help to adapt education and training systems further to labour
market needs. Latvia’s poor innovation performance impairs its competitiveness and the
country has no systematic and effective research and innovation policy. There is little
R&D investment by domestic companies or large foreign affiliates to support
specialisation in knowledge-intensive and innovation-driven sectors.
Completing the restructuring and sales of the three state-owned banks — Parex, Citadele
and MLB — to comply with the Commission’s state aid decisions is the most pressing
issue in the field of financial stability. Consistent implementation of the plans for these
banks would further increase confidence in the financial sector and allow the public
sector to withdraw from commercial activities. The 2011 Latvian Competitiveness
Report also highlights the underdeveloped financial markets as one of the main
weaknesses of the economy.
Regional economic disparities have widened, mostly due to the rapid growth of the
capital Riga. Regional problems are most acute in the eastern parts of the country, which
have particularly low levels of investment per capita, relatively few enterprises and very
high unemployment rates. Disparities are widening due to an increasing urban/rural
divide, triggered largely by migration to Riga from rural areas and other cities.
The poor overall condition of transport infrastructure is undermining the growth and
competitiveness of the country. Significant differences also exist in the development of
ICT infrastructure and expansion of broadband connections between urban and rural
areas.
Isolation from the EU gas and electricity markets and low energy efficiency are key
challenges facing Latvia. One centrepiece could be to improve significantly the energy
efficiency of the building stock, thereby contributing to growth and jobs, while reducing
energy dependence. Low energy efficiency is also a challenge for the transport sector.
Further environmental challenges lie in the water and wastewater treatment sectors and
waste management, with landfills remaining the main option for disposal of municipal
waste (around 90 %).
Progress with reforming management of both state-owned enterprises and public real
estate will require a sharp focus. The new state-owned enterprises governance model is
supposed to be in place by the end of March 2013, while action is still needed to adopt a
special law on management of state-owned enterprises, to transfer assets under the new
state-owned enterprises management authority and to give the centralised state-owned
enterprises manager appropriate capacity. Further centralisation of public real estate
management under the Finance Ministry and divestments of assets not used for public
needs are planned.
Progress is expected in the next few months on a number of key conditions included in
the latest Supplemental Memorandum of Understanding: preparing a strategy for
management of human resources, implementing energy-related EU legislation,
strengthening energy efficiency programmes, making amendments to the Public
Procurement Law, improving the quality assurance system for roadbuilding, reviewing
the port management and taxation system, adopting a Construction Law, etc.
7
Given the notable impact of EU cohesion funds on the economy, creating the conditions
for effective support and reinforcing strategic programming of funds for 2014-2020 will
be important in order to deliver on the Europe 2020 priorities.
Inefficiencies in the civil justice system have a negative impact on business and the
economic environment, as they increase the risk and cost of doing business. There is a
large backlog of civil and commercial cases before the first- and second-instance courts,
together with excessively long procedures. There are still weaknesses in the insolvency
law. The professional performance and accountability of judges are not always up to
standard. Training of both judges and prosecutors is not sufficient to ensure that they
have the appropriate qualifications.
3. ASSESSMENT OF THE POLICY AGENDA
3.1. Fiscal policy and taxation
The main goal of the medium-term budgetary strategy of the 2012 convergence
programme is to secure correction of the excessive deficit situation by the deadline
recommended by the Council (2012) and subsequently to approach the medium-term
objective (MTO), which has been revised to a more ambitious target of a structural
deficit of 0.5 % of GDP. Under the convergence programme strategy, the headline
general government balance will reach a near-balanced position in 2015. The adjustment
is front-loaded, with greater improvement in the structural deficit in 2012-2013 than in
2014-2015.
Budgetary developments and debt dynamics
As a result of the ambitious front-loaded fiscal consolidation implemented since 2009
and of the faster-than-expected recovery in growth, Latvia’s general government position
improved strongly in 2011, reaching a deficit of 3.5 % of GDP, which is considerably
better than both the initial deficit target set under the balance-of-payments assistance
programme (deficit of no more than 6 % of GDP) and the target of a deficit of no more
than 4.5 % of GDP in the 2011 convergence programme. This was achieved thanks to
stronger-than-expected economic recovery and lower exceptional costs related to the
restructuring of the banking sector. Moreover, while tax revenue as a share of GDP was
broadly in line with expectations in the previous programme, several expenditure
categories not related to absorption of EU funds (notably social benefits) were kept under
tight control, leading to a reduction in their share in GDP.
The programme expects the general government headline deficit to decline further to
2.1 % of GDP in 2012, which is in line with the projections in the Commission spring
2012 forecast and better than the target of a deficit of 2.5 % of GDP in the previous
programme. The macroeconomic scenario underpinning these projections is broadly in
line with Commission projections; however, the most recent information (notably the
estimate of economic growth in the first quarter of 2012) indicates that this scenario can
be considered as cautious. According to estimates in the programme, measures in the
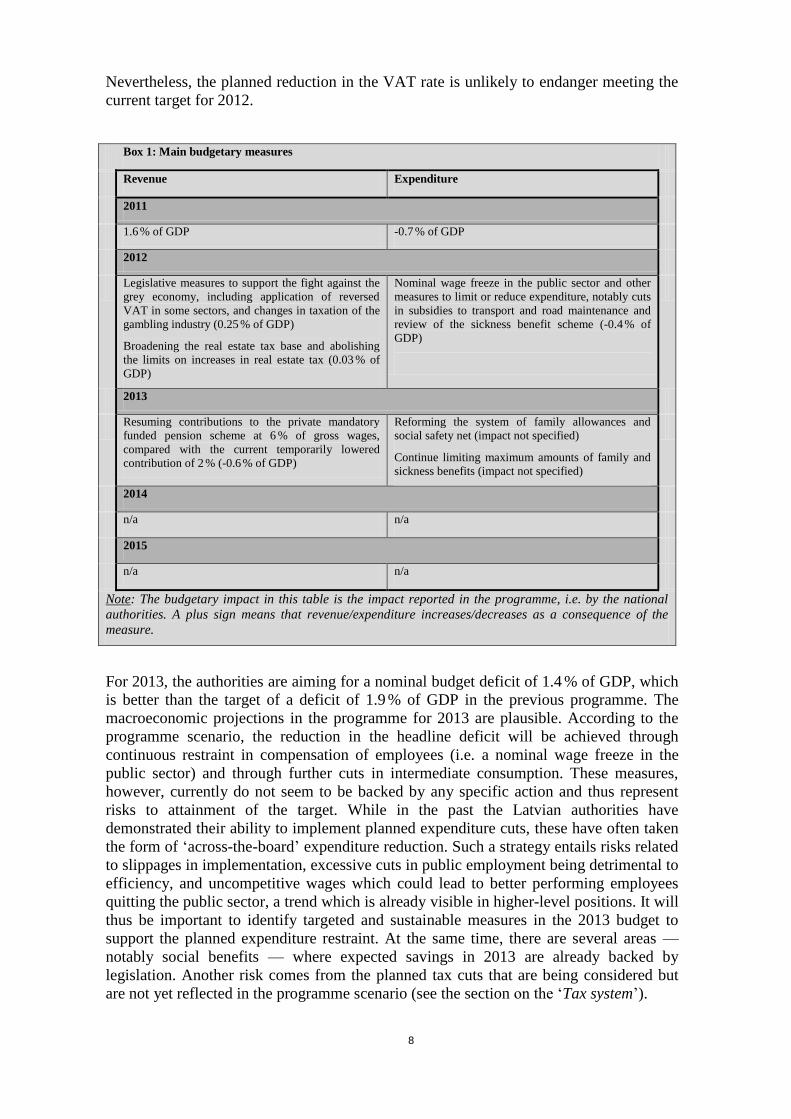
2012 budget law to improve the budgetary position add up to 0.7 % of GDP (see Box 1).
The budget law was adopted by the Saema (Parliament) on 15 December 2011. The
programme thus aims to bring the excessive deficit below the 3 % reference value —
with sizeable leeway against adverse developments — by the date recommended by the
Council. Risks to fiscal projections for 2012 stemming from the macroeconomic scenario
seem on the upside, taking into account the most recent information. However, the
programme acknowledges that consideration is being given to reducing the VAT rate; the
letter accompanying the programme, along with recent public information, suggest that
this will take place in 2012 already (see also the section on the ‘Tax system’).
8
Nevertheless, the planned reduction in the VAT rate is unlikely to endanger meeting the
current target for 2012.
Box 1: Main budgetary measures
Revenue Expenditure
2011
1.6 % of GDP -0.7 % of GDP
2012
Legislative measures to support the fight against the
grey economy, including application of reversed
VAT in some sectors, and changes in taxation of the
gambling industry (0.25 % of GDP)
Broadening the real estate tax base and abolishing
the limits on increases in real estate tax (0.03 % of
GDP)
Nominal wage freeze in the public sector and other
measures to limit or reduce expenditure, notably cuts
in subsidies to transport and road maintenance and
review of the sickness benefit scheme (-0.4 % of
GDP)
2013
Resuming contributions to the private mandatory
funded pension scheme at 6 % of gross wages,
compared with the current temporarily lowered
contribution of 2 % (-0.6 % of GDP)
Reforming the system of family allowances and
social safety net (impact not specified)
Continue limiting maximum amounts of family and
sickness benefits (impact not specified)
2014
n/a n/a
2015
n/a n/a
Note: The budgetary impact in this table is the impact reported in the programme, i.e. by the national
authorities. A plus sign means that revenue/expenditure increases/decreases as a consequence of the
measure.
For 2013, the authorities are aiming for a nominal budget deficit of 1.4 % of GDP, which
is better than the target of a deficit of 1.9 % of GDP in the previous programme. The
macroeconomic projections in the programme for 2013 are plausible. According to the
programme scenario, the reduction in the headline deficit will be achieved through
continuous restraint in compensation of employees (i.e. a nominal wage freeze in the
public sector) and through further cuts in intermediate consumption. These measures,
however, currently do not seem to be backed by any specific action and thus represent
risks to attainment of the target. While in the past the Latvian authorities have
demonstrated their ability to implement planned expenditure cuts, these have often taken
the form of ‘across-the-board’ expenditure reduction. Such a strategy entails risks related
to slippages in implementation, excessive cuts in public employment being detrimental to
efficiency, and uncompetitive wages which could lead to better performing employees
quitting the public sector, a trend which is already visible in higher-level positions. It will
thus be important to identify targeted and sustainable measures in the 2013 budget to
support the planned expenditure restraint. At the same time, there are several areas —
notably social benefits — where expected savings in 2013 are already backed by
legislation. Another risk comes from the planned tax cuts that are being considered but
are not yet reflected in the programme scenario (see the section on the ‘Tax system’).
9
The structural balance1 is expected to improve by ¼% of GDP in 2013 (compared with
an improvement of ½% based on estimates in the Commission spring 2012 forecast),
taking the structural deficit to below 1 % of GDP, according to the information in the
programme.2 These projections take into account the negative impact on both the nominal
and (recalculated) structural balance of restoring contributions to the mandatory funded
private pension scheme to 6 % of gross wages from 2013, compared with the current
reduced level of 2 %. In the Commission estimates, the current lower level of
contributions is treated as a temporary measure excluded from the structural balance.
Thus its reversal in 2013 will affect only the nominal but not the structural balance. The
impact of this reversal on the 2013 nominal balance is, however, assessed to be higher in
the Commission’s projections than in the programme’s estimates, posing another risk to
attainment of the target.
Latvia’s medium-term budgetary objective has been revised in the 2012 convergence
programme. The new medium-term objective of a structural deficit of 0.5 % of GDP is
higher than the previous figure and adequately reflects the requirements of the Stability
and Growth Pact. The revision of the medium-term objective is linked to a major reform
of fiscal governance in Latvia which is discussed in more detail below.
In 2014 and 2015, the programme aims for a continuous improvement in the nominal
balance, reaching a near-balanced position in 2015. The targeted improvement comes
from continuing restraint in government consumption. Thus risks applicable in 2013 will
remain relevant. Planned tax cuts pose another risk. According to the programme, the
structural deficit will approach the medium-term objective by the end of the programme
period in 2015.
Based on the information provided in Tables 2a, 2b and 2c in the Annex to the
programme, the expenditure benchmark is set to be met in all the years following
correction of the excessive deficit (i.e. 2013-2015). However, taking into account the
discretionary impact on revenue of restoring contributions to the mandatory funded pillar
to 6 % of gross wages (included in Table 7.8 of the programme, but not reflected in Table
2b), the expenditure benchmark would be missed, albeit only narrowly, in 2013. Taking
the Commission estimate of the discretionary impact, the deviation in 2013 would be
somewhat higher. However, in both cases the average deviation in 2012 and 2013 would
remain negative, given the substantial front-loaded expenditure restraint in 2012. In the
outer years of the programme the planned expenditure restraint would ensure that
expenditure growth remains significantly negative, and hence in line with the expenditure
benchmark in the Stability and Growth Pact.
In the programme scenario the general government debt is projected to increase from
42.6 % of GDP in 2011 to 46.7 % in 2014, falling thereafter rapidly to 38.9 % of GDP in
2015. This profile reflects accumulation of financial assets in anticipation of large
repayments of loans under the financial assistance programme (as evidenced by high
stock-flow adjustment in 2012-2014) and the subsequent repayment of a large share of
these loans in 2014-2015. In June 2011, the authorities successfully returned to
international financial markets and a second major international bond issue took place in
1 Cyclically-adjusted balance net of one-off and temporary measures, recalculated by the Commission
on the basis of the information provided in the programme, using the commonly agreed methodology. 2 Compared with the recalculated structural balance, the programme forecasts higher structural
budgetary improvement, by 0.5 % of GDP annually in 2013-2015. The discrepancy is mainly due to a
different assessment of the starting cyclical point between the common methodology and the approach
taken in the programme. Subsequently, the programme attributes a higher share of the targeted
nominal improvement to the structural component than in the recalculated information.
10
February 2012. All major credit-rating agencies have revised Latvia’s sovereign ratings
to the investment grade. The latest upgrade took place in May 2012.
Long-term sustainability
Assuming no policy change, debt would stand at 42.7 % of GDP by 2020. Ensuring
continued sufficient primary surpluses over the medium term, as planned in the
programme, would further improve the sustainability of public finances.
Fiscal framework
The current fiscal framework in Latvia lacks an effective mechanism to limit expenditure
growth in good economic times. In particular, there are no fiscal rules at central
government level that could impose a binding constraint on the annual budgetary
process. Recognising the need to develop a multi-annual and rules-based budgetary
framework that would minimise the risk of pro-cyclical fiscal loosening in the new
growth phase, in November 2011 the Latvian government adopted the draft Fiscal
Discipline Law, which is currently being scrutinised by Parliament. The draft law is in
line with the commitments made by the Latvian government under the balance of
payments programme and seeks to implement the evolving EU acquis in the area of
fiscal governance in Latvia’s legislation. The authorities also intend to pass constitutional
amendments to enhance the legal standing of the law.
Once implemented, the new law would considerably strengthen the fiscal framework in
Latvia. The current draft clearly lays down: the principles of a counter-cyclical fiscal
policy; a balanced budget rule as an instrument for a sustainable and counter-cyclical
policy; a debt rule; transitional provisions, including consistency with the Stability and
Growth Pact; escape clauses; the requirement to publish a report in case of deviations
from the target; and regular monitoring and reporting requirements to ensure compliance
with the fiscal rules. Once the Fiscal Discipline Law is adopted, the authorities also plan
to adopt the medium-term budget framework law, setting binding expenditure ceilings
for 2+1 years on a rolling basis.
Tax system
Latvia has one of the lowest tax-to-GDP ratios in the EU, at 27.8 % of GDP in 2011. The
tax system relies relatively heavily on consumption taxes, compared with other EU
states, although labour taxes (in particular, social contributions) still form the largest tax
revenue category. The taxation framework can be considered growth-friendly, although
the high tax wedge on low wage earners requires some attention. The government plans
to shift taxation further from labour to other sources. The overall tax system shows a low
degree of progressivity.
The government plans to lower the tax burden on labour substantially — by about nine
percentage points in the long run according to the programme. The Parliament recently
approved in the first reading a bill to reduce value added tax rate (from 22% to 21% as of
1 July 2012) and the personal income tax rate (from 25% to 20% over the three-year
period starting from 2013). The tax cuts were not accompanied by measures to improve
the structural balance. The reduced VAT rate runs contrary to the strategy of shifting the
burden of taxation to other sources and limits further opportunities to reduce taxes on
labour. Even though the NRP mentions tax policy as one of the main instruments to
tackle poverty and foresees several measures (increasing non-taxable PIT threshold,
increasing tax reliefs for dependants or introducing progressive income taxes), these
considerations were not reflected in the recent tax changes.
The sizeable fiscal consolidation that took place in 2009-2012 helped to adjust public
finances to a more sustainable growth pattern. Over half of the consolidation effort,
11
which was equivalent to 17 % of GDP over these years (albeit coming after a period of
unsustainable growth of public spending prior to 2009), took place on the expenditure
side. These cuts took the form, in particular, of downsizing government expenditure by
implementing large-scale reforms in health and education along with the territorial
administrative reform. On the revenue side, although tax rates increased in almost all tax
categories during the period of fiscal consolidation in 2009-2012, the biggest increase
was in consumption taxes. The consolidation thus supported growth in the medium term,
since to a large extent it took the form of the least harmful measures — cuts in
government consumption and increases in consumption taxes.
The full benefit of the significant increases in consumption tax introduced between 2009
and 20123 did not materialise, however, as they were accompanied by growth in the share
of the informal economy, as demonstrated by an increase in the VAT compliance gap4
from 16 % in 2007 to 47 % in 2011. Recent studies5 suggest that the informal economy is
considerably larger in Latvia than in peer group countries and is concentrated in sectors
like construction, services and retail. Part of the reason for engaging in informal
economic activities stems from dissatisfaction with the taxation system and with
government spending as well as poor law enforcement. The ‘Doing Business 2011’
report ranks Latvia the lowest of the three Baltic countries in the category ‘paying taxes’.
This is due to time-consuming tax compliance procedures (on average it takes 293 hours
to comply with tax administration requirements), whereas the number of taxes and the
tax rate in relation to profits score favourably.
The government is stepping up the efforts to combat the informal economy. After several
initial delays, the Action Plan to Combat the Shadow Economy is now being
implemented and several legislative measures (e.g. application of reverse VAT in sectors
prone to undeclared activity) have entered into force from 2012. Moreover, the Law on
Individual Declaration of Property and Reporting of Undeclared Income was adopted
recently with effect from June 2012. It introduces the possibility to legalise previously
undeclared taxable income and aims to improve oversight over an individual’s financial
position, in particular the accuracy of expenses incurred and the payment of taxes and the
legality of income derived. However, the results of the strategy will not be visible until
the medium term and the impact is difficult to quantify.
Environmental taxes remain relatively underdeveloped and are heavily dominated by
motor fuel taxation, whereas taxation of other energy sources, pollution and use of
natural resources is below the EU average, sometimes significantly so, even though taxes
on disposal of municipal, construction and industrial waste increased considerably in
2009. Nevertheless, further broadening the tax base to other sources of environmental
taxation, in particular on pollution, combined with broader-based taxation of energy
sources would help to achieve environmental goals while providing room for a shift
away from taxation of labour.
3.2. Financial sector
Financial stability
3 In particular, an increase in the standard VAT rate from 19 % to 22 % and in the reduced rate to 12 %
while significantly narrowing the scope of the reduced rate, but also numerous excise tax increases. 4 The VAT compliance gap measures the ratio between VAT actually collected to theoretically possible
collection, based on the value of private consumption taking into account the existence of preferential
rates. While the gap is likely to reflect the illegal tax avoidance, it could also mirror other aspects like
a shift in consumption preferences towards goods with lower rates and/or recourse to legal means of
tax avoidance. 5 See Sauka, A. and Putniņš, T. (2011), Shadow Economy Index for the Baltic Countries 2009 and 2010,
Stockholm School of Economics in Riga, May 2011.
12
In the banking sector, both solvency and liquidity risks have abated substantially. Despite
a delayed return to profitability, continued capital support from parent institutions and
from government for two state-owned banks (Parex Bank, the second largest bank prior
to the crisis, and the Mortgage and Land Bank (MLB)) kept capital adequacy ratios
comfortable at 15 % on average at the end of 2011. The deterioration of the loan quality
has come to an end, as the proportion of non-performing loans (overdue by more than 90
days) peaked at 19.4 % in July 2010 before declining to 18.4 % in 2011. In the framework
of the international financial assistance, banking supervision and regulation have been
tightened (capital, liquidity and reporting requirements) and cooperation with foreign
supervisors improved.
The restructuring and sales of the three state-owned banks — Parex, Citadele and MLB
— to comply with the Commission’s state aid decisions are the most pressing issues in
the field of financial stability. The strategy for the work-out and sale of the assets of
Parex Bank and Citadele Bank, taking into account possible market interest, state aid-
related issues and any pending legal challenges, is being implemented. MLB’s
divestment of commercial assets to form the basis for a real development bank is well
under way.
To assess clients’ creditworthiness and lending risks better, the authorities, in
consultation with experts, are making legislative changes to increase transparency and
regulated access by operators in the financial sector to wider information on individuals’
solvency situation (e.g. the online State Revenue Service and State Social Security
Agency data or the reports of state- and municipality-owned companies on individuals’
payment discipline).
The policy agenda is not sufficiently focused on surveillance of the non-resident banking
sector, especially in view of the experience of Parex Bank and Latvijas Krajbanka.
Regulatory and supervisory measures, as illustrated in the case of Krajbanka, have not
fully covered possible risks associated with this particular sector.
Access to finance
Access to finance is a challenge and the cost of capital is relatively high, hindering both
debt and equity financing. Information disclosure, corporate governance and
entrepreneurial culture would need to be improved to allow greater access to financing.
Most of the support programmes available for SMEs and start-ups, financed mostly from
EU structural funds, are rather fragmented and lack coherence; the programmes offering
loans and guarantees for the manufacturing industry as well as the microcredit
programme for SMEs have had moderate success. Only a small part of the available
venture capital funds (seed and start-up financing for SMEs and microenterprises) have
been invested so far. Consolidation of various state support programmes is planned, with
the creation of a Financial Development Institution (in line with the commitment made in
the Supplemental Memorandum of Understanding).
Given the problems with access to credit financing and equity capital and the need to
increase knowledge transfer, there is room for improving promotion of Latvian SMEs
among potential foreign investors. Ongoing measures and coordination to attract foreign
investment are being re-assessed in line with effectiveness criteria and in view of the
strong competition from the other Baltic countries and Poland.
3.3. Labour market, education and social policies
Labour market policies
The labour market is slowly recovering from the effects of recession, but the employment
levels are still far below the pre-crisis levels and the unemployment rate is among the
13
highest in Europe. High long-term unemployment (7.4 % of the active population) and
youth unemployment (26.3 %) are the most serious legacies of the crisis. Most of the
young unemployed have no professional qualifications (only basic or general secondary
education), partly due to the fact that the vocational education and training system and
curricula are generally considered weak and unattractive. Together with the high
inactivity rate and emigration, these issues pose threats to future labour supply. The level
of early school leaving is relatively high.
To tackle unemployment, the government reallocated some structural funds financing for
active labour market policies in 2011. However, activation of unemployed is still among
the lowest in the EU. In previous years, active labour market policies were financed
almost exclusively by the European Social Fund. However, its financing will be
exhausted soon and no national financing is planned. Consequently, the funding and
activation of the unemployed for 2012-2013 have decreased compared with 2010-2011
and are insufficient given the challenges on the labour market. Due to the low social
protection of the unemployed, the active labour market policies are also performing the
role of a social safety net, as the public works programme and training grants are a
significant source of income for the unemployed. This dual role of the active labour
market policies limits the resources available for genuine activation measures and
decreases their efficiency.
Efforts have been made to improve the effectiveness of active labour market policies
(e.g. planned introduction of profiling, evaluations of active labour market policies,
monitoring and assessment system of training providers, activation measures in the
public works programme, planned measures to facilitate regional mobility, etc.).
However, active labour market policies could still be made more effective, in particular
by making training more relevant to labour market needs, simplifying and increasing the
choice within the training voucher system, providing effective counselling and job-search
assistance, increasing the efficiency of the wage subsidy and on-the-job training
programmes, introducing safeguards to prevent abuse, keeping programmes attractive for
employers, setting clear goals for the programmes and promoting the self-employment
and business start-up programmes managed by MLB and the State Employment Agency.
To increase the employment rates, the government plans to lower taxes on labour,
improve the effectiveness of active labour market policies and stimulate demand for
labour (measures to support entrepreneurship) and support for regional mobility.
To tackle youth unemployment, specially designed active labour market policies targeted
at youth have been implemented: a 1-1.5-year short-cycle vocational education and
training programme, ‘job trials’ in vocational schools, voluntary work and wage
subsidies for young workers. However, given the scale of the problem, these limited
activities have a relatively small impact. Insufficient efforts and financing are directed
towards bringing unemployed youths with no professional qualifications back into
education. Cooperation between the Education Ministry and municipalities to improve
career guidance and social services for 15- to 19-year olds is also weak.
Following the European Council of 30 January 2012, the Latvian authorities together
with the Commission examined possible action to reduce youth unemployment,
including through refocusing structural funds, the government plans to tackle youth
unemployment through twelve measures. Most proposals focus on using existing
measures and the available national and EU funding allocations. In some cases it is
proposed to adjust measures and sharpen the focus on youth: for example, an additional
300 training vouchers targeted specifically at youth. Only two measures —
modernisation of vocational education and training infrastructure and the additional 2 000
short-term vocational education stipends — envisage additional funding through over-
14
commitments. In view of the extent of the problem these measures will not be sufficient
to make a significant impact.
Social policies
During the last three years the income inequality and relative poverty rates have been on
a downtrend trend, but they are still among the highest in the EU. Severe material
deprivation has increased considerably over the same period. In 2011, 40 % of the
population were at risk of poverty or social exclusion. This is not only a major social
problem, but also has implications for the employability of the workforce and future
growth prospects. Families with children and unemployed are at a particularly high risk
of poverty. The coverage of unemployment benefits is low — around one quarter of the
unemployed are entitled and the entitlement rules have been tightened with effect from
2012. Child poverty affects not only children living in jobless households but also
households with high work intensity. Social transfers have little impact on reducing child
poverty. Older people are the only group of the population who benefited from
improvements in the poverty rate during the crisis. However, the pension indexation has
been frozen until the end of 2013, while wage growth and inflation are projected to be
relatively high. Consequently, the at-risk-of-poverty rate amongst older people is likely
to increase again in 2012-2013.
While social protection expenditure as a share of GDP increased during the crisis
(automatic stabiliser effect), Latvia spends relatively little on social protection and social
transfers have little impact on poverty reduction, as a large share of them are
redistributed back to middle- and high-income earners. Spending on means-tested
benefits is low and the active labour market policies grants are partly performing the role
of a social safety net. The design of social assistance benefits also contains poverty and
unemployment traps and there are concerns about benefit targeting, adequacy and
insufficient activation of the benefit recipients. Large inequalities exist in access to social
assistance across local governments. Poor transparency, lack of effective data
management and monitoring systems, and lack of research in this area complicate
evidence-based decision-making (in line with the condition set in the Supplemental
Memorandum of Understanding, the World Bank will undertake a comprehensive social
assistance study in 2012-2013).
Government policies to reduce poverty are concentrating on reducing income inequality,
lightening the tax burden on working families and increasing access to the labour market.
The government has decided to continue in 2012 most of the measures in the Emergency
Social Safety Net Strategy. The main components are the public works programme for
the unemployed, an increase in the guaranteed minimum income (50 % co-financed from
central government), free healthcare for the poor, central government co-financing for
housing benefits (to be phased out in April 2012) and transport compensation for
vulnerable groups.
The effects of an ageing population and emigration will appear soon, posing serious
challenges to the future sustainability and adequacy of the pension system. Several
reforms have been introduced in line with the conditions set in the Supplemental
Memorandum of Understanding: retirement and early retirement age limits will be
gradually increased from 2014 on, the minimum insurance period will be raised from 10
to 15 years and the pension indexation will remain frozen until the end of 2013
(consumer price index-linking will be introduced afterwards). Also, the contribution rates
to the mandatory funded pension scheme are to be restored from 2 % to 6 % in January
2013 (in line with the commitment made in the Supplemental Memorandum of
Understanding). The national reform programme mentions plans to increase the
retirement age as of 2014.

15
Education and lifelong learning
Education and training budgets suffered significant cuts during the crisis and measures
are being taken to ensure cost-efficiency: for example, the general education school
network has been consolidated and the ‘money follows pupil’ funding model introduced.
Funding from the EU structural funds has been invested in developing specialised
vocational schools, modernising higher education and creating competence centres.
Despite the relatively high educational attainment (tertiary attainment rates improved
significantly from 18.6 % in 2000 to 32.3 % in 2010 and have almost reached the EU
average), a significant share of the workforce have no professional qualifications and
limited access to quality education, especially higher education. Universities perform
poorly in worldwide rankings (also compared with other Baltic countries). Higher
education suffers from low international competitiveness (low share of international
students, publications and international lecturers) and weak cooperation between
universities and businesses. The share of mathematics, science and technology graduates
is the lowest in the EU. There are concerns about decision-making and governance in
higher education institutions. One of the main measures implemented in higher education
is a large-scale assessment of study programmes that will form the basis for future
decisions. Performance-based financing is not expected to be introduced before 2013.
The share of students enrolled in vocational education and training is among the lowest
in Europe. The challenge remains to improve the quality, effectiveness and attractiveness
of vocational education and training, including providing modern material and technical
bases in vocational education and training institutions, adapting curricula to match labour
market needs better and promoting quality apprenticeships. Delays are reported in
implementation of the measure funded by the European Regional Development Fund on
‘Vocational education infrastructure’, putting at some risk the end of 2015 deadline for
completing the programme. Additional resources (more than EUR 44 million) to fulfil
the initial programme goals are to be found within the current Operational Programme.
Targeted measures to bring early school leavers back into education are missing. More
support for poor families with children in vocational or general education institutions,
coupled with more budget places and scholarships and wider availability of student loans
in universities, would be one way to reverse this trend.
Participation in lifelong learning is also low. There has been little progress on
implementing the strategy and the quality and effectiveness of the existing schemes
should be improved, especially by increasing their relevance to labour market needs.
Since enterprises are not active in training their staff, support for companies providing
training for their employees could be considered.
The government has planned a number of measures to make vocational education and
training more attractive, such as modernisation of infrastructure and equipment,
development of modular vocational education and training, improvement of vocational
education and training programmes in cooperation with sectoral expert councils and
development of the National Qualifications Framework. In the area of higher education,
the main measure is the evaluation of study directions which will provide a basis for
taking further decisions. There are also plans to improve the infrastructure and equipment
and to introduce a new model for financing higher education institutions plus legislative
amendments to improve the quality and flexibility of higher education.
3.4. Structural measures promoting growth and competitiveness
Latvia’s export structure has become more diversified over the years and the recent
growth in exports has contributed significantly to the overall economic recovery and the
rebalancing of the economy towards tradable sectors. Nevertheless, major structural

16
problems remain. Latvia’s labour productivity, in terms of real GDP per employed
person, is still significantly below the EU average and countries with economic
similarities such as Lithuania and Estonia.
The role of EU funds
For the period 2007–2013, Latvia has been allocated EUR 4.5 billion from the structural
funds and the Cohesion Fund under the ‘Convergence’ objective. Latvia is implementing
three Operational Programmes: ‘Human resources and employment’ supported by the
European Social Fund, ‘Entrepreneurship and innovations’ supported by the European
Regional Development Fund and ‘Infrastructure and services’ supported by the European
Regional Development Fund and the Cohesion Fund. Absorption of EU funds stands at
36.4 % of the total available financing, corresponding to the EU-27 average of above
35 % (European Social Fund execution is high at 60.04 %, with execution of the
European Regional Development Fund at 33.4 % and of the Cohesion Fund at 32.1 %). In
2010 and 2011 absorption of structural funds was delayed compared with the ambitious
budget plans, mainly due to delays in public procurement, insufficient administrative
capacity in line ministries and lack of bank financing.
Implementation of financing is critical for major Cohesion Fund projects in the transport
sector, e.g. the modernisation of railway stock and reallocation of port activities in
Krievu sala. The poor overall condition of transport infrastructure is being slowly
addressed with EU financing, though the quality standards for roadbuilding need further
improvements in line with the conditions set in the Supplemental Memorandum of
Understanding. Also, the development of ICT infrastructure shows a significant divide in
broadband coverage between densely populated and rural areas.
Overall, the experience gained from implementing cohesion policy in Latvia highlights
weaknesses related to the intervention logic of investments, including the evaluation
capacity. Coordination of support with neighbouring Member States is insufficient, in
particular in the context of the Baltic Sea Strategy.
Research and innovation
Latvia’s poor innovation performance — the country is consistently ranked amongst the
last on the Innovation Union scoreboard — could impair its long-run competitiveness.
There is no systematic and effective research and innovation strategy and little research
and innovation investment by either domestic companies or foreign affiliates to support
specialisation in knowledge-intensive and innovation-driven sectors. Latvia also has the
lowest business R&D intensity in the EU (0.22 % of GDP in 2010) and licence and patent
revenue is rather low. The national innovation system is overshadowed by low scientific
performance, as measured by the share of publications in the top 10 % most cited which,
at only 2.9 %, is the second lowest score in Europe.
The national research and innovation system faces a number of challenges:
(i) There is limited capacity to design, implement and coordinate research and innovation
policy: Latvia has a complicated decision-making process for such a small country and
the effectiveness of policy measures has been undermined by a lack of systematic
evaluations (an external evaluation is ongoing and planned to be finished by the end of
November 2012).
(ii) The scientific and research infrastructure is underdeveloped and the limited research
and innovation resources available are spread too thinly to be efficient.
(iii) Cooperation between businesses and academics continues to be poor: companies are
barely using the research potential of universities or state research institutes and their
participation in the ongoing competence centres programme is rather low. The level of
17
commercialisation of research is low: the technology transfer contact points operating in
several universities produce modest results, in part due to the incomplete legal
framework for protecting intellectual property rights.
(iv) There is a lack of highly qualified scientists and engineers; the number of new
doctorates awarded remains low and many scientists pursue their careers abroad.
In the course of fiscal consolidation, R&D intensity fell to 0.46 % in 2009 after peaking
at 0.7 % in 2007. With the help of structural funds (EUR 466 million or 10 % of the total
allocations are earmarked for implementation of R&D and innovation policies), R&D
intensity recovered somewhat to 0.6 % in 2010, which is still one of the lowest in the EU.
In view of the heavy dependence on structural funds and the low level of business
investment, the national target of increasing R&D intensity to 1.5 % by 2020 is rather
ambitious.
There is no systematic monitoring to create a continuous and stable basis for basic
research activities. The growing share of structural funds in R&D funding is tilting the
previous balance between institutional and competitive funding more towards project-
based, competitive funding. One major issue is funding of R&D after 2013, before the
new round of structural funds is available. Moreover, as the level of support will remain
constrained and there is a risk of some of the direct support measures being poorly
funded, the merits of introducing broader tax incentives for research and innovation have
to be considered.
In order to address these weaknesses, Latvia has taken the following steps: (i)
governance is being improved by setting up a cross-departmental coordination centre
under the Prime Minister; (ii) efforts are being made to modernise the scientific
infrastructure — nine national research centres were established in 2011; (iii) measures
have been taken to attract foreign academics, to increase the number of researchers and to
attune the education system more to business needs by involving employers’
organisations in the governance of universities and assessing vocational study
programmes; (iv) steps are being taken to promote commercialisation of science,
encourage industrial innovation and support the development of innovative enterprises
(business development involving new products and technologies, competence and
technology transfer centres, innovation vouchers, etc.).
Further efforts should be made to improve the quality of the science base and to
rationalise research and higher education institutions in line with the thematic priorities
and budgetary constraints. This should result in fewer but larger entities more able to
build up critical mass in specialised areas of education and research, coupled with
progressive introduction of competitive funding based on independent evaluation. In
order to address the current challenges and to qualify for the EU funding within the post
2013+ period, Latvia should draw up a research and innovation strategy for smart
specialisation, so that EU structural funds can be used more efficiently and synergies
between different EU and national policies, as well as public and private investments,
can be increased.
Energy markets
Energy markets in Latvia remain dominated by horizontally and vertically integrated
monopolies. Due to limited interconnection, the gas and electricity markets are largely
separated from other EU Member States. Increasing interconnection capacity would
contribute to enhancing competition in energy markets.
The concentration in the electricity generating sector is very high: the dominant utility
Latvenergo produced more than 90 % of all power in the country in 2010. In the gas
18
market, 100 % of imports are purchased by JSC ‘Latvijas Gaze’ from Russia.
Concentration at retail level is very high on both the electricity and gas markets. Latvia
has notified measures fully transposing both the electricity and the gas directives (with a
derogation for gas) and the regulator — the Public Utility Commission — is legally
independent since amendments to the relevant law came into force in August 2011.
A risk assessment is under way on gas interconnections with Estonia and Lithuania, plus
an assessment of pipeline projects (the Poland-Lithuania ‘Baltic Connector’ gas pipeline)
and of a regional liquefied natural gas terminal. As regards electricity, for historical
reasons the system is interconnected with the networks of Belarus, Russia, Estonia and
Lithuania (BRELL Ring agreement). Consequently, synchronisation with the EU
electricity system is not possible without negotiations with Russia and Belarus on
technical operation of the networks.
The policy response to the challenges facing the energy sector consists mainly of:
(i) following the legal transposition, it is time to implement the Third Energy Package in
practice for both electricity and gas, which as a first step entails the certification of the
independence of the electricity transmission system operator which is expected later this
year; (ii) preparing the gas sector for the end of isolation and subsequent creation of
market structures (e.g. decision on a regional liquefied natural gas terminal in the Baltic
region); (iii) linking the gas network to the EU (e.g. the Latvia/Lithuania reverse-flow
project); (iv) strengthening Latvia’s national electricity grid to transport energy from
Finland, Sweden or Poland; (v) continuing cooperation with the Commission in
negotiations with Russia and Belarus on operation of the electricity network; and
(vi) continuing work with a view to joining Nord Pool Spot and creating a Baltic regional
electricity market.
Renewable energy
Latvia has committed itself to meet a target of 40 % of renewable energy sources in final
energy consumption and a 10 % share for renewable energy in the transport sector by
2020 (in 2010 Latvia was close to its interim target for 2011/2012 of 34 %). Latvia has
notified measures fully transposing the EU Renewable Energy Sources Directive.
However, insufficient progress has been made on developing a coherent, stable and
predictable framework to support renewable energy. Support schemes are not fully
adequate in terms of the tariff levels and/or cost reductions due to technical development,
but retroactive changes must be avoided given the negative effect on overall investor
confidence.
Resource efficiency and the environment
The Second National Energy Efficiency Action Plan assumes that both the EU Cohesion
Policy Fund and the Climate Change Financial Instrument will continue to play a major
role in financing improvements in energy efficiency. Latvia has put forward a mix of
policy measures addressing energy saving in the main sectors of the economy. In the
years ahead more than 70 % of energy savings are expected to be generated in the
buildings sector. However, without placing any major burden on public budgets, Latvia
could significantly increase the benefits derived from energy efficiency investments by
introducing the legal and fiscal framework necessary for energy performance contracting.
The tax system does not provide sufficient incentives for reducing energy costs and
shifting consumption towards energy-efficient products (vehicles or insulation of
buildings and heating systems). The impact of the natural resources tax is small and
insufficient to penalise inefficient energy use. Quality standards in construction and
waste management are low. The potential for reducing dependence on energy imports is

19
untapped and the share of net energy imports in the foreign trade balance for goods
increased to about 50 % in 2010-11.
In 2011, the Energy Strategy for 2030 was launched to complement and update the
2007–2016 Energy Development Guidelines. It includes large-scale infrastructure
projects, fiscal measures (including energy and carbon taxes) and national targets in the
energy sector. In this context, programmes to increase energy efficiency in public
buildings and production facilities are in progress. Measures include technological
upgrades and replacing fossil fuels by renewable energy in heating systems. Also, a first
set of agreements have been signed for projects to reduce emissions from public lighting.
The EU funds and the Climate Change Financial Instrument have been playing a key role
in financing energy efficiency measures already implemented or planned. However,
considering that Latvia’s energy intensity is still more than double the EU-27 average,
especially for industrial companies, further efforts are clearly necessary. For example,
Latvia could significantly increase the benefits reaped from investments in energy
efficiency by introducing the legal and fiscal framework necessary for energy
performance contracting.
Latvia has committed itself to limit the increase in greenhouse gas emissions in sectors
not covered by the emissions trading system by 17 % (of 2005 levels) by 2020.
According to the latest projections, based on existing measures, emissions are expected
to increase by 14.7 % (compared with 2005), leading to an overachievement by 2
percentage points. However, energy efficiency is low in transport, which is the sector
with the largest emissions in Latvia, with 25.9 % of the country’s greenhouse gas
emissions in 2009. The public transport network is not sufficiently consolidated and use
of renewable energy and further electrification of the railways have not been fully
explored. While acknowledging the high share of the transport sector in Latvia’s
greenhouse gas emissions, the national reform programme does not put forward specific
measures addressing this problem (e.g. intermodal shifts). Although the national reform
programme reports compulsory admixture and exemptions from excise duties for
biofuels, the action taken so far has not led to significant emission cuts.
The structure of the waste management system in Latvia is still not in line with the
principles of resource efficiency. Latvia still landfills 90 % of municipal waste and the
level of landfill taxes remains low compared with other countries. Separate waste
collection, reuse, recycling and recovery are limited. The limited producer responsibility
system is not able to cover the full costs of separate collection and recycling of the main
waste streams. No incentives are in place to promote prevention and participation in
separate collection (pay-as-you-throw schemes). Latvia is not likely to reach the 2020
recycling target (50 %) without substantial investment. This creates significant
opportunities for growth in sectors connected with waste management and recycling.
Latvia has also taken major steps to develop quality water supply and waste water
management services further. Continued efforts are needed in the years ahead to ensure
steady growth of the share of the population with access to these services.
Other structural measures
To tighten management of state-owned enterprises and real estate, in line with the
commitments made in the Supplemental Memorandum of Understanding, in December
2011 the authorities adopted the ‘Concept paper on state-owned enterprises governance’
that lays down the principles for setting up a centralised state-owned enterprises
manager, governing relations with line ministries, measuring the performance of state-
owned enterprises, revising dividend and remuneration policies and reviewing the
institutions responsible for supervising government- and municipality-owned companies.
Also, plans for the final stages of further centralisation of state real estate management
20
under the State Real Estate Agency have been developed, deciding which real estate
assets to keep or to auction off and which need to be transferred to the Agency, while
centralising decisions on real estate investment projects in the process of drafting the
state budget.
The competition climate in Latvia can be improved, especially in sectors like
construction, healthcare and pharmacy, public services and food supply (dominated by
two big chains). The Competition Council has inadequate capacity to perform more
active, targeted market surveillance. There is also insufficient competition in public
procurement, notably for maintenance works and construction of roads and bridges. As
regards public services, port authorities occasionally run commercial-like activities and
prevent private companies from offering their services, leading to legal disputes. In this
context, the Supplemental Memorandum of Understanding contains a commitment to
introduce, by mid-2012, a proper assessment system to monitor observance and uniform
application of the criteria for government and municipal authorities to engage in
commercial activities, including port services.
Latvia adopted the horizontal law transposing the Services Directive with some delay in
April 2010. The law was amended in March 2012 to ensure better compliance with the
directive. In general, no major obstacles have been identified but some restrictions on
cross-border provision of services still exist in tourism and construction. The number of
restrictions on regulated professions is moderate, except for the profession of notary
where Latvia refused to repeal the nationality requirement, despite the judgments of the
Court of Justice of the EU of 24 May 2011 (concerning six other Member States). The
‘point of single contact’ provides relatively good information, except on cross-border
service provision. Completion of procedures is mostly possible for national service
providers, whereas technical solutions are needed for cross-border use of e-identification
and e-signatures.
The ‘Rail Baltic’ project, which has gained new impetus in the reviewed trans-European
transport network policy, would connect the main EU networks with north-east Europe.
Electrified European-gauge railway infrastructure is to be built, providing a strong
stimulus for economic growth and reducing greenhouse gas emissions through a modal
shift to rail. In this context, it is important to ensure that competition in the rail freight
sector, including rail traffic management, is effective and that new entrants can gain
access to the market.
The take-up of broadband internet is below the EU average due to the rural broadband
gap. The rural broadband state aid scheme co-financed by EU funds and approved in
2011 should lower the broadband deployment cost in rural areas; however, it needs to be
implemented as part of an overall national broadband strategy, which the authorities plan
to adopt by the end of 2012. Also, in accordance with the recently agreed EU policy on
radio spectrum for wireless broadband, Latvia should work on authorising use of the
digital dividend spectrum to stimulate competitive and ubiquitous mobile broadband
services.
3.5. Modernisation of public administration
Latvia has allocated EUR 22.8 million, or 3.9 % of the overall EU funding available, to
modernisation of public administration under the priority ‘Administrative capacity-
building’ of the Operational Programme on ‘Human resources and employment’ funded
by the European Social Fund. Although some improvements have been made, a great
deal remains to be done. In particular, the authorities need to move away from financing
basic operations (e.g. temporary staff recruitment) that lead to supporting low value-
added, short-term projects. Instead, narrowing the number of eligible activities and
21
clearly targeting them on reforms in public administration would provide greater
efficiency.
Despite earlier delays in implementing the relevant conditions in the previous
Supplemental Memorandums of Understanding, the authorities have committed
themselves to preparing a strategy on public administration by spring 2012, which will,
inter alia, establish a stronger institutional model responsible for human resources and
recruitment policy and payroll, normalise the distribution of employees within the unified
wage grid based on effective skills assessment, introduce central control for
establishment of new posts and reward the performance of employees through earnings
and career development. In this area, however, given past delays, it is unclear how far
these commitments will be put into practice.
While Latvia has made efforts to lighten the administrative burden on businesses, a focus
on real efficiency gains is lacking and the initiatives taken have been fragmented. The
government lacks a comprehensive strategy on supporting enterprises and improving the
business environment. Nevertheless, in 2010 and 2011 a number of measures were taken
to help micro-companies and self-employed to start a business, especially by reducing
start-up costs related to registration, equity capital requirements and taxation. In addition,
the time it takes to obtain a permanent electricity connection has been shortened and the
management of EU structural funds projects has been simplified. However, the new
Construction Law, supposed to simplify construction procedures, as well as legislation
for the protection of investors, are yet to be adopted by Parliament. Also, the compliance
requirements for tax administration remain to be simplified and the electronic registration
of enterprises, the electronic procurement system and the one-stop shop for the
registration of property are yet to be completed.
As regards the efficiency of the Latvian civil justice system, the main challenges are the
large case backlog and the lengthy proceedings in civil and commercial cases. The
situation is similar for administrative courts, which are empowered to rule on licences,
registrations and tax issues. Latvia has a low clearance rate (i.e. the capacity of courts to
deal with new and pending cases) and a high disposition time (i.e. the number of days
necessary to dispose of pending cases). The situation has deteriorated in the last few
years, with only 73 % of cases adjudicated within one year in 2011. Moreover, many
cases do not get resolved at first instance, which creates delays and backlogs at all
instances, up to the Supreme Court. The inefficiency was particularly acute in insolvency
proceedings. New insolvency legislation has been adopted to streamline and expedite the
insolvency process and introduce a reorganisation option for companies. However, its
effects still need to be fully analysed. Further improvements of Latvia’s insolvency laws
are being discussed. There is also some concern that the Latvian judiciary is not
maintaining and updating its knowledge of EU law.
The number of cases handled per year by judges is very high, while the judicial support
staff may not always be sufficiently qualified to assist the judges. There is also concern
about the qualifications and the accountability of the judiciary. The creation of an
independent Council for the Judiciary in 2010, responsible for evaluating the professional
performance of judges, should improve the situation, while guaranteeing the
independence of the judiciary.
The authorities are taking measures to improve the performance of the judicial system. In
particular, they are working towards improving court infrastructure (audio,
videoconferencing and IT solutions) and the efficiency of procedural law, setting up a
system for publication of judgments, levelling the workload of different courts and
developing the legal framework for mediation. The Annual Action Plan for Improvement
of the Business Environment for 2012 includes measures to ensure use of e-services in

22
legal proceedings. It is too early to assess the relevance and efficiency of the measures
proposed.
In 2011 the government also passed the Electronic Government Development Plan for
2011–2013 estimating that 50 % of the population will use e-government in 2015. By late
2011, 20 e-services had been introduced and about 150 more are expected to be
introduced in 2012 followed by another 50 e-services in 2013.
23
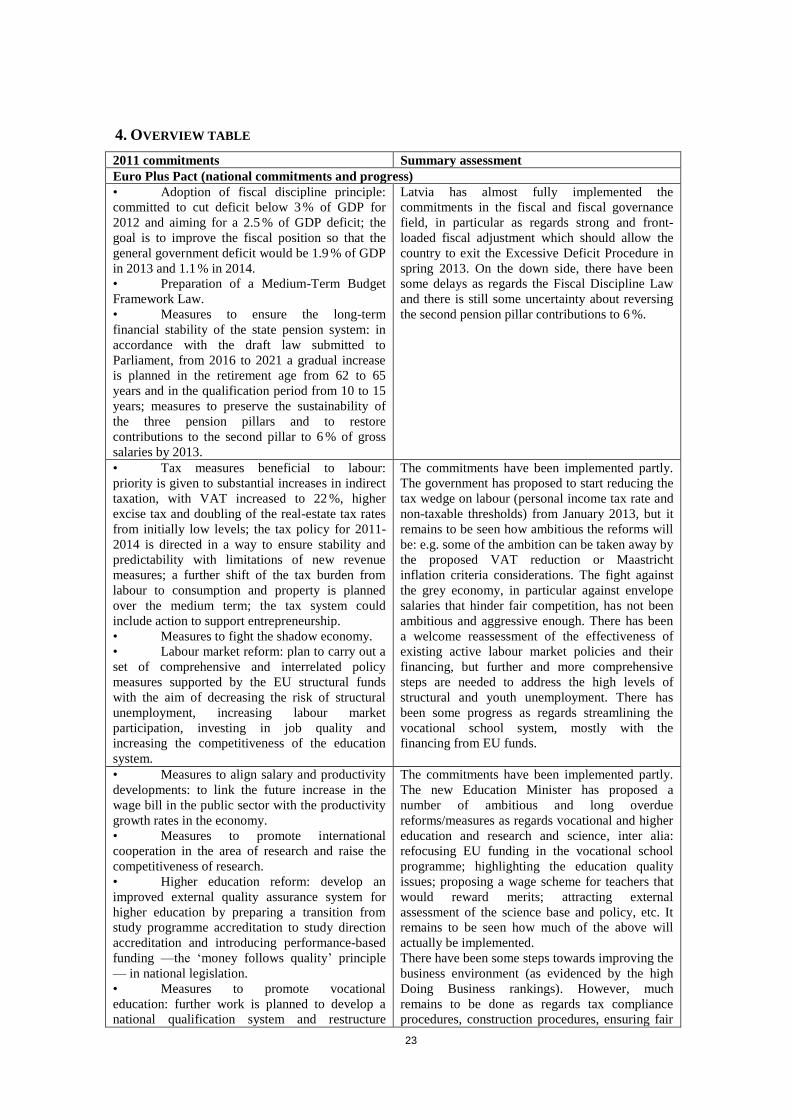
4. OVERVIEW TABLE
2011 commitments Summary assessment
Euro Plus Pact (national commitments and progress)
• Adoption of fiscal discipline principle:
committed to cut deficit below 3 % of GDP for
2012 and aiming for a 2.5 % of GDP deficit; the
goal is to improve the fiscal position so that the
general government deficit would be 1.9 % of GDP
in 2013 and 1.1 % in 2014.
• Preparation of a Medium-Term Budget
Framework Law.
• Measures to ensure the long-term
financial stability of the state pension system: in
accordance with the draft law submitted to
Parliament, from 2016 to 2021 a gradual increase
is planned in the retirement age from 62 to 65
years and in the qualification period from 10 to 15
years; measures to preserve the sustainability of
the three pension pillars and to restore
contributions to the second pillar to 6 % of gross
salaries by 2013.
Latvia has almost fully implemented the
commitments in the fiscal and fiscal governance
field, in particular as regards strong and front-
loaded fiscal adjustment which should allow the
country to exit the Excessive Deficit Procedure in
spring 2013. On the down side, there have been
some delays as regards the Fiscal Discipline Law
and there is still some uncertainty about reversing
the second pension pillar contributions to 6 %.
• Tax measures beneficial to labour:
priority is given to substantial increases in indirect
taxation, with VAT increased to 22 %, higher
excise tax and doubling of the real-estate tax rates
from initially low levels; the tax policy for 2011-
2014 is directed in a way to ensure stability and
predictability with limitations of new revenue
measures; a further shift of the tax burden from
labour to consumption and property is planned
over the medium term; the tax system could
include action to support entrepreneurship.
• Measures to fight the shadow economy.
• Labour market reform: plan to carry out a
set of comprehensive and interrelated policy
measures supported by the EU structural funds
with the aim of decreasing the risk of structural
unemployment, increasing labour market
participation, investing in job quality and
increasing the competitiveness of the education
system.
The commitments have been implemented partly.
The government has proposed to start reducing the
tax wedge on labour (personal income tax rate and
non-taxable thresholds) from January 2013, but it
remains to be seen how ambitious the reforms will
be: e.g. some of the ambition can be taken away by
the proposed VAT reduction or Maastricht
inflation criteria considerations. The fight against
the grey economy, in particular against envelope
salaries that hinder fair competition, has not been
ambitious and aggressive enough. There has been
a welcome reassessment of the effectiveness of
existing active labour market policies and their
financing, but further and more comprehensive
steps are needed to address the high levels of
structural and youth unemployment. There has
been some progress as regards streamlining the
vocational school system, mostly with the
financing from EU funds.
• Measures to align salary and productivity
developments: to link the future increase in the
wage bill in the public sector with the productivity
growth rates in the economy.
• Measures to promote international
cooperation in the area of research and raise the
competitiveness of research.
• Higher education reform: develop an
improved external quality assurance system for
higher education by preparing a transition from
study programme accreditation to study direction
accreditation and introducing performance-based
funding —the ‘money follows quality’ principle
— in national legislation.
• Measures to promote vocational
education: further work is planned to develop a
national qualification system and restructure
The commitments have been implemented partly.
The new Education Minister has proposed a
number of ambitious and long overdue
reforms/measures as regards vocational and higher
education and research and science, inter alia:
refocusing EU funding in the vocational school
programme; highlighting the education quality
issues; proposing a wage scheme for teachers that
would reward merits; attracting external
assessment of the science base and policy, etc. It
remains to be seen how much of the above will
actually be implemented.
There have been some steps towards improving the
business environment (as evidenced by the high
Doing Business rankings). However, much
remains to be done as regards tax compliance
procedures, construction procedures, ensuring fair
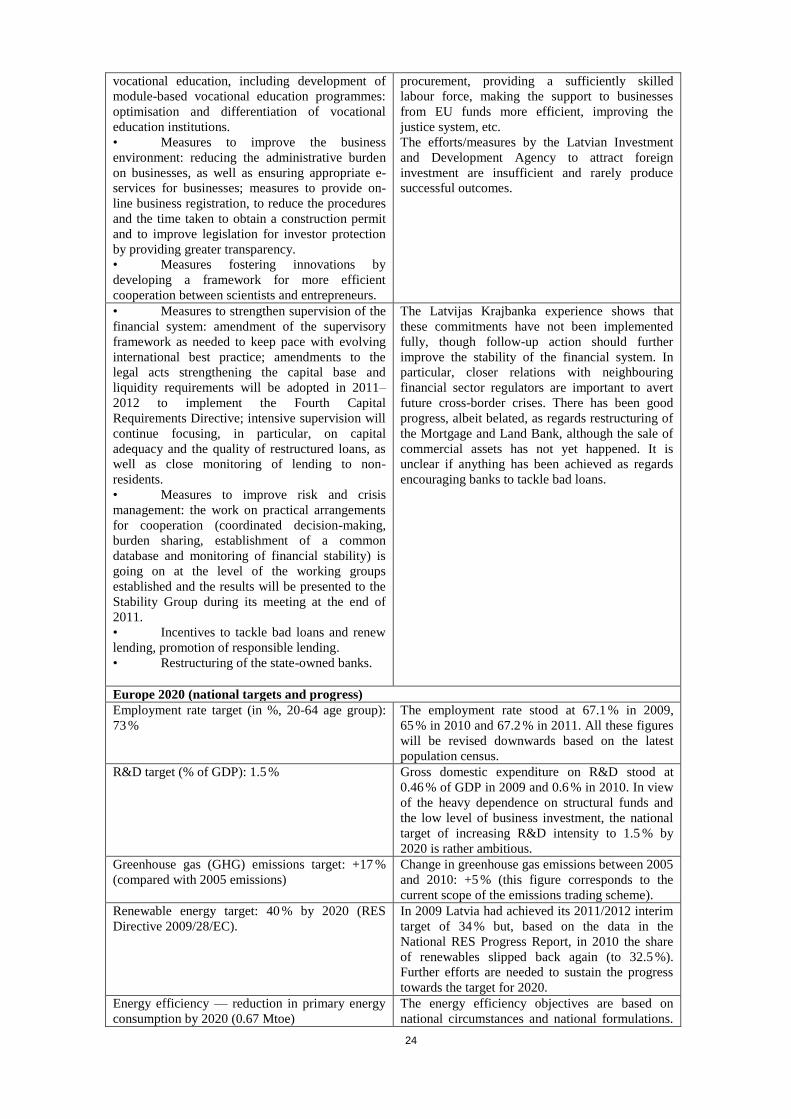
24
vocational education, including development of
module-based vocational education programmes:
optimisation and differentiation of vocational
education institutions.
• Measures to improve the business
environment: reducing the administrative burden
on businesses, as well as ensuring appropriate e-
services for businesses; measures to provide on-
line business registration, to reduce the procedures
and the time taken to obtain a construction permit
and to improve legislation for investor protection
by providing greater transparency.
• Measures fostering innovations by
developing a framework for more efficient
cooperation between scientists and entrepreneurs.
procurement, providing a sufficiently skilled
labour force, making the support to businesses
from EU funds more efficient, improving the
justice system, etc.
The efforts/measures by the Latvian Investment
and Development Agency to attract foreign
investment are insufficient and rarely produce
successful outcomes.
• Measures to strengthen supervision of the
financial system: amendment of the supervisory
framework as needed to keep pace with evolving
international best practice; amendments to the
legal acts strengthening the capital base and
liquidity requirements will be adopted in 2011–
2012 to implement the Fourth Capital
Requirements Directive; intensive supervision will
continue focusing, in particular, on capital
adequacy and the quality of restructured loans, as
well as close monitoring of lending to non-
residents.
• Measures to improve risk and crisis
management: the work on practical arrangements
for cooperation (coordinated decision-making,
burden sharing, establishment of a common
database and monitoring of financial stability) is
going on at the level of the working groups
established and the results will be presented to the
Stability Group during its meeting at the end of
2011.
• Incentives to tackle bad loans and renew
lending, promotion of responsible lending.
• Restructuring of the state-owned banks.
The Latvijas Krajbanka experience shows that
these commitments have not been implemented
fully, though follow-up action should further
improve the stability of the financial system. In
particular, closer relations with neighbouring
financial sector regulators are important to avert
future cross-border crises. There has been good
progress, albeit belated, as regards restructuring of
the Mortgage and Land Bank, although the sale of
commercial assets has not yet happened. It is
unclear if anything has been achieved as regards
encouraging banks to tackle bad loans.
Europe 2020 (national targets and progress)
Employment rate target (in %, 20-64 age group):
73 %
The employment rate stood at 67.1 % in 2009,
65 % in 2010 and 67.2 % in 2011. All these figures
will be revised downwards based on the latest
population census.
R&D target (% of GDP): 1.5 % Gross domestic expenditure on R&D stood at
0.46 % of GDP in 2009 and 0.6 % in 2010. In view
of the heavy dependence on structural funds and
the low level of business investment, the national
target of increasing R&D intensity to 1.5 % by
2020 is rather ambitious.
Greenhouse gas (GHG) emissions target: +17 %
(compared with 2005 emissions)
Change in greenhouse gas emissions between 2005
and 2010: +5 % (this figure corresponds to the
current scope of the emissions trading scheme).
Renewable energy target: 40 % by 2020 (RES
Directive 2009/28/EC).
In 2009 Latvia had achieved its 2011/2012 interim
target of 34 % but, based on the data in the
National RES Progress Report, in 2010 the share
of renewables slipped back again (to 32.5 %).
Further efforts are needed to sustain the progress
towards the target for 2020.
Energy efficiency — reduction in primary energy
consumption by 2020 (0.67 Mtoe)
The energy efficiency objectives are based on
national circumstances and national formulations.

25
As the method to express the impact of these
objectives on energy consumption in 2020 in the
same format was agreed only recently, the
Commission is not yet able to present this
overview.
Early school leaving target: 13.3 % The proportion of early leavers from education and
training (percentage of the population aged 18-24
with at most lower secondary education and not in
further education or training) stood at 13.3 % in
2010. Over the last decade Latvia has made
progress on reducing the number of early school
leavers (from 16.9 % in 2002 to 13.3 % in 2010). It
is currently performing better than the EU average
of 14.1 %. Based on current trends, Latvia is likely
to achieve its national target of 13.9 %, but it is not
ambitious enough (the EU headline target is set at
10 % in 2020).
Poverty target: At risk of poverty 21 %
121 000 people (at-risk-of-poverty and jobless
households)
The at-risk-of-poverty rate fell from 25.7 % in
2009 to 19.3 % in 2011. Thus, the target in relative
terms has been reached. The main driver behind
the developments in the at-risk-of-poverty rate was
a significant drop in the poverty threshold (the
population as a whole is worse off). The
improvements in the target value are not the result
of any deliberate policy action and will have no
long-lasting impact. The real challenge will be to
prevent the at-risk-of-poverty rate from increasing
as the economy continues to recover.
Tertiary education target: 32.3 % Tertiary educational attainment stood at 32.3 % in
2010, a 5.3 pps increase since 2008. Tertiary
attainment rates have improved significantly over
the last decade (from 18.6 % in 2000 to 30.1 % in
2009 and 32.3 % in 2010) and have almost reached
the EU average of 33.6 %. Latvia has set a national
target of 34–36 % of graduates by 2020, which,
based on current trends, is likely to be achieved.
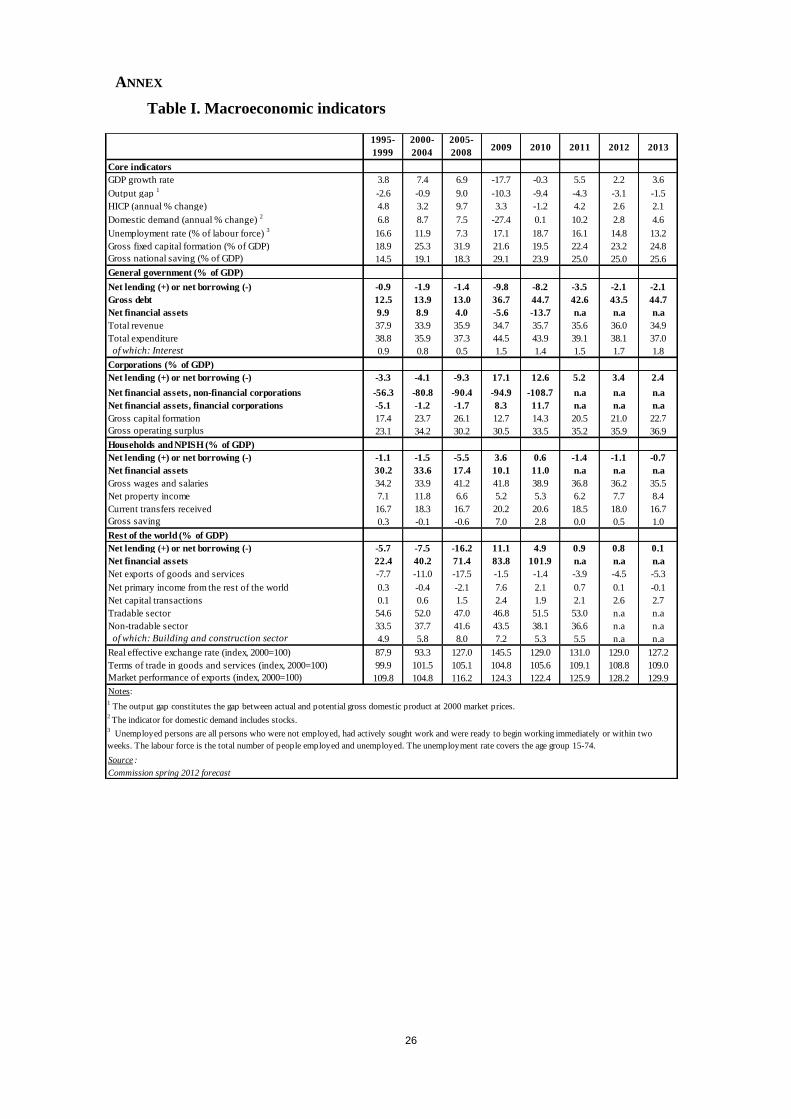
26
ANNEX
Table I. Macroeconomic indicators
1995-
1999
2000-
2004
2005-
20082009 2010 2011 2012 2013
Core indicators
GDP growth rate 3.8 7.4 6.9 -17.7 -0.3 5.5 2.2 3.6
Output gap 1
-2.6 -0.9 9.0 -10.3 -9.4 -4.3 -3.1 -1.5
HICP (annual % change) 4.8 3.2 9.7 3.3 -1.2 4.2 2.6 2.1
Domestic demand (annual % change) 2
6.8 8.7 7.5 -27.4 0.1 10.2 2.8 4.6
Unemployment rate (% of labour force) 3
16.6 11.9 7.3 17.1 18.7 16.1 14.8 13.2
Gross fixed capital formation (% of GDP) 18.9 25.3 31.9 21.6 19.5 22.4 23.2 24.8
Gross national saving (% of GDP) 14.5 19.1 18.3 29.1 23.9 25.0 25.0 25.6
General government (% of GDP)
Net lending (+) or net borrowing (-) -0.9 -1.9 -1.4 -9.8 -8.2 -3.5 -2.1 -2.1
Gross debt 12.5 13.9 13.0 36.7 44.7 42.6 43.5 44.7
Net financial assets 9.9 8.9 4.0 -5.6 -13.7 n.a n.a n.a
Total revenue 37.9 33.9 35.9 34.7 35.7 35.6 36.0 34.9
Total expenditure 38.8 35.9 37.3 44.5 43.9 39.1 38.1 37.0
of which: Interest 0.9 0.8 0.5 1.5 1.4 1.5 1.7 1.8
Corporations (% of GDP)
Net lending (+) or net borrowing (-) -3.3 -4.1 -9.3 17.1 12.6 5.2 3.4 2.4
Net financial assets, non-financial corporations -56.3 -80.8 -90.4 -94.9 -108.7 n.a n.a n.a
Net financial assets, financial corporations -5.1 -1.2 -1.7 8.3 11.7 n.a n.a n.a
Gross capital formation 17.4 23.7 26.1 12.7 14.3 20.5 21.0 22.7
Gross operating surplus 23.1 34.2 30.2 30.5 33.5 35.2 35.9 36.9
Households and NPISH (% of GDP)
Net lending (+) or net borrowing (-) -1.1 -1.5 -5.5 3.6 0.6 -1.4 -1.1 -0.7
Net financial assets 30.2 33.6 17.4 10.1 11.0 n.a n.a n.a
Gross wages and salaries 34.2 33.9 41.2 41.8 38.9 36.8 36.2 35.5
Net property income 7.1 11.8 6.6 5.2 5.3 6.2 7.7 8.4
Current transfers received 16.7 18.3 16.7 20.2 20.6 18.5 18.0 16.7
Gross saving 0.3 -0.1 -0.6 7.0 2.8 0.0 0.5 1.0
Rest of the world (% of GDP)
Net lending (+) or net borrowing (-) -5.7 -7.5 -16.2 11.1 4.9 0.9 0.8 0.1
Net financial assets 22.4 40.2 71.4 83.8 101.9 n.a n.a n.a
Net exports of goods and services -7.7 -11.0 -17.5 -1.5 -1.4 -3.9 -4.5 -5.3
Net primary income from the rest of the world 0.3 -0.4 -2.1 7.6 2.1 0.7 0.1 -0.1
Net capital transactions 0.1 0.6 1.5 2.4 1.9 2.1 2.6 2.7
Tradable sector 54.6 52.0 47.0 46.8 51.5 53.0 n.a n.a
Non-tradable sector 33.5 37.7 41.6 43.5 38.1 36.6 n.a n.a
of which: Building and construction sector 4.9 5.8 8.0 7.2 5.3 5.5 n.a n.a
Real effective exchange rate (index, 2000=100) 87.9 93.3 127.0 145.5 129.0 131.0 129.0 127.2
Terms of trade in goods and services (index, 2000=100) 99.9 101.5 105.1 104.8 105.6 109.1 108.8 109.0
Market performance of exports (index, 2000=100) 109.8 104.8 116.2 124.3 122.4 125.9 128.2 129.9
Commission spring 2012 forecast
Notes:
1 The output gap constitutes the gap between actual and potential gross domestic product at 2000 market prices.
2 The indicator for domestic demand includes stocks.
3 Unemployed persons are all persons who were not employed, had actively sought work and were ready to begin working immediately or within two
weeks. The labour force is the total number of people employed and unemployed. The unemployment rate covers the age group 15-74.
Source :
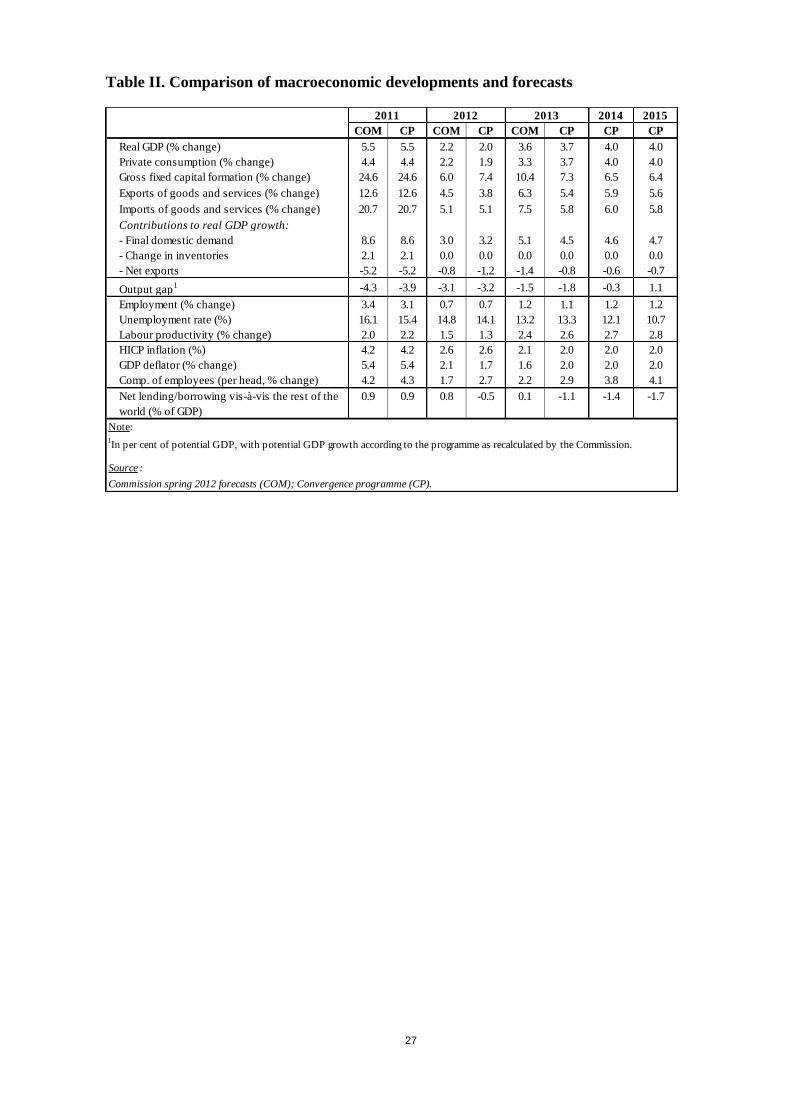
27
Table II. Comparison of macroeconomic developments and forecasts
2014 2015
COM CP COM CP COM CP CP CP
Real GDP (% change) 5.5 5.5 2.2 2.0 3.6 3.7 4.0 4.0
Private consumption (% change) 4.4 4.4 2.2 1.9 3.3 3.7 4.0 4.0
Gross fixed capital formation (% change) 24.6 24.6 6.0 7.4 10.4 7.3 6.5 6.4
Exports of goods and services (% change) 12.6 12.6 4.5 3.8 6.3 5.4 5.9 5.6
Imports of goods and services (% change) 20.7 20.7 5.1 5.1 7.5 5.8 6.0 5.8
Contributions to real GDP growth:
- Final domestic demand 8.6 8.6 3.0 3.2 5.1 4.5 4.6 4.7
- Change in inventories 2.1 2.1 0.0 0.0 0.0 0.0 0.0 0.0
- Net exports -5.2 -5.2 -0.8 -1.2 -1.4 -0.8 -0.6 -0.7
Output gap1 -4.3 -3.9 -3.1 -3.2 -1.5 -1.8 -0.3 1.1
Employment (% change) 3.4 3.1 0.7 0.7 1.2 1.1 1.2 1.2
Unemployment rate (%) 16.1 15.4 14.8 14.1 13.2 13.3 12.1 10.7
Labour productivity (% change) 2.0 2.2 1.5 1.3 2.4 2.6 2.7 2.8
HICP inflation (%) 4.2 4.2 2.6 2.6 2.1 2.0 2.0 2.0
GDP deflator (% change) 5.4 5.4 2.1 1.7 1.6 2.0 2.0 2.0
Comp. of employees (per head, % change) 4.2 4.3 1.7 2.7 2.2 2.9 3.8 4.1
Net lending/borrowing vis-à-vis the rest of the
world (% of GDP)
0.9 0.9 0.8 -0.5 0.1 -1.1 -1.4 -1.7
1In per cent of potential GDP, with potential GDP growth according to the programme as recalculated by the Commission.
Source :
Note:
Commission spring 2012 forecasts (COM); Convergence programme (CP).
2011 2012 2013
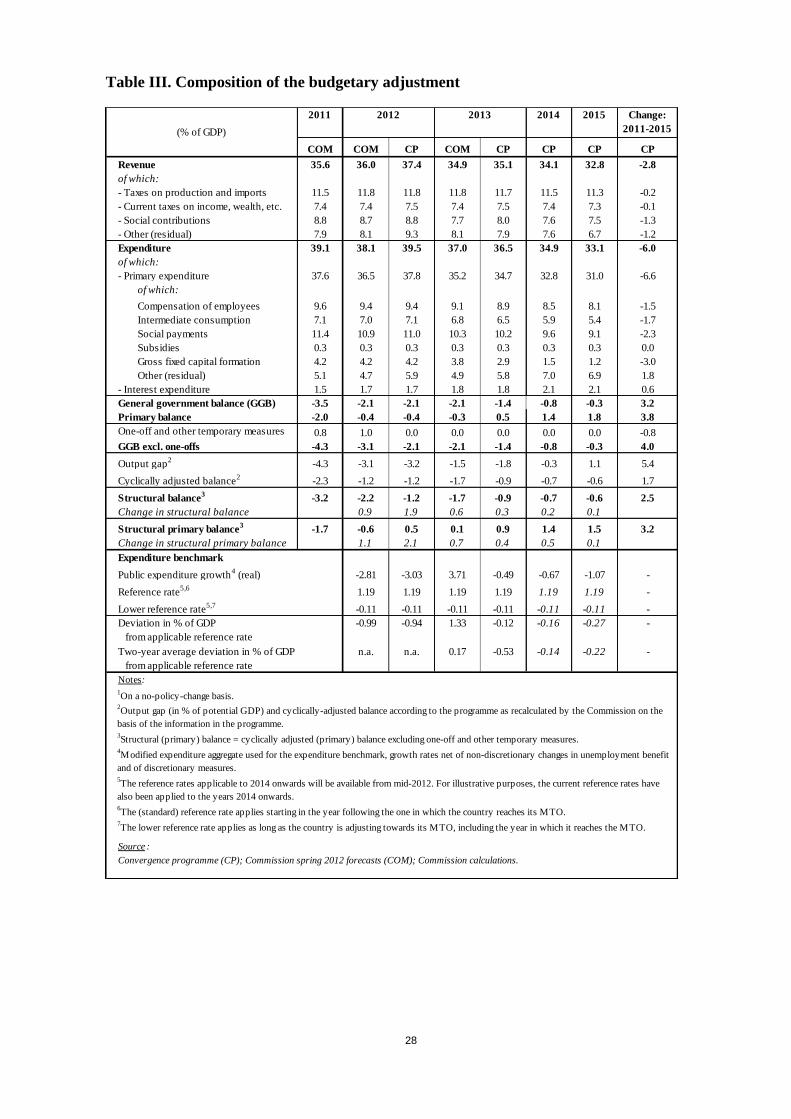
28
Table III. Composition of the budgetary adjustment
2011 2014 2015 Change:
2011-2015
COM COM CP COM CP CP CP CP
Revenue 35.6 36.0 37.4 34.9 35.1 34.1 32.8 -2.8
of which:
- Taxes on production and imports 11.5 11.8 11.8 11.8 11.7 11.5 11.3 -0.2
- Current taxes on income, wealth, etc. 7.4 7.4 7.5 7.4 7.5 7.4 7.3 -0.1
- Social contributions 8.8 8.7 8.8 7.7 8.0 7.6 7.5 -1.3
- Other (residual) 7.9 8.1 9.3 8.1 7.9 7.6 6.7 -1.2
Expenditure 39.1 38.1 39.5 37.0 36.5 34.9 33.1 -6.0
of which:
- Primary expenditure 37.6 36.5 37.8 35.2 34.7 32.8 31.0 -6.6
of which:
Compensation of employees 9.6 9.4 9.4 9.1 8.9 8.5 8.1 -1.5
Intermediate consumption 7.1 7.0 7.1 6.8 6.5 5.9 5.4 -1.7
Social payments 11.4 10.9 11.0 10.3 10.2 9.6 9.1 -2.3
Subsidies 0.3 0.3 0.3 0.3 0.3 0.3 0.3 0.0
Gross fixed capital formation 4.2 4.2 4.2 3.8 2.9 1.5 1.2 -3.0
Other (residual) 5.1 4.7 5.9 4.9 5.8 7.0 6.9 1.8
- Interest expenditure 1.5 1.7 1.7 1.8 1.8 2.1 2.1 0.6
General government balance (GGB) -3.5 -2.1 -2.1 -2.1 -1.4 -0.8 -0.3 3.2
Primary balance -2.0 -0.4 -0.4 -0.3 0.5 1.4 1.8 3.8
One-off and other temporary measures 0.8 1.0 0.0 0.0 0.0 0.0 0.0 -0.8
GGB excl. one-offs -4.3 -3.1 -2.1 -2.1 -1.4 -0.8 -0.3 4.0
Output gap2
-4.3 -3.1 -3.2 -1.5 -1.8 -0.3 1.1 5.4
Cyclically adjusted balance2
-2.3 -1.2 -1.2 -1.7 -0.9 -0.7 -0.6 1.7
Structural balance3
-3.2 -2.2 -1.2 -1.7 -0.9 -0.7 -0.6 2.5
Change in structural balance 0.9 1.9 0.6 0.3 0.2 0.1
Structural primary balance3
-1.7 -0.6 0.5 0.1 0.9 1.4 1.5 3.2
Change in structural primary balance 1.1 2.1 0.7 0.4 0.5 0.1
Expenditure benchmark
Public expenditure growth4 (real) -2.81 -3.03 3.71 -0.49 -0.67 -1.07 -
Reference rate5,6
1.19 1.19 1.19 1.19 1.19 1.19 -
Lower reference rate5,7
-0.11 -0.11 -0.11 -0.11 -0.11 -0.11 -
Deviation in % of GDP
from applicable reference rate
-0.99 -0.94 1.33 -0.12 -0.16 -0.27 -
Two-year average deviation in % of GDP
from applicable reference rate
n.a. n.a. 0.17 -0.53 -0.14 -0.22 -
Notes:
1On a no-policy-change basis.
6The (standard) reference rate applies starting in the year following the one in which the country reaches its MTO.
2013
(% of GDP)
2012
Source :
Convergence programme (CP); Commission spring 2012 forecasts (COM); Commission calculations.
7The lower reference rate applies as long as the country is adjusting towards its MTO, including the year in which it reaches the MTO.
5The reference rates applicable to 2014 onwards will be available from mid-2012. For illustrative purposes, the current reference rates have
also been applied to the years 2014 onwards.
2Output gap (in % of potential GDP) and cyclically-adjusted balance according to the programme as recalculated by the Commission on the
basis of the information in the programme.3Structural (primary) balance = cyclically adjusted (primary) balance excluding one-off and other temporary measures.
4Modified expenditure aggregate used for the expenditure benchmark, growth rates net of non-discretionary changes in unemployment benefit
and of discretionary measures.
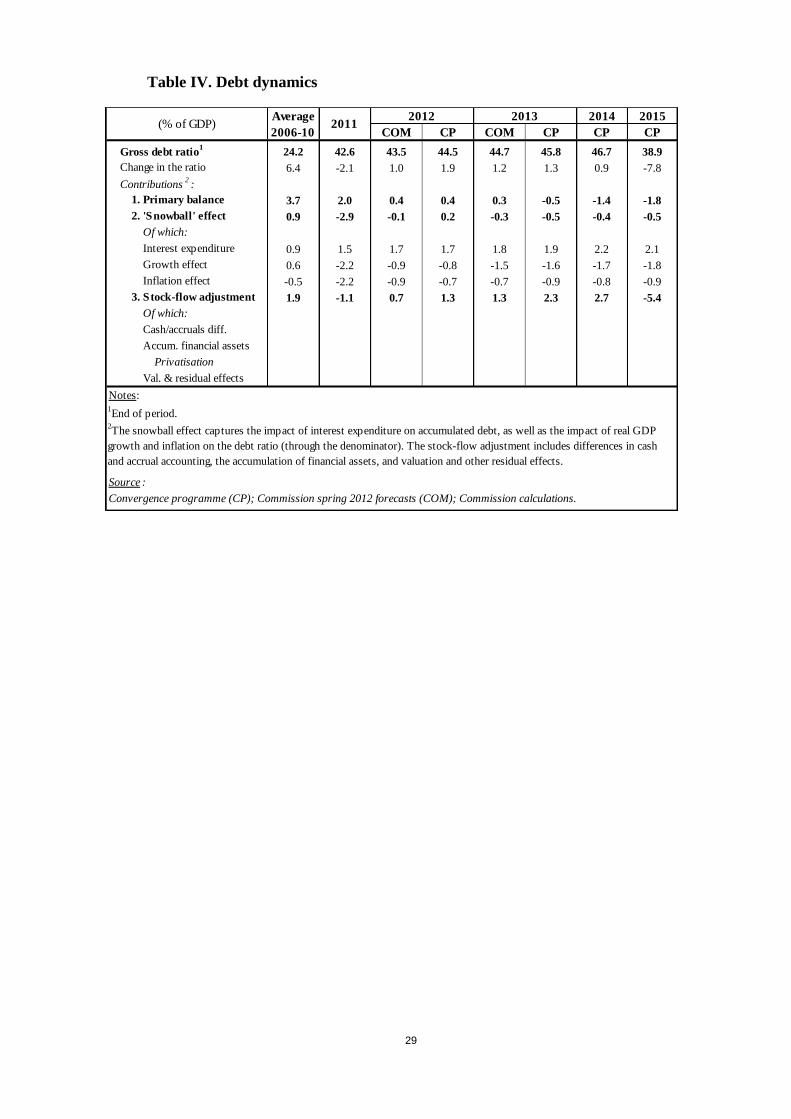
29
Table IV. Debt dynamics
2014 2015
COM CP COM CP CP CP
Gross debt ratio1
24.2 42.6 43.5 44.5 44.7 45.8 46.7 38.9
Change in the ratio 6.4 -2.1 1.0 1.9 1.2 1.3 0.9 -7.8
Contributions2:
1. Primary balance 3.7 2.0 0.4 0.4 0.3 -0.5 -1.4 -1.8
2. 'Snowball' effect 0.9 -2.9 -0.1 0.2 -0.3 -0.5 -0.4 -0.5
Of which:
Interest expenditure 0.9 1.5 1.7 1.7 1.8 1.9 2.2 2.1
Growth effect 0.6 -2.2 -0.9 -0.8 -1.5 -1.6 -1.7 -1.8
Inflation effect -0.5 -2.2 -0.9 -0.7 -0.7 -0.9 -0.8 -0.9
3. Stock-flow adjustment 1.9 -1.1 0.7 1.3 1.3 2.3 2.7 -5.4
Of which:
Cash/accruals diff.
Accum. financial assets
Privatisation
Val. & residual effects
Source :
Convergence programme (CP); Commission spring 2012 forecasts (COM); Commission calculations.
2011
2The snowball effect captures the impact of interest expenditure on accumulated debt, as well as the impact of real GDP
growth and inflation on the debt ratio (through the denominator). The stock-flow adjustment includes differences in cash
and accrual accounting, the accumulation of financial assets, and valuation and other residual effects.
(% of GDP)
Notes:1End of period.
2012 2013Average
2006-10
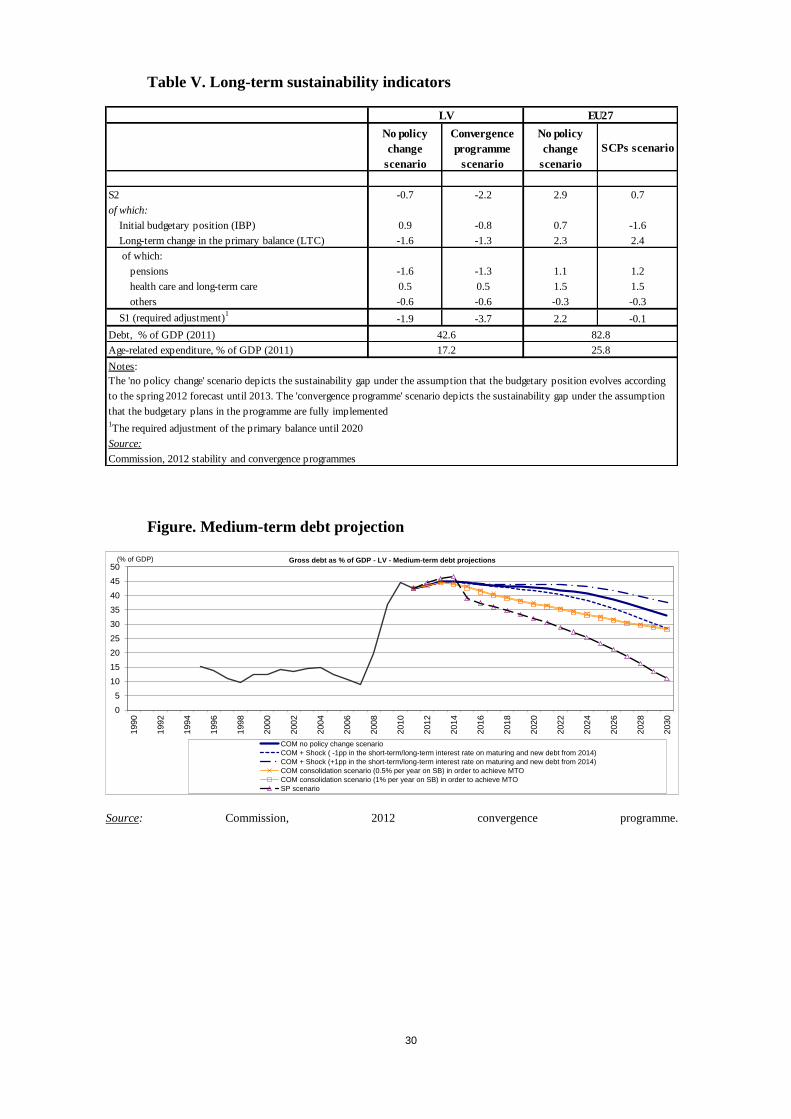
30
Table V. Long-term sustainability indicators
No policy
change
scenario
Convergence
programme
scenario
No policy
change
scenario
SCPs scenario
S2 -0.7 -2.2 2.9 0.7
of which:
Initial budgetary position (IBP) 0.9 -0.8 0.7 -1.6
Long-term change in the primary balance (LTC) -1.6 -1.3 2.3 2.4
of which:
pensions -1.6 -1.3 1.1 1.2
health care and long-term care 0.5 0.5 1.5 1.5
others -0.6 -0.6 -0.3 -0.3
S1 (required adjustment)1
-1.9 -3.7 2.2 -0.1
Debt, % of GDP (2011)
Age-related expenditure, % of GDP (2011)
Notes:
1The required adjustment of the primary balance until 2020
Source:
Commission, 2012 stability and convergence programmes
The 'no policy change' scenario depicts the sustainability gap under the assumption that the budgetary position evolves according
to the spring 2012 forecast until 2013. The 'convergence programme' scenario depicts the sustainability gap under the assumption
that the budgetary plans in the programme are fully implemented
LV EU27
42.6
17.2
82.8
25.8
Figure. Medium-term debt projection
0
5
10
15
20
25
30
35
40
45
50
199
0
199
2
199
4
199
6
199
8
200
0
200
2
200
4
200
6
200
8
201
0
201
2
201
4
201
6
201
8
202
0
202
2
202
4
202
6
202
8
203
0
COM no policy change scenario
COM + Shock ( -1pp in the short-term/long-term interest rate on maturing and new debt from 2014)
COM + Shock (+1pp in the short-term/long-term interest rate on maturing and new debt from 2014)
COM consolidation scenario (0.5% per year on SB) in order to achieve MTO
COM consolidation scenario (1% per year on SB) in order to achieve MTO
SP scenario
(% of GDP) Gross debt as % of GDP - LV - Medium-term debt projections
Source: Commission, 2012 convergence programme.

31
Table VI. Taxation indicators
2001 2005 2007 2008 2009 2010
Total tax revenues (incl. actual compulsory social contributions, % of GDP) 28.9 29.2 30.6 29.2 26.7 27.3
Breakdown by economic function (% of GDP)1
Consumption 10.7 12.3 11.9 10.6 10.3 10.8
of which:
- VAT 6.8 7.8 8.2 6.7 6.0 6.6
- excise duties on tobacco and alcohol 1.3 1.3 1.1 1.5 1.6 1.5
- energy 1.7 2.2 1.7 1.7 2.1 2.0
- other (residual) 1.0 0.9 0.9 0.7 0.7 0.7
Labour employed 14.6 14.0 14.6 14.4 13.6 13.9
Labour non-employed 0.1 0.1 0.1 0.1 0.3 0.4
Capital and business income 2.0 2.1 2.9 3.3 1.7 1.2
Stocks of capital/wealth 1.3 0.7 1.0 0.8 0.8 1.0
p.m. Environmental taxes2 2.2 2.7 2.1 2.0 2.3 2.4
VAT efficiency3
Actual VAT revenues as % of theoretical revenues at standard rate 49.0 59.5 63.7 49.2 38.0 42.8
Source: Commission
3 The VAT efficiency is measured via the VAT revenue ratio. The VAT revenue ratio is defined as the ratio between the actual VAT revenue collected and the revenue
that would theoretically be raised if VAT was applied at the standard rate to all final consumption. A low ratio can indicate a reduction of the tax base due to large
exemptions or the application of reduced rates to a wide range of goods and services ('policy gap') or a failure to collect all tax due to e.g. fraud ('collection gap'). See
European Commission (2011), Tax reforms in EU Member States, European Economy 5/2011, for a more detailed explanation.
2 This category comprises taxes on energy, transport and pollution and resources included in taxes on consumption and capital.
1 Tax revenues are broken down by economic function, i.e. according to whether taxes are raised on consumption, labour or capital. See European Commission (2012),
Taxation trends in the European Union, for a more detailed explanation.
Note:
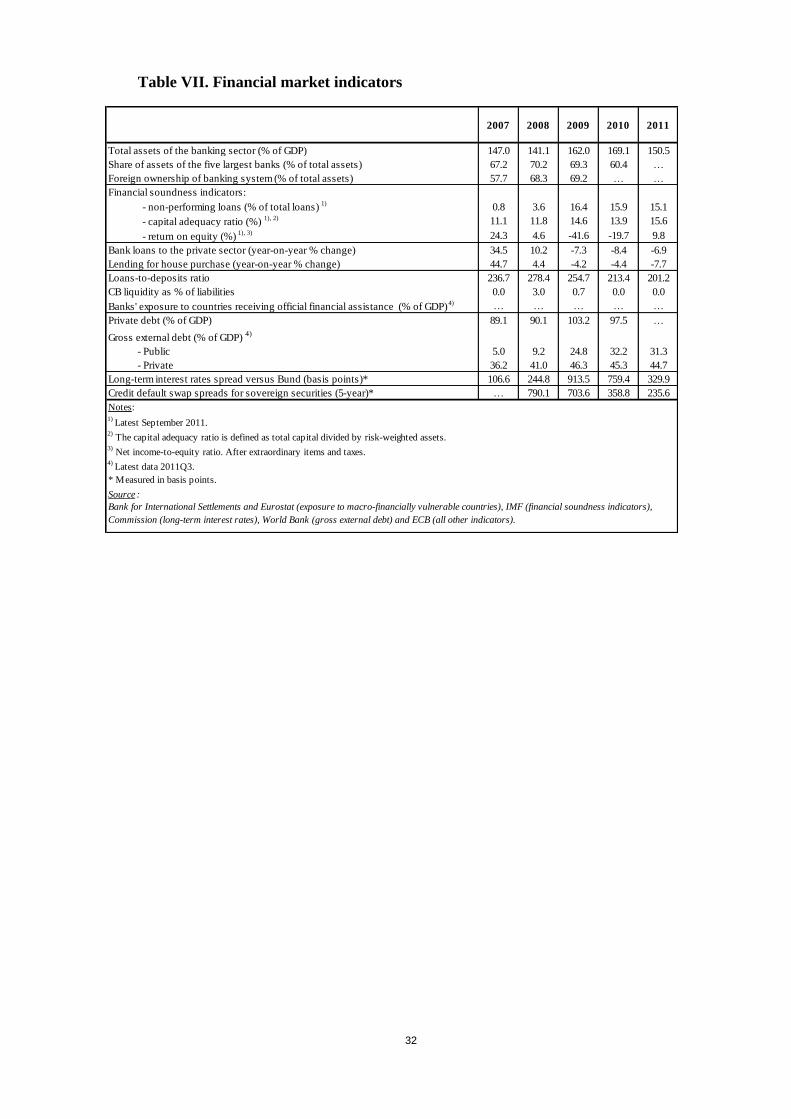
32
Table VII. Financial market indicators
2007 2008 2009 2010 2011
Total assets of the banking sector (% of GDP) 147.0 141.1 162.0 169.1 150.5
Share of assets of the five largest banks (% of total assets) 67.2 70.2 69.3 60.4 …
Foreign ownership of banking system (% of total assets) 57.7 68.3 69.2 … …
Financial soundness indicators:
- non-performing loans (% of total loans) 1)
0.8 3.6 16.4 15.9 15.1
- capital adequacy ratio (%) 1), 2) 11.1 11.8 14.6 13.9 15.6
- return on equity (%) 1), 3) 24.3 4.6 -41.6 -19.7 9.8
Bank loans to the private sector (year-on-year % change) 34.5 10.2 -7.3 -8.4 -6.9
Lending for house purchase (year-on-year % change) 44.7 4.4 -4.2 -4.4 -7.7
Loans-to-deposits ratio 236.7 278.4 254.7 213.4 201.2
CB liquidity as % of liabilities 0.0 3.0 0.7 0.0 0.0
Banks' exposure to countries receiving official financial assistance (% of GDP)4) … … … … …
Private debt (% of GDP) 89.1 90.1 103.2 97.5 …
Gross external debt (% of GDP) 4)
- Public 5.0 9.2 24.8 32.2 31.3
- Private 36.2 41.0 46.3 45.3 44.7
Long-term interest rates spread versus Bund (basis points)* 106.6 244.8 913.5 759.4 329.9
Credit default swap spreads for sovereign securities (5-year)* … 790.1 703.6 358.8 235.6
4) Latest data 2011Q3.
* Measured in basis points.
Source :
Notes: 1)
Latest September 2011.
Bank for International Settlements and Eurostat (exposure to macro-financially vulnerable countries), IMF (financial soundness indicators),
Commission (long-term interest rates), World Bank (gross external debt) and ECB (all other indicators).
2) The capital adequacy ratio is defined as total capital divided by risk-weighted assets.
3) Net income-to-equity ratio. After extraordinary items and taxes.
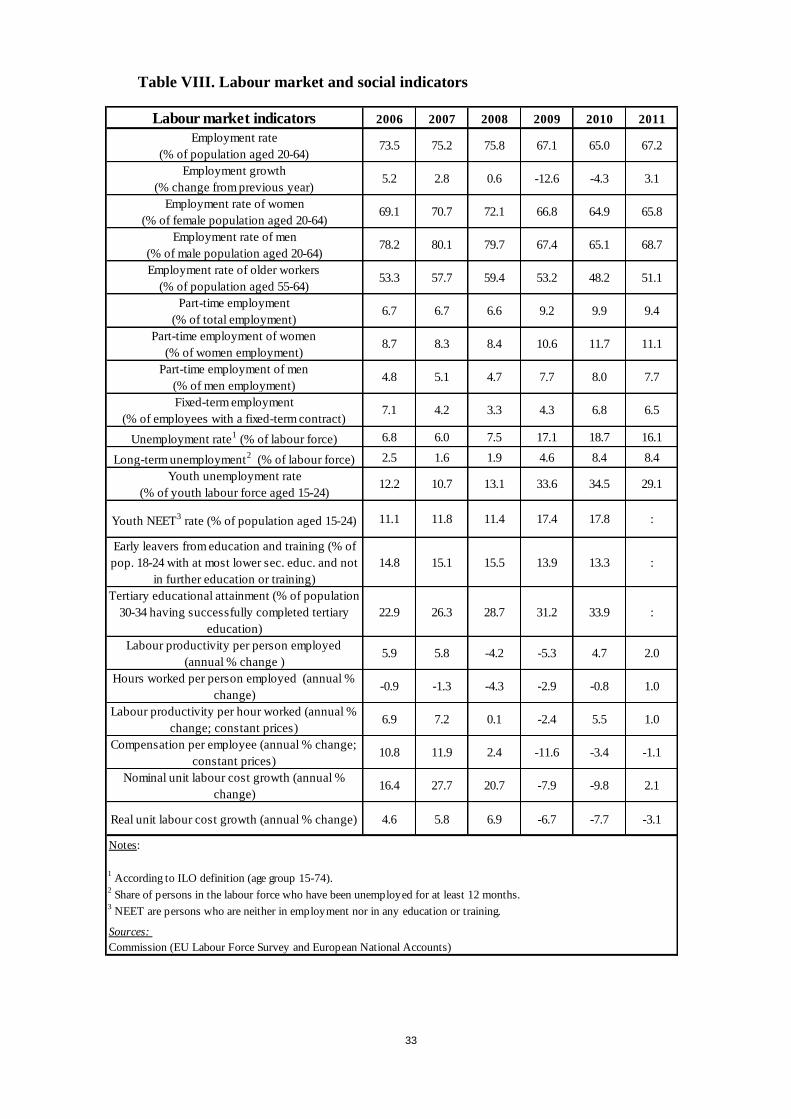
33
Table VIII. Labour market and social indicators
Labour market indicators 2006 2007 2008 2009 2010 2011
Employment rate
(% of population aged 20-64)73.5 75.2 75.8 67.1 65.0 67.2
Employment growth
(% change from previous year)5.2 2.8 0.6 -12.6 -4.3 3.1
Employment rate of women
(% of female population aged 20-64)69.1 70.7 72.1 66.8 64.9 65.8
Employment rate of men
(% of male population aged 20-64)78.2 80.1 79.7 67.4 65.1 68.7
Employment rate of older workers
(% of population aged 55-64)53.3 57.7 59.4 53.2 48.2 51.1
Part-time employment
(% of total employment)6.7 6.7 6.6 9.2 9.9 9.4
Part-time employment of women
(% of women employment)8.7 8.3 8.4 10.6 11.7 11.1
Part-time employment of men
(% of men employment)4.8 5.1 4.7 7.7 8.0 7.7
Fixed-term employment
(% of employees with a fixed-term contract)7.1 4.2 3.3 4.3 6.8 6.5
Unemployment rate1 (% of labour force) 6.8 6.0 7.5 17.1 18.7 16.1
Long-term unemployment2 (% of labour force) 2.5 1.6 1.9 4.6 8.4 8.4
Youth unemployment rate
(% of youth labour force aged 15-24)12.2 10.7 13.1 33.6 34.5 29.1
Youth NEET3 rate (% of population aged 15-24) 11.1 11.8 11.4 17.4 17.8 :
Early leavers from education and training (% of
pop. 18-24 with at most lower sec. educ. and not
in further education or training)
14.8 15.1 15.5 13.9 13.3 :
Tertiary educational attainment (% of population
30-34 having successfully completed tertiary
education)
22.9 26.3 28.7 31.2 33.9 :
Labour productivity per person employed
(annual % change )5.9 5.8 -4.2 -5.3 4.7 2.0
Hours worked per person employed (annual %
change)-0.9 -1.3 -4.3 -2.9 -0.8 1.0
Labour productivity per hour worked (annual %
change; constant prices)6.9 7.2 0.1 -2.4 5.5 1.0
Compensation per employee (annual % change;
constant prices)10.8 11.9 2.4 -11.6 -3.4 -1.1
Nominal unit labour cost growth (annual %
change)16.4 27.7 20.7 -7.9 -9.8 2.1
Real unit labour cost growth (annual % change) 4.6 5.8 6.9 -6.7 -7.7 -3.1
2 Share of persons in the labour force who have been unemployed for at least 12 months.
3 NEET are persons who are neither in employment nor in any education or training.
Sources:
Commission (EU Labour Force Survey and European National Accounts)
1 According to ILO definition (age group 15-74).
Notes:
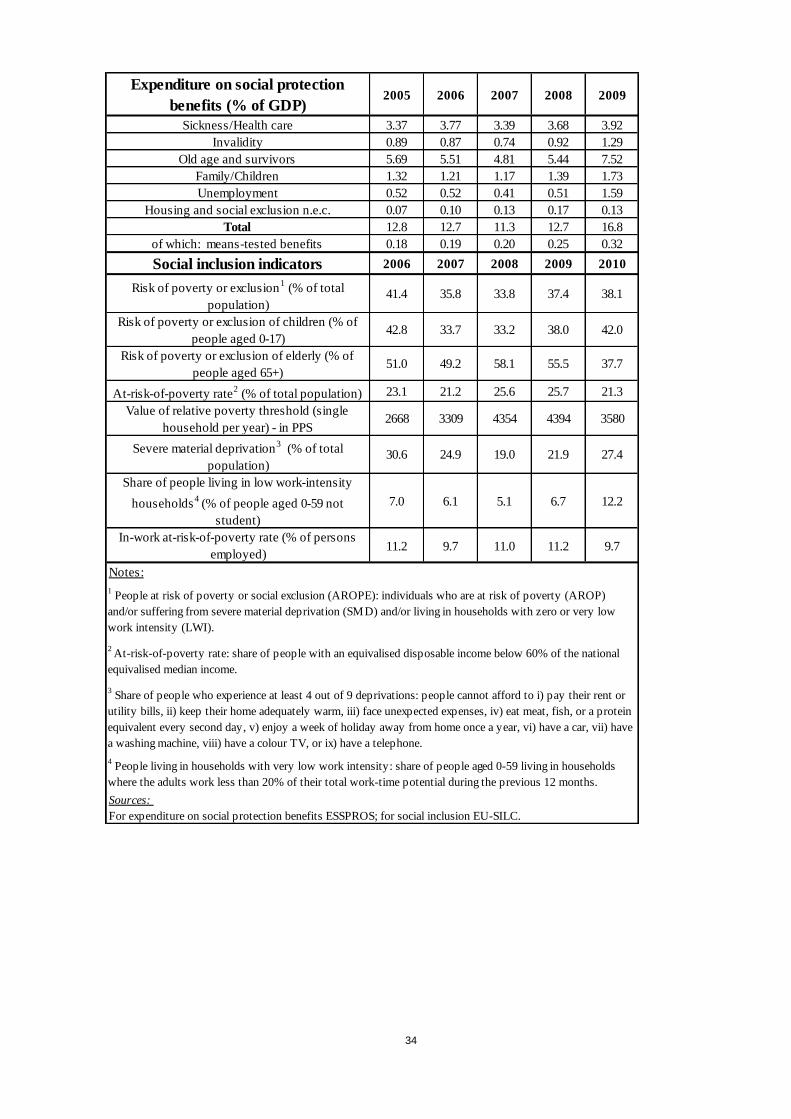
34
Expenditure on social protection
benefits (% of GDP)2005 2006 2007 2008 2009
Sickness/Health care 3.37 3.77 3.39 3.68 3.92
Invalidity 0.89 0.87 0.74 0.92 1.29
Old age and survivors 5.69 5.51 4.81 5.44 7.52
Family/Children 1.32 1.21 1.17 1.39 1.73
Unemployment 0.52 0.52 0.41 0.51 1.59
Housing and social exclusion n.e.c. 0.07 0.10 0.13 0.17 0.13
Total 12.8 12.7 11.3 12.7 16.8
of which: means-tested benefits 0.18 0.19 0.20 0.25 0.32
Social inclusion indicators 2006 2007 2008 2009 2010
Risk of poverty or exclusion1 (% of total
population)41.4 35.8 33.8 37.4 38.1
Risk of poverty or exclusion of children (% of
people aged 0-17)42.8 33.7 33.2 38.0 42.0
Risk of poverty or exclusion of elderly (% of
people aged 65+)51.0 49.2 58.1 55.5 37.7
At-risk-of-poverty rate2 (% of total population) 23.1 21.2 25.6 25.7 21.3
Value of relative poverty threshold (single
household per year) - in PPS2668 3309 4354 4394 3580
Severe material deprivation3 (% of total
population)30.6 24.9 19.0 21.9 27.4
Share of people living in low work-intensity
households4
(% of people aged 0-59 not
student)
7.0 6.1 5.1 6.7 12.2
In-work at-risk-of-poverty rate (% of persons
employed)11.2 9.7 11.0 11.2 9.7
Sources:
For expenditure on social protection benefits ESSPROS; for social inclusion EU-SILC.
Notes:
1 People at risk of poverty or social exclusion (AROPE): individuals who are at risk of poverty (AROP)
and/or suffering from severe material deprivation (SMD) and/or living in households with zero or very low
work intensity (LWI).
2 At-risk-of-poverty rate: share of people with an equivalised disposable income below 60% of the national
equivalised median income.
3 Share of people who experience at least 4 out of 9 deprivations: people cannot afford to i) pay their rent or
utility bills, ii) keep their home adequately warm, iii) face unexpected expenses, iv) eat meat, fish, or a protein
equivalent every second day, v) enjoy a week of holiday away from home once a year, vi) have a car, vii) have
a washing machine, viii) have a colour TV, or ix) have a telephone.
4 People living in households with very low work intensity: share of people aged 0-59 living in households
where the adults work less than 20% of their total work-time potential during the previous 12 months.
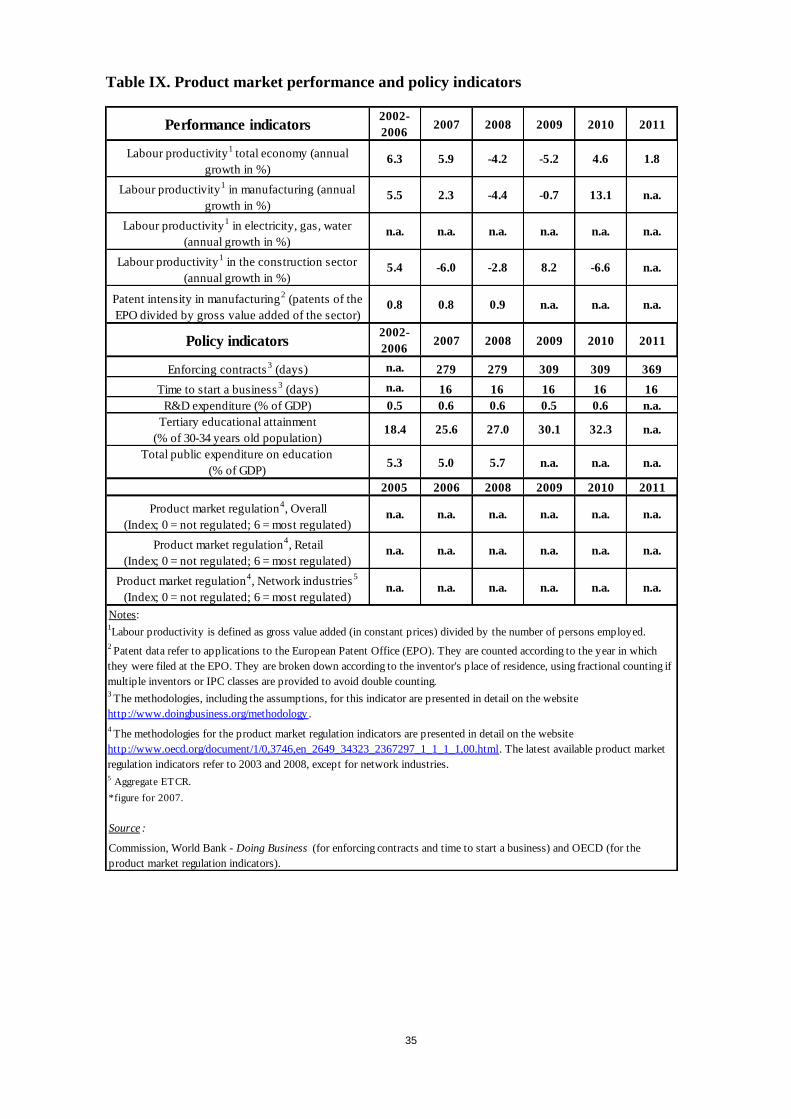
35
Table IX. Product market performance and policy indicators
Performance indicators2002-
20062007 2008 2009 2010 2011
Labour productivity1
total economy (annual
growth in %)6.3 5.9 -4.2 -5.2 4.6 1.8
Labour productivity1 in manufacturing (annual
growth in %)5.5 2.3 -4.4 -0.7 13.1 n.a.
Labour productivity1 in electricity, gas, water
(annual growth in %)n.a. n.a. n.a. n.a. n.a. n.a.
Labour productivity1 in the construction sector
(annual growth in %)5.4 -6.0 -2.8 8.2 -6.6 n.a.
Patent intensity in manufacturing2 (patents of the
EPO divided by gross value added of the sector)0.8 0.8 0.9 n.a. n.a. n.a.
Policy indicators2002-
20062007 2008 2009 2010 2011
Enforcing contracts3 (days) n.a. 279 279 309 309 369
Time to start a business3 (days) n.a. 16 16 16 16 16
R&D expenditure (% of GDP) 0.5 0.6 0.6 0.5 0.6 n.a.
Tertiary educational attainment
(% of 30-34 years old population)18.4 25.6 27.0 30.1 32.3 n.a.
Total public expenditure on education
(% of GDP)5.3 5.0 5.7 n.a. n.a. n.a.
2005 2006 2008 2009 2010 2011
Product market regulation4, Overall
(Index; 0 = not regulated; 6 = most regulated)n.a. n.a. n.a. n.a. n.a. n.a.
Product market regulation4, Retail
(Index; 0 = not regulated; 6 = most regulated)n.a. n.a. n.a. n.a. n.a. n.a.
Product market regulation4, Network industries
5
(Index; 0 = not regulated; 6 = most regulated)n.a. n.a. n.a. n.a. n.a. n.a.
2 Patent data refer to applications to the European Patent Office (EPO). They are counted according to the year in which
they were filed at the EPO. They are broken down according to the inventor's place of residence, using fractional counting if
multiple inventors or IPC classes are provided to avoid double counting. 3
The methodologies, including the assumptions, for this indicator are presented in detail on the website
http://www.doingbusiness.org/methodology .
4 The methodologies for the product market regulation indicators are presented in detail on the website
http://www.oecd.org/document/1/0,3746,en_2649_34323_2367297_1_1_1_1,00.html. The latest available product market
regulation indicators refer to 2003 and 2008, except for network industries.
Source :
Commission, World Bank - Doing Business (for enforcing contracts and time to start a business) and OECD (for the
product market regulation indicators).
5 Aggregate ETCR.
*figure for 2007.
Notes:1Labour productivity is defined as gross value added (in constant prices) divided by the number of persons employed.
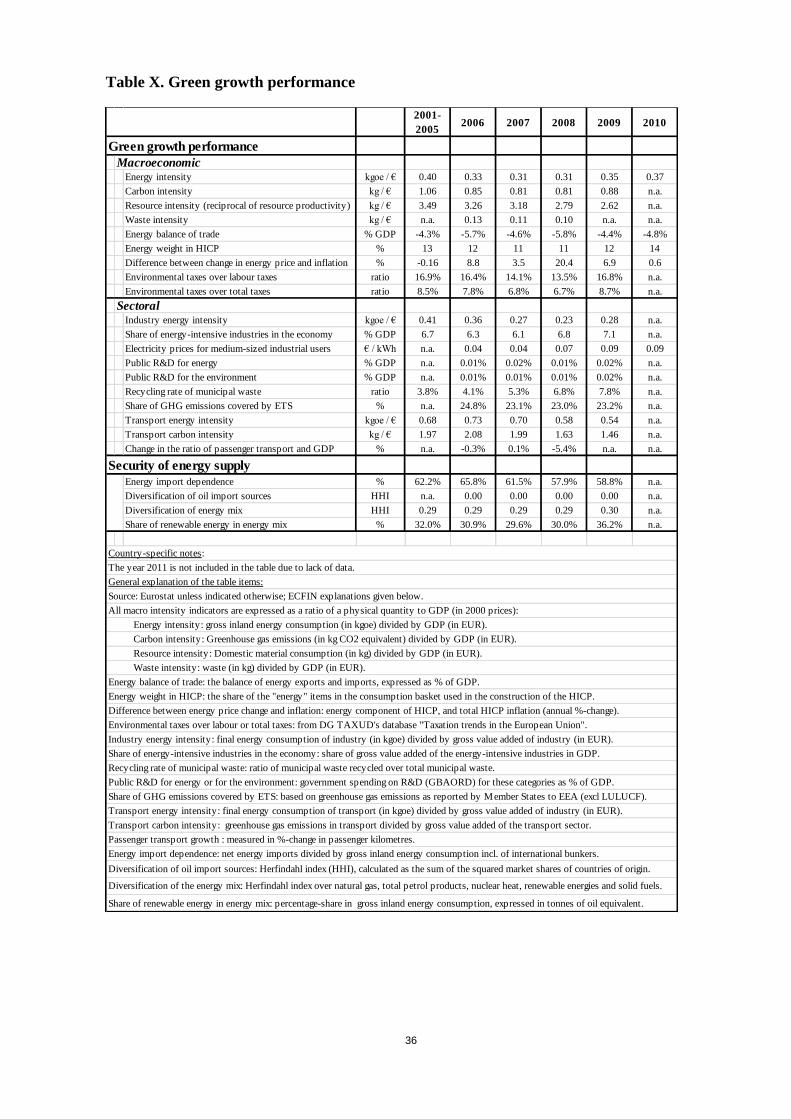
36
Table X. Green growth performance
2001-
20052006 2007 2008 2009 2010
Energy intensity kgoe / € 0.40 0.33 0.31 0.31 0.35 0.37
Carbon intensity kg / € 1.06 0.85 0.81 0.81 0.88 n.a.
Resource intensity (reciprocal of resource productivity) kg / € 3.49 3.26 3.18 2.79 2.62 n.a.
Waste intensity kg / € n.a. 0.13 0.11 0.10 n.a. n.a.
Energy balance of trade % GDP -4.3% -5.7% -4.6% -5.8% -4.4% -4.8%
Energy weight in HICP % 13 12 11 11 12 14
Difference between change in energy price and inflation % -0.16 8.8 3.5 20.4 6.9 0.6
Environmental taxes over labour taxes ratio 16.9% 16.4% 14.1% 13.5% 16.8% n.a.
Environmental taxes over total taxes ratio 8.5% 7.8% 6.8% 6.7% 8.7% n.a.
Industry energy intensity kgoe / € 0.41 0.36 0.27 0.23 0.28 n.a.
Share of energy-intensive industries in the economy % GDP 6.7 6.3 6.1 6.8 7.1 n.a.
Electricity prices for medium-sized industrial users € / kWh n.a. 0.04 0.04 0.07 0.09 0.09
Public R&D for energy % GDP n.a. 0.01% 0.02% 0.01% 0.02% n.a.
Public R&D for the environment % GDP n.a. 0.01% 0.01% 0.01% 0.02% n.a.
Recycling rate of municipal waste ratio 3.8% 4.1% 5.3% 6.8% 7.8% n.a.
Share of GHG emissions covered by ETS % n.a. 24.8% 23.1% 23.0% 23.2% n.a.
Transport energy intensity kgoe / € 0.68 0.73 0.70 0.58 0.54 n.a.
Transport carbon intensity kg / € 1.97 2.08 1.99 1.63 1.46 n.a.
Change in the ratio of passenger transport and GDP % n.a. -0.3% 0.1% -5.4% n.a. n.a.
Energy import dependence % 62.2% 65.8% 61.5% 57.9% 58.8% n.a.
Diversification of oil import sources HHI n.a. 0.00 0.00 0.00 0.00 n.a.
Diversification of energy mix HHI 0.29 0.29 0.29 0.29 0.30 n.a.
Share of renewable energy in energy mix % 32.0% 30.9% 29.6% 30.0% 36.2% n.a.
The year 2011 is not included in the table due to lack of data.
Difference between energy price change and inflation: energy component of HICP, and total HICP inflation (annual %-change).
All macro intensity indicators are expressed as a ratio of a physical quantity to GDP (in 2000 prices):
Energy intensity: gross inland energy consumption (in kgoe) divided by GDP (in EUR).
Green growth performance
Macroeconomic
Sectoral
Security of energy supply
Country-specific notes:
Diversification of oil import sources: Herfindahl index (HHI), calculated as the sum of the squared market shares of countries of origin.
General explanation of the table items:
Source: Eurostat unless indicated otherwise; ECFIN explanations given below.
Public R&D for energy or for the environment: government spending on R&D (GBAORD) for these categories as % of GDP.
Share of GHG emissions covered by ETS: based on greenhouse gas emissions as reported by Member States to EEA (excl LULUCF).
Carbon intensity: Greenhouse gas emissions (in kg CO2 equivalent) divided by GDP (in EUR).
Resource intensity: Domestic material consumption (in kg) divided by GDP (in EUR).
Waste intensity: waste (in kg) divided by GDP (in EUR).
Energy balance of trade: the balance of energy exports and imports, expressed as % of GDP.
Energy weight in HICP: the share of the "energy" items in the consumption basket used in the construction of the HICP.
Diversification of the energy mix: Herfindahl index over natural gas, total petrol products, nuclear heat, renewable energies and solid fuels.
Environmental taxes over labour or total taxes: from DG TAXUD's database "Taxation trends in the European Union".
Industry energy intensity: final energy consumption of industry (in kgoe) divided by gross value added of industry (in EUR).
Share of energy-intensive industries in the economy: share of gross value added of the energy-intensive industries in GDP.
Recycling rate of municipal waste: ratio of municipal waste recycled over total municipal waste.
Share of renewable energy in energy mix: percentage-share in gross inland energy consumption, expressed in tonnes of oil equivalent.
Transport energy intensity: final energy consumption of transport (in kgoe) divided by gross value added of industry (in EUR).
Transport carbon intensity: greenhouse gas emissions in transport divided by gross value added of the transport sector.
Passenger transport growth : measured in %-change in passenger kilometres.
Energy import dependence: net energy imports divided by gross inland energy consumption incl. of international bunkers.
Recommended