Cost Management Cost Management
learning objectives
cost/volume/profit (CVP) relationships and break-even analysis
break-even chart – low fixed costs, high variable costs
break-even chart – high fixed costs, low variable costs
contribution break-even chart
profit volume (PV) chart
Session Summary (1) Session Summary (1)
CVP and break-even analysis
limitations of CVP and break-even analysis
multiple product break-even analysis
estimated UK labour costs % of manufacturing costs activity based costing (ABC)
framework of activity based costing (ABC) throughput accounting (TA)
Session Summary (2) Session Summary (2)
throughput report
life cycle costing
target costing
benchmarking
kaizen
cost of quality (COQ)
non financial indicators
balanced scorecard
Session Summary (3) Session Summary (3)
explain cost/volume/profit (CVP) relationships andbreak-even analysis
identify the limitations of CVP analysis
outline the more recently developed techniques of activity based costing (ABC), and throughput accounting (TA)
identify the conditions appropriate to the use of life cycle costing
Learning Objectives (1) Learning Objectives (1)
apply the principles of target costing
consider benchmarking as a technique to identify best practice and enable the introduction of appropriate performance improvement targets outline kaizen as technique for continuous improvementof all aspects of business performance
explain the types of information and measurements used in lean accounting
Learning Objectives (2) Learning Objectives (2)
use cost of quality (COQ) to identify areas for improvement and cost reduction within each of the processes throughout the business
appreciate the importance of, and consider the use of both financial and non-financial indicators in the evaluation of business performance
consider the use of both financial and non-financial measures incorporated into performance measurement systems such as the balanced scorecard
Learning Objectives (3) Learning Objectives (3)
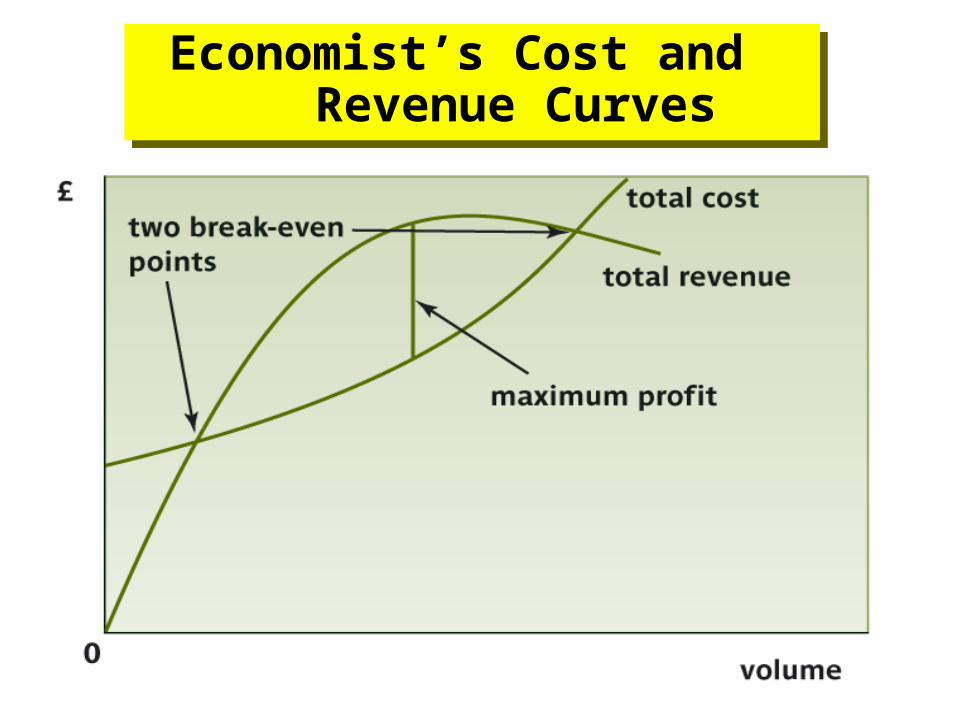
Economist’s Cost and Revenue Curves
Economist’s Cost and Revenue Curves
Cost/volume/profit (CVP) analysis may be used
to determine the break-even position of a business
to provide sensitivity analyses on the impact on the business of changes to any of the variables used to calculate break-even the break-even point is the level of activity at whichthere is neither profit nor loss
Cost/Volume/Profit (CVP) Relationships
and Break-Even Analysis (1)
Cost/Volume/Profit (CVP) Relationships
and Break-Even Analysis (1)
There are three fundamental cost/revenue relationships that form the basis of CVP analysis
total costs = variable costs + fixed costs contribution = total revenue - variable costs profit (or operating income) = total revenue - total costs
the slopes of the total cost lines in the following twocharts represent the unit variable costs
Cost/Volume/Profit (CVP) Relationships
and Break-Even Analysis (2)
Cost/Volume/Profit (CVP) Relationships
and Break-Even Analysis (2)
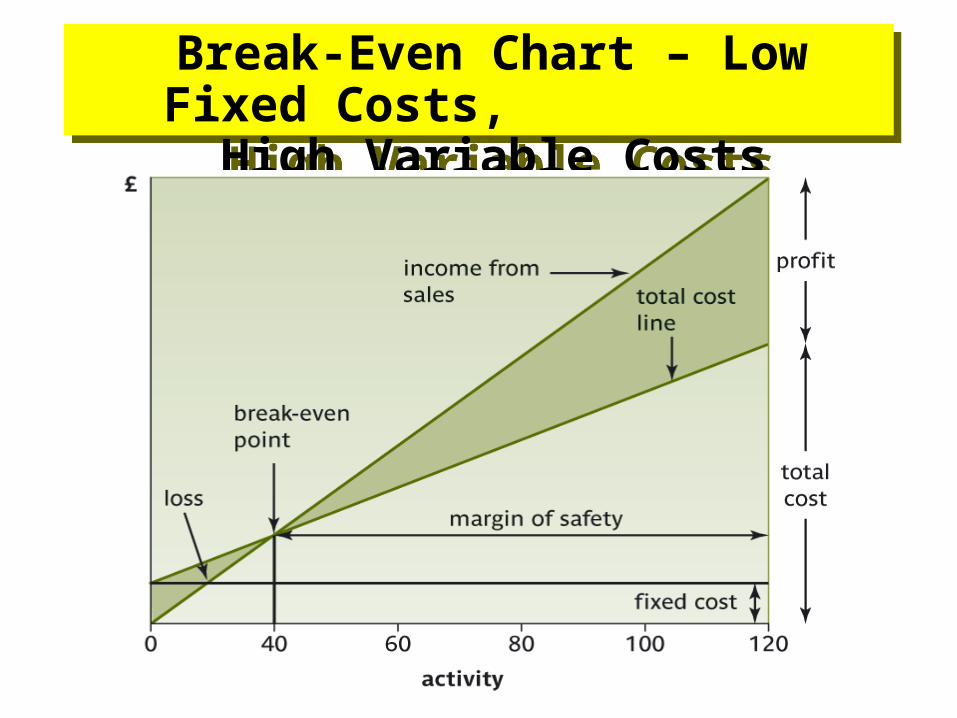
Break-Even Chart – Low Fixed Costs, High
Variable Costs
Break-Even Chart – Low Fixed Costs, High
Variable Costs
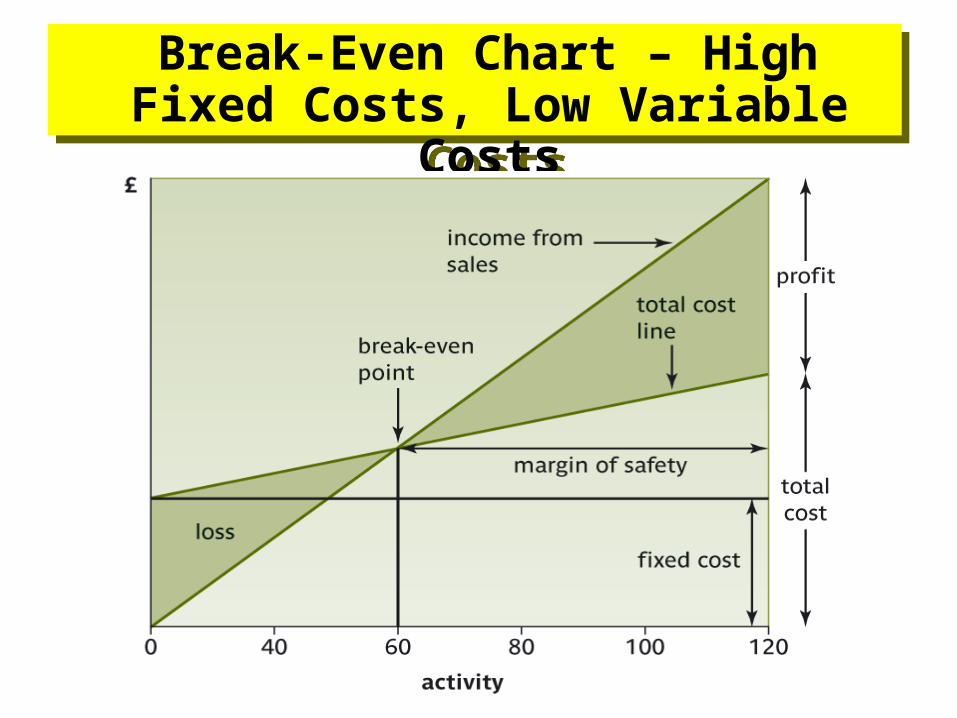
Break-Even Chart – High Fixed Costs, Low Variable
Costs
Break-Even Chart – High Fixed Costs, Low Variable
Costs
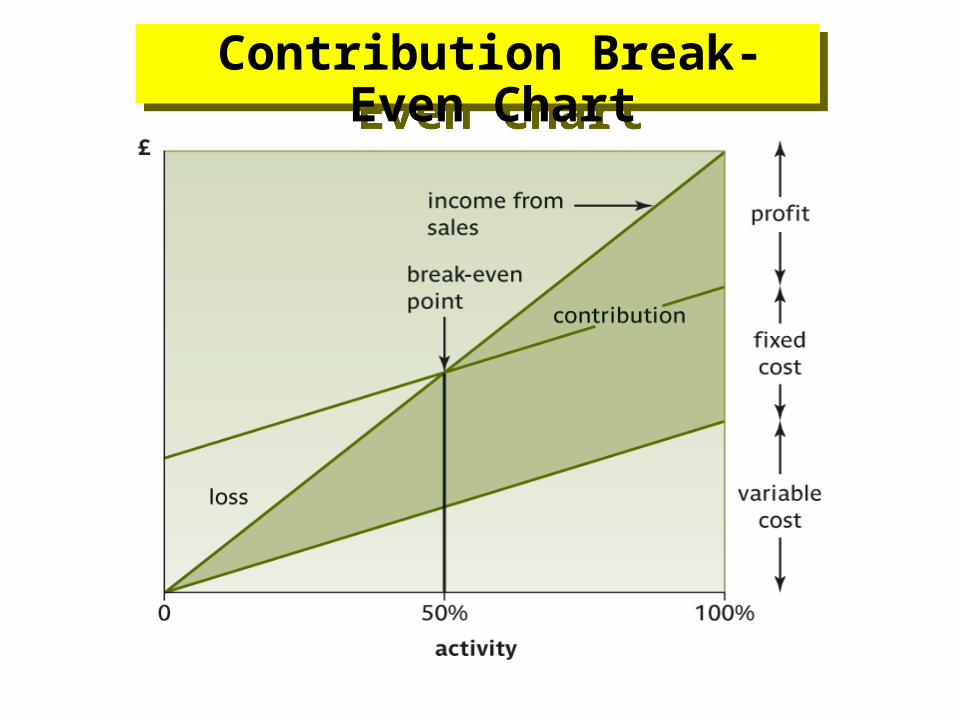
Contribution Break-Even Chart
Contribution Break-Even Chart
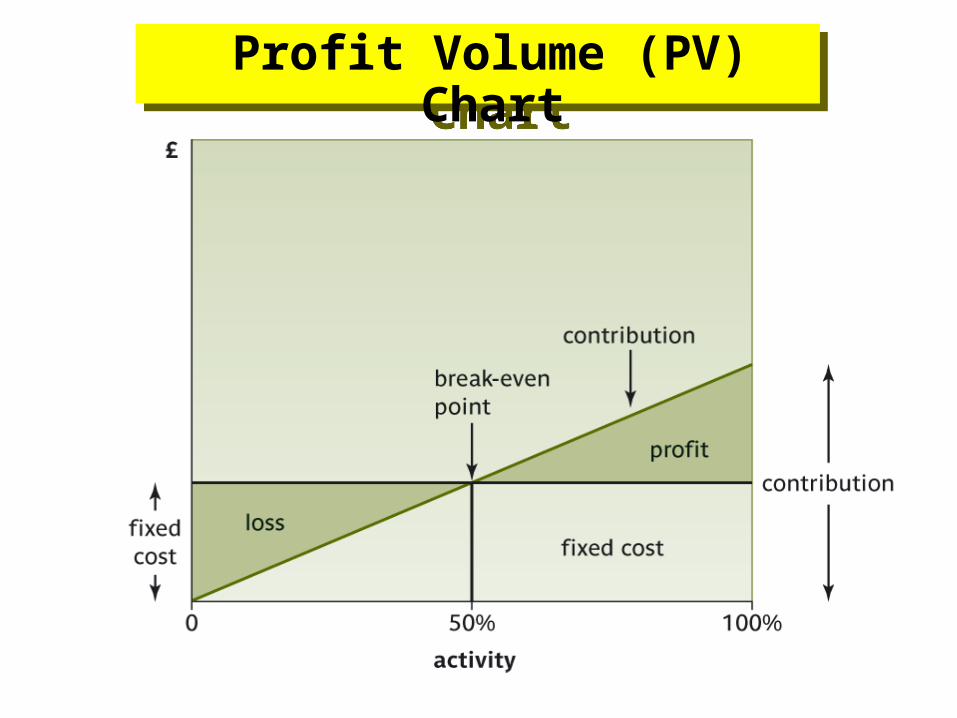
Profit Volume (PV) Chart
Profit Volume (PV) Chart
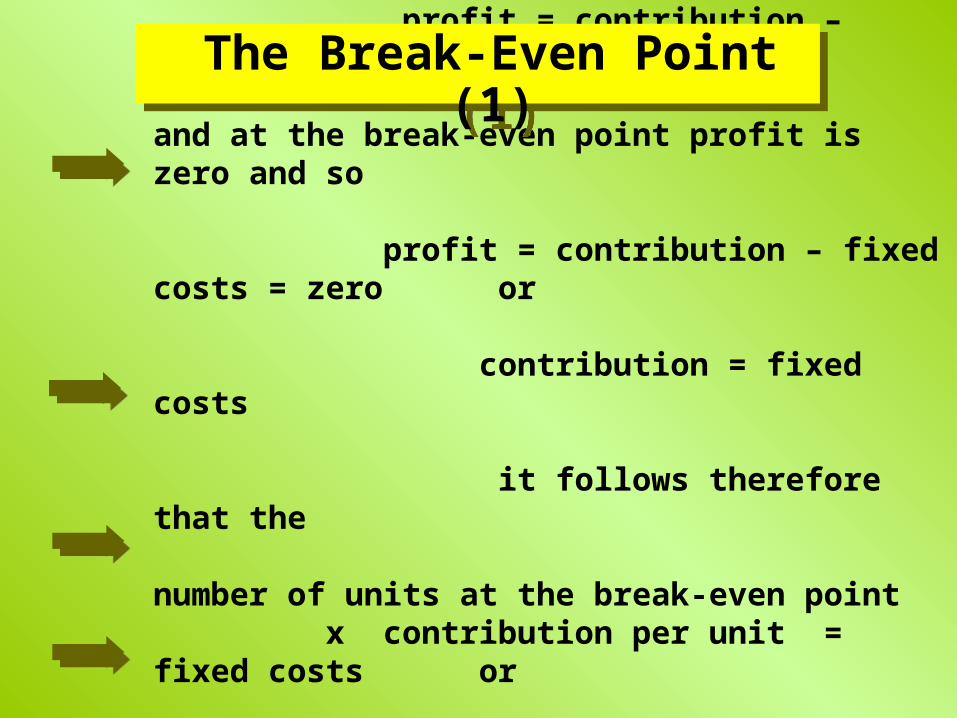
profit = contribution – fixed costs
and at the break-even point profit is zero and so profit = contribution – fixed costs = zero or
contribution = fixed costs
it follows therefore that the
number of units at the break-even point x contribution per unit = fixed costs or number of units at break-even = fixed costs contribution per unit
The Break-Even Point (1)
The Break-Even Point (1)
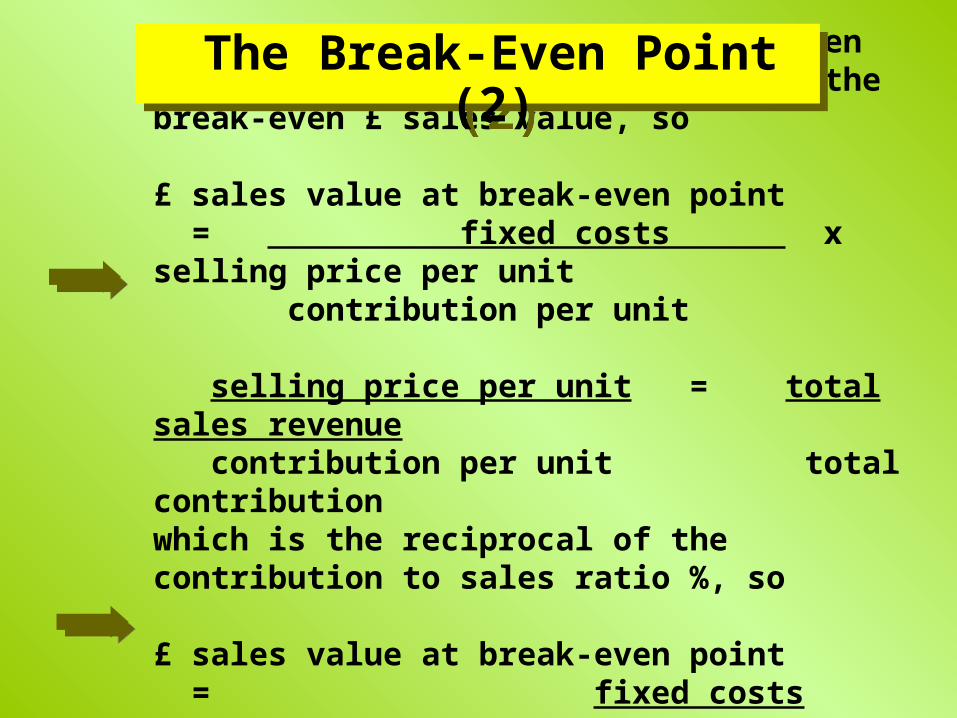
The number of units at the break-even point x selling price per unit is the break-even £ sales value, so £ sales value at break-even point = fixed costs x selling price per unit contribution per unit
selling price per unit = total sales revenue contribution per unit total contribution which is the reciprocal of the contribution to sales ratio %, so £ sales value at break-even point = fixed costs
contribution to sales ratio %
The Break-Even Point (2)
The Break-Even Point (2)
the term ‘margin of safety’ is used to define thedifference between the break-even point and an anticipated or existing level of activity above that point
the margin of safety measures the extent to which anticipated or existing activity can fall before a profitable operation turns into a loss-making one
The Break-Even Point (3)
The Break-Even Point (3)
the many limitations to CVP analysis are related to the assumptions on which it is based to consider break-even, decision-making, or sales pricing
the main assumptions are:
output is the only factor affecting costscost and revenue behaviour is linearthere is a single productcosts are easily split into variable and fixed, which are constant within a given range
Limitations of CVP Analysis
Limitations of CVP Analysis
where a business offers a range of products or services, the weighted average contribution may be used to calculate the selling prices required to achieve targeted profit levels, and revised break-even volumes and sales values resulting from changes to variable costs and fixed costs
Multiple Product Break-Even Analysis Multiple Product
Break-Even Analysis
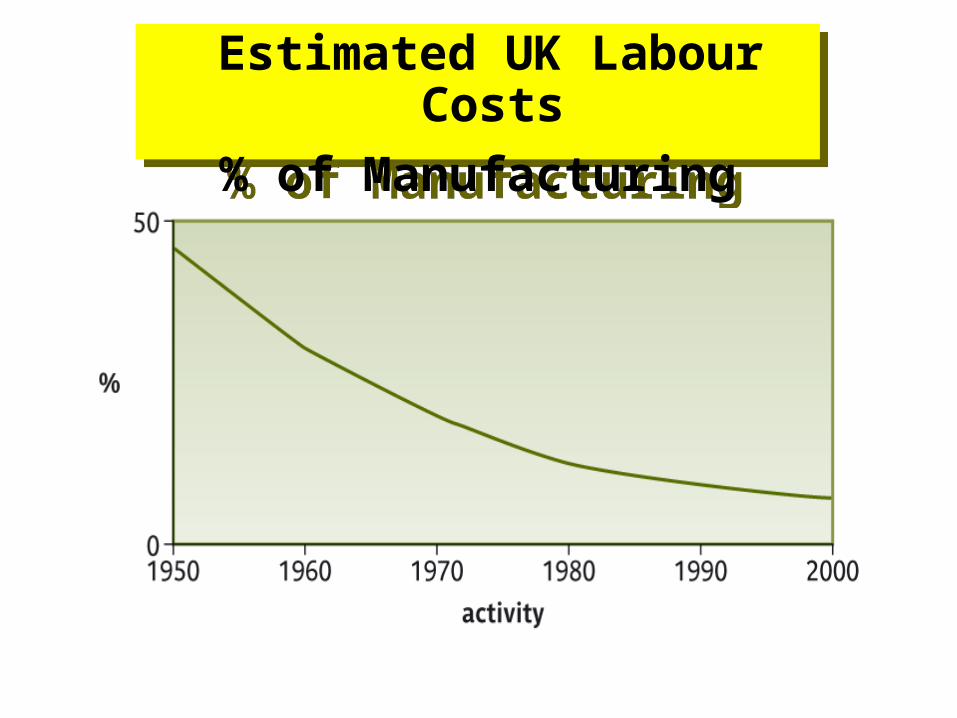
Estimated UK Labour Costs
% of Manufacturing Costs
Estimated UK Labour Costs
% of Manufacturing Costs
the more recently-developed techniques of activity based costing (ABC) and throughput accounting (TA) are approaches that attempt to overcome the problem of allocation and apportionment of overheads
Activity Based Costing (ABC)
Activity Based Costing (ABC)
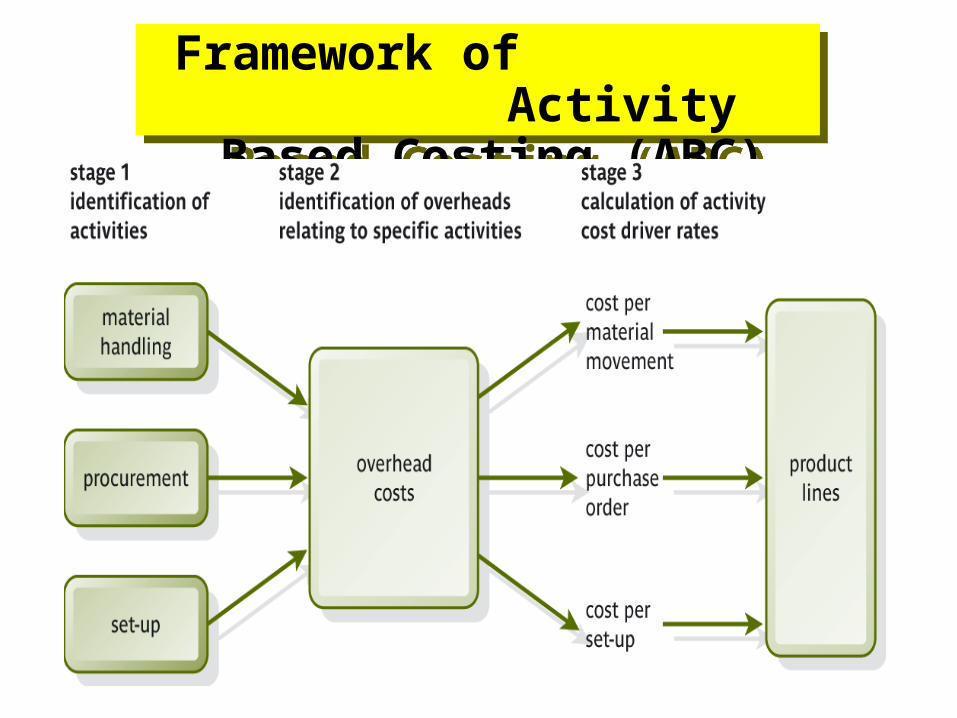
Framework of Activity Based Costing (ABC)
Framework of Activity Based Costing (ABC)
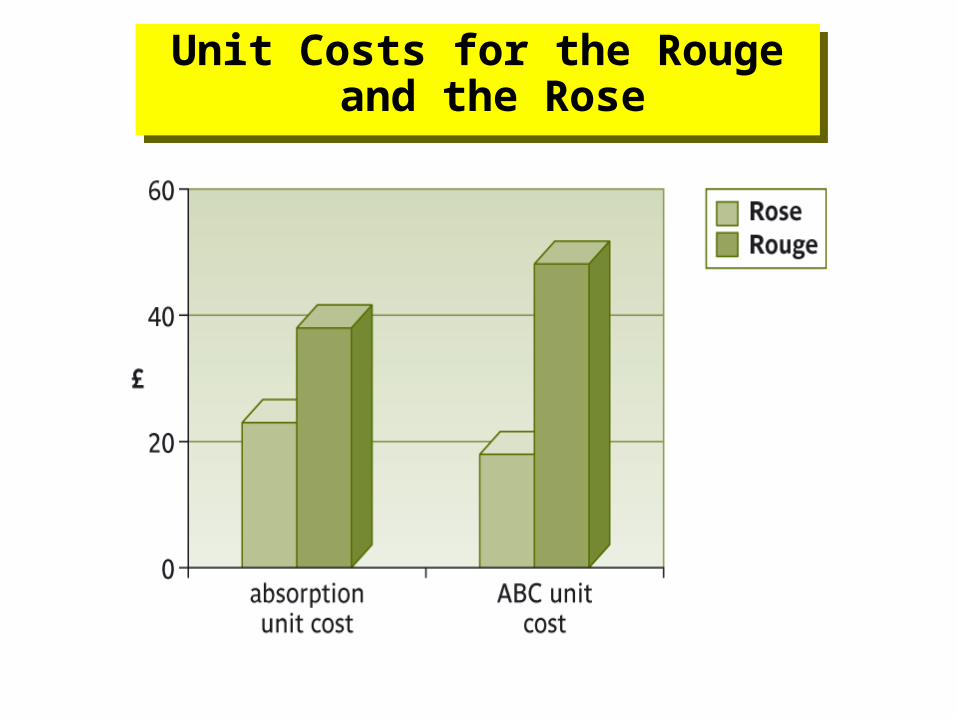
Unit Costs for the Rouge and the Rose
Unit Costs for the Rouge and the Rose
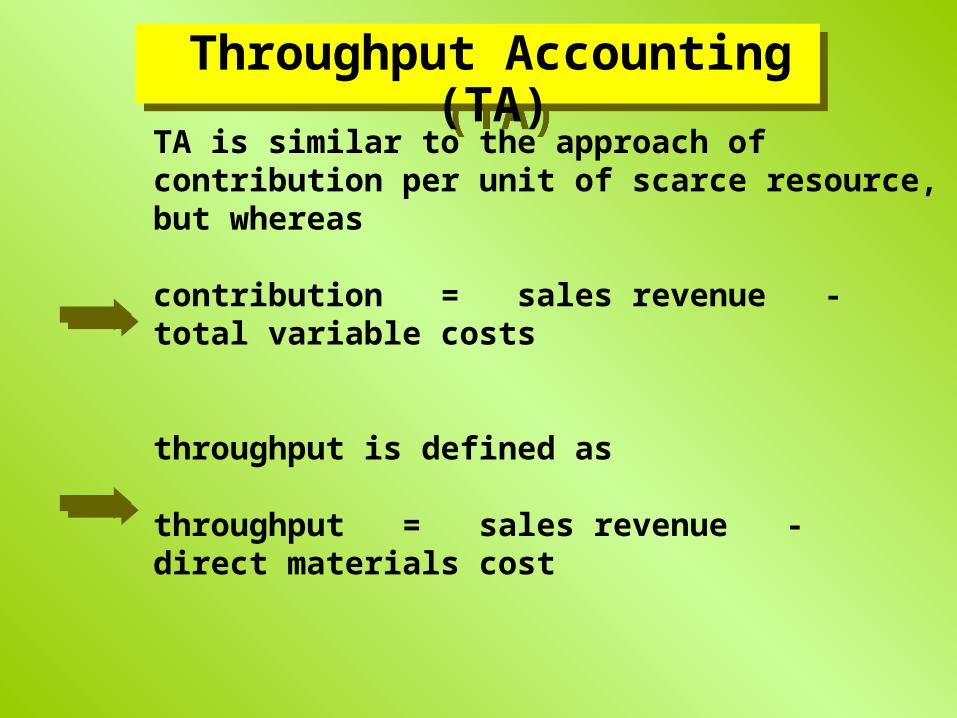
TA is similar to the approach of contribution per unit of scarce resource, but whereas contribution = sales revenue - total variable costs
throughput is defined as throughput = sales revenue - direct materials cost
Throughput Accounting (TA)
Throughput Accounting (TA)
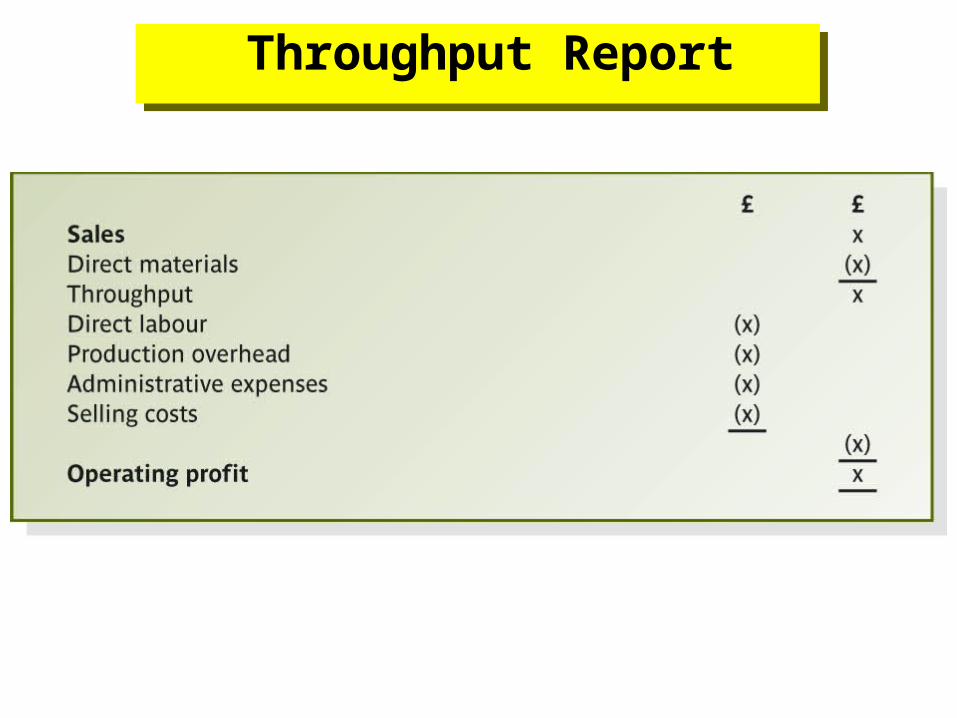
Throughput Report Throughput Report
life cycle costing uses maintenance of cost records over entire asset lives so that decisions regarding acquisitionor disposal may be made in a way that optimises asset usage at the lowest cost to the business
Life Cycle Costing Life Cycle Costing
a target cost is a product cost estimate that may be less than the planned initial product cost
the target cost will be expected to be achieved by the time the product reaches the mature production stage through
continuous improvement, and
replacement of technologies and processes
Target Costing (1) Target Costing (1)
a target cost is derived by subtracting a desired profit margin from a competitive market price, determined through
customer analysis
market research
Target Costing (2) Target Costing (2)
benchmarking processes of the best performing organisations within the industry, or within any other industry, can identify best practice, the adoption ofwhich may improve performance
Benchmarking Benchmarking
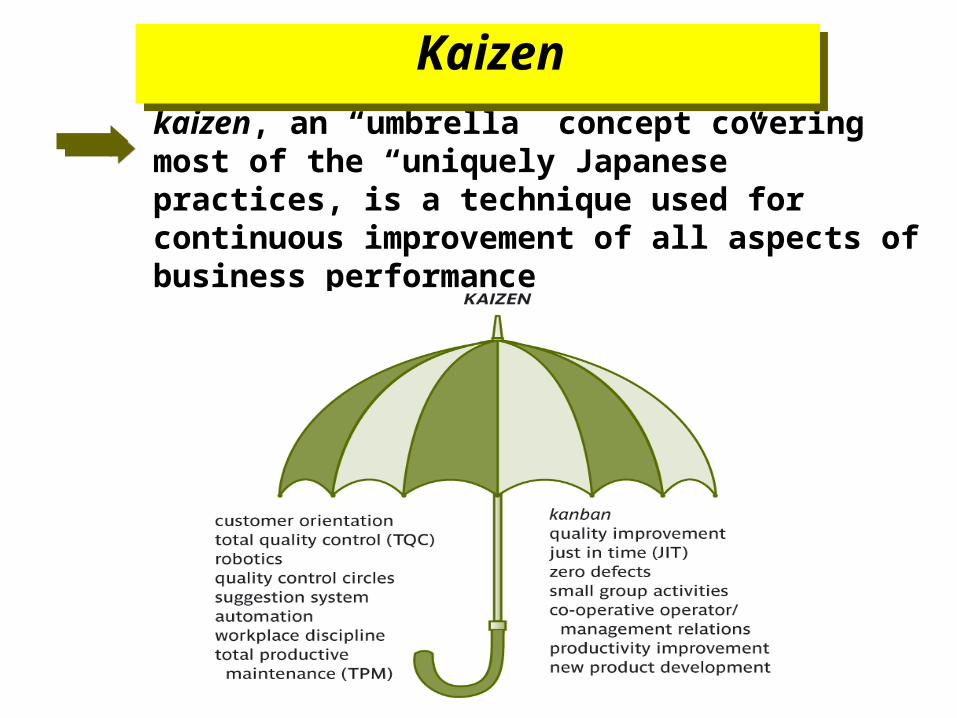
kaizen, an “umbrella” concept covering most of the “uniquely Japanese” practices, is a technique used for continuous improvement of all aspects of business performance
Kaizen Kaizen
Lean Accounting Lean Accounting
lean accounting provides the relevant information and measurements to support an organisation’s use of less resources to provide more output and in greater variety, and to encourage lean thinking throughout the organisation
lean accounting includes the use of target costing and value stream cost analysis
the strategic emphasis of lean accounting is on performance measurement that focuses on the elimination of waste and creation of capacity
cost of quality (COQ) is used to identify areas for improvement and cost reduction within each of the processes throughout the business
Cost of Quality (COQ) Cost of Quality (COQ)
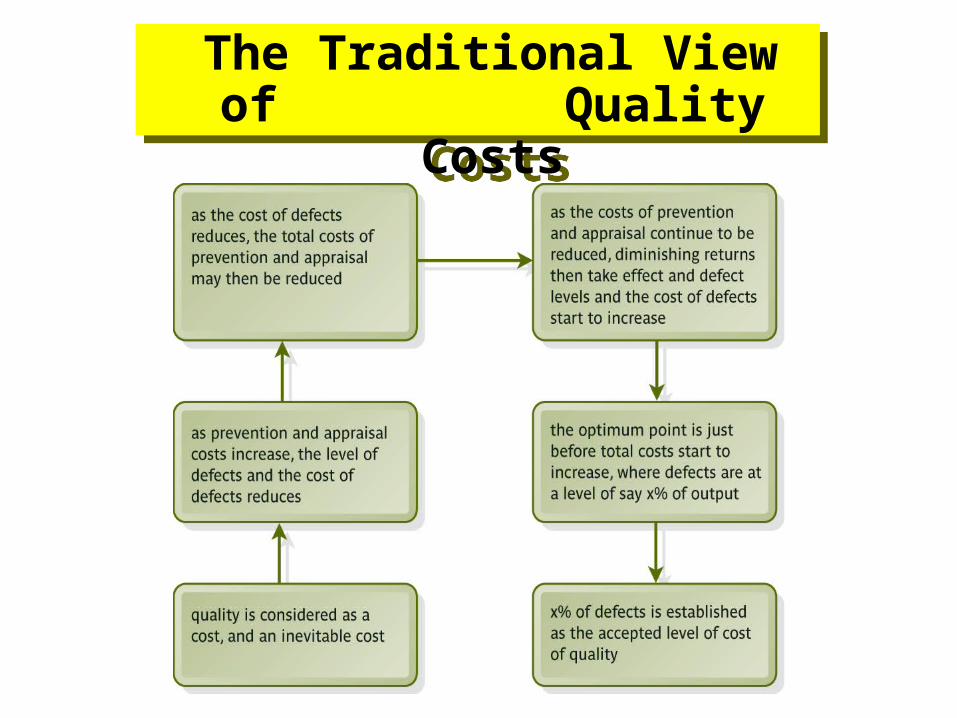
The Traditional View of Quality Costs
The Traditional View of Quality Costs
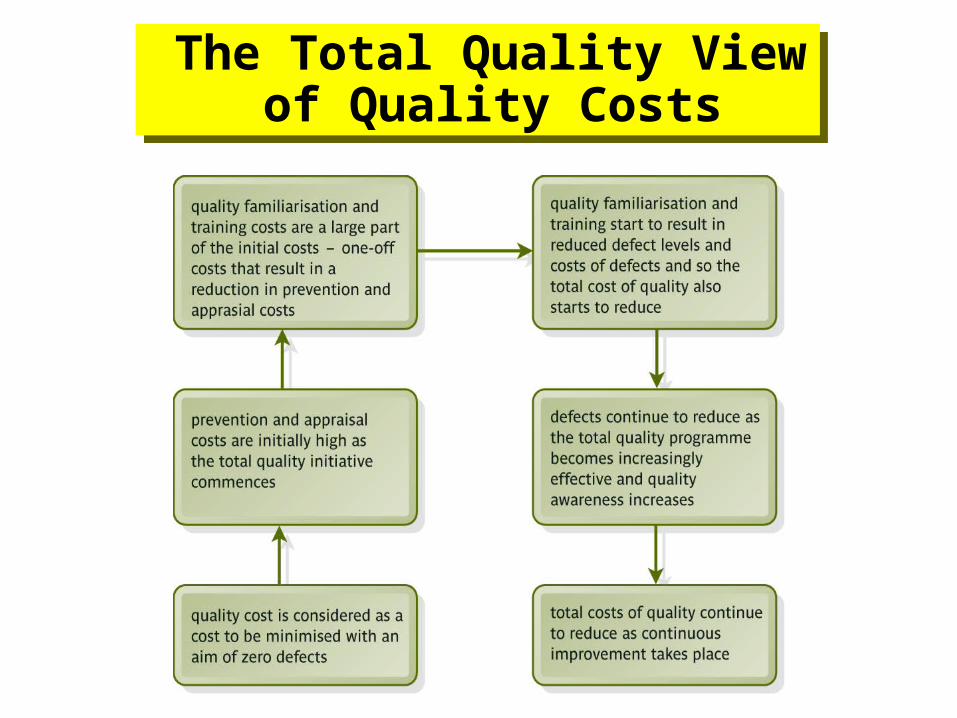
The Total Quality View of Quality Costs
The Total Quality View of Quality Costs
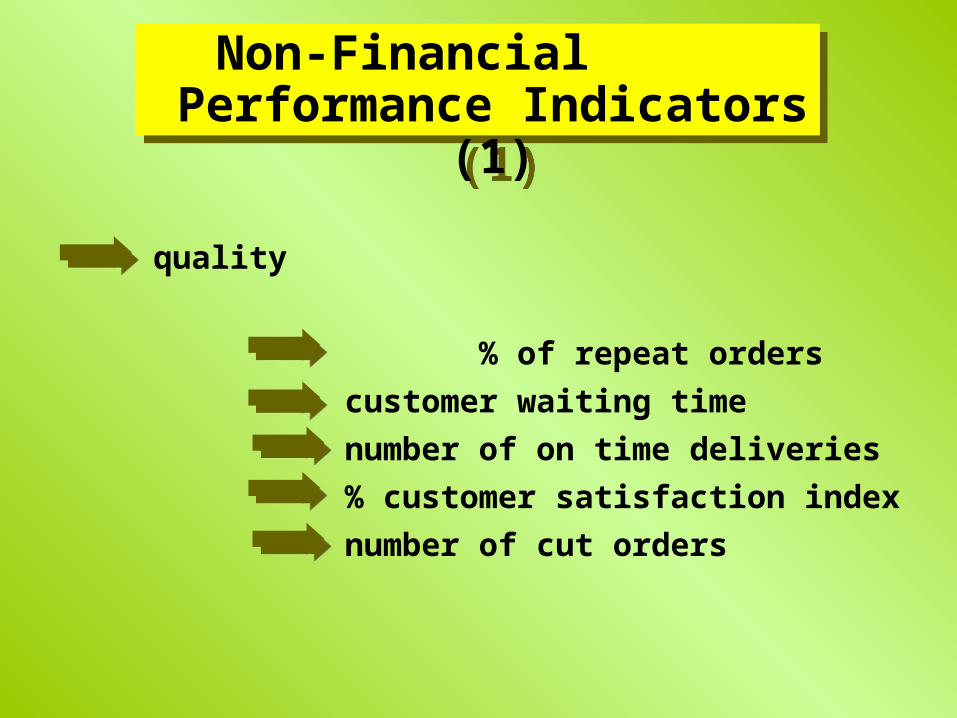
quality
% of repeat orders
customer waiting time
number of on time deliveries
% customer satisfaction index
number of cut orders
Non-Financial Performance Indicators (1)
Non-Financial Performance Indicators (1)
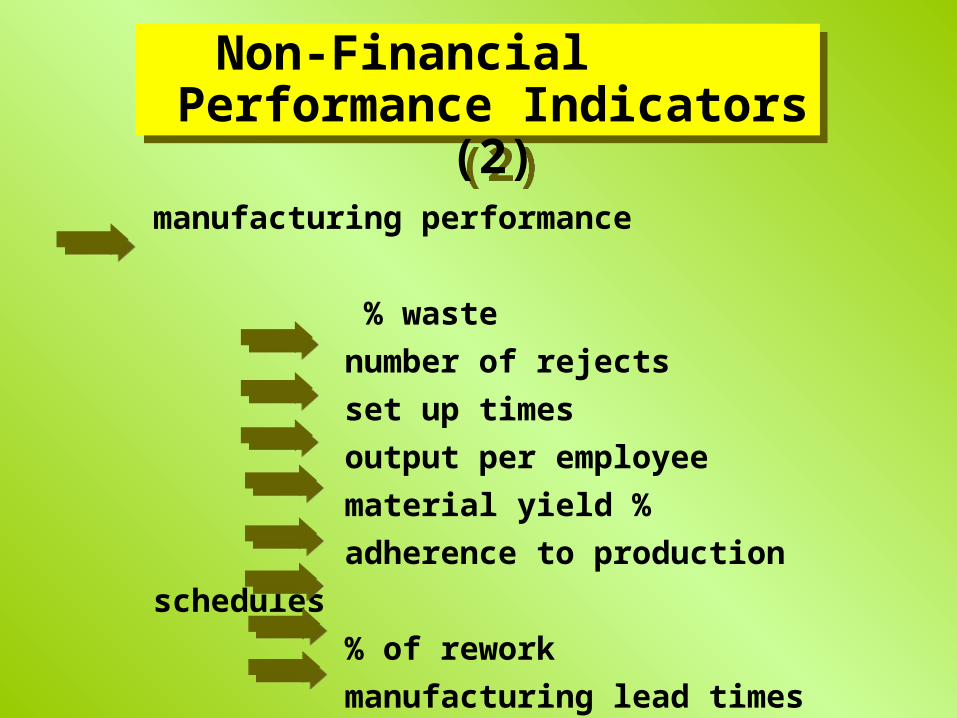
manufacturing performance
% waste
number of rejects
set up times
output per employee
material yield %
adherence to production
schedules
% of rework
manufacturing lead times
Non-Financial Performance Indicators (2)
Non-Financial Performance Indicators (2)
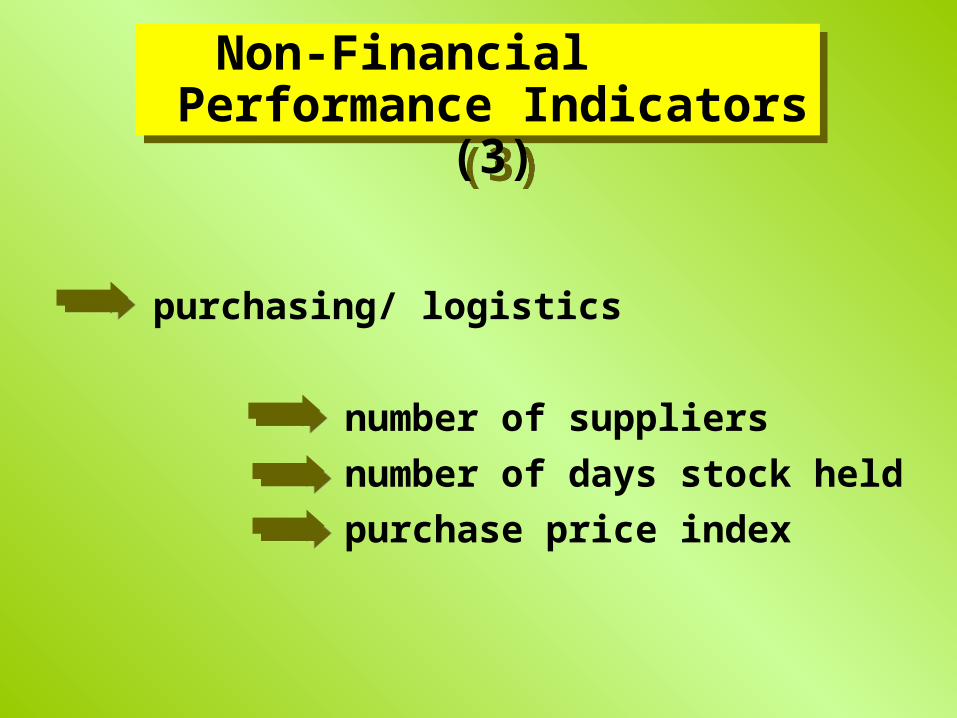
purchasing/ logistics
number of suppliers
number of days stock held
purchase price index
Non-Financial Performance Indicators (3)
Non-Financial Performance Indicators (3)
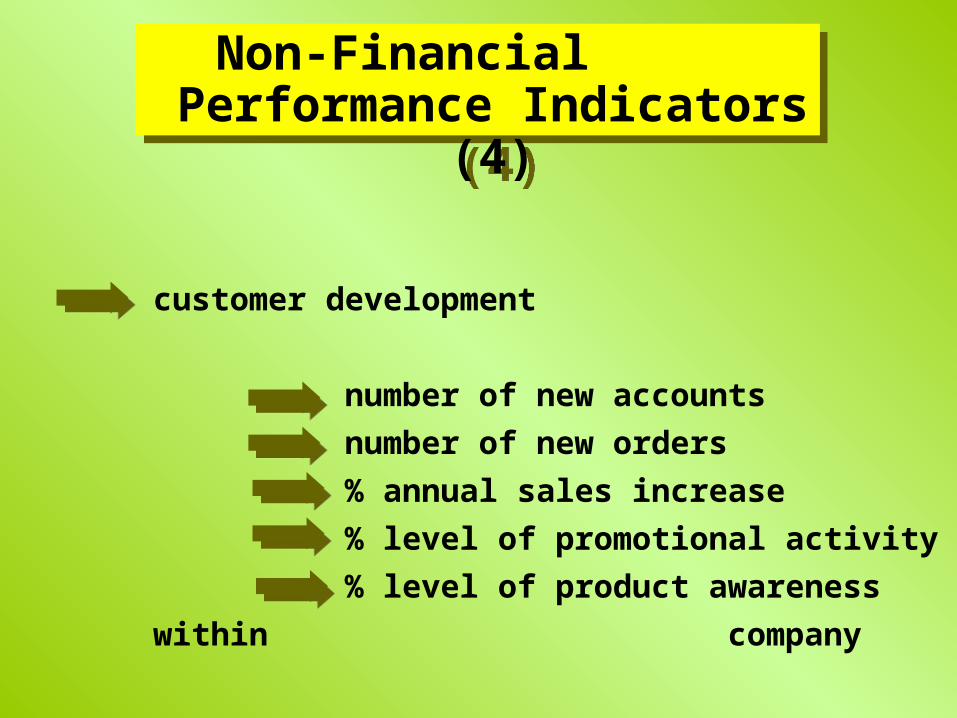
customer development
number of new accounts
number of new orders
% annual sales increase
% level of promotional activity
% level of product awareness
within company
Non-Financial Performance Indicators (4)
Non-Financial Performance Indicators (4)
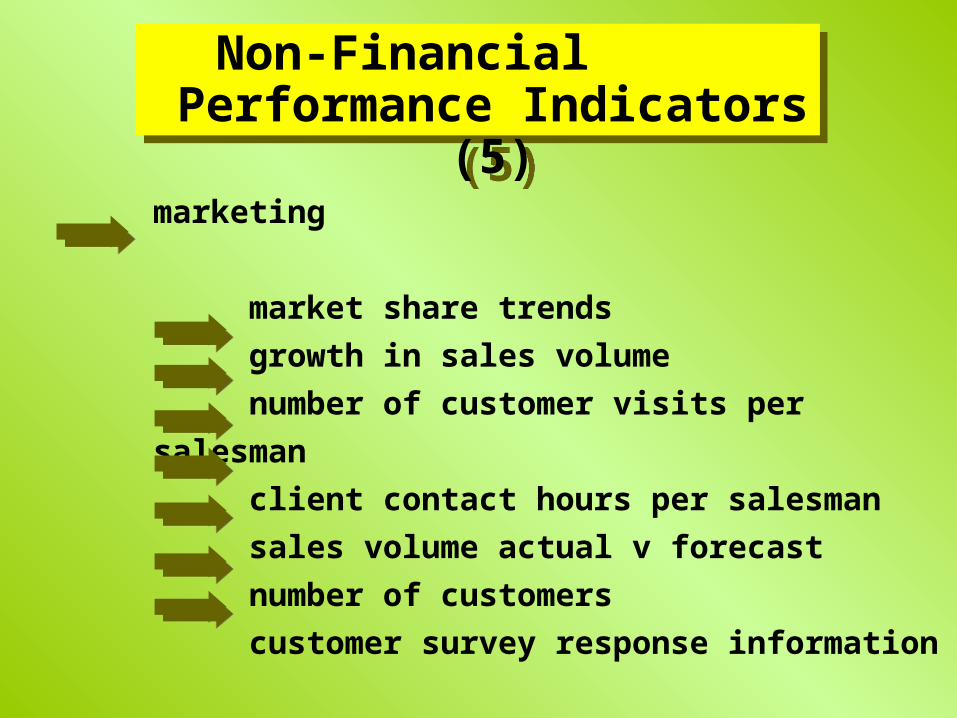
marketing
market share trends
growth in sales volume
number of customer visits per
salesman
client contact hours per salesman
sales volume actual v forecast
number of customers
customer survey response information
Non-Financial Performance Indicators (5)
Non-Financial Performance Indicators (5)
new product development
number of new products developed
number of on time new product
launches
% new product order fulfilment
Non-Financial Performance Indicators (6)
Non-Financial Performance Indicators (6)
human
resources/communications/employee
involvement
staff turnover
absenteeism days and %
accident/sickness days lost
training days per employee
training spend % to sales
% of employees having multi-
competence % of employees
attending daily team briefings
Non-Financial Performance Indicators (7)
Non-Financial Performance Indicators (7)
information technology
number of PC breakdowns
number of IT training days per
employee
% system availability
number of hours lead time for
problem solving
Non-Financial Performance Indicators (8)
Non-Financial Performance Indicators (8)
the use of non-financial indicators is important in the evaluation of business performance both financial and non-financial measures are now incorporated into performance measurement systems such as the balanced scorecard
Non-Financial Performance Indicators (9)
Non-Financial Performance Indicators (9)
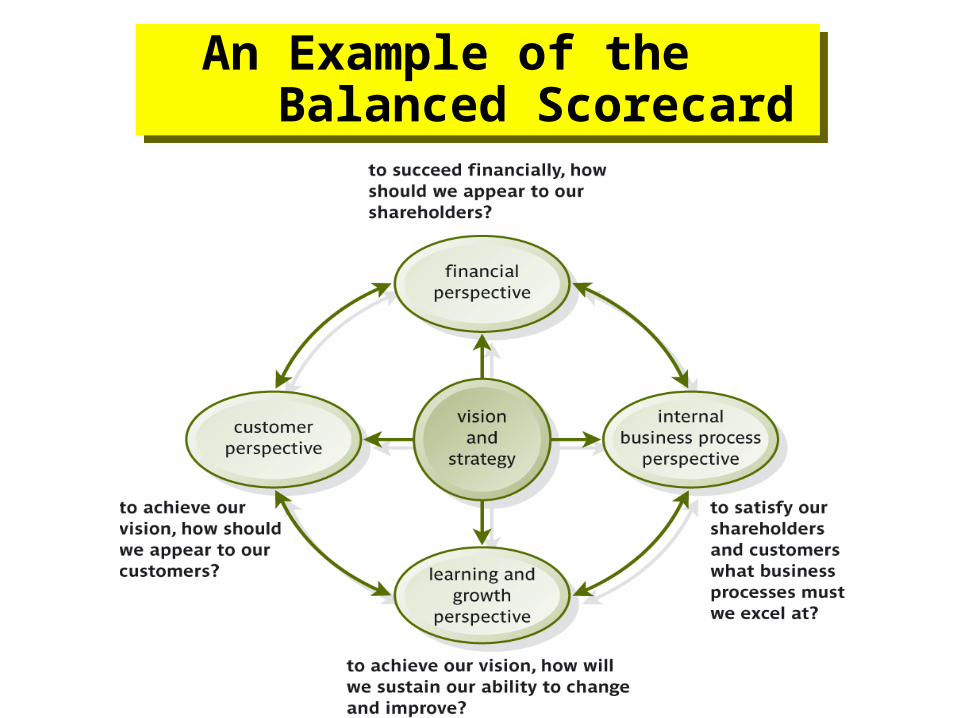
An Example of the Balanced Scorecard
An Example of the Balanced Scorecard
Recommended