EVS24 International Battery, Hybrid and Fuel Cell Electric Vehicle Symposium 1
EVS24 Stavanger, Norway, May 13-16, 2009
Correlating Dynamometer Testing to In-Use Fleet Results of Plug-In Hybrid Electric Vehicles
Michael Duoba1, Richard Carlson2, Forrest Jehlik3, John Smart4, Sera White5
1Argonne National Laboratory, 9700 South Cass Ave, Argonne, IL 60439, [email protected] 2Argonne National Laboratory, 9700 South Cass Ave, Argonne, IL 60439, [email protected]
3Argonne National Laboratory, 9700 South Cass Ave, Argonne, IL 60439, [email protected] 4 Idaho National Laboratory, 2351 N Blvd, Idaho Falls, ID, 83415, [email protected] 5 Idaho National Laboratory, 2351 N Blvd, Idaho Falls, ID, 83415, [email protected]
Abstract
The Untied States Department of Energy is engaged in the research, development and deployment of
PHEV technology through the “Advanced Vehicle Testing Activity.” In this program, data has been
collected from a Prius PHEV converted by HymotionTM using industry standard dynamometer testing
procedures and from in-use operation of fleets. Differences in fuel-only consumption rates observed in the
on-road data compared to the dynamometer results were fairly dramatic. Correlations of the driving style
and conditions of dynamometer testing and on-road conditions were made possible by comprehensive on-
road loggers. A model was developed to infer driving intensity from the on-road dataset from data load
measurement during dynamometer testing. The reasons for the shortfall are detailed in the paper. They
range from driver aggressiveness, accessory loads, ambient temperature (weather), and the high sensitivity
the control system exhibits with increased acceleration pedal demand and higher average cruising speeds.
Keywords: PHEV (plug in hybrid electric vehicle), energy consumption, vehicle performance
1 Introduction Recent advances in battery technology for vehicle electrification have potential to displace significant amounts of petroleum by using electrical grid energy. Interest in the plug-in hybrid (PHEV) has been fuelled by a cottage industry that converts conventional hybrids to PHEV operation with the addition of supplemental batteries and control system modifications. The claims of “+100MPG” come largely from results from standard dynamometer test results but are not necessarily taken in the context of what the average driver may experience. Comparisons of standard test results with on-road experience will address many
questions about the performance of converted HEVs to PHEV operation. The U.S. Department of Energy’s Advanced Vehicle Testing Activity (AVTA) performs independent testing to assess the energy efficiency of advanced technology vehicles, including as PHEVs. AVTA is conducting a comprehensive PHEV testing and evaluation program, with testing in laboratory, track, and on-road environments. Argonne National Laboratory performs AVTA’s light-duty dynamometer testing. The Idaho National Laboratory conducts on-road testing and fleet demonstrations for AVTA.
EVS24 International Battery, Hybrid and Fuel Cell Electric Vehicle Symposium 2
The purpose of this paper is to correlate results from AVTA’s dynamometer testing to in-use fleet vehicle performance.
2 Dynamometer Testing It is current practice in the automotive industry to use standard dynamometer drive cycles during vehicle technology evaluation and benchmarking testing. Most tests occur under standard laboratory conditions of 20°C with no cabin heating or cooling. The dynamometer road load is set based upon closed track coast down testing where there ideal conditions (negligible wind, driving perfectly straight, smooth pavement). These conditions are a very repeatable and equitable standard for comparison purposes, but will often under-predict fuel consumption compared to actual day-to-day driving. Weather, wind and road conditions are part of the reason why the U.S. Environmental Protection Agency (U.S. EPA) adjusts the results of city and highway test results for “label” value fuel economy [1].
2.1 Test Cycles There are many standard test cycles developed over the last several decades that are used in chassis dynamometer testing. Cycles are defined as time-speed traces roughly 10 to 30 minutes in length. In 2008, new U.S. EPA labelling methods were adopted to calculate the city and highway fuel economy by including results from five separate tests that include various levels of aggressive driving, speeds, and weather conditions. The Urban Dynamometer Driving Schedule (UDDS), Highway Fuel Economy Driving Schedule (HWFEDS or HWY), and the US06 cycle are tested under standard lab ambient temperature with no additional solar simulation. The SC03 cycle is tested at elevated temperature (35°C) and with artificial solar lighting at a load of 850 W/m3. There is also a -7°C UDDS test. The UDDS and HWFEDS cycles were the original certification cycles developed in the late 1960’s to represent realistic drive cycles. These cycles are generally regarded as being less aggressive than the way people typically drive today. The US06 cycle was developed to find “off-cycle” high load emissions. Thus, is can be considered a limit cycle; that is, it contains speeds and acceleration representing extremely aggressive driving. Another cycle used in vehicle testing is the LA92, a cycle specifically designed
to represent modern traffic speeds and acceleration rates.
Table 1: Standard Test Cycle Statistics
Ave Ave non- Max Intensity
MPH zero MPH MPH Wh/mi
UDDS 19.5 24.1 56.7 165
HWY 47.6 48.6 59.9 133
US06 48.0 51.8 80.3 243
LA92 24.6 29.4 67.2 199
SC03 21.4 26.6 54.8 173 Some metrics describing test schedules are shown in Table 1. Average non-zero speed is the average of vehicle speed greater than zero in a cycle. This eliminates the effect of vehicle idle time on average speed. The parameter “Intensity” is the positive propulsion force needed to overcome the road losses and inertia, measured in the Wh/km (and Wh/mi). More on this parameter is explained in section 3.4.1. Intensity numbers shown here are specific to the Toyota Prius with Hymotion PHEV conversion module from A123Systems. This vehicle, also referred to as the Hymotion Prius, contains a supplemental 5 kWh lithium ion battery pack, which is charged from the electrical grid. The standard dynamometer test procedures run the aforementioned drive schedules twice. The HWY, US06, and SC03 tests are run with the first drive schedule unsampled as a warm-up cycle. The UDDS and -7°C UDDS tests are run without a warm-up. These tests represent the initial start and warm-up of the beginning and a “hot start” after warm-up has occurred. The two UDDS schedules have a 10 minute rest (key off) between cycles. For conventional vehicles and all hybrids doing a charge-sustaining test, there is a weighting ratio to represent the ratio of several daily trips, some occurring warm and some (like the first start of the day) occurring cold (engine and exhaust at ambient temperature).
2.2 PHEV Testing PHEVs operate in both charge-depleting (CD) and charge-sustaining (CS) modes. Developing procedures to capture all of the operating modes of a PHEV while maintaining original test conditions and assumptions of the various legacy procedures is a challenging task [2, 3]. In short, the method used by researchers is to repeat the drive schedules repeatedly until a satisfactory charge-balanced cycle is achieved (at which time the test is
EVS24 International Battery, Hybrid and Fuel Cell Electric Vehicle Symposium 3
terminated). Gasoline fuel and battery energy consumption for each test cycle is captured and parameters such as charge-depleting range are determined. The methodology described in SAE J1711 to find the “final answer” from all results in testing is Utility Factor (UF) weighting. In-use daily driving statistics are applied to carefully weight all the tests in the charge-depleting test with charge-sustaining tests [4]. This methodology provides an estimation of in-use gasoline fuel economy and electrical energy consumption. The results of dynamometer testing for the Hymotion Prius are found in Table 2.
Table 2: Depleting, Sustaining, and UF-Weighted Standard Test Cycle Results for the Hymotion Prius
UF-WeightedMPG L/100km Wh/mi MPG L/100km MPG L/100km Wh/mi
UDDS 181.1 1.3 131.9 66.6 3.5 91.6 2.57 96.6HWY 121.0 1.9 119.5 63.5 3.7 85.2 2.76 91.5US06 52.9 4.4 78.7 43.2 5.4 49.5 4.75 80.9SC03 91.2 2.6 187.5 38.0 6.2 49.8 4.72 101.0LA92 88.1 2.7 113.2 50.0 4.7 63.8 3.68 93.5
CSCD
An important observation is the fact that the vehicle does indeed achieve over 100 MPG in some cycles while in charge-depleting mode. The charge-sustaining results are also very efficient. The US06 has very high driving demands and the SC03 uses the air conditioner (A/C) during the test at elevated temperature. Consequently, the respective fuel consumption results of these two cycles are much lower.
3 On-Road Data The AVTA monitors PHEV in-use performance through its fleet demonstration program. In this program, the AVTA has collected in-use data from 8 different PHEV conversion models, including the Hymotion Prius. These vehicle models are represented in a fleet of 155 vehicles operated in 23 U.S. states and Canadian provinces by over 75 organizations. Vehicles are equipped with on-board data loggers, which record time history data. Over 360,000 miles have been logged since the program’s onset in late 2007. While the majority of vehicles are operated in commercial fleets, approximately 10% of the miles driven to date were logged in vehicles used for private use [5].
3.1 Summary of Hymotion Prius On-Road Results
The most common question a person may ask about a new fuel saving technology is “What is the fuel economy?” To answer this question, fleet fuel economy was processed and a single aggregate MPG was calculated. Data from 73 Hymotion Prius vehicles with the V2Green data logger from June 1, 2008 to Feb 28, 2009 were chosen for analysis. Statistics describing these data are shown in Table 3.
Table 3: Large On-Road Data set Statistics
Number of distinct cars 73Total miles 242628Total number of trips 24714CD miles 87109CS miles 155519% CD 0.36% CS 0.64
Table 4 shows that the total miles driven per total gallons fuel consumed is 49.1 MPG (4.79 L/100km). Algorithms were developed to segregate charge-depleting and charge sustaining operation, and operating mode-specific fuel economy results were calculated. Table 4 shows a charge-depleting fuel economy of 61.9 MPG, compared to the dynamometer CD results of 53 to 181 MPG.
Table 4: Overall Fuel Consumption Results
MPG L/100kmOverall 49.1 4.79Charge Depleting (CD) 61.9 3.80Charge-Sustaining (CS) 43.3 5.43
3.2 Subset of 1200 On-Road Trips From the large fleet data set, a more manageable sample of 1200 trips was selected. Trips with distance greater than 1 mile were randomly selected for this sample. The parent set and the sample subset, summarized in Table 5, share similar results. The remainder of this paper references the 1200 trip subset, except where noted. This data set is analyzed to find reasons to explain the difference between on-road gasoline and electrical energy consumption and the standard dynamometer test procedures.
EVS24 International Battery, Hybrid and Fuel Cell Electric Vehicle Symposium 4
Table 5: Overall Results of a Subset with 1200 Trips
Total mi Total gal MPG Total kWh wh/mi % of Dist
CD 5453 87.4 62.4 ‐708.5 129.9 35%
CS 10134 228.7 44.3 21.3 ‐2.1 65%
Total 15587 316.1 49.3 ‐687.2 44.1
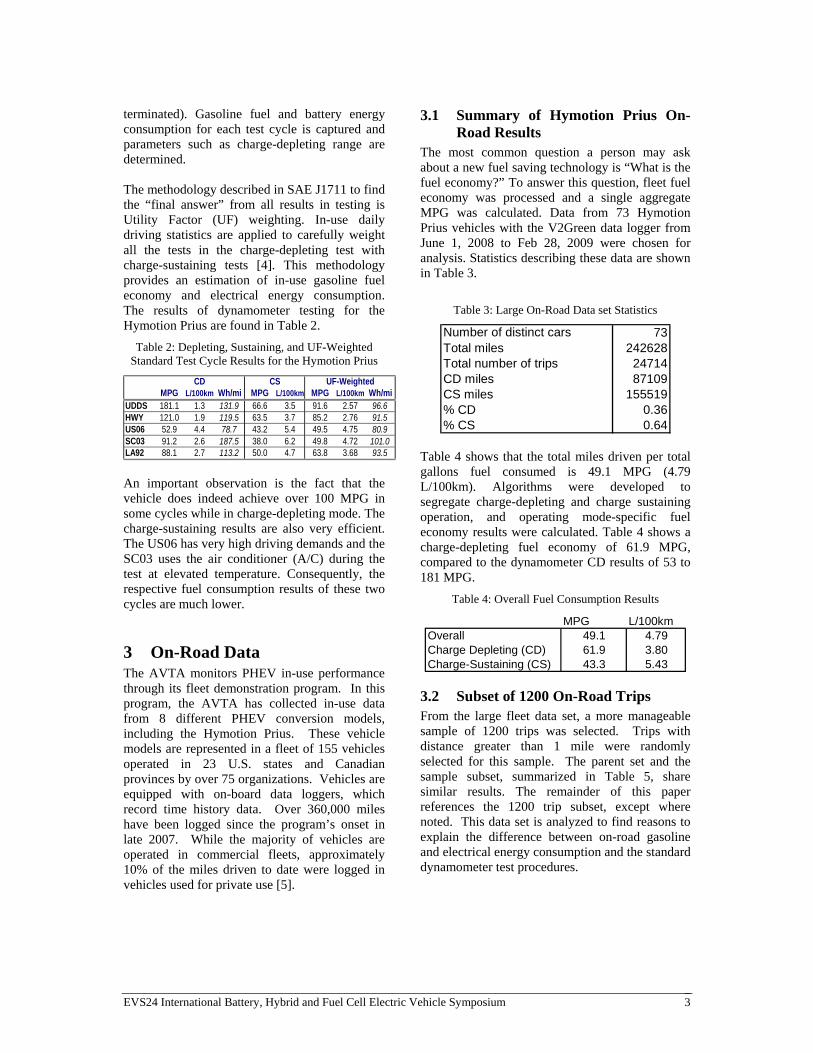
3.3 Charging Frequency and Distance between Charging Events
A principal assumption for processing the standard test results to represent “real life” is the frequency a vehicle owner would charge the vehicle. The current consensus among researchers is to assume one charge per day of driving [6]. This assumption is based on the premise that days when a vehicle operator does not charge – perhaps due to forgetfulness or the absence of charging infrastructure – will be offset on other days by “opportunity charging,” or charging more than once during a day. The charge frequency of the entire parent data set shows a charging frequency of 1.2 charge events per vehicle day. That is, charging occurs more often than once per day. This should weight the final results more toward charge-depleting operation. Notice, however, in both Table 3 and Table 5, the miles travelled in sustaining mode greatly outweighs the depleting mode operation. The 2001 NHTS data set utility factor for a PHEV with 30 miles depleting range is 52%, in contrast to the 36% and 35% found in Tables 3 and 5 respectively. The bias toward sustaining mode operation can be understood by looking at the distribution of distance travelled between charging events. This distribution is equivalent to the NHTS distribution of daily vehicle miles travelled (assuming vehicles are charged every night). The fleet subset data was compared to the NHTS data to look for differences, as shown by the histogram in Figure 1.
0%
10%
20%
30%
40%
50%
60%
25 50 75 100 125 150 175 200 >200
Daily Miles Traveled [mi]
Fre
qu
en
cy
[%
]
NHTS %
AVTA %
Figure 1: Histogram Comparing NHTS Daily Vehicle Miles Travelled to AVTA Fleet Distance between
Charging Events
This comparison shows that the AVTA fleet drove distances greater than 125 miles per charging event more frequently than the NHTS data set. Given that the average charge-depleting range of the Hymotion Prius is approximately 30 miles. This supports the fact that the AVTA fleet drove more miles in charge-sustaining mode.
0%
2%
4%
6%
8%
10%
12%
14%
16%
18%
20%
Daily Miles Traveld [mi]
NHTS %
AVTA %
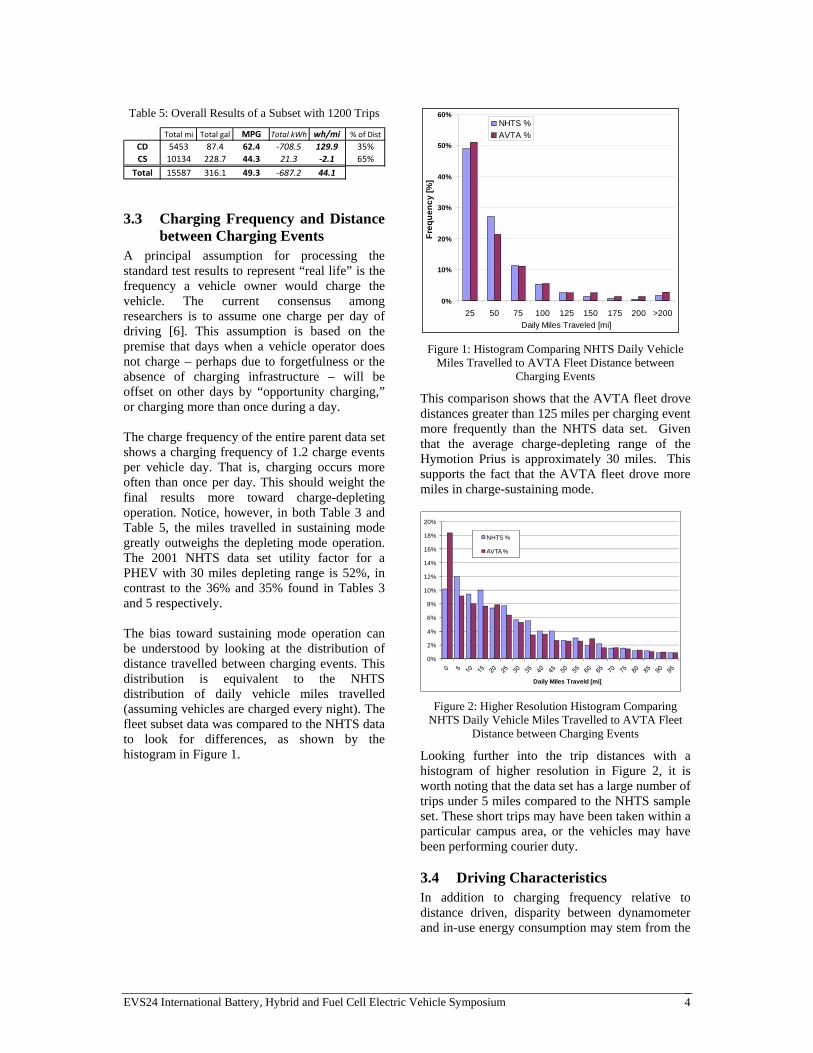
Figure 2: Higher Resolution Histogram Comparing NHTS Daily Vehicle Miles Travelled to AVTA Fleet
Distance between Charging Events
Looking further into the trip distances with a histogram of higher resolution in Figure 2, it is worth noting that the data set has a large number of trips under 5 miles compared to the NHTS sample set. These short trips may have been taken within a particular campus area, or the vehicles may have been performing courier duty.
3.4 Driving Characteristics In addition to charging frequency relative to distance driven, disparity between dynamometer and in-use energy consumption may stem from the
EVS24 International Battery, Hybrid and Fuel Cell Electric Vehicle Symposium 5
fact that vehicles in the fleet may have been driven in ways that are not well represented by the standard driving cycles. For example, studies have shown that vehicle energy consumption rates can be quite sensitive to driving aggressiveness [7, 8].
3.4.1 Modelling Vehicle Tractive Energy Output
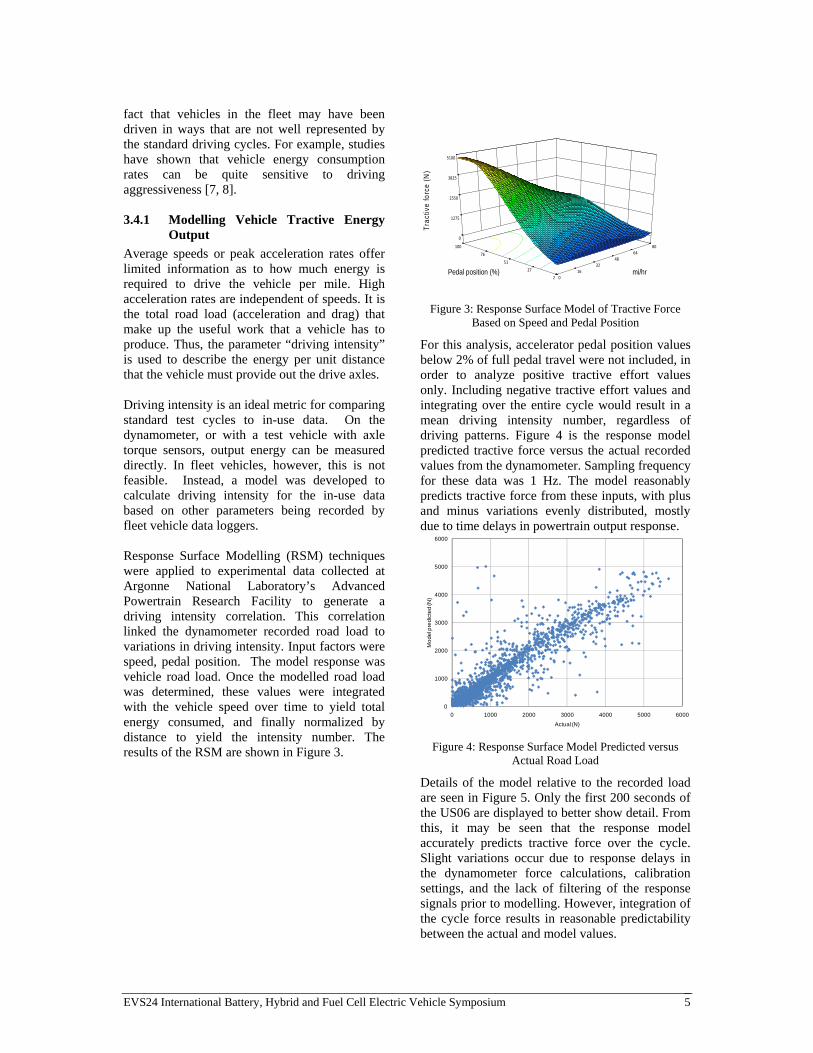
Average speeds or peak acceleration rates offer limited information as to how much energy is required to drive the vehicle per mile. High acceleration rates are independent of speeds. It is the total road load (acceleration and drag) that make up the useful work that a vehicle has to produce. Thus, the parameter “driving intensity” is used to describe the energy per unit distance that the vehicle must provide out the drive axles. Driving intensity is an ideal metric for comparing standard test cycles to in-use data. On the dynamometer, or with a test vehicle with axle torque sensors, output energy can be measured directly. In fleet vehicles, however, this is not feasible. Instead, a model was developed to calculate driving intensity for the in-use data based on other parameters being recorded by fleet vehicle data loggers. Response Surface Modelling (RSM) techniques were applied to experimental data collected at Argonne National Laboratory’s Advanced Powertrain Research Facility to generate a driving intensity correlation. This correlation linked the dynamometer recorded road load to variations in driving intensity. Input factors were speed, pedal position. The model response was vehicle road load. Once the modelled road load was determined, these values were integrated with the vehicle speed over time to yield total energy consumed, and finally normalized by distance to yield the intensity number. The results of the RSM are shown in Figure 3.
0 16
32 48
64 80
2
27
51
76
100
0
1275
2550
3825
5100
Tra
ctiv
e fo
rce
(N
)
mi/hr Pedal position (%)
Figure 3: Response Surface Model of Tractive Force Based on Speed and Pedal Position
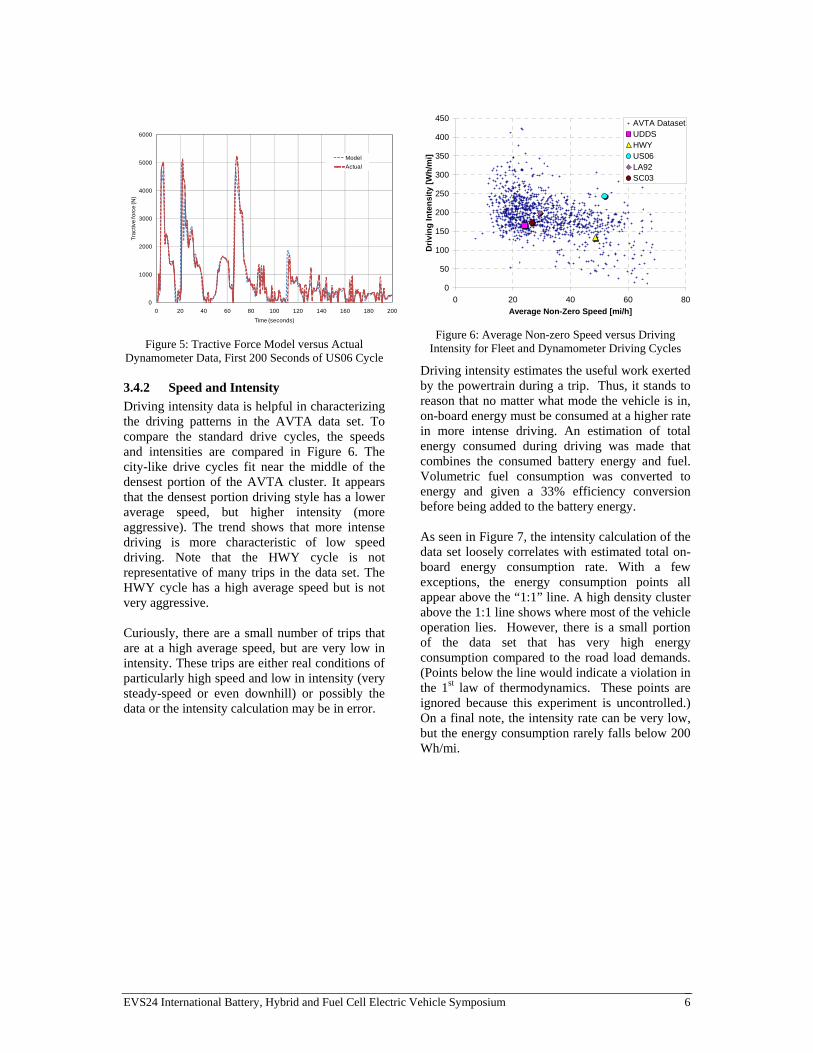
For this analysis, accelerator pedal position values below 2% of full pedal travel were not included, in order to analyze positive tractive effort values only. Including negative tractive effort values and integrating over the entire cycle would result in a mean driving intensity number, regardless of driving patterns. Figure 4 is the response model predicted tractive force versus the actual recorded values from the dynamometer. Sampling frequency for these data was 1 Hz. The model reasonably predicts tractive force from these inputs, with plus and minus variations evenly distributed, mostly due to time delays in powertrain output response.
0
1000
2000
3000
4000
5000
6000
0 1000 2000 3000 4000 5000 6000
Mo
de
l pre
dic
ted
(N)
Actual (N)
Figure 4: Response Surface Model Predicted versus Actual Road Load
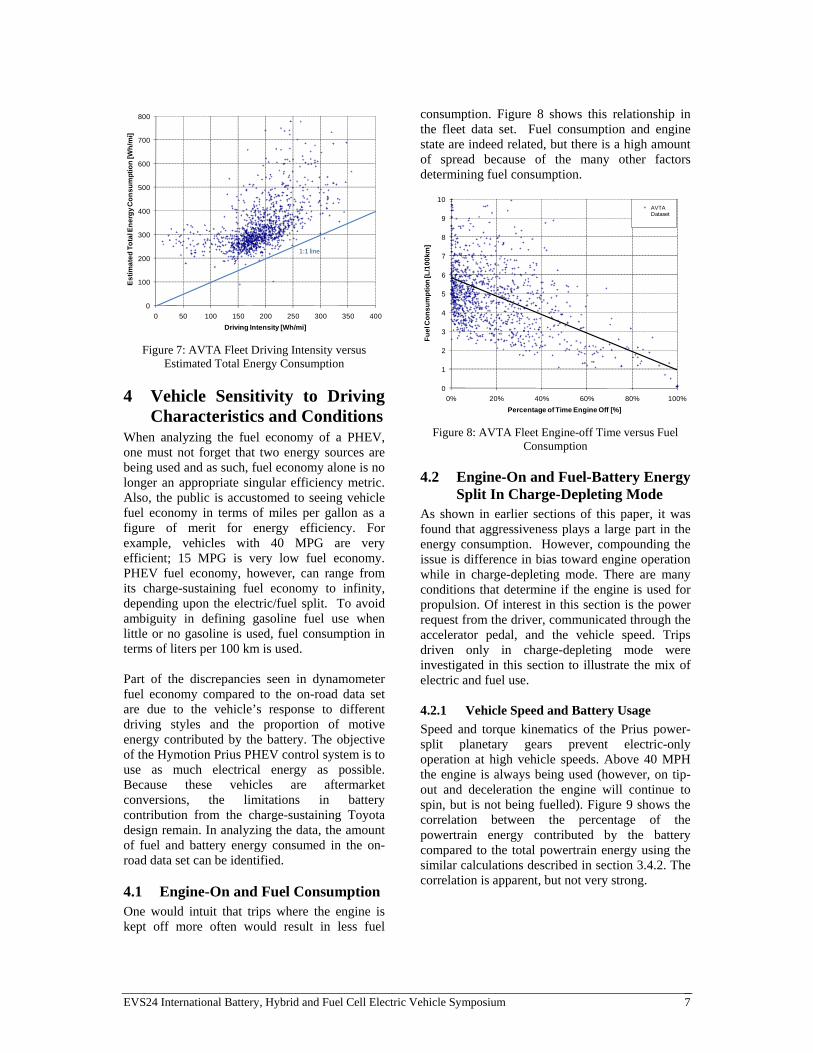
Details of the model relative to the recorded load are seen in Figure 5. Only the first 200 seconds of the US06 are displayed to better show detail. From this, it may be seen that the response model accurately predicts tractive force over the cycle. Slight variations occur due to response delays in the dynamometer force calculations, calibration settings, and the lack of filtering of the response signals prior to modelling. However, integration of the cycle force results in reasonable predictability between the actual and model values.
EVS24 International Battery, Hybrid and Fuel Cell Electric Vehicle Symposium 6
0
1000
2000
3000
4000
5000
6000
0 20 40 60 80 100 120 140 160 180 200
Tra
ctiv
e fo
rce
(N)
Time (seconds)
Model
Actual
Figure 5: Tractive Force Model versus Actual Dynamometer Data, First 200 Seconds of US06 Cycle
3.4.2 Speed and Intensity
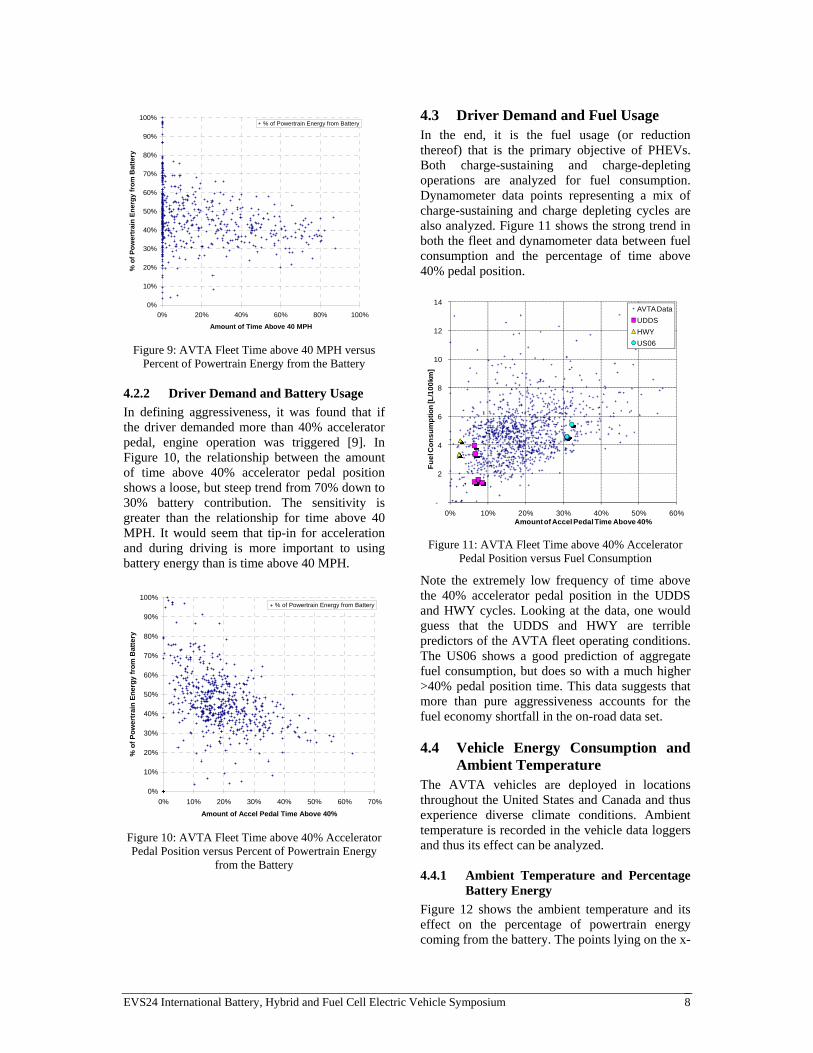
Driving intensity data is helpful in characterizing the driving patterns in the AVTA data set. To compare the standard drive cycles, the speeds and intensities are compared in Figure 6. The city-like drive cycles fit near the middle of the densest portion of the AVTA cluster. It appears that the densest portion driving style has a lower average speed, but higher intensity (more aggressive). The trend shows that more intense driving is more characteristic of low speed driving. Note that the HWY cycle is not representative of many trips in the data set. The HWY cycle has a high average speed but is not very aggressive. Curiously, there are a small number of trips that are at a high average speed, but are very low in intensity. These trips are either real conditions of particularly high speed and low in intensity (very steady-speed or even downhill) or possibly the data or the intensity calculation may be in error.
0
50
100
150
200
250
300
350
400
450
0 20 40 60 80
Average Non-Zero Speed [mi/h]
Dri
vin
g I
nte
nsi
ty [
Wh
/mi]
AVTA DatasetUDDSHWYUS06LA92SC03
Figure 6: Average Non-zero Speed versus Driving Intensity for Fleet and Dynamometer Driving Cycles
Driving intensity estimates the useful work exerted by the powertrain during a trip. Thus, it stands to reason that no matter what mode the vehicle is in, on-board energy must be consumed at a higher rate in more intense driving. An estimation of total energy consumed during driving was made that combines the consumed battery energy and fuel. Volumetric fuel consumption was converted to energy and given a 33% efficiency conversion before being added to the battery energy. As seen in Figure 7, the intensity calculation of the data set loosely correlates with estimated total on-board energy consumption rate. With a few exceptions, the energy consumption points all appear above the “1:1” line. A high density cluster above the 1:1 line shows where most of the vehicle operation lies. However, there is a small portion of the data set that has very high energy consumption compared to the road load demands. (Points below the line would indicate a violation in the 1st law of thermodynamics. These points are ignored because this experiment is uncontrolled.) On a final note, the intensity rate can be very low, but the energy consumption rarely falls below 200 Wh/mi.
EVS24 International Battery, Hybrid and Fuel Cell Electric Vehicle Symposium 7
0
100
200
300
400
500
600
700
800
0 50 100 150 200 250 300 350 400
Es
tim
ate
d T
ota
l En
erg
y C
on
su
mp
tio
n [
Wh
/mi]
Driving Intensity [Wh/mi]
1:1 line
Figure 7: AVTA Fleet Driving Intensity versus Estimated Total Energy Consumption
4 Vehicle Sensitivity to Driving Characteristics and Conditions
When analyzing the fuel economy of a PHEV, one must not forget that two energy sources are being used and as such, fuel economy alone is no longer an appropriate singular efficiency metric. Also, the public is accustomed to seeing vehicle fuel economy in terms of miles per gallon as a figure of merit for energy efficiency. For example, vehicles with 40 MPG are very efficient; 15 MPG is very low fuel economy. PHEV fuel economy, however, can range from its charge-sustaining fuel economy to infinity, depending upon the electric/fuel split. To avoid ambiguity in defining gasoline fuel use when little or no gasoline is used, fuel consumption in terms of liters per 100 km is used. Part of the discrepancies seen in dynamometer fuel economy compared to the on-road data set are due to the vehicle’s response to different driving styles and the proportion of motive energy contributed by the battery. The objective of the Hymotion Prius PHEV control system is to use as much electrical energy as possible. Because these vehicles are aftermarket conversions, the limitations in battery contribution from the charge-sustaining Toyota design remain. In analyzing the data, the amount of fuel and battery energy consumed in the on-road data set can be identified.
4.1 Engine-On and Fuel Consumption One would intuit that trips where the engine is kept off more often would result in less fuel
consumption. Figure 8 shows this relationship in the fleet data set. Fuel consumption and engine state are indeed related, but there is a high amount of spread because of the many other factors determining fuel consumption.
0
1
2
3
4
5
6
7
8
9
10
0% 20% 40% 60% 80% 100%
Fu
el C
on
su
mp
tio
n [L
/10
0km
]
Percentage of Time Engine Off [%]
AVTA Dataset
Figure 8: AVTA Fleet Engine-off Time versus Fuel Consumption
4.2 Engine-On and Fuel-Battery Energy Split In Charge-Depleting Mode
As shown in earlier sections of this paper, it was found that aggressiveness plays a large part in the energy consumption. However, compounding the issue is difference in bias toward engine operation while in charge-depleting mode. There are many conditions that determine if the engine is used for propulsion. Of interest in this section is the power request from the driver, communicated through the accelerator pedal, and the vehicle speed. Trips driven only in charge-depleting mode were investigated in this section to illustrate the mix of electric and fuel use.
4.2.1 Vehicle Speed and Battery Usage
Speed and torque kinematics of the Prius power-split planetary gears prevent electric-only operation at high vehicle speeds. Above 40 MPH the engine is always being used (however, on tip-out and deceleration the engine will continue to spin, but is not being fuelled). Figure 9 shows the correlation between the percentage of the powertrain energy contributed by the battery compared to the total powertrain energy using the similar calculations described in section 3.4.2. The correlation is apparent, but not very strong.
EVS24 International Battery, Hybrid and Fuel Cell Electric Vehicle Symposium 8
0%
10%
20%
30%
40%
50%
60%
70%
80%
90%
100%
0% 20% 40% 60% 80% 100%
Amount of Time Above 40 MPH
% o
f P
ow
ertr
ain
En
erg
y fr
om
Bat
tery
% of Powertrain Energy from Battery
Figure 9: AVTA Fleet Time above 40 MPH versus Percent of Powertrain Energy from the Battery
4.2.2 Driver Demand and Battery Usage
In defining aggressiveness, it was found that if the driver demanded more than 40% accelerator pedal, engine operation was triggered [9]. In Figure 10, the relationship between the amount of time above 40% accelerator pedal position shows a loose, but steep trend from 70% down to 30% battery contribution. The sensitivity is greater than the relationship for time above 40 MPH. It would seem that tip-in for acceleration and during driving is more important to using battery energy than is time above 40 MPH.
0%
10%
20%
30%
40%
50%
60%
70%
80%
90%
100%
0% 10% 20% 30% 40% 50% 60% 70%
Amount of Accel Pedal Time Above 40%
% o
f P
ow
ert
rain
En
erg
y f
rom
Ba
tte
ry
% of Powertrain Energy from Battery
Figure 10: AVTA Fleet Time above 40% Accelerator Pedal Position versus Percent of Powertrain Energy
from the Battery
4.3 Driver Demand and Fuel Usage In the end, it is the fuel usage (or reduction thereof) that is the primary objective of PHEVs. Both charge-sustaining and charge-depleting operations are analyzed for fuel consumption. Dynamometer data points representing a mix of charge-sustaining and charge depleting cycles are also analyzed. Figure 11 shows the strong trend in both the fleet and dynamometer data between fuel consumption and the percentage of time above 40% pedal position.
-
2
4
6
8
10
12
14
0% 10% 20% 30% 40% 50% 60%
Fu
el C
on
su
mp
tio
n [L
/10
0km
]
Amount of Accel Pedal Time Above 40%
AVTA Data
UDDS
HWY
US06
Figure 11: AVTA Fleet Time above 40% Accelerator Pedal Position versus Fuel Consumption
Note the extremely low frequency of time above the 40% accelerator pedal position in the UDDS and HWY cycles. Looking at the data, one would guess that the UDDS and HWY are terrible predictors of the AVTA fleet operating conditions. The US06 shows a good prediction of aggregate fuel consumption, but does so with a much higher >40% pedal position time. This data suggests that more than pure aggressiveness accounts for the fuel economy shortfall in the on-road data set.
4.4 Vehicle Energy Consumption and Ambient Temperature
The AVTA vehicles are deployed in locations throughout the United States and Canada and thus experience diverse climate conditions. Ambient temperature is recorded in the vehicle data loggers and thus its effect can be analyzed.
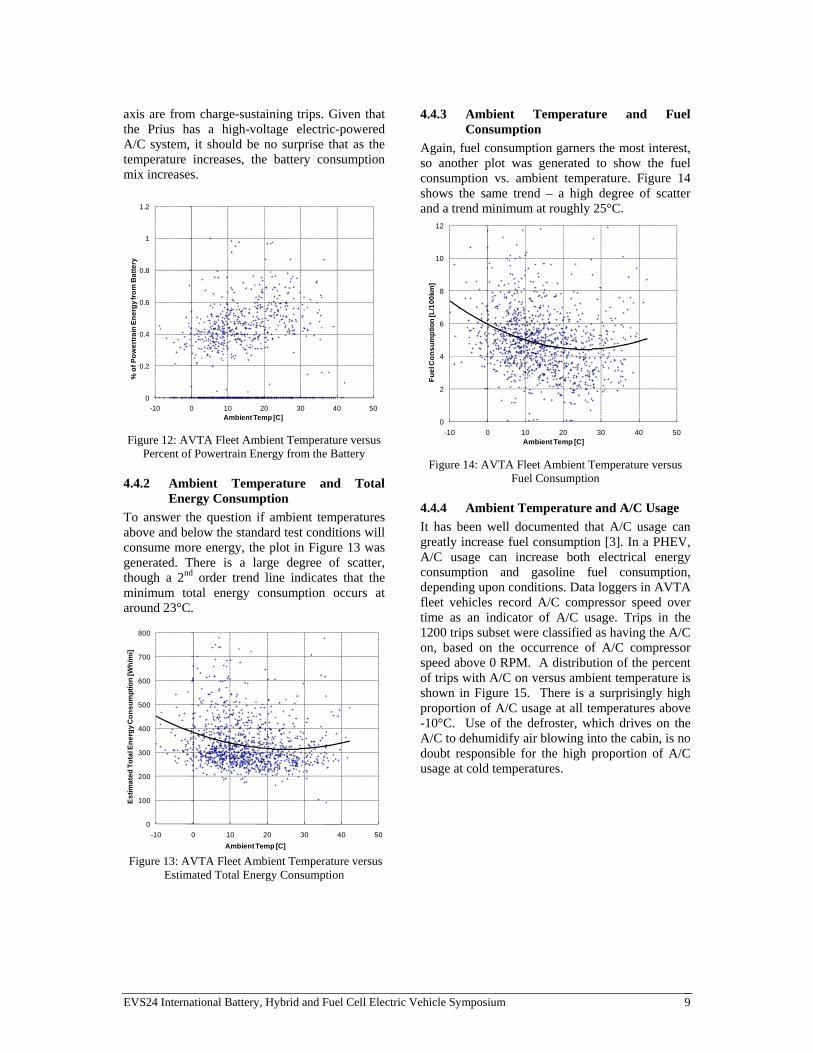
4.4.1 Ambient Temperature and Percentage Battery Energy
Figure 12 shows the ambient temperature and its effect on the percentage of powertrain energy coming from the battery. The points lying on the x-
EVS24 International Battery, Hybrid and Fuel Cell Electric Vehicle Symposium 9
axis are from charge-sustaining trips. Given that the Prius has a high-voltage electric-powered A/C system, it should be no surprise that as the temperature increases, the battery consumption mix increases.
0
0.2
0.4
0.6
0.8
1
1.2
-10 0 10 20 30 40 50
% o
f P
ow
ert
rain
En
erg
y fr
om
Ba
tte
ry
Ambient Temp [C]
Figure 12: AVTA Fleet Ambient Temperature versus Percent of Powertrain Energy from the Battery
4.4.2 Ambient Temperature and Total Energy Consumption
To answer the question if ambient temperatures above and below the standard test conditions will consume more energy, the plot in Figure 13 was generated. There is a large degree of scatter, though a 2nd order trend line indicates that the minimum total energy consumption occurs at around 23°C.
0
100
200
300
400
500
600
700
800
-10 0 10 20 30 40 50
Es
tim
ate
d T
ota
l En
erg
y C
on
su
mp
tio
n [
Wh
/mi]
Ambient Temp [C]
Figure 13: AVTA Fleet Ambient Temperature versus Estimated Total Energy Consumption
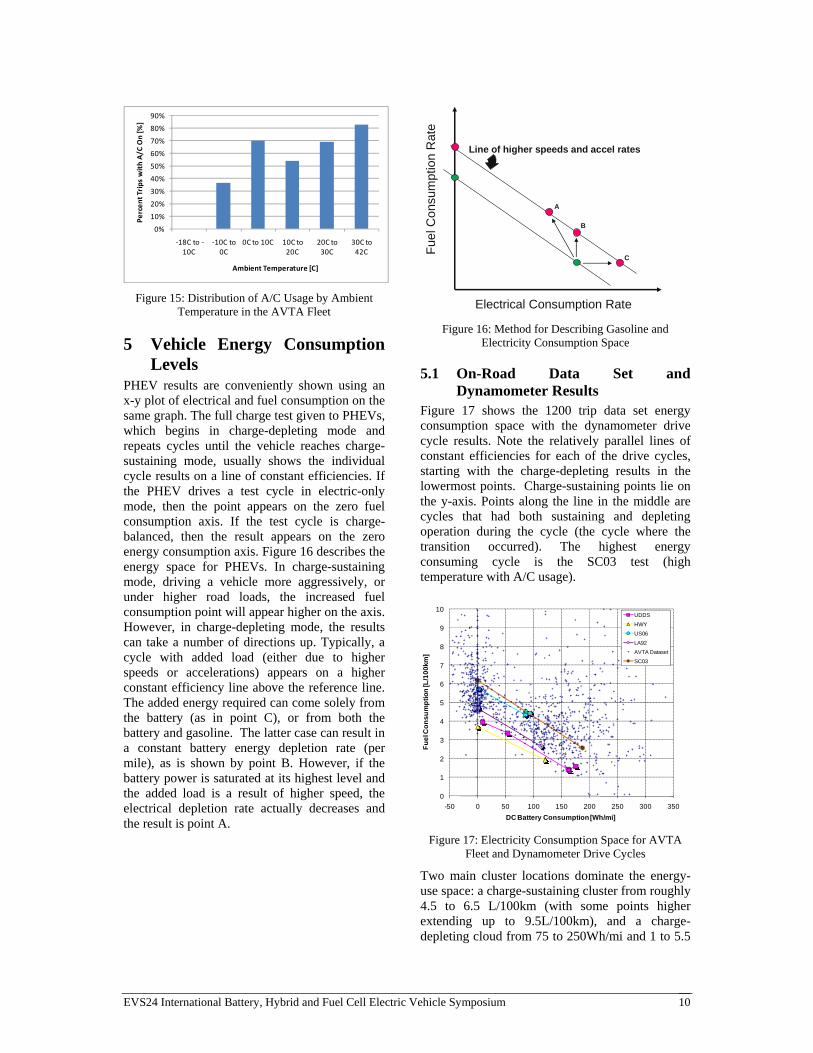
4.4.3 Ambient Temperature and Fuel Consumption
Again, fuel consumption garners the most interest, so another plot was generated to show the fuel consumption vs. ambient temperature. Figure 14 shows the same trend – a high degree of scatter and a trend minimum at roughly 25°C.
0
2
4
6
8
10
12
-10 0 10 20 30 40 50F
ue
l Co
ns
um
pti
on
[L/1
00
km]
Ambient Temp [C]
Figure 14: AVTA Fleet Ambient Temperature versus Fuel Consumption
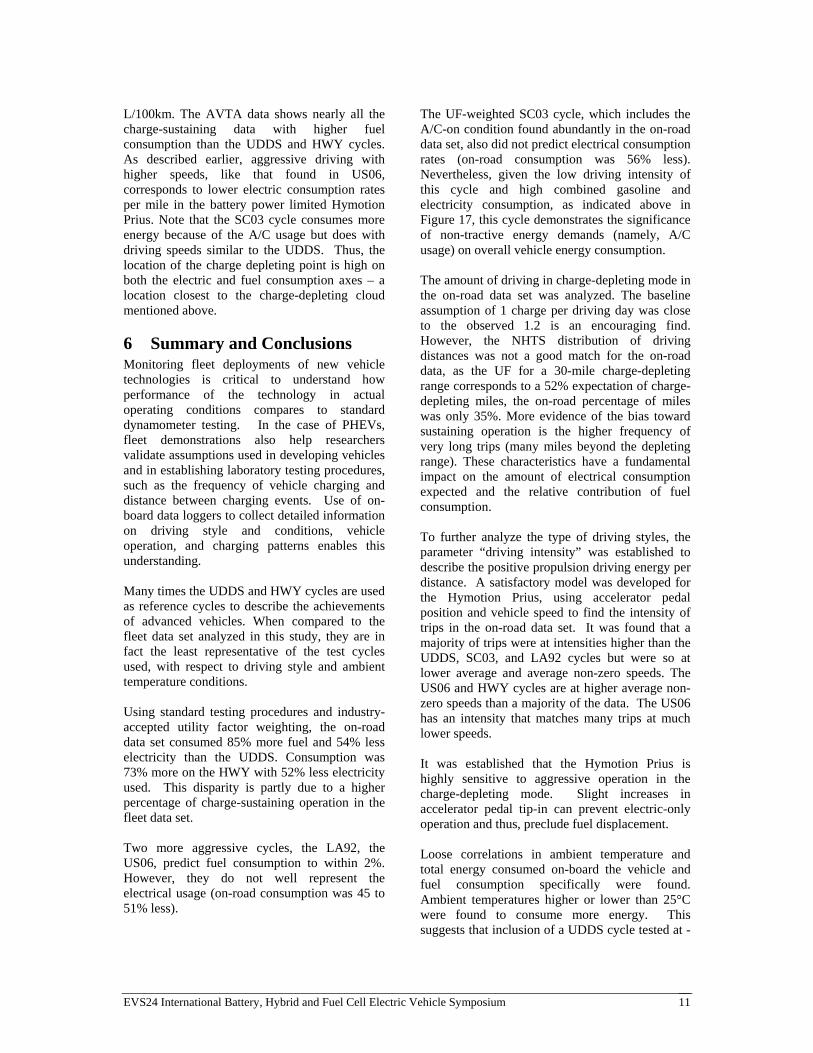
4.4.4 Ambient Temperature and A/C Usage
It has been well documented that A/C usage can greatly increase fuel consumption [3]. In a PHEV, A/C usage can increase both electrical energy consumption and gasoline fuel consumption, depending upon conditions. Data loggers in AVTA fleet vehicles record A/C compressor speed over time as an indicator of A/C usage. Trips in the 1200 trips subset were classified as having the A/C on, based on the occurrence of A/C compressor speed above 0 RPM. A distribution of the percent of trips with A/C on versus ambient temperature is shown in Figure 15. There is a surprisingly high proportion of A/C usage at all temperatures above -10°C. Use of the defroster, which drives on the A/C to dehumidify air blowing into the cabin, is no doubt responsible for the high proportion of A/C usage at cold temperatures.
EVS24 International Battery, Hybrid and Fuel Cell Electric Vehicle Symposium 10
0%
10%
20%
30%
40%
50%
60%
70%
80%
90%
‐18C to ‐10C
‐10C to 0C
0C to 10C 10C to 20C
20C to 30C
30C to 42C
Percent Trips with A/C
On [%]
Ambient Temperature [C]
Figure 15: Distribution of A/C Usage by Ambient Temperature in the AVTA Fleet
5 Vehicle Energy Consumption Levels
PHEV results are conveniently shown using an x-y plot of electrical and fuel consumption on the same graph. The full charge test given to PHEVs, which begins in charge-depleting mode and repeats cycles until the vehicle reaches charge-sustaining mode, usually shows the individual cycle results on a line of constant efficiencies. If the PHEV drives a test cycle in electric-only mode, then the point appears on the zero fuel consumption axis. If the test cycle is charge-balanced, then the result appears on the zero energy consumption axis. Figure 16 describes the energy space for PHEVs. In charge-sustaining mode, driving a vehicle more aggressively, or under higher road loads, the increased fuel consumption point will appear higher on the axis. However, in charge-depleting mode, the results can take a number of directions up. Typically, a cycle with added load (either due to higher speeds or accelerations) appears on a higher constant efficiency line above the reference line. The added energy required can come solely from the battery (as in point C), or from both the battery and gasoline. The latter case can result in a constant battery energy depletion rate (per mile), as is shown by point B. However, if the battery power is saturated at its highest level and the added load is a result of higher speed, the electrical depletion rate actually decreases and the result is point A.
Fue
l Con
sum
ptio
n R
ate
Electrical Consumption Rate
Line of higher speeds and accel rates
A
B
C
Figure 16: Method for Describing Gasoline and Electricity Consumption Space
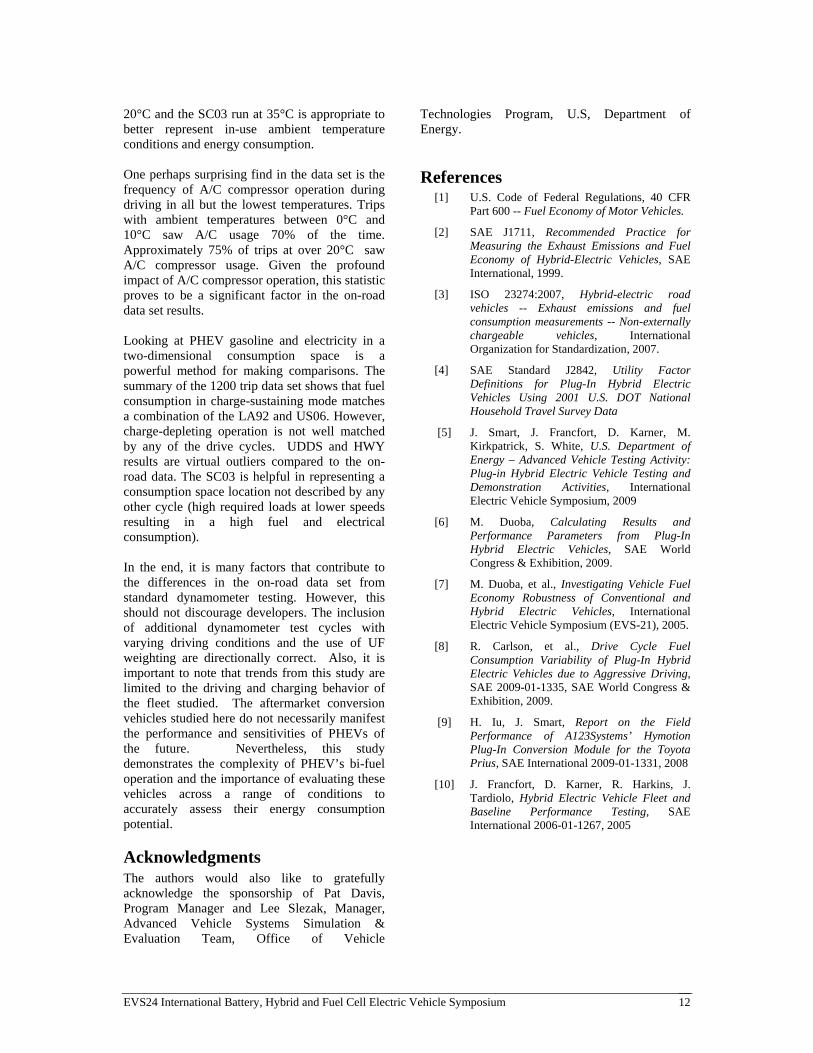
5.1 On-Road Data Set and Dynamometer Results
Figure 17 shows the 1200 trip data set energy consumption space with the dynamometer drive cycle results. Note the relatively parallel lines of constant efficiencies for each of the drive cycles, starting with the charge-depleting results in the lowermost points. Charge-sustaining points lie on the y-axis. Points along the line in the middle are cycles that had both sustaining and depleting operation during the cycle (the cycle where the transition occurred). The highest energy consuming cycle is the SC03 test (high temperature with A/C usage).
0
1
2
3
4
5
6
7
8
9
10
-50 0 50 100 150 200 250 300 350
Fu
el C
on
su
mp
tio
n [L
/10
0km
]
DC Battery Consumption [Wh/mi]
UDDS
HWY
US06
LA92
AVTA Dataset
SC03
Figure 17: Electricity Consumption Space for AVTA Fleet and Dynamometer Drive Cycles
Two main cluster locations dominate the energy- use space: a charge-sustaining cluster from roughly 4.5 to 6.5 L/100km (with some points higher extending up to 9.5L/100km), and a charge-depleting cloud from 75 to 250Wh/mi and 1 to 5.5
EVS24 International Battery, Hybrid and Fuel Cell Electric Vehicle Symposium 11
L/100km. The AVTA data shows nearly all the charge-sustaining data with higher fuel consumption than the UDDS and HWY cycles. As described earlier, aggressive driving with higher speeds, like that found in US06, corresponds to lower electric consumption rates per mile in the battery power limited Hymotion Prius. Note that the SC03 cycle consumes more energy because of the A/C usage but does with driving speeds similar to the UDDS. Thus, the location of the charge depleting point is high on both the electric and fuel consumption axes – a location closest to the charge-depleting cloud mentioned above.
6 Summary and Conclusions Monitoring fleet deployments of new vehicle technologies is critical to understand how performance of the technology in actual operating conditions compares to standard dynamometer testing. In the case of PHEVs, fleet demonstrations also help researchers validate assumptions used in developing vehicles and in establishing laboratory testing procedures, such as the frequency of vehicle charging and distance between charging events. Use of on-board data loggers to collect detailed information on driving style and conditions, vehicle operation, and charging patterns enables this understanding. Many times the UDDS and HWY cycles are used as reference cycles to describe the achievements of advanced vehicles. When compared to the fleet data set analyzed in this study, they are in fact the least representative of the test cycles used, with respect to driving style and ambient temperature conditions. Using standard testing procedures and industry-accepted utility factor weighting, the on-road data set consumed 85% more fuel and 54% less electricity than the UDDS. Consumption was 73% more on the HWY with 52% less electricity used. This disparity is partly due to a higher percentage of charge-sustaining operation in the fleet data set. Two more aggressive cycles, the LA92, the US06, predict fuel consumption to within 2%. However, they do not well represent the electrical usage (on-road consumption was 45 to 51% less).
The UF-weighted SC03 cycle, which includes the A/C-on condition found abundantly in the on-road data set, also did not predict electrical consumption rates (on-road consumption was 56% less). Nevertheless, given the low driving intensity of this cycle and high combined gasoline and electricity consumption, as indicated above in Figure 17, this cycle demonstrates the significance of non-tractive energy demands (namely, A/C usage) on overall vehicle energy consumption. The amount of driving in charge-depleting mode in the on-road data set was analyzed. The baseline assumption of 1 charge per driving day was close to the observed 1.2 is an encouraging find. However, the NHTS distribution of driving distances was not a good match for the on-road data, as the UF for a 30-mile charge-depleting range corresponds to a 52% expectation of charge-depleting miles, the on-road percentage of miles was only 35%. More evidence of the bias toward sustaining operation is the higher frequency of very long trips (many miles beyond the depleting range). These characteristics have a fundamental impact on the amount of electrical consumption expected and the relative contribution of fuel consumption. To further analyze the type of driving styles, the parameter “driving intensity” was established to describe the positive propulsion driving energy per distance. A satisfactory model was developed for the Hymotion Prius, using accelerator pedal position and vehicle speed to find the intensity of trips in the on-road data set. It was found that a majority of trips were at intensities higher than the UDDS, SC03, and LA92 cycles but were so at lower average and average non-zero speeds. The US06 and HWY cycles are at higher average non-zero speeds than a majority of the data. The US06 has an intensity that matches many trips at much lower speeds. It was established that the Hymotion Prius is highly sensitive to aggressive operation in the charge-depleting mode. Slight increases in accelerator pedal tip-in can prevent electric-only operation and thus, preclude fuel displacement. Loose correlations in ambient temperature and total energy consumed on-board the vehicle and fuel consumption specifically were found. Ambient temperatures higher or lower than 25°C were found to consume more energy. This suggests that inclusion of a UDDS cycle tested at -
EVS24 International Battery, Hybrid and Fuel Cell Electric Vehicle Symposium 12
20°C and the SC03 run at 35°C is appropriate to better represent in-use ambient temperature conditions and energy consumption. One perhaps surprising find in the data set is the frequency of A/C compressor operation during driving in all but the lowest temperatures. Trips with ambient temperatures between 0°C and 10°C saw A/C usage 70% of the time. Approximately 75% of trips at over 20°C saw A/C compressor usage. Given the profound impact of A/C compressor operation, this statistic proves to be a significant factor in the on-road data set results. Looking at PHEV gasoline and electricity in a two-dimensional consumption space is a powerful method for making comparisons. The summary of the 1200 trip data set shows that fuel consumption in charge-sustaining mode matches a combination of the LA92 and US06. However, charge-depleting operation is not well matched by any of the drive cycles. UDDS and HWY results are virtual outliers compared to the on-road data. The SC03 is helpful in representing a consumption space location not described by any other cycle (high required loads at lower speeds resulting in a high fuel and electrical consumption). In the end, it is many factors that contribute to the differences in the on-road data set from standard dynamometer testing. However, this should not discourage developers. The inclusion of additional dynamometer test cycles with varying driving conditions and the use of UF weighting are directionally correct. Also, it is important to note that trends from this study are limited to the driving and charging behavior of the fleet studied. The aftermarket conversion vehicles studied here do not necessarily manifest the performance and sensitivities of PHEVs of the future. Nevertheless, this study demonstrates the complexity of PHEV’s bi-fuel operation and the importance of evaluating these vehicles across a range of conditions to accurately assess their energy consumption potential.
Acknowledgments The authors would also like to gratefully acknowledge the sponsorship of Pat Davis, Program Manager and Lee Slezak, Manager, Advanced Vehicle Systems Simulation & Evaluation Team, Office of Vehicle
Technologies Program, U.S, Department of Energy.
References [1] U.S. Code of Federal Regulations, 40 CFR
Part 600 -- Fuel Economy of Motor Vehicles.
[2] SAE J1711, Recommended Practice for Measuring the Exhaust Emissions and Fuel Economy of Hybrid-Electric Vehicles, SAE International, 1999.
[3] ISO 23274:2007, Hybrid-electric road vehicles -- Exhaust emissions and fuel consumption measurements -- Non-externally chargeable vehicles, International Organization for Standardization, 2007.
[4] SAE Standard J2842, Utility Factor Definitions for Plug-In Hybrid Electric Vehicles Using 2001 U.S. DOT National Household Travel Survey Data
[5] J. Smart, J. Francfort, D. Karner, M. Kirkpatrick, S. White, U.S. Department of Energy – Advanced Vehicle Testing Activity: Plug-in Hybrid Electric Vehicle Testing and Demonstration Activities, International Electric Vehicle Symposium, 2009
[6] M. Duoba, Calculating Results and Performance Parameters from Plug-In Hybrid Electric Vehicles, SAE World Congress & Exhibition, 2009.
[7] M. Duoba, et al., Investigating Vehicle Fuel Economy Robustness of Conventional and Hybrid Electric Vehicles, International Electric Vehicle Symposium (EVS-21), 2005.
[8] R. Carlson, et al., Drive Cycle Fuel Consumption Variability of Plug-In Hybrid Electric Vehicles due to Aggressive Driving, SAE 2009-01-1335, SAE World Congress & Exhibition, 2009.
[9] H. Iu, J. Smart, Report on the Field Performance of A123Systems’ Hymotion Plug-In Conversion Module for the Toyota Prius, SAE International 2009-01-1331, 2008
[10] J. Francfort, D. Karner, R. Harkins, J. Tardiolo, Hybrid Electric Vehicle Fleet and Baseline Performance Testing, SAE International 2006-01-1267, 2005

EVS24 International Battery, Hybrid and Fuel Cell Electric Vehicle Symposium 13
Authors Mr. Duoba is the lead engineer for ANL’s Advanced Powertrain Research Facility. He is the chair of the task force developing PHEV test procedures for SAE J1711 and a member of the electric vehicle test procedure task force, SAE J1634. He received his MS in Mechanical Engineering at the University of Wisconsin-Madison.
Richard “Barney” Carlson has tested and developed hybrid vehicle systems with Argonne National Laboratory for the past three years. He worked for GM R&D in transmission development and testing for 5 years. Mr. Carlson received his BS and MS from Univ. Of California, Davis as part of the Hybrid Electric vehicle program.
Forrest Jehlik has been at Argonne since 2005 working as a technical coordinator of the ChallengeX competition and more recently in the Advanced Powertrain Research Facility. He also worked at General Motors Research and Development/ Powertrain developing diesel combustion systems. He received a BS in Environmental Engineering at the University of California-Riverside and a MS in Mechanical Engineering at University of Wisconsin-Madison.
John Smart is the lead PHEV test engineer at the Idaho National Laboratory. Prior to this position, he worked at Ford Motor Company in Powertrain Product Development. Mr. Smart holds a Bachelor of Science degree in Mechanical Engineering from Brigham Young University.
Sera White is the lead database engineer for AVTA’s PHEV on-road data collection activities. Previously, she worked as a database engineer with the Geospatial Science and Engineering Group (GEOSE) at the Idaho National Laboratory. Ms. White holds a Bachelor of Science degree in Computer Science From Idaho State University.
INL/CON-08-15021
Recommended