Corporate Plan Summary
2015/16 – 2019/20
April 29th, 2015
i | P a g e
Executive Summary 2014/15 was another successful year for Marine Atlantic. The Corporation is continuing to deliver
an efficient and timely service with on time performance levels reaching 93% in 2014/15. This is
well above the Corporation’s target and a clear indicator that the investments that the Corporation
has made in its vessels and shore based infrastructure are paying off. Further improvements in the
Corporation’s business processes will help to sustain current progress and drive further efficiencies
across the Corporation.
Financial results for the 2014/15 fiscal year have been positive. Cost recovery has remained stable
at 70.1%, revenue per unit of traffic has increased over 2013/14 levels and the Corporation has
maintained the previous efficiencies realized with respect to the cost per unit of traffic. Both
passenger and commercial traffic levels continued to decline during the year. The decrease in traffic
levels has been more than offset by cost savings initiatives as well as rate increases.
Customer satisfaction levels for the Corporation’s passenger traffic are continuing to trend in a
positive direction, with 2014/15 results projected to exceed the Corporation’s targets for both
overall customer satisfaction and the percentage of customers that would be likely to recommend
Marine Atlantic to friends and family.
MAI received confirmation from the Government of Canada that it has approved funding for both
2015/16 and 2016/17, with additional funding allocated for 2017/18 to allow the Corporation to
continue on the path towards a homogenous fleet. This is a major milestone for the Corporation.
With the approved funding and the approval of the Corporation’s 2014/15 Corporate Plan, MAI is
planning to purchase both the MV Highlanders and the MV Blue Puttees at the end of their current
charter period in 2015/16. The Corporation has also officially renewed the MV Atlantic Vision’s
charter agreement until 2017/18 and in 2015/16 will begin the search to replace it with a new
vessel. The MV Leif Ericson will remain in the Corporation’s fleet for the upcoming planning period.
All rates increased by 3% on April 1, 2014. Given the recent fluctuation in oil prices, MAI will
review its fuel surcharge on a regular basis, and increase or decrease it as required based on the
price of oil and the Corporation’s overall fuel costs. The Corporation will continue to explore ways
to reduce fuel consumption and has already installed fuel monitoring equipment to help manage
fuel consumption on the MV Blue Puttees and the MV Highlanders.
With most of the Corporation’s collective bargaining agreements expired, contract negotiations will
continue into 2015/16. MAI hopes to conclude negotiations and settle all of its remaining collective
bargaining contracts before the end of the 2015/16 fiscal year. This will also provide stability with
the workforce; a key element to future success.
For the upcoming planning period, the Corporation will continue to build on previous successes and
successfully deliver on the Strategic Priorities identified by the Corporation’s Board of Directors:
Safety, reliability and cost efficiency.
ii | P a g e
Contents Executive Summary .................................................................................................................................................................. i
1.0 Introduction ............................................................................................................................................................... 1
Vision Statement ................................................................................................................................................................. 1
Mission Statement .............................................................................................................................................................. 1
Corporate Values................................................................................................................................................................. 1
Governance Structure ....................................................................................................................................................... 1
Executive Team ................................................................................................................................................................... 3
Workforce .............................................................................................................................................................................. 4
Organizational Structure ................................................................................................................................................. 4
MAI’s Strategic Priorities ................................................................................................................................................. 4
MAI’s Strategic Objectives ............................................................................................................................................... 5
2.0 The Year in Review – 2014/15 ................................................................................................................................... 5
Accomplishments to Date ................................................................................................................................................ 6
Report on Savings Commitments ................................................................................................................................. 6
Bar Harbor ............................................................................................................................................................................. 7
2014/15 Strategic Initiatives Update ......................................................................................................................... 7
3.0 Situation Analysis ........................................................................................................................................................... 10
2015 Economic Outlook ................................................................................................................................................. 10
Demographic Trends ....................................................................................................................................................... 11
Consumer Trends ............................................................................................................................................................. 12
Impact of Air Travel ......................................................................................................................................................... 13
SWOT Analysis ................................................................................................................................................................... 14
4.0 Looking Ahead – 2015/16 – 2019/20 ................................................................................................................... 15
Fleet ........................................................................................................................................................................................ 15
Vessel Maintenance ......................................................................................................................................................... 16
Shore Based Operations ................................................................................................................................................. 16
Enterprise Risk Management ...................................................................................................................................... 17
Pension Plan ....................................................................................................................................................................... 18
2015/16 Strategic Initiatives ....................................................................................................................................... 18
5.0 Financial Outlook ........................................................................................................................................................... 20
Traffic Demand and Revenue Forecasts .................................................................................................................. 20
Operating Expenses ......................................................................................................................................................... 21
iii | P a g e
Fuel Expense .................................................................................................................................................................... 21
Foreign Exchange Rate ................................................................................................................................................. 21
Labour Costs .................................................................................................................................................................... 21
Inflation Rates ................................................................................................................................................................. 22
Pension Costs .................................................................................................................................................................. 22
Capital Requirements...................................................................................................................................................... 22
Cost Recovery ..................................................................................................................................................................... 23
6.0 Key Performance Indicators ...................................................................................................................................... 23
7.0 Specific Approvals Sought .......................................................................................................................................... 23
Bank Line of Credit ........................................................................................................................................................... 23
8.0 Financial Statements..................................................................................................................................................... 24
Statement A: Statement of Financial Position .......................................................................................................... 25
Statement B: Statement of Operations and Accumulated Surplus .................................................................... 27
Statement C: Statement of Remeasurement Gains and Losses .......................................................................... 29
Statement D: Statement of Changes in Net Financial Assets (Debt) ................................................................. 30
Statement E: Statement of Cash Flows ....................................................................................................................... 31
Appendix A – Risk Management Framework ............................................................................................................. 33

1 | P a g e
1.0 Introduction When Newfoundland joined Canada in 1949, the ferry service between the Province of Newfoundland and
Labrador and the mainland was accorded special constitutional status under Term 32(1) of the Terms of
Union (The Newfoundland Act, 1949) which guarantees that Canada will “maintain in accordance with the
traffic offering a freight and passenger steamship service between North Sydney and Port aux Basques,
which, on completion of a motor highway between Corner Brook and Port aux Basques, will include suitable
provision for the carriage of motor vehicles”. Marine Atlantic exists to fulfill that mandate.
Marine Atlantic was created on June 27, 1986 as a parent Crown Corporation through the Marine Atlantic
Inc. Acquisition Authorization Act. As a Crown Corporation, Marine Atlantic is regulated under Part X of
the Financial Administration Act. As per the Order in Council of March 12, 1987 (P.C. 1987-463), the
Bilateral Agreement between Her Majesty the Queen and Marine Atlantic established the relationship
between the Parties under which subsidiary operating, capital, and land lease agreements relating to the
operation of specific ferry and coastal services in Atlantic Canada may be executed.
Vision Statement
To ensure that MAI’s Vision Statement is reflective of the organization’s current state, the Board of
Directors met in October of 2014 to revisit the statement. MAI’s new vision statement is “Building on our
rich tradition, we provide a valued public transportation link that enhances the well-being of our customers
and those who depend on them.”
Mission Statement
The Corporation’s Mission Statement is “to provide a safe, environmentally responsible and quality ferry
service between the Island of Newfoundland and the Province of Nova Scotia in a reliable, courteous and
cost-effective manner”.
Corporate Values
In 2013-2014, MAI introduced its Corporate Values throughout the organization.
1. Safety - Protection of people, property, and the environment is our ultimate priority.
2. Integrity - We say what we mean, mean what we say, and do what we say.
3. Excellence - We are passionate about our internal and external customers and our services.
4. Teamwork - We always help each other. Working together always results in better outcomes.
5. Commitment - We are all responsible for our performance and the success of the business.
Governance Structure
Like all Crown corporations, Marine Atlantic was established to allow it to operate at arm’s length from its
sole shareholder, the Government of Canada. While the shareholder provides policy direction and funding
for the Corporation’s ongoing operations, as stated in the Financial Administration Act, Marine Atlantic’s
Board of Directors ensures that the Corporation fulfils its mandate by setting the Corporation’s strategic
direction and organizational goals and overseeing their implementation by management. Up to ten Board
members are appointed. The Chairman of the Board and the President and CEO are appointed by the
Governor in Council on the recommendation of the Minister of Transport and the Board of Directors are
appointed by the Minister of Transport with the approval of the Governor in Council.
2 | P a g e
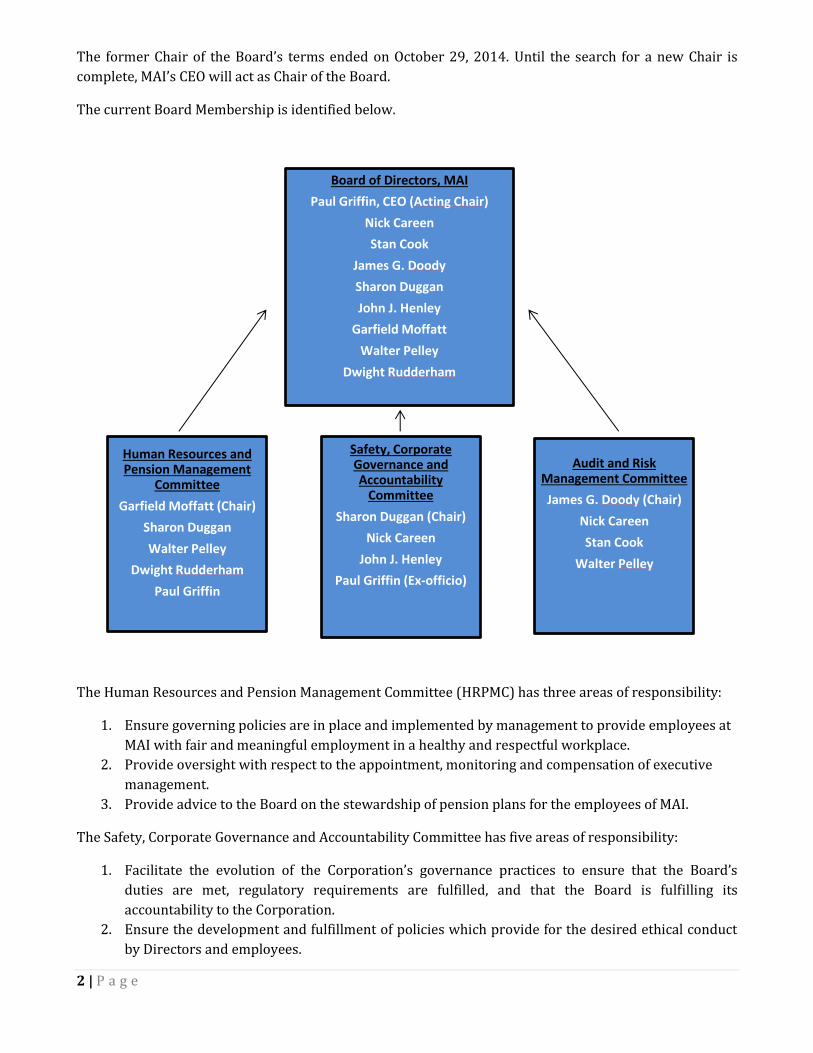
The former Chair of the Board’s terms ended on October 29, 2014. Until the search for a new Chair is
complete, MAI’s CEO will act as Chair of the Board.
The current Board Membership is identified below.
The Human Resources and Pension Management Committee (HRPMC) has three areas of responsibility:
1. Ensure governing policies are in place and implemented by management to provide employees at
MAI with fair and meaningful employment in a healthy and respectful workplace.
2. Provide oversight with respect to the appointment, monitoring and compensation of executive
management.
3. Provide advice to the Board on the stewardship of pension plans for the employees of MAI.
The Safety, Corporate Governance and Accountability Committee has five areas of responsibility:
1. Facilitate the evolution of the Corporation’s governance practices to ensure that the Board’s
duties are met, regulatory requirements are fulfilled, and that the Board is fulfilling its
accountability to the Corporation.
2. Ensure the development and fulfillment of policies which provide for the desired ethical conduct
by Directors and employees.
Human Resources and Pension Management
Committee
Garfield Moffatt (Chair)
Sharon Duggan
Walter Pelley
Dwight Rudderham
Paul Griffin
Safety, Corporate Governance and Accountability
Committee
Sharon Duggan (Chair)
Nick Careen
John J. Henley
Paul Griffin (Ex-officio)
Board of Directors, MAI
Paul Griffin, CEO (Acting Chair)
Nick Careen
Stan Cook
James G. Doody
Sharon Duggan
John J. Henley
Garfield Moffatt
Walter Pelley
Dwight Rudderham
Audit and Risk Management Committee
James G. Doody (Chair)
Nick Careen
Stan Cook
Walter Pelley
3 | P a g e
3. Oversee the social accountability of MAI with respect to the community and the environment.
4. Ensure governing policies are in place and implemented by management to provide employees at
MAI with employment in a healthy and safe workplace.
5. Ensure that MAI has a robust and appropriate strategic plan.
The Audit and Risk Committee oversees MAI’s standards for financial reporting, internal audit, risk
management and management control practices. Specifically, the Committee will provide governance and
oversight in the following areas:
1. Oversee the design and establishment of an appropriate enterprise risk management (ERM)
framework for identifying and managing risks inherent to the business and operations of MAI.
2. Ensure that the elements of a financial control framework are in place to support management in
achieving corporate goals and objectives.
3. Ensure that there are effective processes in place to prepare and present the annual operating
budget (corporate plan) for Board approval, and to monitor, manage and report on performance
relative to the approved annual budget.
4. Provide for the independence of the internal audit function and to ensure that a risk based
internal audit methodology is used in the conduct of its work.
5. Provide oversight of the external auditors on the delivery of their financial audit services for the
benefit of the shareholder.
Each committee reports directly into the BOD, and each meets at least quarterly, with additional meetings
scheduled as required.
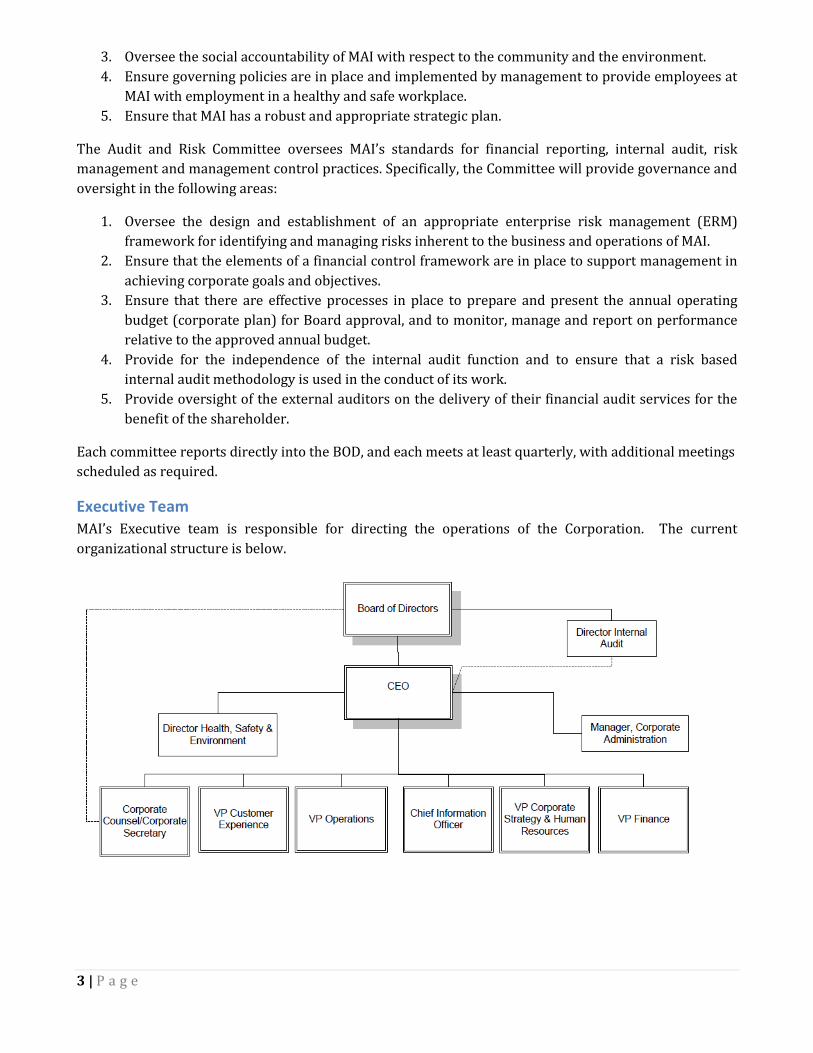
Executive Team
MAI’s Executive team is responsible for directing the operations of the Corporation. The current
organizational structure is below.
4 | P a g e
Workforce
Marine Atlantic has a diverse workforce that is represented by six bargaining units as well as a number of
management/non-union employees. The breakdown in full time equivalents (FTEs) by agreement is
outlined below.
Organizational Structure
To better manage the changing needs of the organization, the Corporation implemented a slight
organizational restructuring in October of 2014. The goal of the restructuring was to increase
management capacity to help drive further change throughout the organization, as well as to allow the
Corporation to increase its focus on its strategic priorities. Some highlights of the restructuring include
the implementation of a new Health, Safety and Environment Division, the implementation of a new
Associate Vice President of Operations position to be responsible for vessel operations and maintenance
and the amalgamation of the Strategy and Corporate Affairs Division with the Human Resources Division
(to form the Corporate Strategy and Human Resources Division).
MAI’s Strategic Priorities
In October of 2012, MAI’s Board of Directors identified three main areas of strategic focus for the
organization. The Corporation continues to manage its strategic planning process within the realm of
these strategic priorities:
Agreement & Expiry Date
Representing Bargaining Agent Collective Bargaining
Status
2014/15 Year End Forecast
FTEs
A Dec-31-2013 Licensed Officers
Canadian Merchant Service Guild (CMSG)
Agreement expired 31 December 2013
131
B Dec-31-2013
Unlicensed Vessel Crew
Unifor Agreement expired 31 December 2013
394
C Dec-31-2013
Shore-Based Maintenance Employees
Unifor Agreement expired 31 December 2013
61
D Dec-31-2016 Shore-Based Terminal and Clerical Employees
The United Steel Workers/ International Longshoremen, Council of Trade Unions
Agreement expires 31 December 2016
266
E Dec-31-2012 Masters, Chief Engineers and Chief Electrical Officers
Canadian Merchant Service Guild
Agreement expired 31 December 2012
28
F Dec-31-2013 Shore-Based Supervisory Employees
Public Service Alliance of Canada
Agreement expired 31 December 2013
66
N/A Management / Non-Union
N/A N/A
80
Total 1,026
5 | P a g e
1. Safety
The number one priority of the organization
An integral part of everything MAI does
2. Reliability
Increased focus on improving service reliability, improving on-time performance, and
reducing service interruptions
3. Cost Efficiency
The identification and implementation of operational efficiencies to drive improved financial
performance
MAI’s Strategic Objectives
In October 2013, MAI’s Board of Directors identified five strategic objectives for the Corporation to
further guide the Corporation’s strategic direction.
1. Improve the safety culture of the organization.
2. Create and implement a strategy to increase leadership capabilities, create an appropriate performance management culture and process, clarify roles and responsibilities, and adequately match supply and demand for skills.
3. Increase effectiveness of stakeholder/shareholder engagement and management.
4. Create a process and technology architecture to support strategic business objectives.
5. Create and implement a commercial customer strategy.
These continue to be the focus of the 2015/16 Strategic Plan, with all initiatives designed to deliver on one or more of these five objectives.
In 2014/15 MAI’s Board of Directors reconfirmed the Corporation’s strategic direction.
2.0 The Year in Review – 2014/15 2014-15 was another successful year for Marine Atlantic. The Corporation is continuing to deliver an
efficient and timely service with on time performance levels reaching 93% in 2014/15. This is well above
the Corporation’s target and a clear indicator that the investments that the Corporation has made in its
vessels and shore based infrastructure are paying off. Further improvements in the Corporation’s
business processes will help to sustain current progress and drive further efficiencies across the
Corporation.
With the significant investment of cash in the Corporation by the Shareholder in Budget 2010, the
Corporation has been able to successfully address all of the issues identified by the OAG in the 2009
Special Exam (all recommendations were implemented by 2014/15).
Financial results for the 2014/15 fiscal year have been positive. Cost recovery has remained stable at
70.1%, revenue per unit of traffic has increased over 2013/14 levels and the Corporation has maintained
the previous efficiencies realized with respect to the cost per unit of traffic. Both passenger and

6 | P a g e
commercial traffic levels continued to decline during the year. The decrease in traffic levels has been
more than offset by cost savings initiatives as well as rate increases.
Customer satisfaction levels for the Corporation’s passenger traffic are continuing to trend in a positive
direction, with 2014/15 results projected to exceed the Corporation’s targets for both overall customer
satisfaction and the percentage of customers that would be very likely to recommend Marine Atlantic to
friends and family.
Accomplishments to Date
Despite some service interruptions and ongoing weather delays, overall PRV (personal related vehicle)
customer satisfaction came in at 73% for 2014/15 October year to date compared to 69% for the same
period last year. Terminal satisfaction has increased slightly to 75% from 74% for the same time period
and onboard satisfaction results have remained stable at 76%.
Report on Savings Commitments
The table below outlines the Corporation’s Revitalization Strategy savings opportunities, its Budget 2011
savings commitments and also its Budget 2012 savings commitments. The Corporation is committed to
achieving these savings opportunities.
Year Revitalization Strategy
Opportunities (in millions)
Budget 2011 Savings Commitments
(in millions)
Budget 2012 Savings Commitments
(in millions) Total
2011/12 $ 2.40 $ - $ - $ 2.40
2012/13 $ 5.00 $ 1.22 $ 0.50 $ 6.72
2013/14 $ 7.00 $ 5.40 $ 2.20 $ 14.60
2014/15 & onward $ 7.00 $ 5.40 $ 10.90 $ 23.30
The Corporation’s forecasted year end results for 2014/15 and the pro forma financials included within
this Corporate Plan for 2015/16 demonstrate that the Corporation has achieved its overall savings
targets, as evidenced by the Corporation’s ability to operate successfully within the reduced funding
amounts available to it as a result of these savings targets.
The overall savings generated are a culmination of a number of productivity improvements and efficiency
measures that include but are not limited to: a.) fine-tuning of the vessel operating plan and sailing
schedule, b.) significant changes to the Corporation’s maintenance programs, including a reduction in
annual vessel maintenance periods from two to one, c.) fuel savings initiatives, including the advancement
of shore power for the Corporation’s vessels, and d.) a reduction in overtime expenditures.
While the Corporation did not follow the exact path as originally intended to achieve the proposed
savings, which makes it difficult to link the overall savings to the originally proposed savings measures,
the results speak for themselves. Prior to the implementation of the Budget 2012 savings commitments,
for example, MAI had forecasted maintenance expenses at $18.9M for 2014/15. Forecast results show
maintenance expense at only $9.2M, over a 50% reduction. Changes to the overtime policy have resulted
in a 50% reduction in forecasted overtime expense for 2014/15 when compared to 2009/2010 levels, for
an annual savings of $2.3M. All of these activities combined have enabled MAI to meet its savings
commitments to date, and ensures that the Corporation will be able to sustain these savings in the future.
It must be noted that while not part of its savings commitments, Marine Atlantic was directed to assume
the responsibility for washing vehicles at the Canadian Food Inspection Agency’s (CFIA) vehicle treatment
7 | P a g e
facilities in both Port aux Basques and Argentia in 2014, as part of the CFIA’s Budget 2012 savings
commitments.
Bar Harbor
Marine Atlantic owns a terminal facility located in Bar Harbor, Maine that is surplus to its needs and
outside of its current mandate. The Corporation has undergone an environmental assessment of the
property and has developed remediation plans to address any environmental issues. An appraisal was
also conducted on the property.
MAI has received Shareholder concurrence to divest of this property, and currently has a tentative
agreement in place with a potential buyer. This deal is subject to a successful negotiation regarding the
handling and future responsibility for the environmental liabilities associated with the property. The
Corporation plans to use the proceeds of the sale to supplement its capital program.
2014/15 Strategic Initiatives Update
The Corporation implemented its Strategic Planning process in 2013/14 to develop the strategic
initiatives that were the focus of MAI’s activities in 2014/15. While several of these initiatives will be
completed at the end of fiscal 2014/15, most represent multi-year projects that will be carried forward
into 2015/16 and beyond.
Updates on these strategic initiatives are outlined below.
Strategic Objective Strategic Initiative 2014/15 Year End Objectives
Improve the Safety Culture
Review the structure and governance of the Safety Management Program a) Determine requirements to adequately resource HSE Department b) Review Disability Management Program and implement required improvements c) Revamp Safety Reporting System to increase quality and validity of information
Complete
Implement TC approved Hazard Prevention Program
Complete
Obtain certification under the Green Marine Environmental Certification Program
Certification process well underway - certification in early 2015/16
Create and Implement a Strategy to Increase Leadership Capabilities, Create an Appropriate Performance
Complete Roles and Responsibilities Agreements and Implement a Corporate Performance Management Program
Management/supervisory group has performance management agreements in place for the following year and training/education has taken place
8 | P a g e
Strategic Objective Strategic Initiative 2014/15 Year End Objectives
Management Culture, Clarify Roles and Responsibilities, and Match Supply and Demand for Skills
Continued implementation of Leadership Development Program
Complete
Develop Vessel Staff Standardized Education and Evaluation Program
-RFP awarded for pilot program -Fleet Operations Officer engaged with vendor -Project plan development initiated
Establishment of Work Standards (Starting with PAX in 2014/15)
50% of work processes documented and tested
Recruitment, Selection, Retention System Review
Complete
Develop a Workforce Plan Complete
Corporate Values Integration
-High level plan in place -Project Team identified -Graphics developed and launched
Increase Effectiveness of Stakeholder/ Shareholder Engagement and Management
Develop a Stakeholder Relations Plan to ensure all key stakeholders – both internal and external – are kept informed of and engaged with ongoing activities at MAI.
-Plan fully developed and signed off by Executive -Reporting mechanism implemented and reporting commenced
9 | P a g e
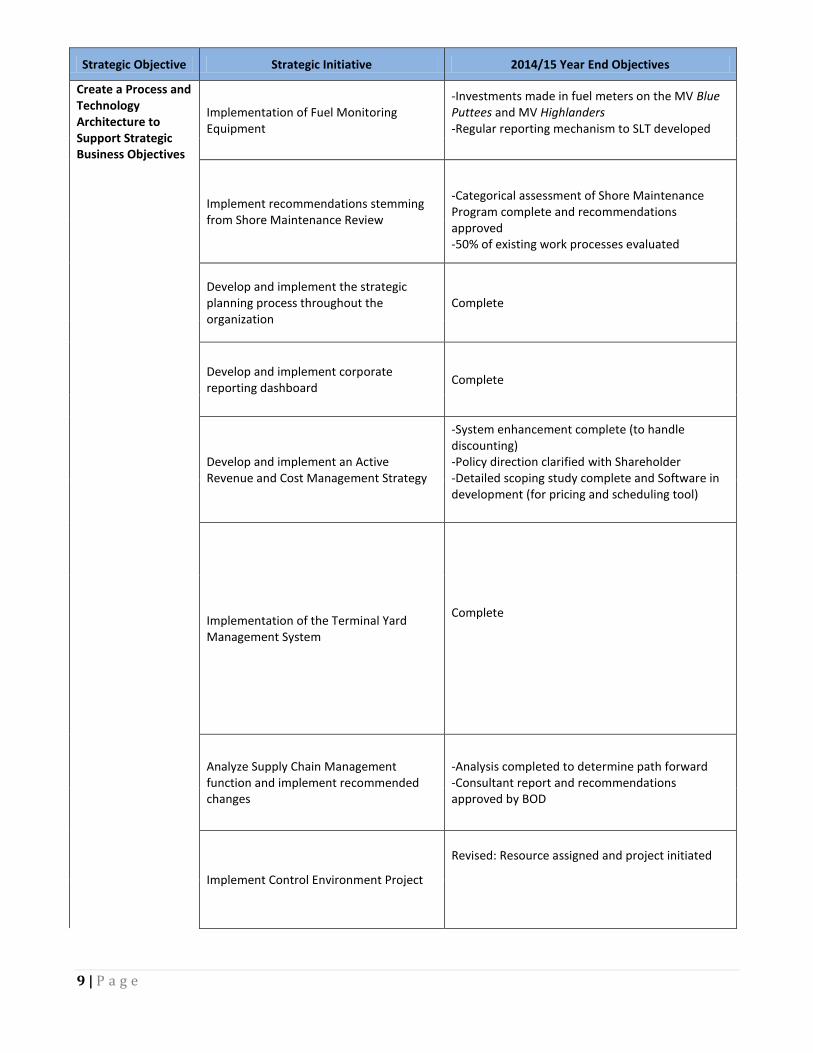
Strategic Objective Strategic Initiative 2014/15 Year End Objectives
Create a Process and Technology Architecture to Support Strategic Business Objectives
Implementation of Fuel Monitoring Equipment
-Investments made in fuel meters on the MV Blue Puttees and MV Highlanders -Regular reporting mechanism to SLT developed
Implement recommendations stemming from Shore Maintenance Review
-Categorical assessment of Shore Maintenance Program complete and recommendations approved -50% of existing work processes evaluated
Develop and implement the strategic planning process throughout the organization
Complete
Develop and implement corporate reporting dashboard
Complete
Develop and implement an Active Revenue and Cost Management Strategy
-System enhancement complete (to handle discounting) -Policy direction clarified with Shareholder -Detailed scoping study complete and Software in development (for pricing and scheduling tool)
Implementation of the Terminal Yard Management System
Complete
Analyze Supply Chain Management function and implement recommended changes
-Analysis completed to determine path forward -Consultant report and recommendations approved by BOD
Implement Control Environment Project
Revised: Resource assigned and project initiated
10 | P a g e
Strategic Objective Strategic Initiative 2014/15 Year End Objectives
Business Process Renewal -Steering Committee and Project Team established -Business process master list developed -Current state analysis commenced
Complete IT Vulnerability Security and Information Protection Project
Complete
Create and Implement a Commercial Customer Strategy
Review commercial traffic management and make recommended improvements
Traffic backlog issue fully analyzed
Develop a new focused marketing strategy on how to better meet the needs of our commercial customers
Complete
Effective management and utilization of our vehicle deck space to drive revenue and improve customer satisfaction
Project Team Identified
Review customer touch points and make recommended improvements
Consultant developed process map, identifying total virtual and live customer experience from start to finish
3.0 Situation Analysis In order to determine the best course of action to deliver on the Corporation’s strategic direction, a
review of MAI’s current operating environment was completed and is reviewed annually for any changes.
After reviewing the economic environment in which the Corporation operates, the demographic trends of
its key market, the trends in consumer behaviour, and the resulting traffic trends, a SWOT analysis was
completed. A SWOT analysis looks at the strengths and weaknesses of the organization, in relation to the
opportunities and threats of the environment in which it operates.
2015 Economic Outlook
According to the Atlantic Provinces Economic Council, the economy of Newfoundland and Labrador (NL)
will start to soften in 2014. As indicated in the chart below, a rebound in oil production lifted the GDP
growth to 7.9% in NL in 2013. However, with little change in oil production or investment, a slight
decline in real GDP growth is expected in 2014, with a slight rebound in 2015.
Also, in January 2014, Goldman Sachs released its forecast for oil prices, noting that the U.S. benchmark
West Texas Intermediate crude is expected to fall to $46 a barrel in early 2015 (first quarter), down
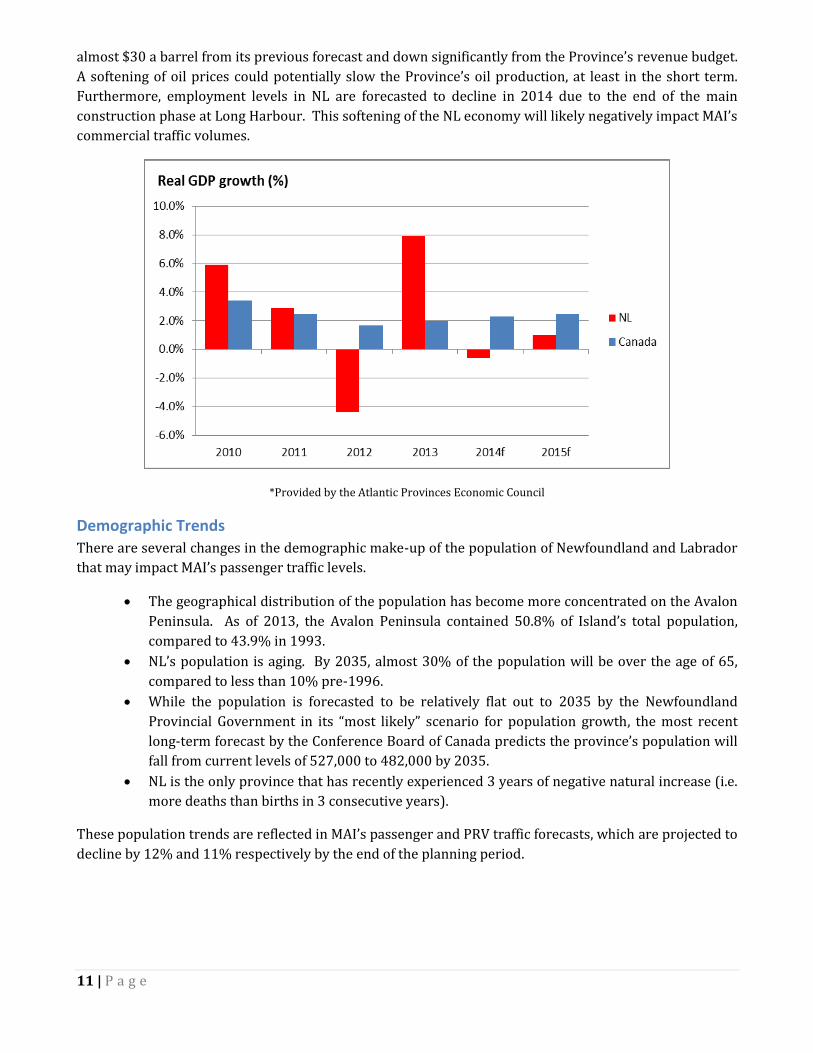
11 | P a g e
almost $30 a barrel from its previous forecast and down significantly from the Province’s revenue budget.
A softening of oil prices could potentially slow the Province’s oil production, at least in the short term.
Furthermore, employment levels in NL are forecasted to decline in 2014 due to the end of the main
construction phase at Long Harbour. This softening of the NL economy will likely negatively impact MAI’s
commercial traffic volumes.
*Provided by the Atlantic Provinces Economic Council
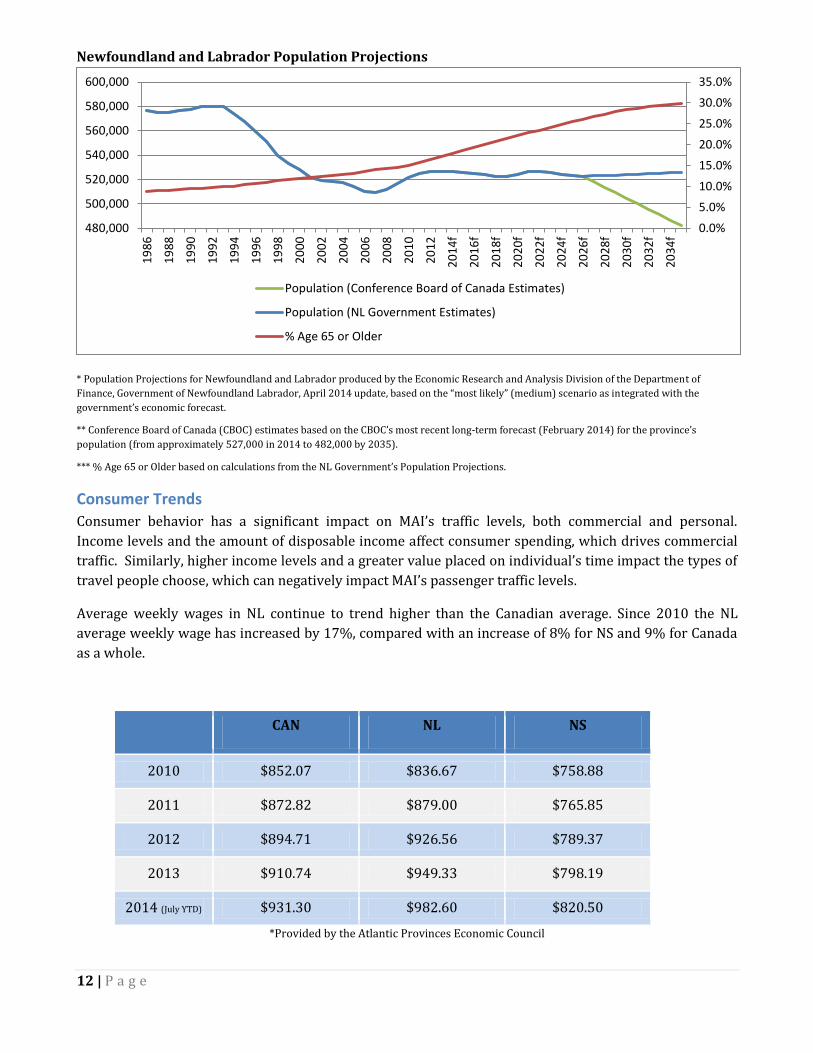
Demographic Trends
There are several changes in the demographic make-up of the population of Newfoundland and Labrador
that may impact MAI’s passenger traffic levels.
The geographical distribution of the population has become more concentrated on the Avalon
Peninsula. As of 2013, the Avalon Peninsula contained 50.8% of Island’s total population,
compared to 43.9% in 1993.
NL’s population is aging. By 2035, almost 30% of the population will be over the age of 65,
compared to less than 10% pre-1996.
While the population is forecasted to be relatively flat out to 2035 by the Newfoundland
Provincial Government in its “most likely” scenario for population growth, the most recent
long-term forecast by the Conference Board of Canada predicts the province’s population will
fall from current levels of 527,000 to 482,000 by 2035.
NL is the only province that has recently experienced 3 years of negative natural increase (i.e.
more deaths than births in 3 consecutive years).
These population trends are reflected in MAI’s passenger and PRV traffic forecasts, which are projected to
decline by 12% and 11% respectively by the end of the planning period.
12 | P a g e
Newfoundland and Labrador Population Projections
* Population Projections for Newfoundland and Labrador produced by the Economic Research and Analysis Division of the Department of
Finance, Government of Newfoundland Labrador, April 2014 update, based on the “most likely” (medium) scenario as integrated with the
government’s economic forecast.
** Conference Board of Canada (CBOC) estimates based on the CBOC’s most recent long-term forecast (February 2014) for the province’s
population (from approximately 527,000 in 2014 to 482,000 by 2035).
*** % Age 65 or Older based on calculations from the NL Government’s Population Projections.
Consumer Trends
Consumer behavior has a significant impact on MAI’s traffic levels, both commercial and personal.
Income levels and the amount of disposable income affect consumer spending, which drives commercial
traffic. Similarly, higher income levels and a greater value placed on individual’s time impact the types of
travel people choose, which can negatively impact MAI’s passenger traffic levels.
Average weekly wages in NL continue to trend higher than the Canadian average. Since 2010 the NL
average weekly wage has increased by 17%, compared with an increase of 8% for NS and 9% for Canada
as a whole.
CAN NL NS
2010 $852.07 $836.67 $758.88
2011 $872.82 $879.00 $765.85
2012 $894.71 $926.56 $789.37
2013 $910.74 $949.33 $798.19
2014 (July YTD) $931.30 $982.60 $820.50
*Provided by the Atlantic Provinces Economic Council
0.0%
5.0%
10.0%
15.0%
20.0%
25.0%
30.0%
35.0%
480,000
500,000
520,000
540,000
560,000
580,000
600,000
19
86
19
88
19
90
19
92
19
94
19
96
19
98
20
00
20
02
20
04
20
06
20
08
20
10
20
12
20
14
f
20
16
f
20
18
f
20
20
f
20
22
f
20
24
f
20
26
f
20
28
f
20
30
f
20
32
f
20
34
f
Population (Conference Board of Canada Estimates)
Population (NL Government Estimates)
% Age 65 or Older
13 | P a g e
Meanwhile, retail growth rates in NL have been increasing at a faster rate than both Canada and Nova
Scotia in recent years, although, as shown below, those growth rates are projected to decline by the end of
2014, with a further decrease projected for 2015.
CAN NL NS
2013 3.2% 5.0% 2.9%
2014f 4.6% 4.1% 3.4%
2015f 2.5% 2.5% 2.4%
*Provided by the Atlantic Provinces Economic Council
The increase in retail spending has had a positive impact on MAI’s CRV (commercial related vehicle)
traffic over the past several years; however, a projected decrease in 2014 and 2015 could result in lower
CRV traffic levels for MAI, as already evidenced in declining commercial traffic throughout 2014-15. As a
result, the Corporation has numerous strategic initiatives in place aimed at commercial customers that
will help to maintain modest commercial traffic growth moving forward.
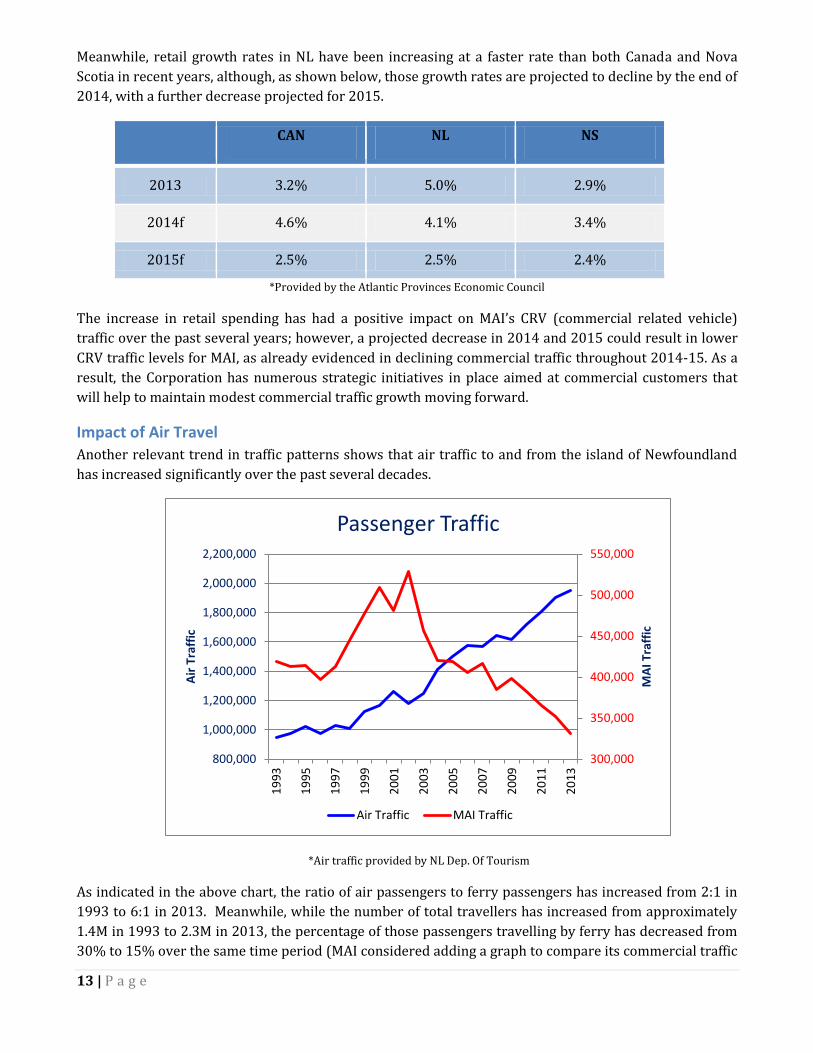
Impact of Air Travel
Another relevant trend in traffic patterns shows that air traffic to and from the island of Newfoundland
has increased significantly over the past several decades.
*Air traffic provided by NL Dep. Of Tourism
As indicated in the above chart, the ratio of air passengers to ferry passengers has increased from 2:1 in
1993 to 6:1 in 2013. Meanwhile, while the number of total travellers has increased from approximately
1.4M in 1993 to 2.3M in 2013, the percentage of those passengers travelling by ferry has decreased from
30% to 15% over the same time period (MAI considered adding a graph to compare its commercial traffic
300,000
350,000
400,000
450,000
500,000
550,000
800,000
1,000,000
1,200,000
1,400,000
1,600,000
1,800,000
2,000,000
2,200,000
19
93
19
95
19
97
19
99
20
01
20
03
20
05
20
07
20
09
20
11
20
13
MA
I Tra
ffic
Air
Tra
ffic
Passenger Traffic
Air Traffic MAI Traffic
14 | P a g e
to the total commercial traffic moving to/from the Island, but there was not enough publicly available
information to illustrate this comparison).
With newer choices in discount air carriers, more routes, and direct charter flights to many top vacation
destinations, this trend will likely continue.
SWOT Analysis
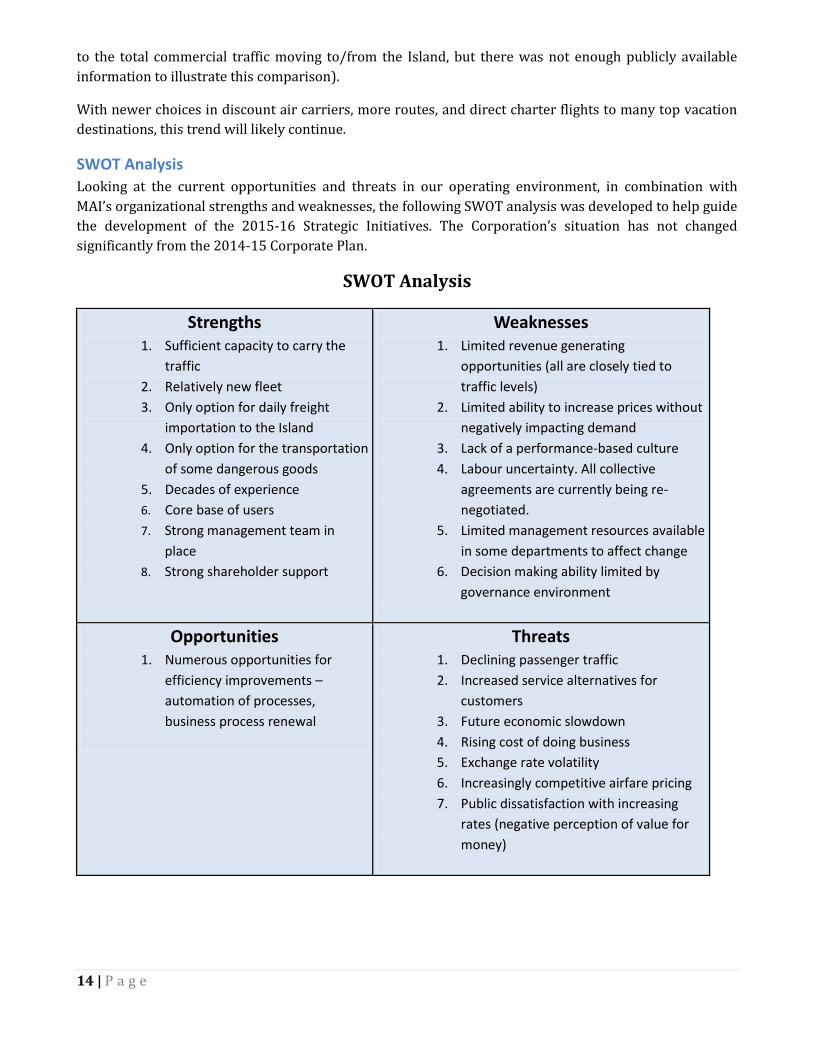
Looking at the current opportunities and threats in our operating environment, in combination with
MAI’s organizational strengths and weaknesses, the following SWOT analysis was developed to help guide
the development of the 2015-16 Strategic Initiatives. The Corporation’s situation has not changed
significantly from the 2014-15 Corporate Plan.
SWOT Analysis
Strengths 1. Sufficient capacity to carry the
traffic
2. Relatively new fleet
3. Only option for daily freight
importation to the Island
4. Only option for the transportation
of some dangerous goods
5. Decades of experience
6. Core base of users
7. Strong management team in
place
8. Strong shareholder support
Weaknesses 1. Limited revenue generating
opportunities (all are closely tied to
traffic levels)
2. Limited ability to increase prices without
negatively impacting demand
3. Lack of a performance-based culture
4. Labour uncertainty. All collective
agreements are currently being re-
negotiated.
5. Limited management resources available
in some departments to affect change
6. Decision making ability limited by
governance environment
Opportunities 1. Numerous opportunities for
efficiency improvements –
automation of processes,
business process renewal
Threats 1. Declining passenger traffic
2. Increased service alternatives for
customers
3. Future economic slowdown
4. Rising cost of doing business
5. Exchange rate volatility
6. Increasingly competitive airfare pricing
7. Public dissatisfaction with increasing
rates (negative perception of value for
money)
15 | P a g e
4.0 Looking Ahead – 2015/16 – 2019/20 2015/16 will be an exciting year for MAI, as the Corporation continues to build on the successes of the
past five years. Since 2013, MAI has been working diligently with Transport Canada to secure funding for
its long term fleet strategy. MAI received confirmation from the Government of Canada that it has
approved operating funding for both 2015/16 and 2016/17, with additional funding allocated for
2017/18 to allow MAI to continue down the path towards a homogenous fleet.
A significant portion of the approved funding will enable MAI to purchase both the MV Blue Puttees and
the MV Highlanders at the end of their current charter period in 2015/16. This is a major milestone for
the organization. Since being brought into service, these vessels have allowed MAI to achieve the
operational efficiencies and high level of customer satisfaction as noted earlier in this plan. By purchasing
them outright, MAI benefits not only financially, but also strategically, as it is now in a position to build a
homogenous fleet. Purchasing the vessels also provides a level of stability for the organization, as the
uncertainty around the makeup of the fleet and availability of replacement vessels is removed for a
significant period of time.
The Shareholder also provided MAI with sufficient funding to secure the MV Atlantic Vision until 2017/18,
along with sufficient monies to start the process of replacing the vessel. Again, this decision allows MAI to
proceed with its long term fleet strategy, while providing a degree of stability around its current fleet.
The Corporation hopes to settle the current contract negotiations with all of its collective bargaining units
in 2015/16.
2015/16 will also see the completion of the new ferry terminal in North Sydney, another significant
milestone for the organization. This terminal will put a more modern face on the organization, and allow
MAI to continue to meet its customers’ demands.
Fleet
With the approval of the Corporation’s 2014/15 Corporate Plan, MAI is planning for the following with
respect to fleet renewal over the upcoming planning period:
The Corporation will purchase both the MV Blue Puttees and the MV Highlanders according to the
terms of the existing agreement. In February 2015, MAI will give notice to Stena that the
Corporation will be purchasing both of the vessels with the plan of finalizing the purchase in
December 2015.
The Corporation has successfully negotiated a renewed charter agreement for the MV Atlantic
Vision. This agreement will allow MAI to have some stability from a fleet perspective until
2017/18, while it begins its search for a replacement vessel.
The process to replace the MV Atlantic Vision will start immediately. MAI will establish an internal
committee made up of various employees at the executive and operational levels to discuss all of
the options available to the Corporation for vessel replacement. Brokers will be engaged to ensure
that MAI is well connected to the various vessel owners.
One of the key considerations for the replacement of the MV Atlantic Vision is the availability of
funding for fleet renewal beyond 2017/18. While the Shareholder has provided funding over the
16 | P a g e
next three years to begin the search for the vessel’s replacement, the Corporation does not have
the funding or the authority to commit any monies beyond its current funding period.
The MV Leif Ericson will continue to be a part of the fleet for the upcoming planning period. The
requirement to replace the MV Leif Ericson will be assessed as traffic demand dictates.
Vessel Maintenance
Marine Atlantic has made significant strides in its vessel maintenance practices in recent years. The
recommendations that were implemented from the DNV (Det Norske Veritas) review have helped to
position the Corporation to have a better overall understanding of its preventative maintenance needs.
Moving forward this will help enable MAI to continue to be an efficient operation with a high degree of
on-time performance that is capable of meeting the traffic demand throughout the year.
In 2015/16 the Corporation has three dry-dockings planned for the MV Highlanders, the MV Atlantic
Vision and the MV Leif Ericson, in order to complete the two year inspection of each vessel’s hull as per
regulatory requirements. The dry-docking for the MV Blue Puttees will occur early in 2016/17. While MAI
received a one year extension for the regulatory dry-docking from the MTRB (Marine Technical Review
Board) early in 2014/15 for this vessel (due to shipyard capacity limitations), the Corporation was able to
perform the required dry-docking work in Boston, Massachusetts.
One of the current risks that MAI faces with respect to vessel maintenance is the lack of availability of
shipyards to do the necessary work. The shipyard that MAI has historically used is not available, so MAI
is currently in the process of issuing an RFP for dry docking facilities. The response to this RFP will
determine both the location and costs of dry docking for the upcoming planning period.
Other vessel maintenance will be performed as needed, including any preventative maintenance activities
that the Corporation deems necessary. With the decision to keep the MV Atlantic Vision until 2017, the
Corporation is planning to complete additional maintenance on the vessel. This will drive additional
maintenance costs in 2015/16. As well, as the MV Leif Ericson approaches 25 years in service, the
Corporation anticipates that maintenance costs may increase to ensure that the vessel continues to
operate in a reliable, effective and efficient manner.
Shore Based Operations
The spring of 2015 will see the opening of the Corporation’s new Terminal Building in North Sydney. The
building will be located on the opposite side of the marshalling yard from the former terminal building,
adjacent to downtown businesses. The new terminal building will allow the Corporation to provide a
greater level of customer service and will also allow for greater traffic management on the North Sydney
terminal lot. The completion of this project will help to position MAI to successfully and efficiently meet
the traffic demand moving forward.
The Corporation has completed phase one of its Shore Based Maintenance Optimization project and now
has a categorical assessment of its Shore Based Maintenance Program. In 2015/16 MAI will be working
with a consultant to implement a new shore based maintenance program, optimized to position MAI for
future success through the identification of correct work flow processes.
MAI will also be reviewing its vehicle loading and deck space allocation methods in 2015/16 to ensure
that MAI is maximizing the amount of vehicles it carries on each crossing and utilizing the optimal amount
17 | P a g e
of vessel deck space for the traffic demand and traffic mix that the Corporation receives throughout the
year.
Enterprise Risk Management
MAI has an Audit and Risk (A&R) Committee which has ultimate oversight of the organization’s risk. VP’s
and Senior Level Managers of the various Divisions monitor and report on their respective risk areas
while a Centralized Risk Department facilitates the organization’s risk process and provides horizontal
leadership with respect to the risks that impact various divisions.
MAI’s current risk process includes a Corporate Risk Profile and seven Divisional Risk Profiles that have
been developed and are formally reviewed by the Board on a quarterly basis. A description of the risk
factors used by the Corporation can be found in Appendix A. Each Divisional profile includes all of the
corporate risks as well as additional risks which are unique to the division. These risk profiles are
comprehensive and include a description of the risks, history and background pertaining to the risk,
inherent risk ratings, current controls, residual risk ratings and planned controls.
The Divisional quarterly review is conducted by the Risk Department who works directly with the VP’s
and Managers of each Division to obtain updates relative to each of the risks. Different approaches are
used to obtain these updates:
- High level general discussions with VP’s and Managers;
- Development of pointed questions pertaining to particular controls, ratings, etc. which form the
basis of the consultation with VP’s and Managers;
- Strategic reviews that focus on a specific level of risks (i.e., High).
The Corporate risk profile quarterly update is compiled based on the Divisional consultations. The Risk
Department will cross reference all divisional updates and build them into the Corporate Risk Register.
When necessary additional questions and or consultations pertaining to a particular risk may need to be
completed in order to ensure a comprehensive update is achieved.
Recognizing that effective risk management is critical to the Corporation’s capacity to meet its objectives,
and that its current risk processes need to be continually improved, MAI is planning to undertake a Risk
Transformation Initiative in 2015/16 designed to create:
1) A more efficient and effective risk management process that is strategically focused on assisting
the Corporation to meet its key objectives.
2) A process that is more aligned with the Strategic Planning Process (i.e., Risk evaluations and
subsequent accountability formally interjected as a component in the implementation of a
Strategic Initiative)
3) A more value added process for individual departments that allows users to identify and monitor
risks which are pertinent at their level.
An external consultant is currently engaged to review the existing Risk Process and assess MAI’s current
state in comparison to industry best practices. A gap analysis identifying areas requiring development
and/or further enhancement will be outlined and will help set the stage for the 2015/16 initiative.
18 | P a g e
Pension Plan
Marine Atlantic’s pension plan is a defined benefit plan. Budget 2013 announced that “the Government
will continue to work with Crown Corporation’s with a view to moving to a 50:50 cost sharing between
the employer and employees by 2017 and aligning the age at which retirement benefits become available
with those announced in the Economic Action Plan 2012 for post-2012 hires under the Public Service
Pension Plan.” Marine Atlantic, as a Crown Corporation, is aligning with these requirements.
For employees hired before January 1, 2014, the normal retirement date is the last day of the month in
which an employee reaches age 65; however, employees may retire as early as age 45. Employees can
work beyond age 65, but must begin to draw their pension at age 71. For employees hired after January
1, 2014, the normal retirement date is the last day of the month in which an employee reaches age 65;
however, an employee may retire as early as age 55. If an employee has 30 years of allowable service, the
employee may retire as early as 50.
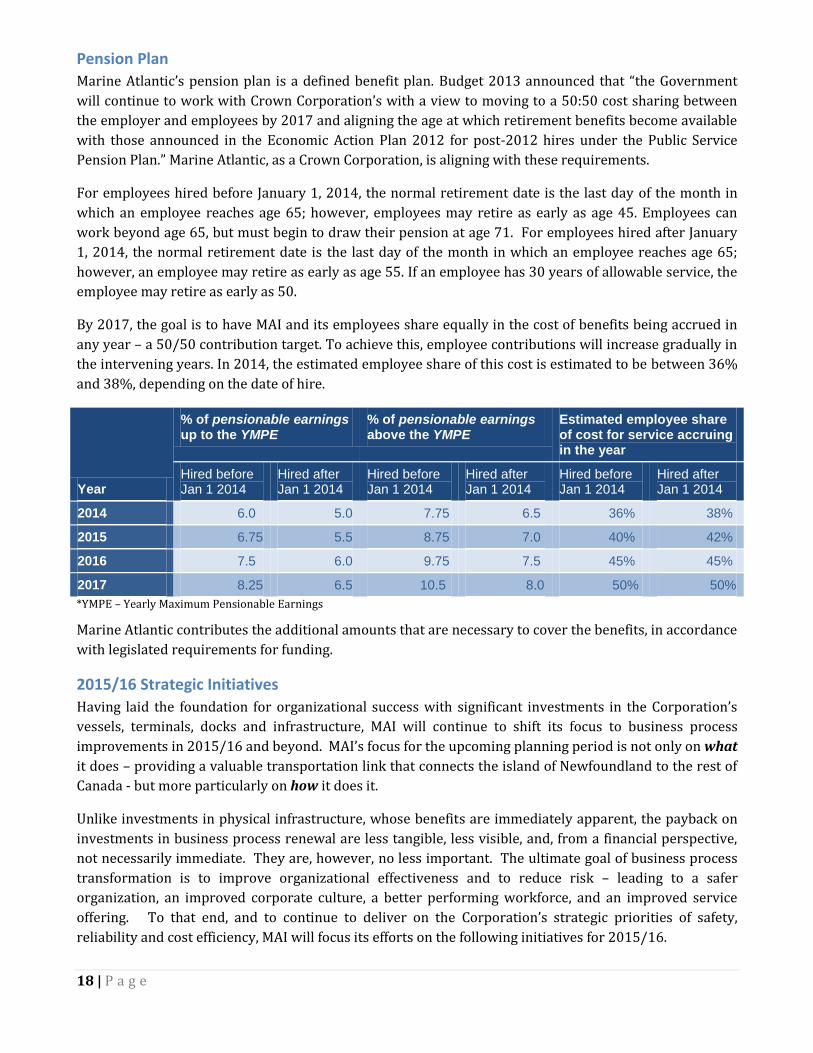
By 2017, the goal is to have MAI and its employees share equally in the cost of benefits being accrued in
any year – a 50/50 contribution target. To achieve this, employee contributions will increase gradually in
the intervening years. In 2014, the estimated employee share of this cost is estimated to be between 36%
and 38%, depending on the date of hire.
Year
% of pensionable earnings up to the YMPE
% of pensionable earnings above the YMPE
Estimated employee share of cost for service accruing in the year
Hired before Jan 1 2014
Hired after Jan 1 2014
Hired before Jan 1 2014
Hired after Jan 1 2014
Hired before Jan 1 2014
Hired after Jan 1 2014
2014 6.0 5.0 7.75 6.5 36% 38%
2015 6.75 5.5 8.75 7.0 40% 42%
2016 7.5 6.0 9.75 7.5 45% 45%
2017 8.25 6.5 10.5 8.0 50% 50%
*YMPE – Yearly Maximum Pensionable Earnings
Marine Atlantic contributes the additional amounts that are necessary to cover the benefits, in accordance
with legislated requirements for funding.
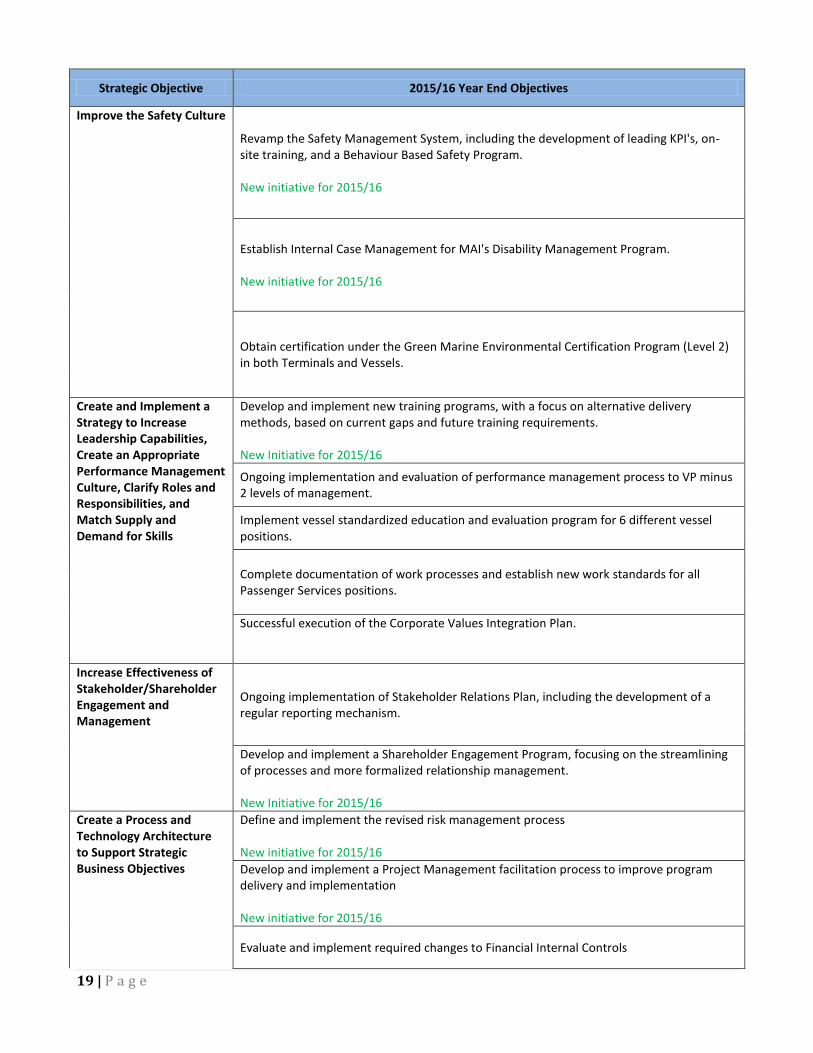
2015/16 Strategic Initiatives
Having laid the foundation for organizational success with significant investments in the Corporation’s
vessels, terminals, docks and infrastructure, MAI will continue to shift its focus to business process
improvements in 2015/16 and beyond. MAI’s focus for the upcoming planning period is not only on what
it does – providing a valuable transportation link that connects the island of Newfoundland to the rest of
Canada - but more particularly on how it does it.
Unlike investments in physical infrastructure, whose benefits are immediately apparent, the payback on
investments in business process renewal are less tangible, less visible, and, from a financial perspective,
not necessarily immediate. They are, however, no less important. The ultimate goal of business process
transformation is to improve organizational effectiveness and to reduce risk – leading to a safer
organization, an improved corporate culture, a better performing workforce, and an improved service
offering. To that end, and to continue to deliver on the Corporation’s strategic priorities of safety,
reliability and cost efficiency, MAI will focus its efforts on the following initiatives for 2015/16.
19 | P a g e
Strategic Objective 2015/16 Year End Objectives
Improve the Safety Culture
Revamp the Safety Management System, including the development of leading KPI's, on-site training, and a Behaviour Based Safety Program. New initiative for 2015/16
Establish Internal Case Management for MAI's Disability Management Program. New initiative for 2015/16
Obtain certification under the Green Marine Environmental Certification Program (Level 2) in both Terminals and Vessels.
Create and Implement a Strategy to Increase Leadership Capabilities, Create an Appropriate Performance Management Culture, Clarify Roles and Responsibilities, and Match Supply and Demand for Skills
Develop and implement new training programs, with a focus on alternative delivery methods, based on current gaps and future training requirements. New Initiative for 2015/16
Ongoing implementation and evaluation of performance management process to VP minus 2 levels of management.
Implement vessel standardized education and evaluation program for 6 different vessel positions.
Complete documentation of work processes and establish new work standards for all Passenger Services positions.
Successful execution of the Corporate Values Integration Plan.
Increase Effectiveness of Stakeholder/Shareholder Engagement and Management
Ongoing implementation of Stakeholder Relations Plan, including the development of a regular reporting mechanism.
Develop and implement a Shareholder Engagement Program, focusing on the streamlining of processes and more formalized relationship management. New Initiative for 2015/16
Create a Process and Technology Architecture to Support Strategic Business Objectives
Define and implement the revised risk management process New initiative for 2015/16
Develop and implement a Project Management facilitation process to improve program delivery and implementation New initiative for 2015/16
Evaluate and implement required changes to Financial Internal Controls
20 | P a g e
Strategic Objective 2015/16 Year End Objectives
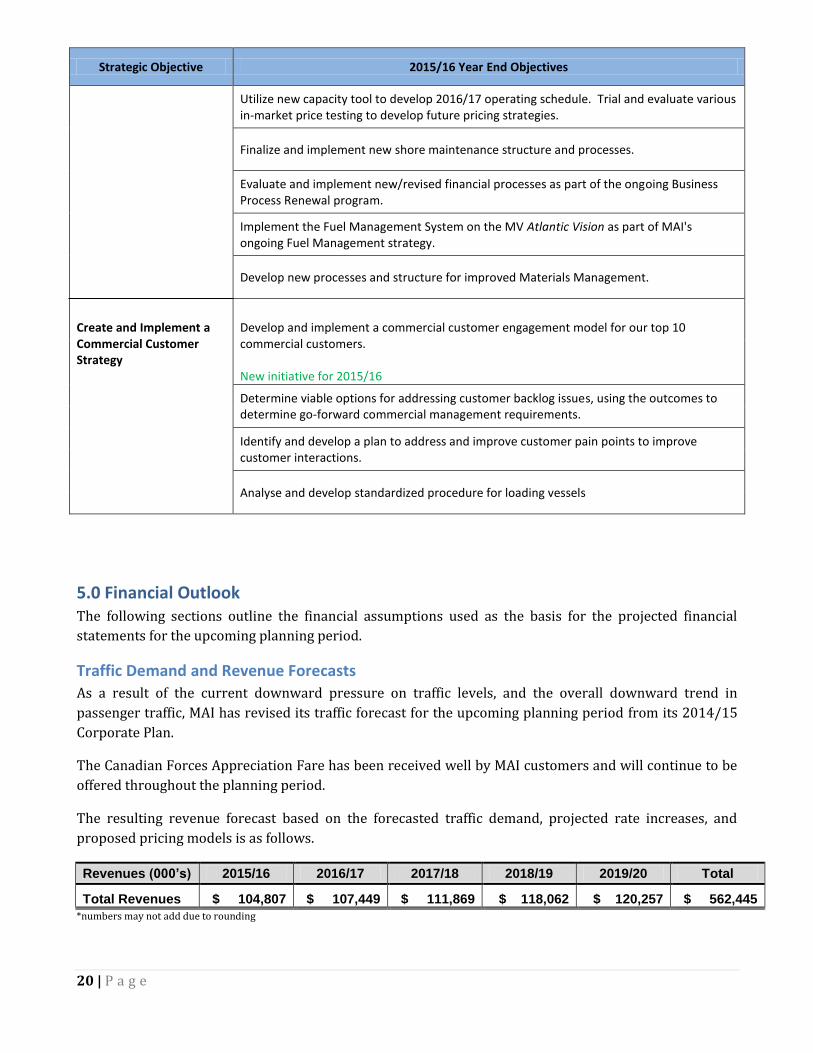
Utilize new capacity tool to develop 2016/17 operating schedule. Trial and evaluate various in-market price testing to develop future pricing strategies.
Finalize and implement new shore maintenance structure and processes.
Evaluate and implement new/revised financial processes as part of the ongoing Business Process Renewal program.
Implement the Fuel Management System on the MV Atlantic Vision as part of MAI's ongoing Fuel Management strategy.
Develop new processes and structure for improved Materials Management.
Create and Implement a Commercial Customer Strategy
Develop and implement a commercial customer engagement model for our top 10 commercial customers. New initiative for 2015/16
Determine viable options for addressing customer backlog issues, using the outcomes to determine go-forward commercial management requirements.
Identify and develop a plan to address and improve customer pain points to improve customer interactions.
Analyse and develop standardized procedure for loading vessels
5.0 Financial Outlook The following sections outline the financial assumptions used as the basis for the projected financial
statements for the upcoming planning period.
Traffic Demand and Revenue Forecasts
As a result of the current downward pressure on traffic levels, and the overall downward trend in
passenger traffic, MAI has revised its traffic forecast for the upcoming planning period from its 2014/15
Corporate Plan.
The Canadian Forces Appreciation Fare has been received well by MAI customers and will continue to be
offered throughout the planning period.
The resulting revenue forecast based on the forecasted traffic demand, projected rate increases, and
proposed pricing models is as follows.
Revenues (000’s) 2015/16 2016/17 2017/18 2018/19 2019/20 Total
Total Revenues $ 104,807 $ 107,449 $ 111,869 $ 118,062 $ 120,257 $ 562,445
*numbers may not add due to rounding
21 | P a g e
Operating Expenses
Expense projections for the upcoming five year planning period take into consideration the operation of
the current fleet, comprised of the MV Blue Puttees, the MV Highlanders, the MV Leif Ericson, and the MV
Atlantic Vision up until its replacement in 2017.
Fuel Expense Fuel is, and will continue to be, a large portion of the Corporation’s operating budget, accounting for
upwards of 15 per cent of total operating expenses. The Corporation faces large uncertainties
surrounding future fuel prices, and fuel supply, as its regular supplier of fuel is no longer in business.
The Corporation intends to maintain its fuel hedging program, which is focused on minimizing the
impacts of price fluctuations, thereby stabilizing the company’s fuel budget.
To align with new regulatory requirements for Vessel Air Emissions, MAI has been working with
Transport Canada to develop its fleet averaging plan to meet the requirements for 0.10% sulfur content
standard. MAI’s plan has been approved by Transport Canada’s Marine Technical Review Board and
allows MAI until December 2019 to gradually reduce sulfur dioxide emissions.
As a result of this plan, however, MAI will be required to switch to more expensive Marine Gas Oil (MGO)
sooner than originally anticipated, limiting the impacts of lower oil prices on MAI’s bottom line. As such,
any reductions in fuel consumption will be offset by the increase in price/liter (MAI currently blends a
mixture of Bunker and MGO to produce Intermediate Fuel Oils to power its vessels).
Foreign Exchange Rate The Corporation utilizes a foreign exchange hedging strategy to proactively mitigate exposure to foreign
currency. The Corporation negotiated to pay in Canadian currency for the charter of two of their vessels
in the initial five year charter period (ending December 2015 and February 2016). The Corporation also
secured forward contracts with a financial institution for the Euro currency requirements over the
remaining charter period of the vessels. Marine Atlantic hedges its exposure to this foreign currency
obligation by utilizing forward contracts to ascertain the Canadian dollar equivalent to these monthly
charter payments. Marine Atlantic’s hedging strategy has been successful in bringing stability and cost
certainty to the charter obligations for the duration of the charter agreements.
Labour Costs The Corporation’s collective bargaining agreement with the United Steel Workers/International
Longshoreman Council of Trade Unions (Agreement D) was renewed by ratification during the third
quarter of 2014/15. The new agreement is for three years from January 1, 2014 to December 31, 2016.
The agreement includes annual increases of 1.75% on January 1 of each year of the agreement and a one-
time payment upon ratification ranging from $150 to $500 per employee, based upon the hours worked
in the previous year.
All of the other contracts within the Corporation’s workforce are currently expired, and negotiations with
each union are ongoing (with four of the five remaining agreements going to interest arbitration over the
coming months). The Corporation’s historical collective bargaining rate increases are as follows:
22 | P a g e
Year
Agreement
Canadian Merchant Services Guild (A)
Unifor – Unlicensed Vessel Crew (B)
Unifor – Shore-Based Maintenance Employees (C)
United Steel Workers/Intl. Longshoremen Council of Trade Unions (D)
Canadian Merchant Service Guild (E)
Public Service Alliance of Canada (F)
2009 2.8% 2.8% 2.8% 2.5% 2.8% 2.8%
2010 2.8% 2.8% 2.8% 2.5% 2.8% 2.8%
2011 2.5% 2.5% 2.5% 2.5% 2% 2.5%
2012 2.5% 2.5% 2.5% 2.5% 2% 2.5%
2013 2.5% 2.5% 2.5% 2.5% expired 2.5%
Inflation Rates Canada's inflation policy, as set out by the Federal Government and the Bank of Canada, aims to keep
inflation at two per cent, the midpoint of the one to three per cent inflation-control target range. For the
purposes of this Corporate Plan, MAI has used a more conservative estimate and is assuming a three per
cent general inflation rate annually over the planning period.
Pension Costs Solvency payment obligations of the Pension Plan are vulnerable to actual performance of the plan, the
rules set by the Federal pension regulator and the guidelines established by the actuarial regulatory body.
Deviations in this expense could be significant.
Capital Requirements
The recent funding decision by the Government of Canada has provided MAI with sufficient capital funds
to purchase the MV Blue Puttees and the MV Highlanders in 2015/16, along with additional capital to
begin the process of finding a replacement vessel for the MV Atlantic Vision in 2017/18.
For 2015/16 and 2016/17, shore-based major capital includes monies for MAI’s fendering replacement,
electronic vehicle measurement, paving upgrades at the marshalling yards, and removal of the old
terminal building in NSY. In addition to the planned dry-dockings, vessel-based capital projects include
refurbishing of the elevators on the MV Blue Puttees and MV Highlanders, general repair and maintenance
on the MV Leif Ericson, as well as the continuous machinery surveys for the MV Atlantic Vision. Base
capital funding includes a host of smaller IT projects all designed to drive our business process
transformation initiatives.
Beyond 2016/17, there are a number of larger projects identified that impact the level of funding
requested. From a vessel-based perspective, in addition to dry dockings, there are monies identified for
Bridge upgrades, and increasing costs associated with maintaining the MV Leif Ericson as the vessel
ages. From a shore-based perspective, big ticket items include upgrades to the mooring systems, dock re-
facing and fender upgrades and replacement. There are also funds identified to enable MAI to comply
with environmental regulations for sewage treatment.
The capital plans for the outer years of the planning period are still at a very high level, and will be refined
as requirements dictate and updated in future corporate plans.
23 | P a g e
Cost Recovery
As part of the recent funding commitment made to MAI for 2015/16 – 2017/18, the Shareholder has
provided new direction with respect to cost recovery. Specifically, the Shareholder has established a cost
recovery target of 65% for MAI’s overall service.
6.0 Key Performance Indicators In addition to achieving revenue and cost recovery targets, MAI has identified the following Corporate-
level KPIs.
KPI 2014/15 Target
2014/15 YTD
1
Cost Recovery 67.8% 70.1* (year-end
forecast)
On-time performance (excl.
weather) 86-90% 93%
Unplanned service
interruptions 3% or lower 2.1%
Capacity Utilization 68% 76%
Note 1 – Year to date: April 1, 2014 – October 31, 2014
TBD – To be determined (KPI formula not yet finalized)
7.0 Specific Approvals Sought MAI seeks Governor in-Council approval of MAI’s 2014 – 2019 Corporate Plan, Treasury Board approval
of the operating and capital plans contained herein (See Section 8 – Financial Statements), and approval
for the continuation of a line of credit as described below.
Bank Line of Credit
Marine Atlantic's bank line of credit is currently approved at $35,622,000. The Corporation utilizes
$31,422,000 to secure letters of credit related to the Corporation’s defined benefit pension plan. This is in
accordance with Section 9.11 of the Pension Benefits Standards Act, 1985 (the “Act”) and is utilized to
replace solvency special payments. These letters of credit must be maintained and can only be reduced if
equivalent additional contributions are made to the Plan. These letters of credit could also be reduced
without additional contributions if a future actuarial valuation shows a solvency ratio and an average
solvency ratio that meet certain criteria defined in the Act.
The remaining $4,200,000 is utilized as security against long-term liabilities arising from Marine Atlantic
employees’ past injury claims and this Corporation’s status as a “deposit account company” with the New
Brunswick Workers’ Compensation Board.
The Corporation is currently seeking approval for a line of credit sufficient to handle the $35,622,000
requirements for the pension plan and the Workers’ Compensation Board requirement. In addition, upon
completion of the 2014 pension plan fiscal year actuarial valuation in June of 2015, if the solvency
position of the pension plan improves as expected, the line of credit requirement may be reduced.
24 | P a g e
8.0 Financial Statements Statements A through E present financial projections over the planning period, based on the operational
plans, forecasts and assumptions discussed in previous sections of this Corporate Plan and are presented
based on Public Sector Accounting Standards.
25 | P a g e
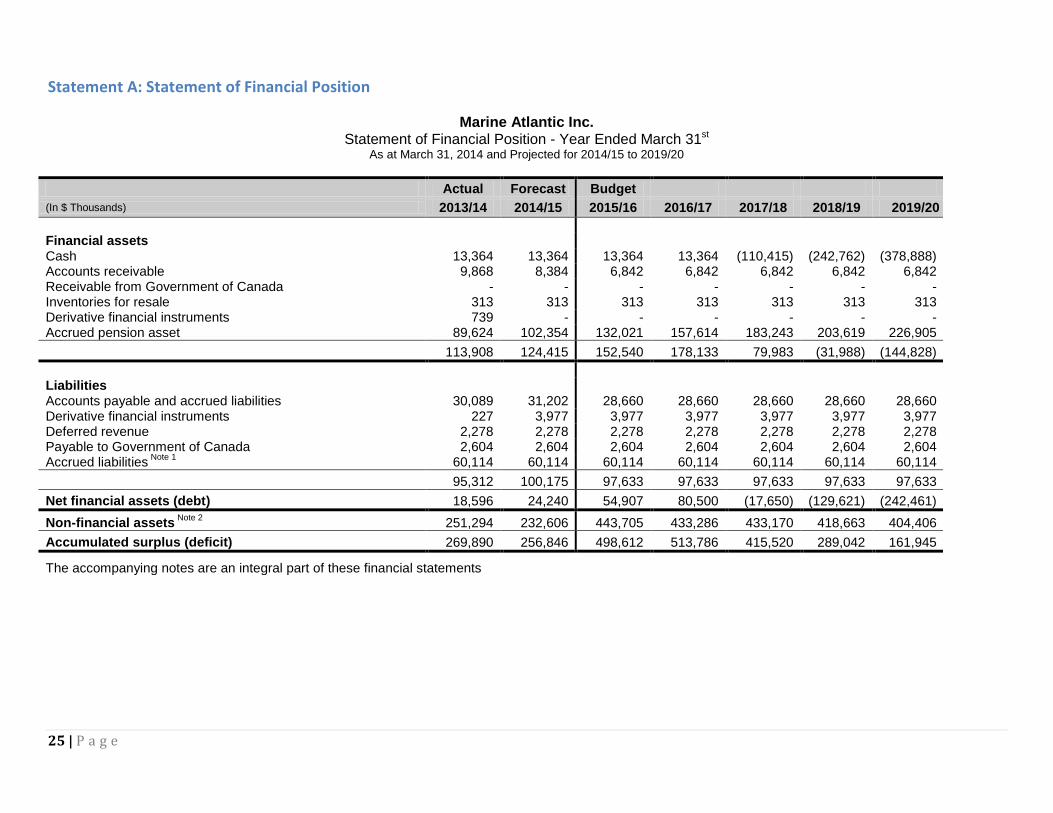
Statement A: Statement of Financial Position
Marine Atlantic Inc. Statement of Financial Position - Year Ended March 31st
As at March 31, 2014 and Projected for 2014/15 to 2019/20
Actual Forecast Budget
(In $ Thousands) 2013/14 2014/15 2015/16 2016/17 2017/18 2018/19 2019/20
Financial assets Cash
13,364 13,364 13,364 13,364 (110,415) (242,762) (378,888)
Accounts receivable 9,868 8,384 6,842 6,842 6,842 6,842 6,842 Receivable from Government of Canada - - - - - - - Inventories for resale 313 313 313 313 313 313 313 Derivative financial instruments 739 - - - - - - Accrued pension asset 89,624 102,354 132,021 157,614 183,243 203,619 226,905
113,908 124,415 152,540 178,133 79,983 (31,988) (144,828)
Liabilities Accounts payable and accrued liabilities 30,089 31,202 28,660 28,660 28,660 28,660 28,660 Derivative financial instruments 227 3,977 3,977 3,977 3,977 3,977 3,977 Deferred revenue 2,278 2,278 2,278 2,278 2,278 2,278 2,278 Payable to Government of Canada 2,604 2,604 2,604 2,604 2,604 2,604 2,604 Accrued liabilities
Note 1 60,114 60,114 60,114 60,114 60,114 60,114 60,114
95,312 100,175 97,633 97,633 97,633 97,633 97,633
Net financial assets (debt) 18,596 24,240 54,907 80,500 (17,650) (129,621) (242,461)
Non-financial assets Note 2
251,294 232,606 443,705 433,286 433,170 418,663 404,406
Accumulated surplus (deficit) 269,890 256,846 498,612 513,786 415,520 289,042 161,945
The accompanying notes are an integral part of these financial statements
26 | P a g e
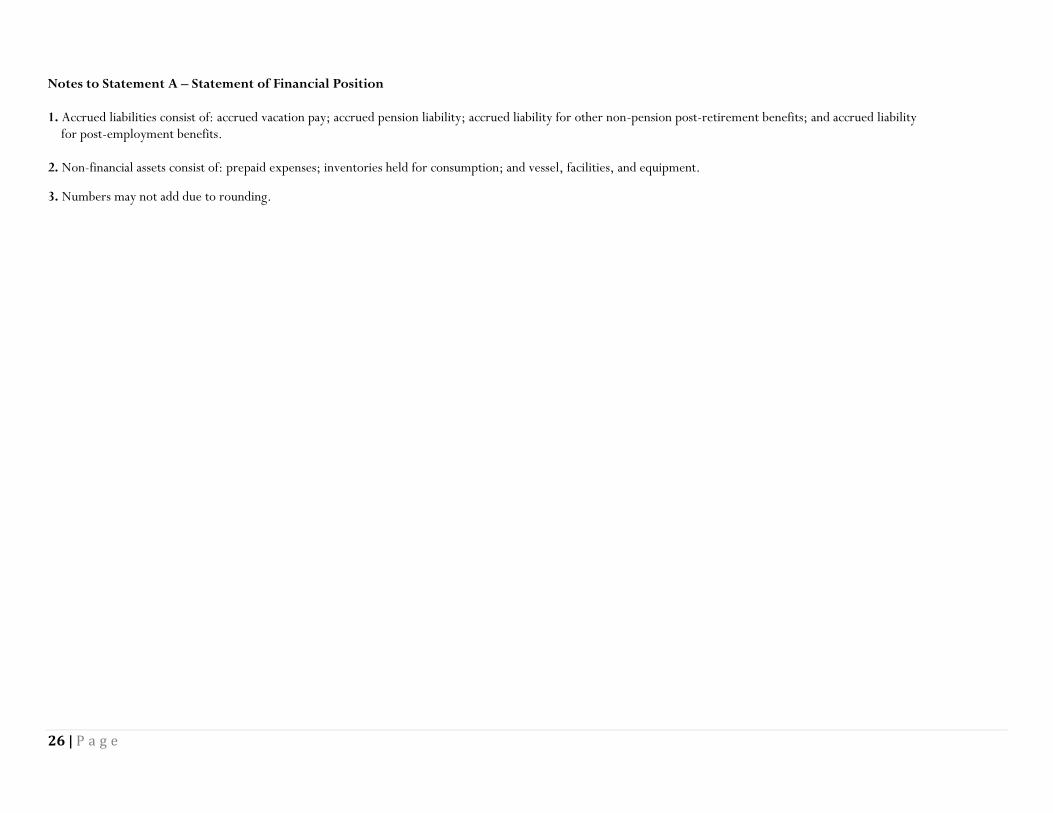
Notes to Statement A – Statement of Financial Position 1. Accrued liabilities consist of: accrued vacation pay; accrued pension liability; accrued liability for other non-pension post-retirement benefits; and accrued liability for post-employment benefits. 2. Non-financial assets consist of: prepaid expenses; inventories held for consumption; and vessel, facilities, and equipment.
3. Numbers may not add due to rounding.
27 | P a g e
Statement B: Statement of Operations and Accumulated Surplus
Marine Atlantic Inc. Statement Operations and Accumulated Surplus
For the Year Ended March 31, 2014 and Projected for 2014/15 to 2019/20
Actual Budget Forecast Budget
(In $ Thousands) 2013/14 2014/15 2014/15 2015/16 2016/17 2017/18 2018/19 2019/20
Total Revenues 104,886 101,277 104,125 104,807 107,449 111,869 118,062 120,257
Expenditures
Wages and benefits 80,396 81,235 79,971 85,201 89,066 90,879 93,199 95,212
Fuel 29,288 29,227 29,303 28,399 30,213 36,534 37,415 39,877
Charter fees 44,600 43,675 43,187 34,856 13,829 19,116 22,098 22,098
Charter importation taxes 5,034 2,861 2,861 2,386 - 3,140 3,140 3,140
Repairs and maintenance 8,479 9,380 9,183 10,634 11,745 10,835 12,742 11,976
Materials, supplies and services 17,195 16,763 16,788 19,375 22,908 33,084 22,483 21,302
Insurance, rent and utilities 7,295 7,669 7,788 7,596 7,678 7,963 8,263 8,588
Other 5,846 4,785 5,367 8,584 8,613 8,867 9,160 9,434
Employee future benefits Note 1
18,374 10,820 10,706 10,337 8,110 6,721 6,934 7,105
Foreign currency exchange (gain) loss 45 - - - - - - -
Realized (gain) loss on derivative financial instruments (33) - (289) - - - - -
(Gain) Loss on disposal of tangible capital assets 112 - - - - - - -
Amortization 34,930 35,000 35,300 30,000 40,231 53,907 48,490 48,007
Total Expenditures 251,561 241,415 240,165 237,368 232,393 271,045 263,924 266,737
(Deficit) before government funding (146,675) (140,138) (136,039) (132,561) (124,944) (159,176) (145,862) (146,481)
28 | P a g e
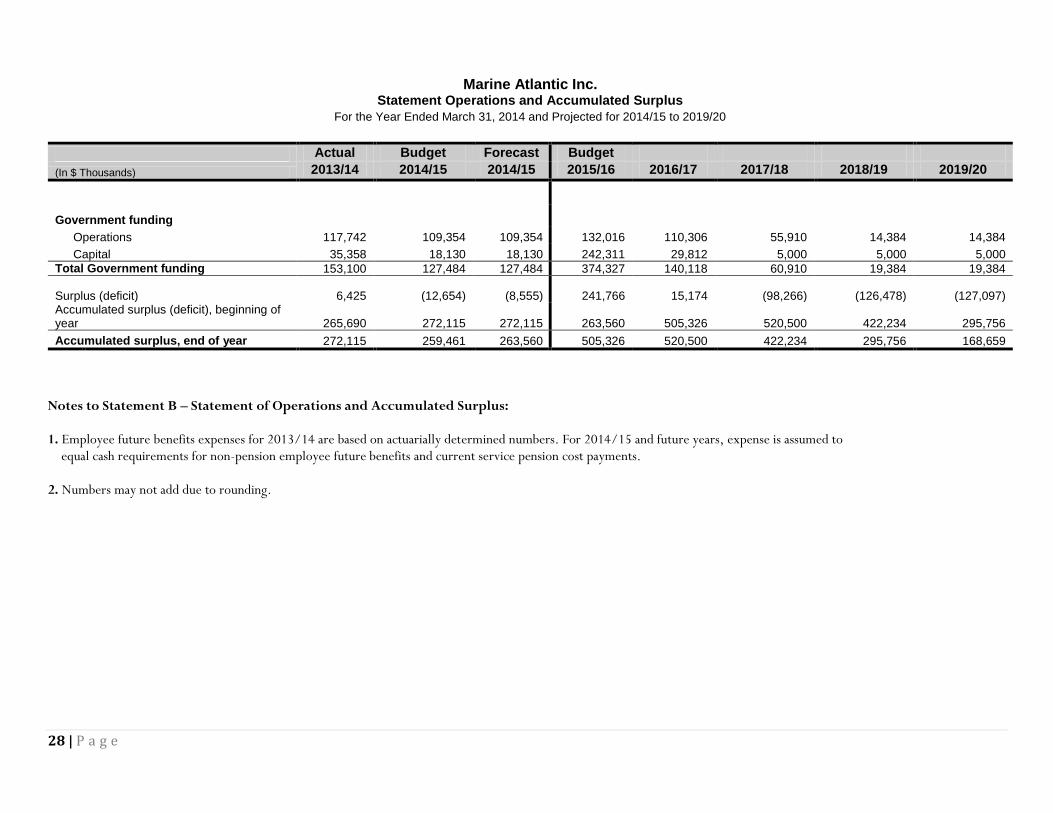
Marine Atlantic Inc. Statement Operations and Accumulated Surplus
For the Year Ended March 31, 2014 and Projected for 2014/15 to 2019/20
Actual Budget Forecast Budget
(In $ Thousands) 2013/14 2014/15 2014/15 2015/16 2016/17 2017/18 2018/19 2019/20
Government funding
Operations 117,742 109,354 109,354 132,016 110,306 55,910 14,384 14,384
Capital 35,358 18,130 18,130 242,311 29,812 5,000 5,000 5,000
Total Government funding 153,100 127,484 127,484 374,327 140,118 60,910 19,384 19,384
Surplus (deficit) 6,425 (12,654) (8,555) 241,766 15,174 (98,266) (126,478) (127,097) Accumulated surplus (deficit), beginning of year 265,690 272,115 272,115 263,560 505,326 520,500 422,234 295,756
Accumulated surplus, end of year 272,115 259,461 263,560 505,326 520,500 422,234 295,756 168,659
Notes to Statement B – Statement of Operations and Accumulated Surplus: 1. Employee future benefits expenses for 2013/14 are based on actuarially determined numbers. For 2014/15 and future years, expense is assumed to equal cash requirements for non-pension employee future benefits and current service pension cost payments. 2. Numbers may not add due to rounding.
29 | P a g e
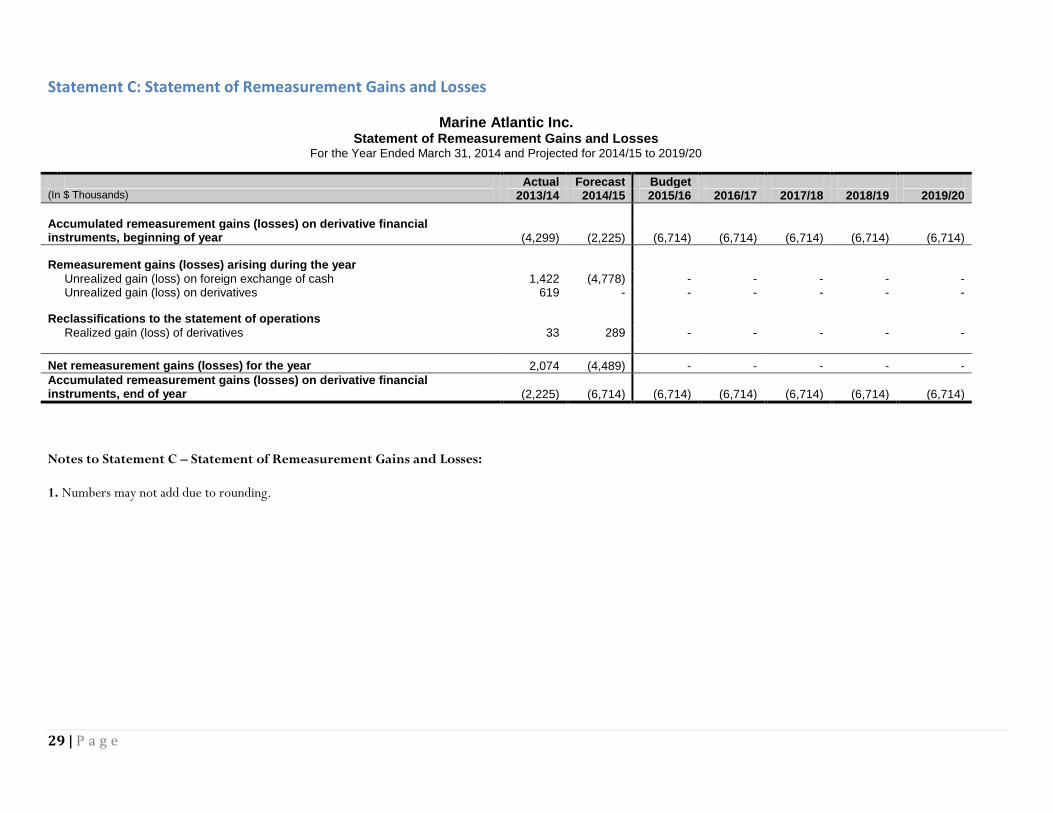
Statement C: Statement of Remeasurement Gains and Losses
Marine Atlantic Inc. Statement of Remeasurement Gains and Losses
For the Year Ended March 31, 2014 and Projected for 2014/15 to 2019/20
Actual Forecast Budget (In $ Thousands) 2013/14 2014/15 2015/16 2016/17 2017/18 2018/19 2019/20
Accumulated remeasurement gains (losses) on derivative financial instruments, beginning of year (4,299) (2,225) (6,714) (6,714) (6,714) (6,714) (6,714)
Remeasurement gains (losses) arising during the year Unrealized gain (loss) on foreign exchange of cash 1,422 (4,778) - - - - - Unrealized gain (loss) on derivatives 619 - - - - - -
Reclassifications to the statement of operations Realized gain (loss) of derivatives 33 289 - - - - -
Net remeasurement gains (losses) for the year 2,074 (4,489) - - - - -
Accumulated remeasurement gains (losses) on derivative financial instruments, end of year (2,225) (6,714) (6,714) (6,714) (6,714) (6,714) (6,714)
Notes to Statement C – Statement of Remeasurement Gains and Losses: 1. Numbers may not add due to rounding.
30 | P a g e
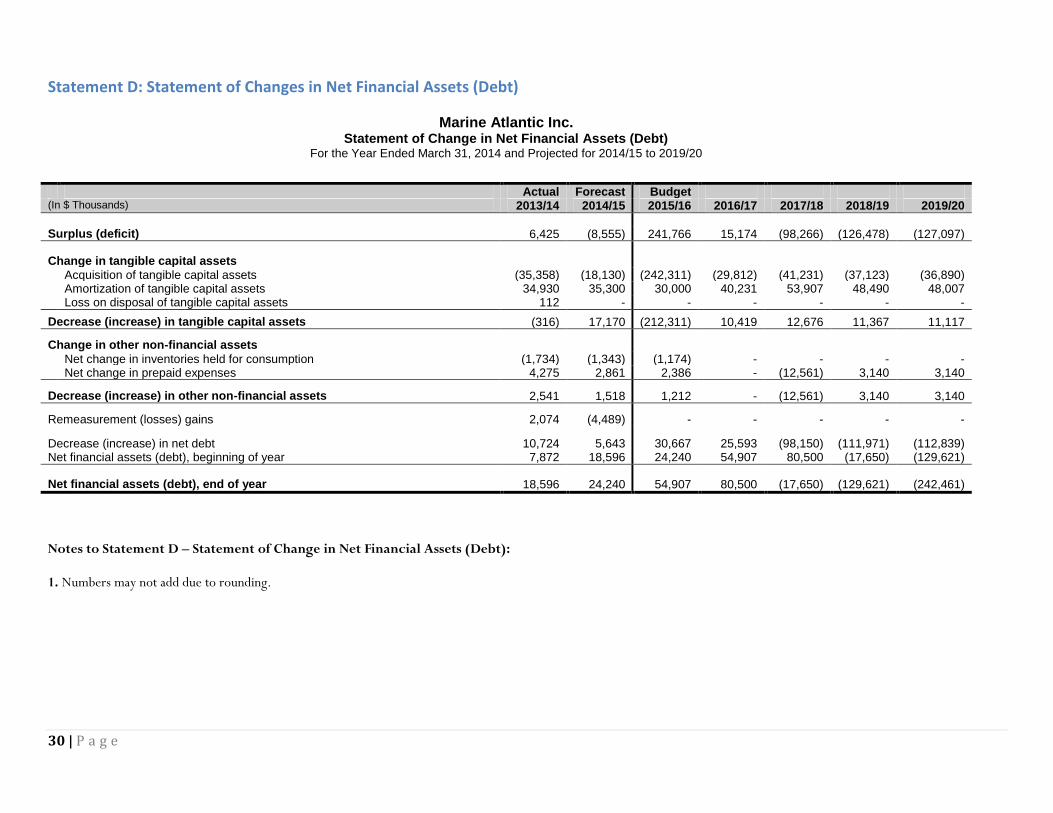
Statement D: Statement of Changes in Net Financial Assets (Debt)
Marine Atlantic Inc. Statement of Change in Net Financial Assets (Debt)
For the Year Ended March 31, 2014 and Projected for 2014/15 to 2019/20
Actual Forecast Budget (In $ Thousands) 2013/14 2014/15 2015/16 2016/17 2017/18 2018/19 2019/20
Surplus (deficit) 6,425 (8,555) 241,766 15,174 (98,266) (126,478) (127,097)
Change in tangible capital assets Acquisition of tangible capital assets (35,358) (18,130) (242,311) (29,812) (41,231) (37,123) (36,890) Amortization of tangible capital assets 34,930 35,300 30,000 40,231 53,907 48,490 48,007 Loss on disposal of tangible capital assets 112 - - - - - -
Decrease (increase) in tangible capital assets (316) 17,170 (212,311) 10,419 12,676 11,367 11,117
Change in other non-financial assets Net change in inventories held for consumption (1,734) (1,343) (1,174) - - - - Net change in prepaid expenses 4,275 2,861 2,386 - (12,561) 3,140 3,140
Decrease (increase) in other non-financial assets 2,541 1,518 1,212 - (12,561) 3,140 3,140
Remeasurement (losses) gains 2,074 (4,489) - - - - -
Decrease (increase) in net debt 10,724 5,643 30,667 25,593 (98,150) (111,971) (112,839) Net financial assets (debt), beginning of year 7,872 18,596 24,240 54,907 80,500 (17,650) (129,621)
Net financial assets (debt), end of year 18,596 24,240 54,907 80,500 (17,650) (129,621) (242,461)
Notes to Statement D – Statement of Change in Net Financial Assets (Debt): 1. Numbers may not add due to rounding.
31 | P a g e
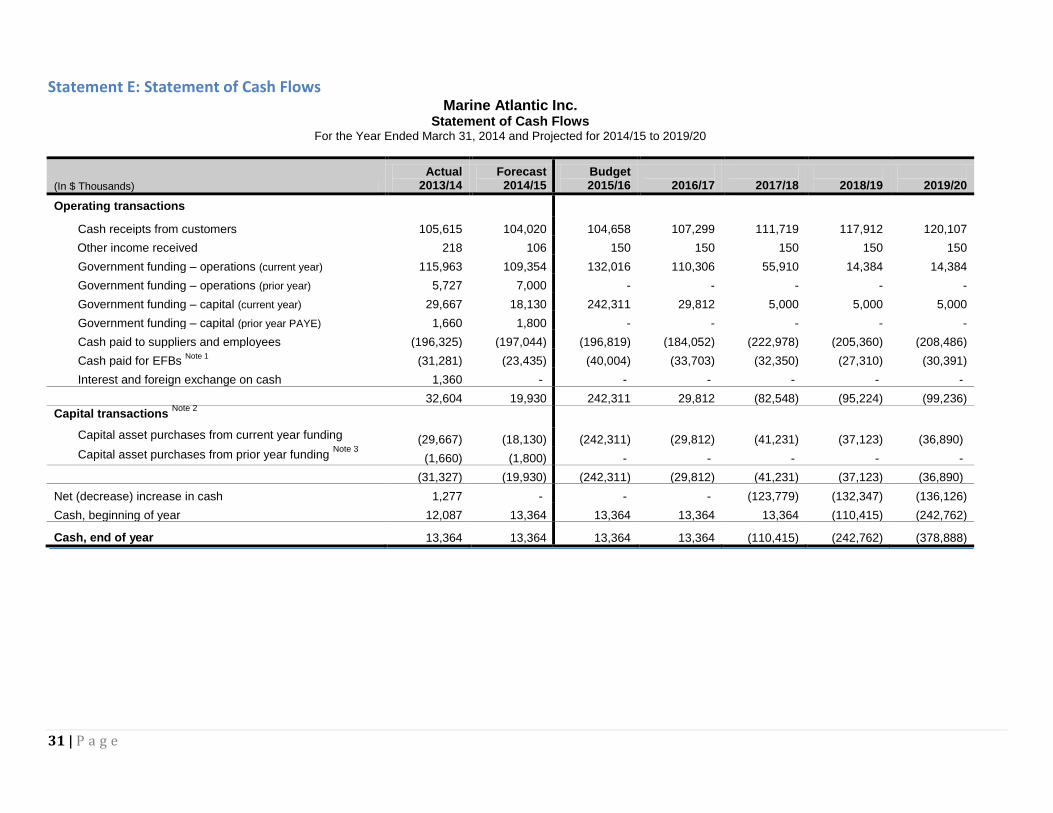
Statement E: Statement of Cash Flows Marine Atlantic Inc.
Statement of Cash Flows For the Year Ended March 31, 2014 and Projected for 2014/15 to 2019/20
(In $ Thousands)
Actual 2013/14
Forecast 2014/15
Budget 2015/16
2016/17
2017/18
2018/19
2019/20
Operating transactions
Cash receipts from customers 105,615 104,020 104,658 107,299 111,719 117,912 120,107
Other income received 218 106 150 150 150 150 150
Government funding – operations (current year) 115,963 109,354 132,016 110,306 55,910 14,384 14,384
Government funding – operations (prior year) 5,727 7,000 - - - - -
Government funding – capital (current year) 29,667 18,130 242,311 29,812 5,000 5,000 5,000
Government funding – capital (prior year PAYE) 1,660 1,800 - - - - -
Cash paid to suppliers and employees (196,325) (197,044) (196,819) (184,052) (222,978) (205,360) (208,486)
Cash paid for EFBs Note 1
(31,281) (23,435) (40,004) (33,703) (32,350) (27,310) (30,391)
Interest and foreign exchange on cash 1,360 - - - - - -
32,604 19,930 242,311 29,812 (82,548) (95,224) (99,236)
Capital transactions Note 2
Capital asset purchases from current year funding (29,667) (18,130) (242,311) (29,812) (41,231) (37,123) (36,890)
Capital asset purchases from prior year funding Note 3
(1,660) (1,800) - - - - -
(31,327) (19,930) (242,311) (29,812) (41,231) (37,123) (36,890)
Net (decrease) increase in cash 1,277 - - - (123,779) (132,347) (136,126)
Cash, beginning of year 12,087 13,364 13,364 13,364 13,364 (110,415) (242,762)
Cash, end of year 13,364 13,364 13,364 13,364 (110,415) (242,762) (378,888)

32 | P a g e
Notes to Statement E– Statement of Cash Flows:
1. Cash paid for EFBs (Employee Future Benefits) includes cash paid for pension, worker’s compensation and other non-pension employee future benefits.
2. Capital assets are also referred to as tangible capital assets elsewhere throughout these statements. It was shortened to capital assets on this statement simply for presentation purposes.
3. Capital asset purchases from prior year funding represents cash outlays for capital goods and services received in the prior fiscal year and paid in the current fiscal year. A
payable at year end (PAYE) was established to fund these purchases out of prior year funding.
4. Numbers may not add due to rounding.
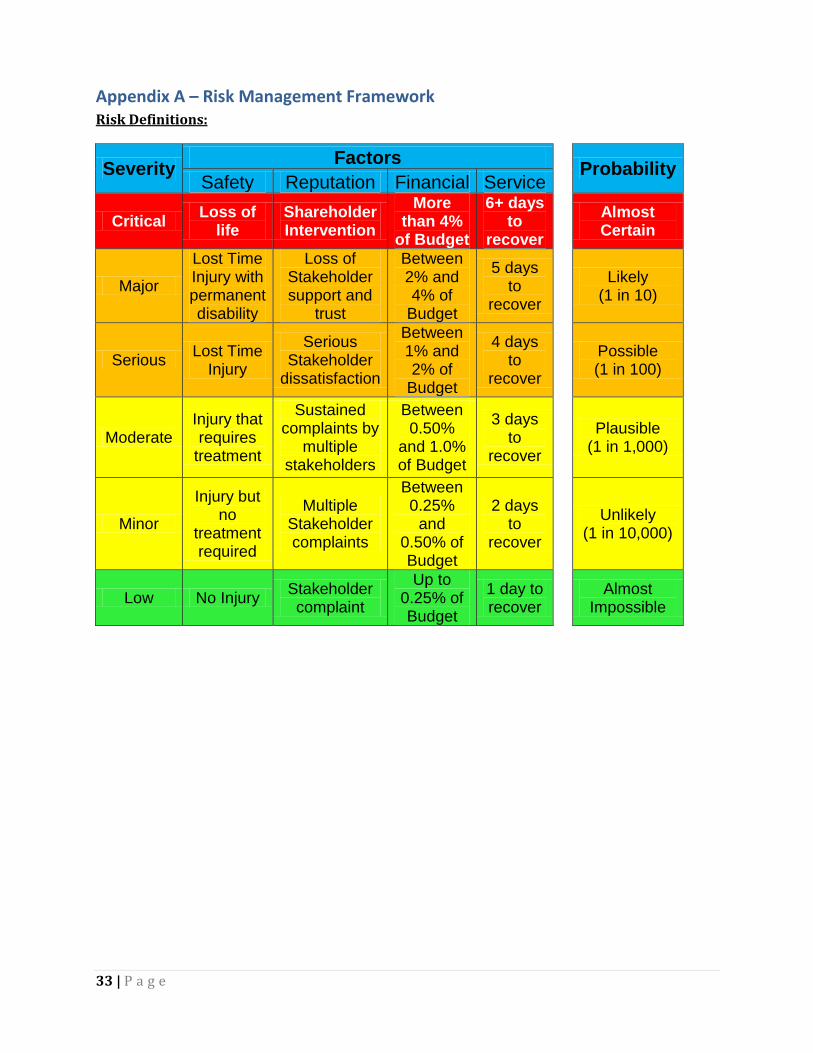
33 | P a g e
Appendix A – Risk Management Framework Risk Definitions:
Severity Factors
Probability Safety Reputation Financial Service
Critical
Loss of life
Shareholder Intervention
More than 4%
of Budget
6+ days to
recover
Almost Certain
Major
Lost Time Injury with permanent disability
Loss of Stakeholder support and
trust
Between 2% and 4% of
Budget
5 days to
recover
Likely (1 in 10)
Serious Lost Time
Injury
Serious Stakeholder
dissatisfaction
Between 1% and 2% of
Budget
4 days to
recover
Possible (1 in 100)
Moderate Injury that requires
treatment
Sustained complaints by
multiple stakeholders
Between 0.50%
and 1.0% of Budget
3 days to
recover
Plausible (1 in 1,000)
Minor
Injury but no
treatment required
Multiple Stakeholder complaints
Between 0.25%
and 0.50% of Budget
2 days to
recover
Unlikely (1 in 10,000)
Low No Injury Stakeholder complaint
Up to 0.25% of Budget
1 day to recover
Almost Impossible
Recommended