Corporate PresentationNovember 2019
Company Profile
Company NamePT. Semen Indonesia (Persero) Tbk
Factory LocationsIndonesia and Vietnam.
Nature of Business
Cement Industry
Milestones
1. PT Semen Indonesia (Persero) Tbk, previously known as PT Semen Gresik (Persero) Tbk., established on 7 Agustus 1957.
2. Publicly listed in IDX since 1991.
3. Consolidated with PT Semen Padang (Persero) and PT Semen Tonasa (Persero) on 1995.
4. Acquired Thang Long Cement Company (TLCC) Vietnam on 2012.
5. Acquired PT Holcim Indonesia on 2019.
Shareholders
51,01% Government of Indonesia48,99% Public
53 Million tones p.a of designed cement production capacity
#1 the largest cement producer in ASEAN
54% Market Share di Indonesia (Up to October 2019)
9 Integrated cement plants in 7 locations in Indonesia and 1 in
Vietnam
Facts
Market LocationsAsia, Australia, and Pacific
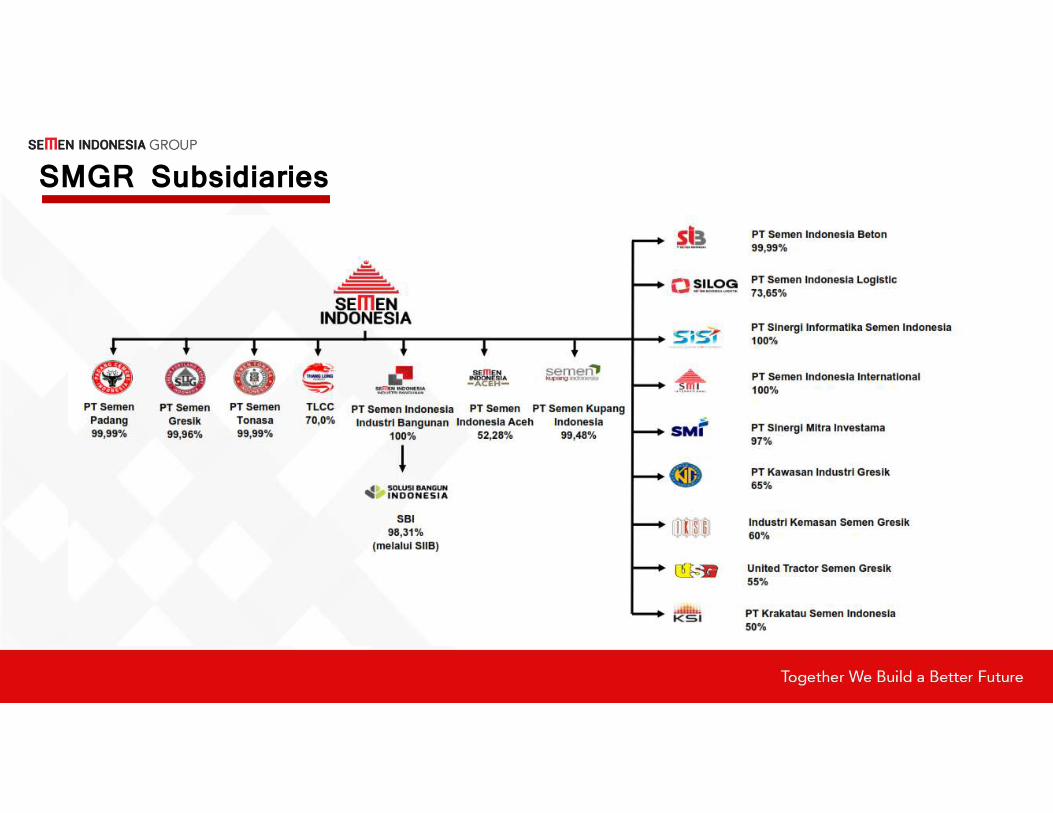
SMGR Subsidiaries
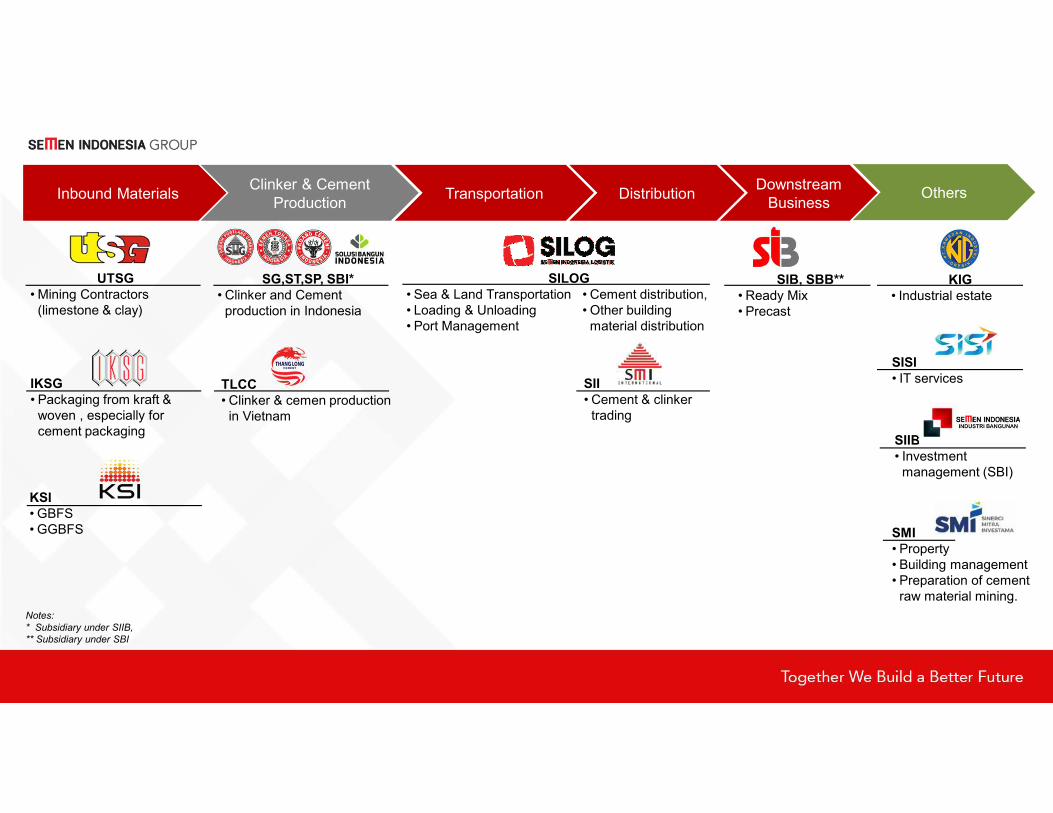
Inbound MaterialsClinker & Cement
ProductionTransportation Distribution
Downstream
BusinessOthers
UTSG
• Mining Contractors
(limestone & clay)
IKSG
• Packaging from kraft &
woven , especially for
cement packaging
KSI
• GBFS
• GGBFS
SG,ST,SP, SBI*
• Clinker and Cement
production in Indonesia
SILOG
• Sea & Land Transportation
• Loading & Unloading
• Port Management
• Cement distribution,
• Other building
material distribution
SII
• Cement & clinker
trading
SIB, SBB**
• Ready Mix
• Precast
SMI
• Property
• Building management
• Preparation of cement
raw material mining.
SIIB
• Investment
management (SBI)
KIG
• Industrial estate
SISI
• IT servicesTLCC
• Clinker & cemen production
in Vietnam
Notes:
* Subsidiary under SIIB,
** Subsidiary under SBI
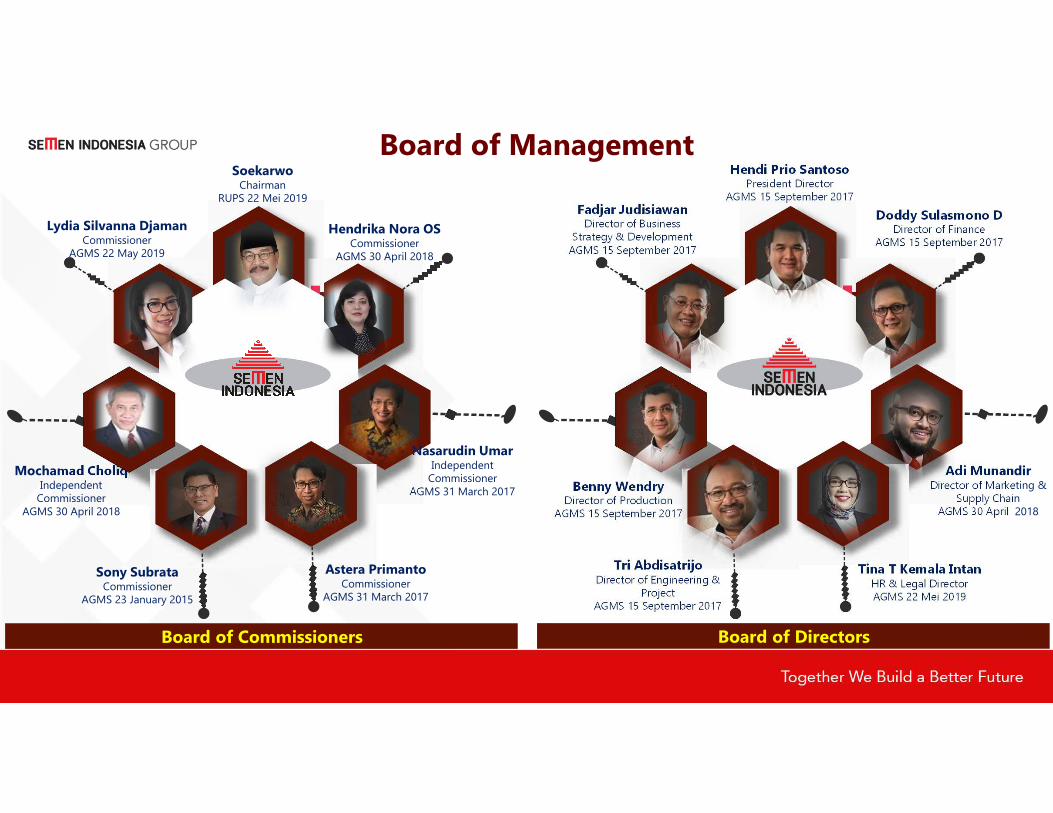
SoekarwoChairman
RUPS 22 Mei 2019
Hendrika Nora OSCommissioner
AGMS 30 April 2018
Nasarudin UmarIndependent
CommissionerAGMS 31 March 2017
Mochamad CholiqIndependent
CommissionerAGMS 30 April 2018
Lydia Silvanna DjamanCommissioner
AGMS 22 May 2019
Sony SubrataCommissioner
AGMS 23 January 2015
Astera PrimantoCommissioner
AGMS 31 March 2017
Board of Commissioners
Hendi Prio SantosoPresident Director
AGMS 15 September 2017
Doddy Sulasmono DDirector of Finance
AGMS 15 September 2017
Adi MunandirDirector of Marketing &
Supply ChainAGMS 30 April 2018
Benny WendryDirector of Production
AGMS 15 September 2017
Fadjar JudisiawanDirector of Business
Strategy & DevelopmentAGMS 15 September 2017
Tri AbdisatrijoDirector of Engineering &
ProjectAGMS 15 September 2017
Tina T Kemala IntanHR & Legal DirectorAGMS 22 Mei 2019
Board of Directors
Board of Management
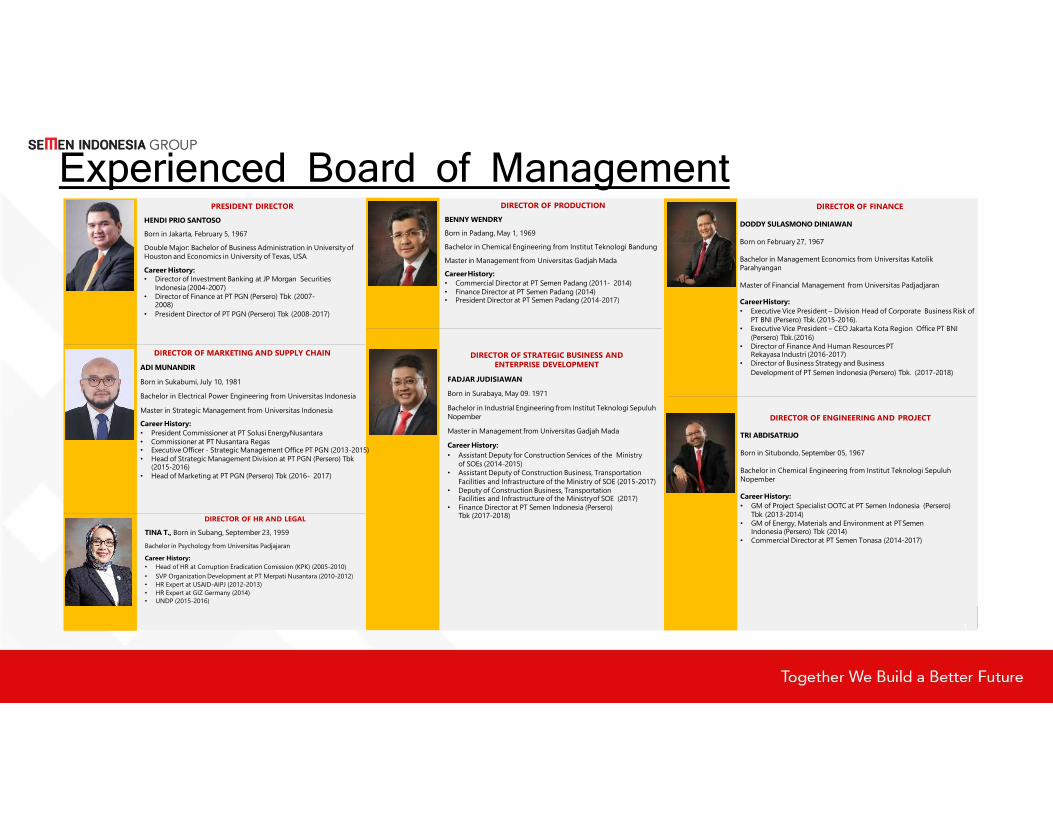
Experienced Board of ManagementPRESIDENT DIRECTOR
HENDI PRIO SANTOSO
Born in Jakarta, February 5, 1967
Double Major: Bachelor of Business Administration in University of Houston and Economics in University of Texas, USA
Career History:• Director of Investment Banking at JP Morgan Securities
Indonesia (2004-2007)• Director of Finance at PT PGN (Persero) Tbk (2007-
2008)
• President Director of PT PGN (Persero) Tbk (2008-2017)
DIRECTOR OF MARKETING AND SUPPLY CHAIN
ADI MUNANDIR
Born in Sukabumi, July 10, 1981
Bachelor in Electrical Power Engineering from Universitas Indonesia
Master in Strategic Management from Universitas Indonesia
Career History:
• President Commissioner at PT Solusi EnergyNusantara• Commissioner at PT Nusantara Regas• Executive Officer - Strategic Management Office PT PGN (2013-2015)• Head of Strategic Management Division at PT PGN (Persero) Tbk
(2015-2016)• Head of Marketing at PT PGN (Persero) Tbk (2016- 2017)
DIRECTOR OF HR AND LEGAL
TINA T., Born in Subang, September 23, 1959
Bachelor in Psychology from Universitas Padjajaran
Career History:
• Head of HR at Corruption Eradication Comission (KPK) (2005-2010)
• SVP Organization Development at PT Merpati Nusantara (2010-2012)
• HR Expert at USAID-AIPJ (2012-2013)
• HR Expert at GIZ Germany (2014)
• UNDP (2015-2016)
DIRECTOR OF PRODUCTION
BENNY WENDRY
Born in Padang, May 1, 1969
Bachelor in Chemical Engineering from Institut Teknologi Bandung
Master in Management from Universitas Gadjah Mada
CareerHistory:
• Commercial Director at PT Semen Padang (2011- 2014)• Finance Director at PT Semen Padang (2014)• President Director at PT Semen Padang (2014-2017)
DIRECTOR OF FINANCE
DODDY SULASMONO DINIAWAN
Born on February 27, 1967
Bachelor in Management Economics from Universitas KatolikParahyangan
Master of Financial Management from Universitas Padjadjaran
CareerHistory:
• Executive Vice President – Division Head of Corporate Business Risk of PT BNI (Persero) Tbk. (2015-2016).
• Executive Vice President – CEO Jakarta Kota Region Office PT BNI (Persero) Tbk.(2016)
• Director of Finance And Human ResourcesPTRekayasa Industri (2016-2017)
• Director of Business Strategy and Business
Development of PT Semen Indonesia (Persero) Tbk. (2017-2018)
DIRECTOR OF ENGINEERING AND PROJECT
TRI ABDISATRIJO
Born in Situbondo, September 05, 1967
Bachelor in Chemical Engineering from Institut Teknologi SepuluhNopember
Career History:
• GM of Project Specialist OOTC at PT Semen Indonesia (Persero) Tbk (2013-2014)
• GM of Energy, Materials and Environment at PTSemenIndonesia (Persero) Tbk (2014)
• Commercial Director at PT Semen Tonasa (2014-2017)
DIRECTOR OF STRATEGIC BUSINESS AND ENTERPRISE DEVELOPMENT
FADJAR JUDISIAWAN
Born in Surabaya, May 09. 1971
Bachelor in Industrial Engineering from Institut Teknologi SepuluhNopember
Master in Management from Universitas Gadjah Mada
Career History:
• Assistant Deputy for Construction Services of the Ministry of SOEs (2014-2015)
• Assistant Deputy of Construction Business, Transportation Facilities and Infrastructure of the Ministry of SOE (2015-2017)
• Deputy of Construction Business, TransportationFacilities and Infrastructure of the Ministryof SOE (2017)
• Finance Director at PT Semen Indonesia (Persero)Tbk (2017-2018)
1
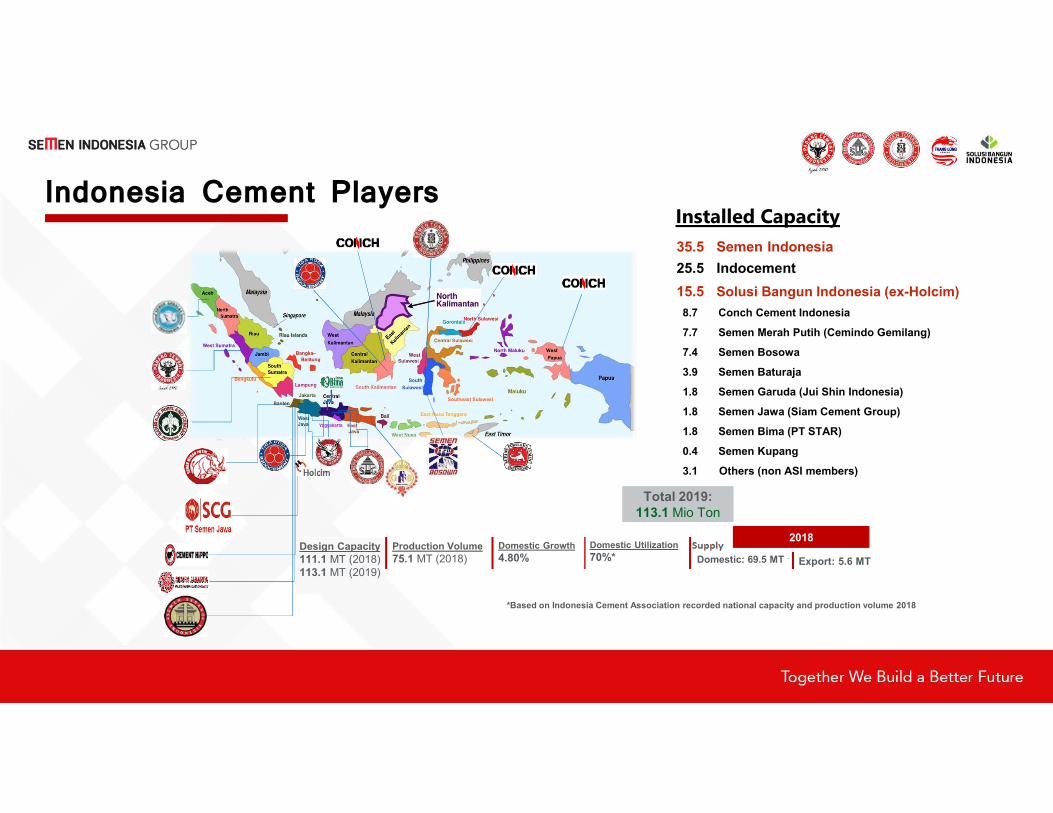
Installed Capacity
2018
35.5 Semen Indonesia
25.5 Indocement
15.5 Solusi Bangun Indonesia (ex-Holcim)
8.7 Conch Cement Indonesia
7.7 Semen Merah Putih (Cemindo Gemilang)
7.4 Semen Bosowa
3.9 Semen Baturaja
1.8 Semen Garuda (Jui Shin Indonesia)
1.8 Semen Jawa (Siam Cement Group)
1.8 Semen Bima (PT STAR)
0.4 Semen Kupang
3.1 Others (non ASI members)
Indonesia Cement Players
Design Capacity
111.1 MT (2018)
113.1 MT (2019)
Production Volume
75.1 MT (2018)
Domestic Growth
4.80%
Domestic Utilization
70%* Domestic: 69.5 MT Export: 5.6 MT
*Based on Indonesia Cement Association recorded national capacity and production volume 2018
Total 2019:
113.1 Mio Ton
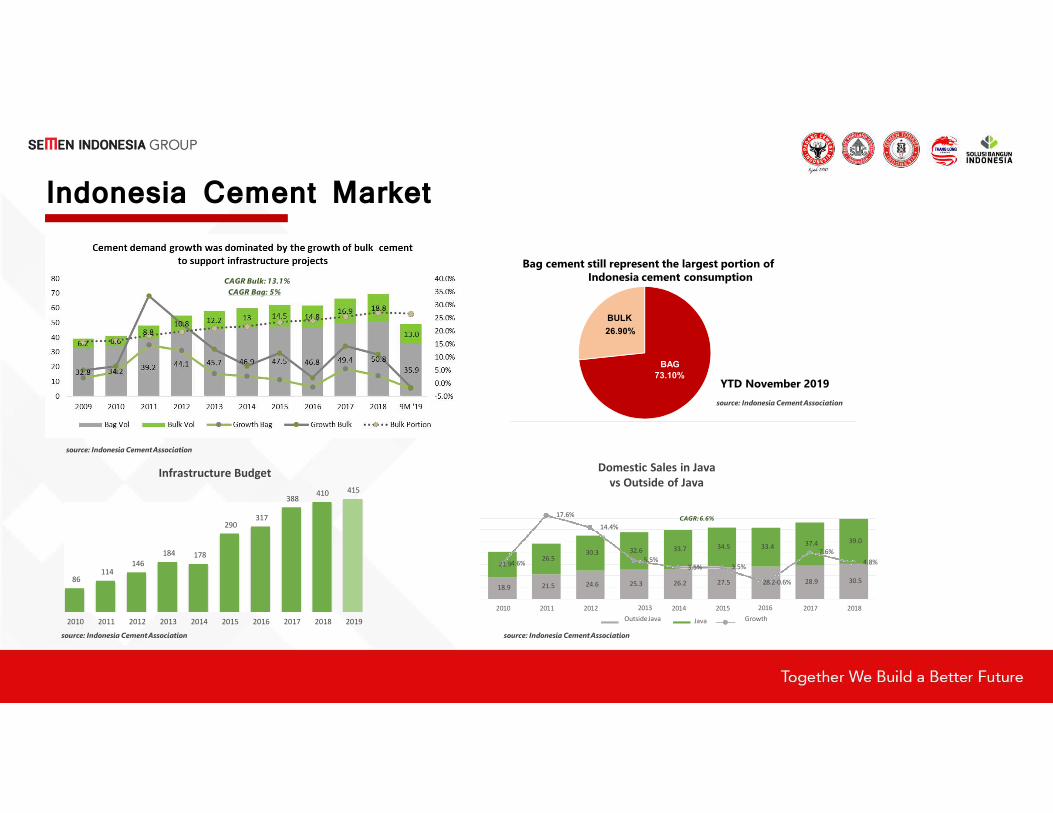
Indonesia Cement Market
BAG
73%
BULK
27%
86114
146
184 178
290317
388410 415
2010 2011 2012 2013 2014 2015 2016 2017 2018 2019
Infrastructure Budget
18.9 21.5 24.6 25.3 26.2 27.5 28.9 30.5
26.530.3 32.6 33.7 34.5 33.4
37.4 39.0
21.94.6%
17.6%
14.4%
5.5%3.5% 3.5%
28.2-0.6%
7.6%
4.8%
2010 2011 2012 2014 2015 2017 20182013
OutsideJava Java
2016
Growth
CAGR: 6.6%
source: Indonesia CementAssociationsource: Indonesia CementAssociation
source: Indonesia CementAssociation
source: Indonesia CementAssociation
Bag cement still represent the largest portion of Indonesia cement consumption
YTD November 2019
Domestic Sales in Java
vs Outside of Java
73.10%
26.90%
BAG
BULK
CAGR Bulk: 13.1%
CAGR Bag: 5%
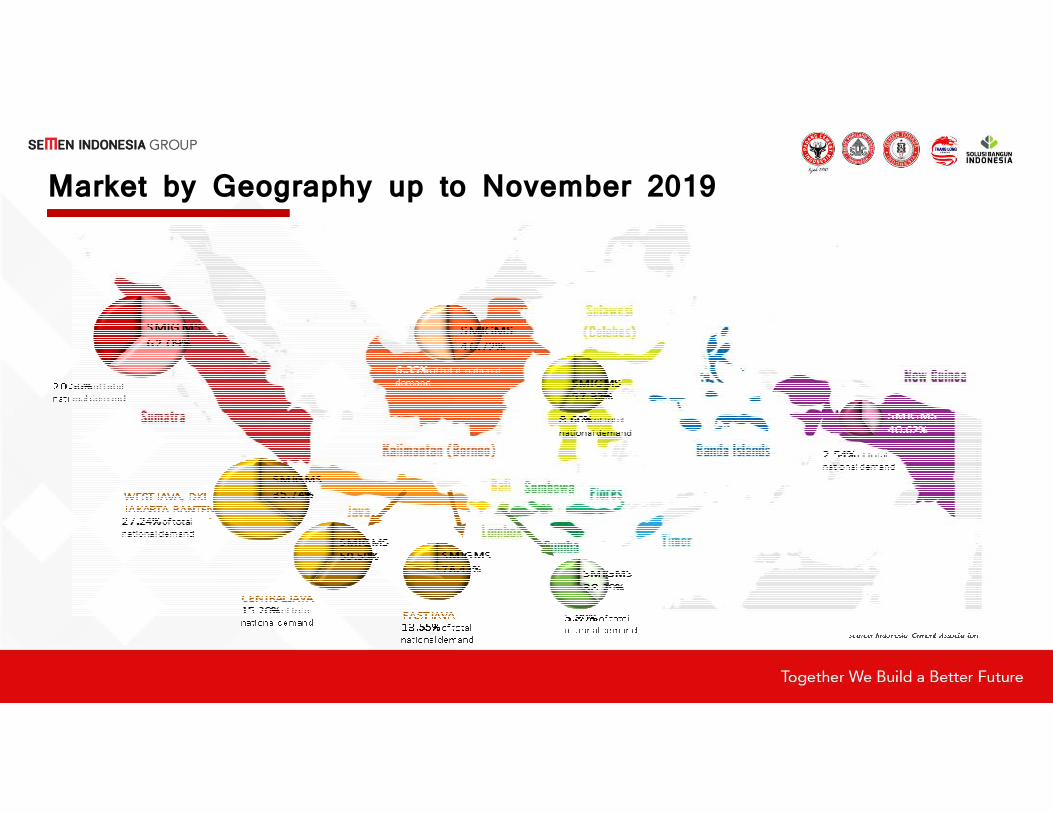
Market by Geography up to November 2019
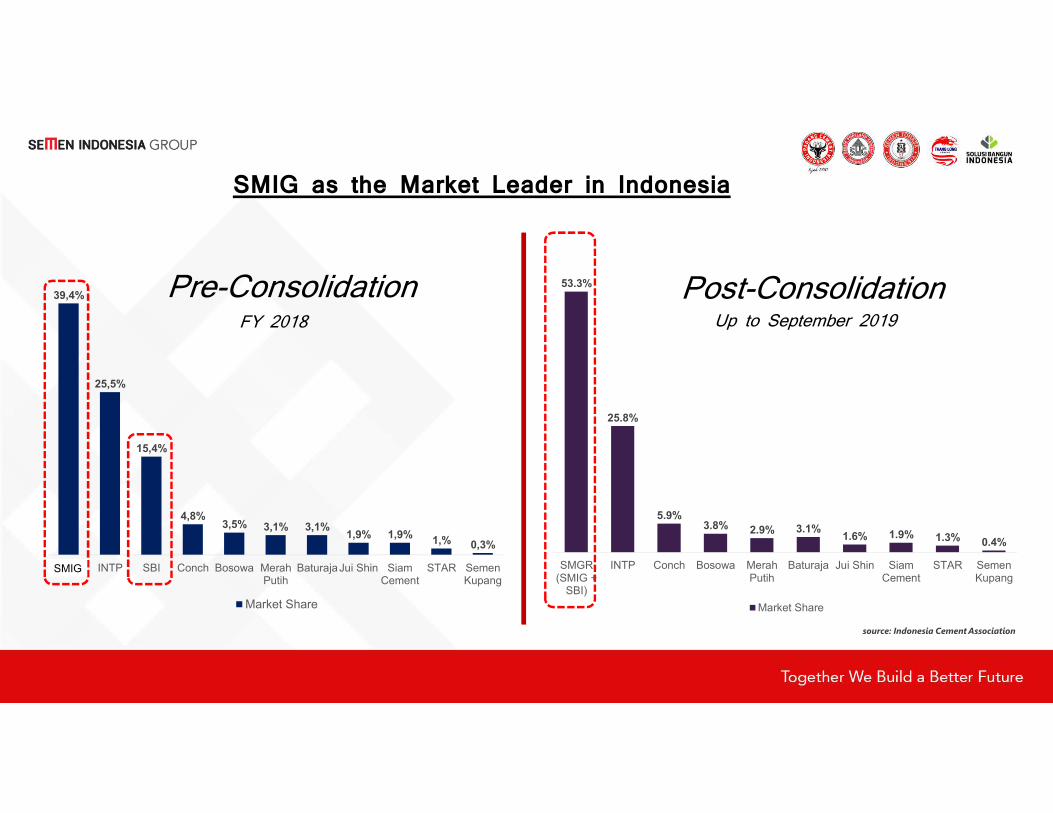
39,4%
25,5%
15,4%
4,8%3,5% 3,1% 3,1%
1,9% 1,9%1,% 0,3%
SMGR INTP SBI Conch Bosowa MerahPutih
BaturajaJui Shin SiamCement
STAR SemenKupang
Market Share
SMIG as the Market Leader in Indonesia
Pre-ConsolidationFY 2018
source: Indonesia Cement Association
SMIG
Post-ConsolidationUp to September 2019
53.3%
25.8%
5.9%3.8% 2.9% 3.1%
1.6% 1.9% 1.3% 0.4%
SMGR(SMIG +
SBI)
INTP Conch Bosowa MerahPutih
Baturaja Jui Shin SiamCement
STAR SemenKupang
Market Share
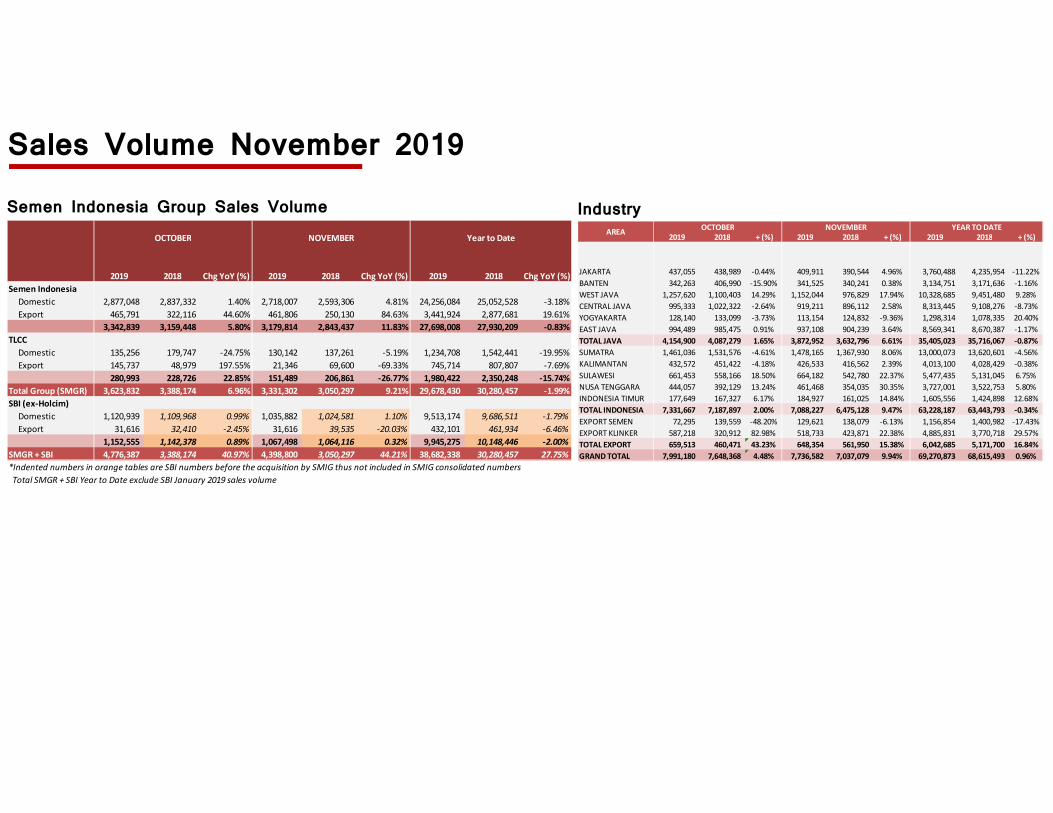
Sales Volume November 2019
Semen Indonesia Group Sales Volume Industry
2019 2018 Chg YoY (%) 2019 2018 Chg YoY (%) 2019 2018 Chg YoY (%)
Semen Indonesia
Domestic 2,877,048 2,837,332 1.40% 2,718,007 2,593,306 4.81% 24,256,084 25,052,528 -3.18%
Export 465,791 322,116 44.60% 461,806 250,130 84.63% 3,441,924 2,877,681 19.61%
3,342,839 3,159,448 5.80% 3,179,814 2,843,437 11.83% 27,698,008 27,930,209 -0.83%
TLCC
Domestic 135,256 179,747 -24.75% 130,142 137,261 -5.19% 1,234,708 1,542,441 -19.95%
Export 145,737 48,979 197.55% 21,346 69,600 -69.33% 745,714 807,807 -7.69%
280,993 228,726 22.85% 151,489 206,861 -26.77% 1,980,422 2,350,248 -15.74%
Total Group (SMGR) 3,623,832 3,388,174 6.96% 3,331,302 3,050,297 9.21% 29,678,430 30,280,457 -1.99%
SBI (ex-Holcim)
Domestic 1,120,939 1,109,968 0.99% 1,035,882 1,024,581 1.10% 9,513,174 9,686,511 -1.79%
Export 31,616 32,410 -2.45% 31,616 39,535 -20.03% 432,101 461,934 -6.46%
1,152,555 1,142,378 0.89% 1,067,498 1,064,116 0.32% 9,945,275 10,148,446 -2.00%
SMGR + SBI 4,776,387 3,388,174 40.97% 4,398,800 3,050,297 44.21% 38,682,338 30,280,457 27.75%
*Indented numbers in orange tables are SBI numbers before the acquisition by SMIG thus not included in SMIG consolidated numbers
Total SMGR + SBI Year to Date exclude SBI January 2019 sales volume
OCTOBER Year to DateNOVEMBER 2019 2018 + (%) 2019 2018 + (%) 2019 2018 + (%)
JAKARTA 437,055 438,989 -0.44% 409,911 390,544 4.96% 3,760,488 4,235,954 -11.22%
BANTEN 342,263 406,990 -15.90% 341,525 340,241 0.38% 3,134,751 3,171,636 -1.16%
WEST JAVA 1,257,620 1,100,403 14.29% 1,152,044 976,829 17.94% 10,328,685 9,451,480 9.28%
CENTRAL JAVA 995,333 1,022,322 -2.64% 919,211 896,112 2.58% 8,313,445 9,108,276 -8.73%
YOGYAKARTA 128,140 133,099 -3.73% 113,154 124,832 -9.36% 1,298,314 1,078,335 20.40%
EAST JAVA 994,489 985,475 0.91% 937,108 904,239 3.64% 8,569,341 8,670,387 -1.17%
TOTAL JAVA 4,154,900 4,087,279 1.65% 3,872,952 3,632,796 6.61% 35,405,023 35,716,067 -0.87%
SUMATRA 1,461,036 1,531,576 -4.61% 1,478,165 1,367,930 8.06% 13,000,073 13,620,601 -4.56%
KALIMANTAN 432,572 451,422 -4.18% 426,533 416,562 2.39% 4,013,100 4,028,429 -0.38%
SULAWESI 661,453 558,166 18.50% 664,182 542,780 22.37% 5,477,435 5,131,045 6.75%
NUSA TENGGARA 444,057 392,129 13.24% 461,468 354,035 30.35% 3,727,001 3,522,753 5.80%
INDONESIA TIMUR 177,649 167,327 6.17% 184,927 161,025 14.84% 1,605,556 1,424,898 12.68%
TOTAL INDONESIA 7,331,667 7,187,897 2.00% 7,088,227 6,475,128 9.47% 63,228,187 63,443,793 -0.34%
EXPORT SEMEN 72,295 139,559 -48.20% 129,621 138,079 -6.13% 1,156,854 1,400,982 -17.43%
EXPORT KLINKER 587,218 320,912 82.98% 518,733 423,871 22.38% 4,885,831 3,770,718 29.57%
TOTAL EXPORT 659,513 460,471 43.23% 648,354 561,950 15.38% 6,042,685 5,171,700 16.84%
GRAND TOTAL 7,991,180 7,648,368 4.48% 7,736,582 7,037,079 9.94% 69,270,873 68,615,493 0.96%
OCTOBER YEAR TO DATEAREA
NOVEMBER
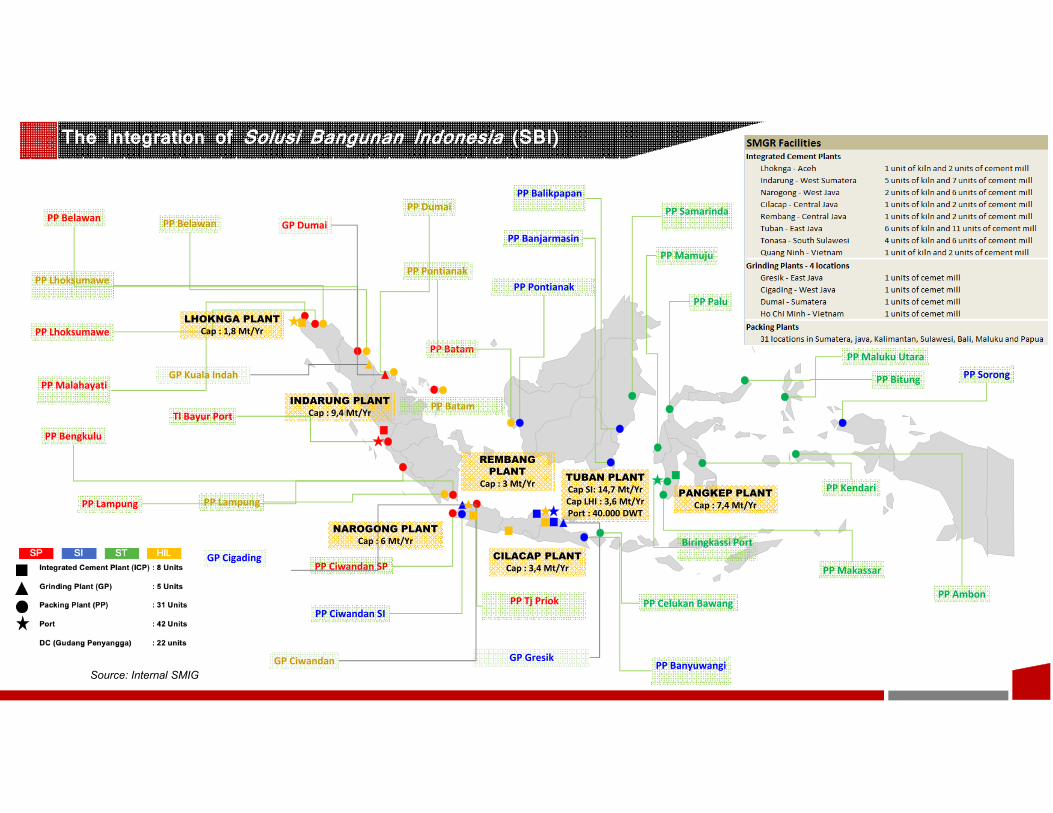
Source: Internal SMIG
TUBAN PLANT
Cap SI: 14,7 Mt/Yr
Cap LHI : 3,6 Mt/Yr
Port : 40.000 DWT
INDARUNG PLANT
Cap : 9,4 Mt/Yr
GP Dumai
GP Gresik
PP Lhoksumawe
PP Malahayati
PP Batam
Tl Bayur Port
PP Lampung
PP Pontianak
PP Samarinda
PP Banjarmasin
PP Balikpapan
PP Bitung
PP Palu
PP Mamuju
Biringkassi Port
PP Makassar
PP Kendari
PP Sorong
PP Ambon
PP Banyuwangi
PP Celukan Bawang
PANGKEP PLANT
Cap : 7,4 Mt/Yr
PP Belawan
PP Tj Priok
PP Ciwandan SP
PP Ciwandan SI
PP Maluku Utara
GP Ciwandan
PP Bengkulu
REMBANG
PLANT
Cap : 3 Mt/Yr
LHOKNGA PLANT
Cap : 1,8 Mt/Yr
NAROGONG PLANT
Cap : 6 Mt/Yr
CILACAP PLANT
Cap : 3,4 Mt/Yr
PP Lhoksumawe
PP Belawan
PP Pontianak
PP Dumai
PP Batam
GP Kuala Indah
PP Lampung
GP Cigading
The Integration of Solusi Bangunan Indonesia (SBI)
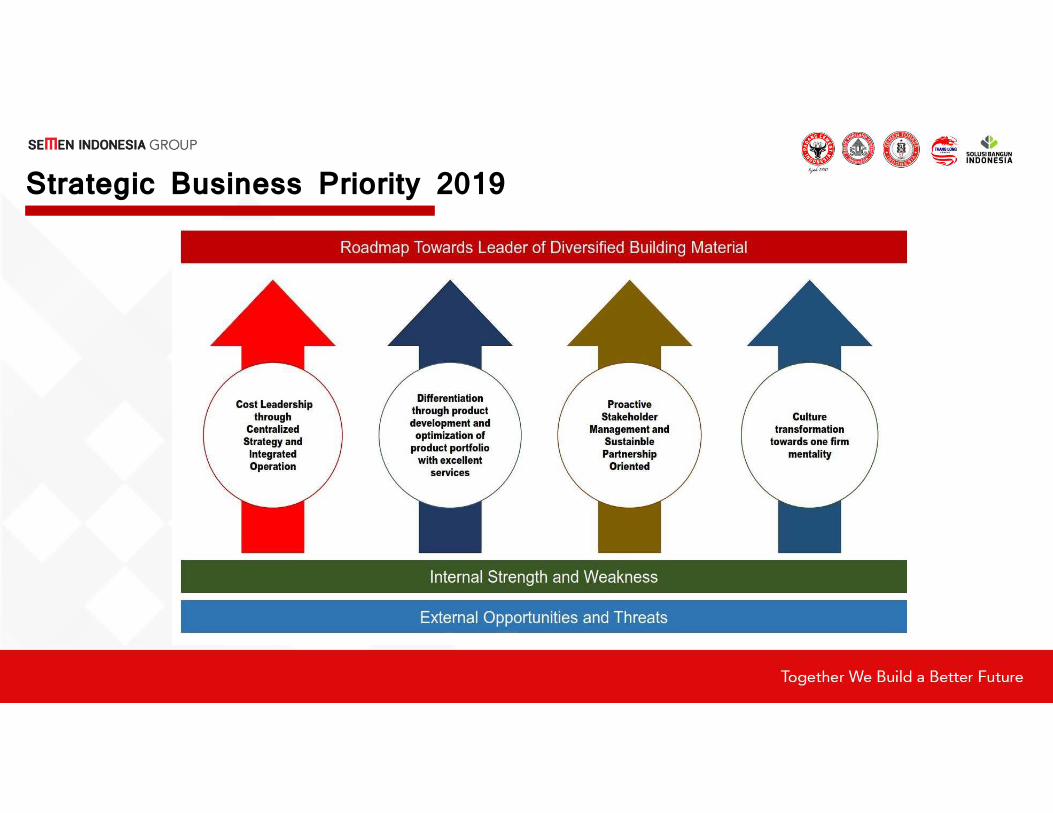
Strategic Business Priority 2019
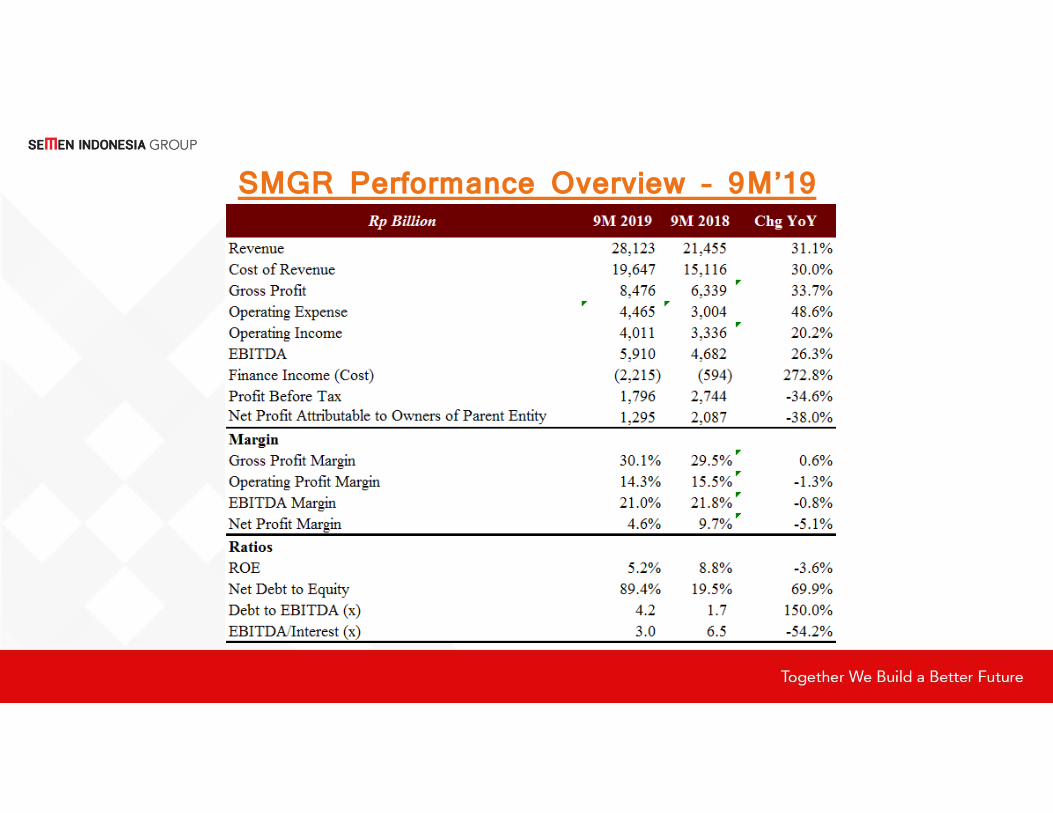
SMGR Performance Overview – 9M’19
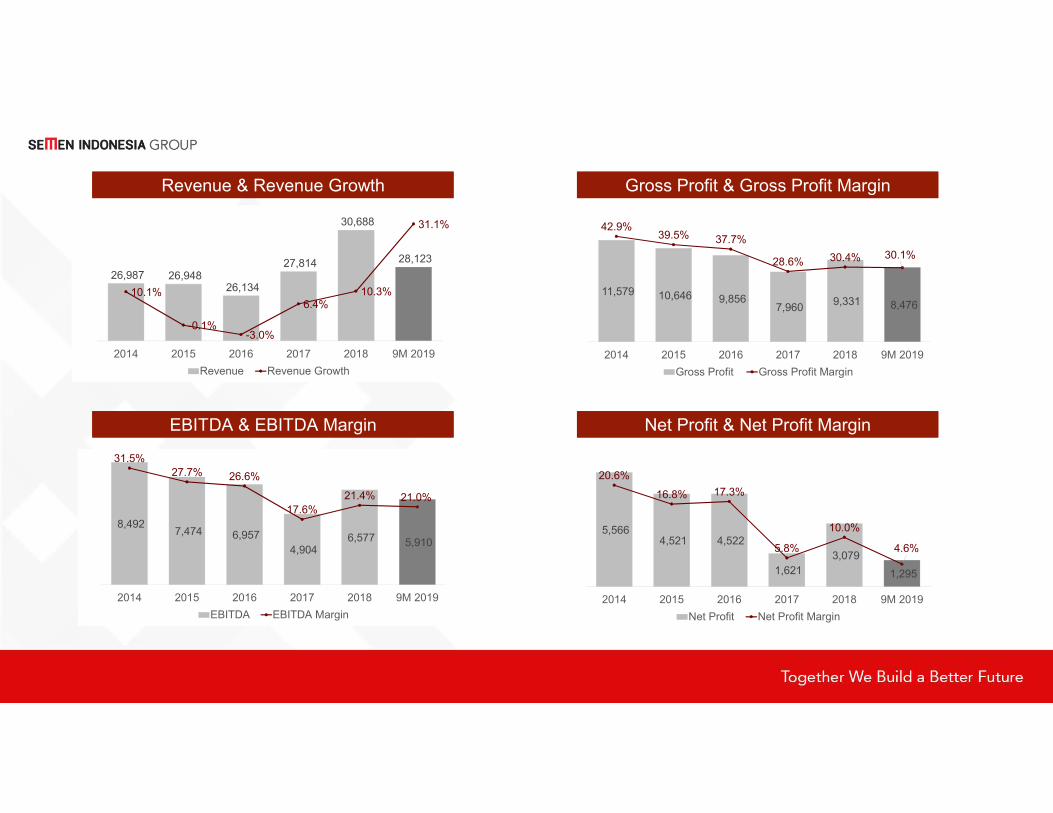
8,492 7,474 6,957
4,904 6,577 5,910
31.5%
27.7% 26.6%
17.6%
21.4% 21.0%
2014 2015 2016 2017 2018 9M 2019
EBITDA EBITDA Margin
11,579 10,646 9,856 7,960
9,331 8,476
42.9%39.5% 37.7%
28.6% 30.4% 30.1%
2014 2015 2016 2017 2018 9M 2019
Gross Profit Gross Profit Margin
5,566 4,521 4,522
1,621
3,079
1,295
20.6%
16.8% 17.3%
5.8%
10.0%
4.6%
2014 2015 2016 2017 2018 9M 2019
Net Profit Net Profit Margin
Revenue & Revenue GrowthRevenue & Revenue Growth Gross Profit & Gross Profit MarginGross Profit & Gross Profit Margin
26,987 26,948 26,134
27,814
30,688
28,123
10.1%
-0.1%-3.0%
6.4%10.3%
31.1%
2014 2015 2016 2017 2018 9M 2019
Revenue Revenue Growth
EBITDA & EBITDA MarginEBITDA & EBITDA Margin Net Profit & Net Profit MarginNet Profit & Net Profit Margin
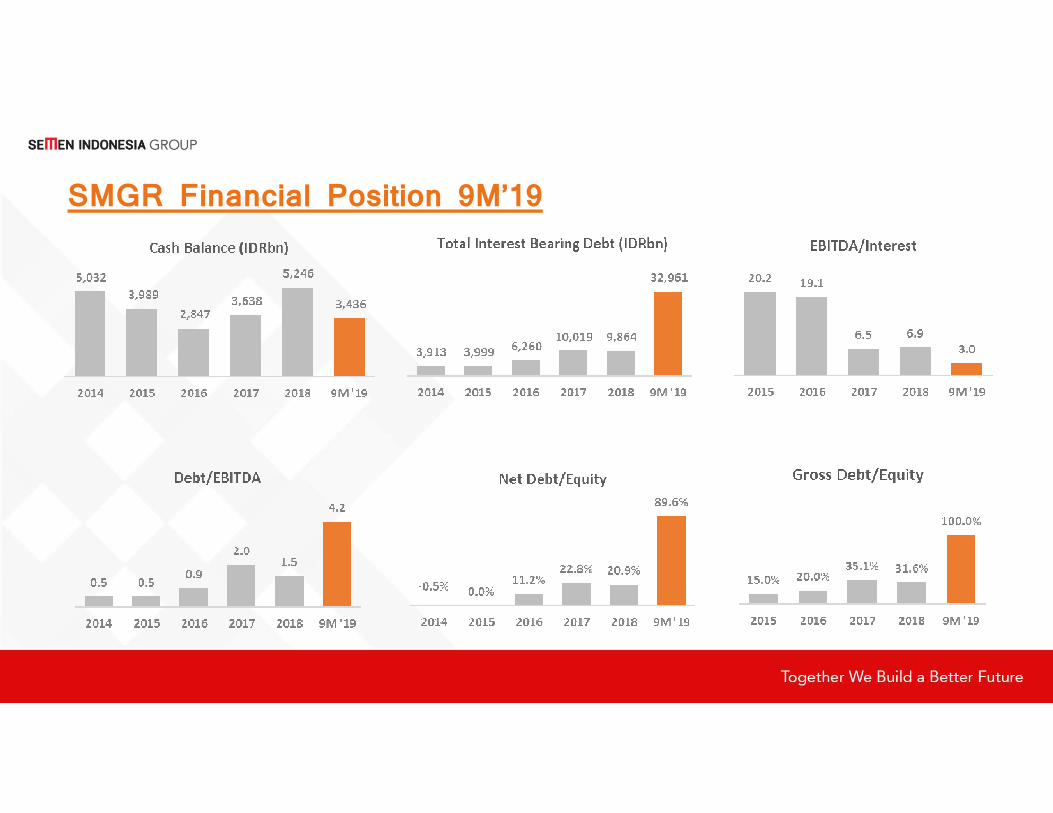
SMGR Financial Position 9M’19
Thank YouIMPORTANT NOTICE
THIS PRESENTATION IS NOT AND DOES NOT CONSTITUTE OR FORM PART OF, AND IS NOT MADE IN CONNECTION WITH, ANY
OFFER FOR SALE OR SUBSCRIPTION OF OR SOLICITATION, RECOMMENDATION OR INVITATION OF ANY OFFER TO BUY OR
SUBSCRIBE FOR ANY SECURITIES NOR SHALL IT OR ANY PART OF IT FORM THE BASIS OF OR BE RELIED ON IN CONNECTION
WITH ANY CONTRACT, COMMITMENT OR INVESTMENT DECISION WHATSOEVER.
THE SLIDES USED IN THIS PRESENTATION HAVE BEEN PREPARED AS A SUPPORT FOR ORAL DISCUSSIONS ONLY..
This presentation includes forward-looking statements, which are based on current expectations and forecast about future events. Such
statements involve known / unknown risks uncertainties and other factors, which could cause actual results to differ materially from historical
results or those anticipated. Such factors include, among others:
● economic, social and political conditions in Indonesia, and the impact such conditions have on construction and infrastructure spending in
Indonesia;
● the effects of competition;
● the effects of changes in laws, regulations, taxation or accounting standards or practices;
● acquisitions, divestitures and various business opportunities that we may pursue;
● changes or volatility in inflation, interest rates and foreign exchange rates;
● accidents, natural disasters or outbreaks of infectious diseases, such as avian influenza, in our markets;
● labor unrest or other similar situations; and
● the outcome of pending or threatened litigation.
We can give no assurance that our expectations will be attained.
DISCLAIMER
The information contained in this report has been taken from sources which we deem reliable. However, none of PT Semen Indonesia
(Persero) Tbk and/or its affiliated companies and/or their respective employees and/or agents make any representation or warranty
(express or implied) or accepts any responsibility or liability as to, or in relation to, the accuracy or completeness of the information and
opinions contained in this report or as to any information contained in this report or any other such information or opinions remaining
unchanged after the issue thereof.
We expressly disclaim any responsibility or liability (express or implied) of PT Semen Indonesia (Persero) Tbk, its affiliated companies and
their respective employees and agents whatsoever and howsoever arising (including, without limitation for any claim, proceedings, action,
suits, losses, expenses, damages or costs) which may be brought against or suffered by any person as a result of acting in reliance upon
the whole or any part of the contents of this report and neither PT Semen Indonesia (Persero) Tbk, its affiliated companies or their
respective employees or agents accepts liability for any errors, omission or mis-statements, negligent or otherwise, in the report and any
liability in respect of the report or any inaccuracy therein or omission therefrom which might otherwise arise is hereby expresses
disclaimed.
PT Semen Indonesia (Persero) Tbk.
Kantor Pusat
South Quarter Tower A Lt. 19Jl. RA Kartini Kav.8, Cilandak Barat, Jakarta Selatan
Jakarta 12430
Telp: (021) 5261174/5Fax : (021) 5261176
@semen
indonesia
Semen
Indonesia
Semen
Indonesia
@semenku
www.semenindonesia.com
Recommended