"CONTROLLING THE INTEREST—RATE RISK OF BONDS: AN INTRODUCTION TO DURATION
ANALYSIS AND IMMUNIZATION STRATEGIES"
by Gabriel HAWAWINI*
N° 87 / 28
* Gabriel HAWAWINI, INSEAD, Fontainebleau, France
Director of Publication :
Charles WYPLOSZ, Associate Dean for Research and Development
Printed at INSEAD, Fontainebleau, France
CONTROLLING THE INTEREST-RATE RISK OF BONDS:
AN INTRODUCTION TO DURATION ANALYSIS
AND IMNUNIZATION STRATEGIES
(Forthcoming in Financial Markets and Portfolio Management)
GABRIEL HAWAWINI
INSEAD, Fontainebleau, France
September 1987
An earlier version of this article was written for the first
European Portfolio Investment Colloquium in Fontainebleau (1985).
The article was rewritten while the author was a visiting
professor at the Wharton School of the University of Pennsylvania
(Philadelphia). The author thanks Jean Dermine and Harold Bierman
for their useful comments and Gillian Hay for typing several
versions of the manuscript.
CONTROLLING THE INTEREST-RATE RISK OF BONDS:
AN INTRODUCTION TO DURATION ANALYSIS
AND IMMUNIZATION STRATEGIES
In this article we introduce the concept of duration as a measure of
interest-rate risk exposure. We then show how duration can be used to
design a strategy to protect (or immunize) an asset's value from
unanticipated changes in the level of interest rates.
Nous présentons dans cet article la notion de "duration" qui
s'interprète comme une mesure du risque de taux d'intérêt. On montre
ensuite comment on peut utiliser la "duration" d'un actif pour mettre en
oeuvre une stratégie qui protège (ou immunise) cet actif contre les
fluctuations non-anticipées des taux d'intérêts.
- 2 -
CONTROLLING THE INTEREST-RATE RISK OF BONDS:
AN INTRODUCTION TO DURATION ANALYSIS
AND IMMUNIZATION STRATEGIES
1. Introduction
Consider a bond with an annual coupon-rate of 8 percent and a 6-year
term to maturity. Suppose that the prevailing market yield (or level of
interest rate) is also 8 percent. The bond sells at par since its coupon
rate is equal to the prevailing market yield.
Assume that there is an unanticipated increase in the market yield
from 8 percent to 8% percent. The bond's price must drop to reflect the
rise in the level of the market yield. The bond is now selling at a
discount from face value. Its price is 97.72 1. At this price it yields
8% percent. In percentage terms, the drop in price is equal to 2.28
percent [(97.72 - 100)/100]. Had the market yield gone down from 8
percent to 7Y2 percent, the price of the bond would have gone up from 100
to 102.35, an increase in price of 2.35 percent2.
The above numerical example illustrates a straight forward
phenomenon regarding bonds. Their price fluctuates unexpectedly in
response to unanticipated changes in the market yield. In other words,
bonds are exposed to interest-rate risk. This source of risk differs from
so-called creditor or default risk. The former originates in the market
and affects ail bonds. The latter is issuer-specific. It refers to the
probability that the issuer will not service his debt according to the
agreed-upon schedule, the extreme case being default.
In what follows we only examine interest-rate risk. We want to
answer two questions. How can we measure a bond's exposure to interest-
rate risk ? And how can we protect a bond's value from unanticipated
rises and declines in the level of interest rates ?
We will see that duration, a major characteristic of bonds, provides
an answer to both questions. In section 2 we show that a bond's duration
is a convenient measure of its exposure to interest-rate risk and in
sections 4 and 5 we demonstrate that if a bond is held over a period of
time equal to its duration then its return over the holding period is
- 3 -
unaffected by changes in interest rates. The bond is said to be immunized
against interest-rate risk. To illustrate, suppose that you bought the 6-
year, 8-percent bond selling at par. In section 6 we show that the
duration of this bond is equal to 5 years. Hence, if you hold the bond
over a 5-year period, you should earn 8 percent even if the level of
interest rate changes after you purchased the bond3.
2. A bond's duration is a measure of its exposure to interest-rate risk
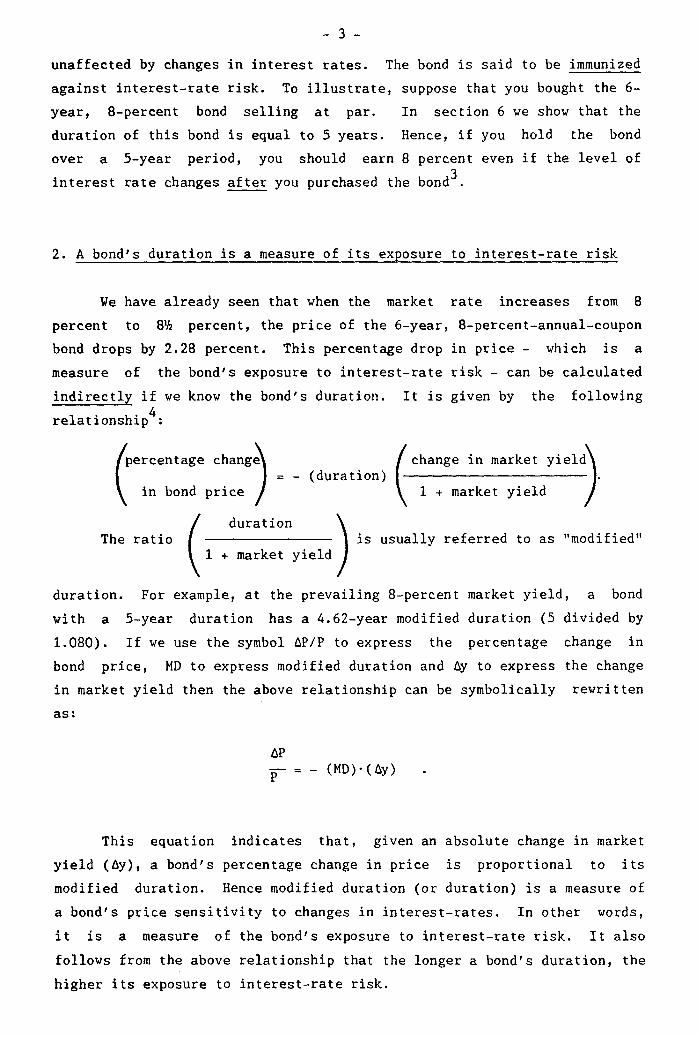
We have already seen that when the market rate increases from 8
percent to 8% percent, the price of the 6-year, 8-percent-annual-coupon
bond drops by 2.28 percent. This percentage drop in price - which is a
measure of the bond's exposure to interest-rate risk - can be calculated
indirectly if we know the bond's duration. It is given by the following
relationship4:
(: cha
percentage change nge in market yield = - (duration)
in bond price 1 + market yield
duration The ratio
is usually referred to as "modified" 1 + market yield
duration. For example, at the prevailing 8-percent market yield, a bond
with a 5-year duration has a 4.62-year modified duration (5 divided by
1.080). If we use the symbol AP/P to express the percentage change in
bond price, MD to express modified duration and Ay to express the change
in market yield then the above relationship can be symbolically rewritten
as:
AP -- P = - (MD).(Ay) .
This equation indicates that, given an absolute change in market
yield (6y), a bond's percentage change in price is proportional to its
modified duration. Hence modified duration (or duration) is a measure of
a bond's price sensitivity to changes in interest-rates. In other words,
it is a measure of the bond's exposure to interest-rate risk. It also
follows from the above relationship that the longer a bond's duration, the
higher its exposure to interest-rate risk.
- 4 -
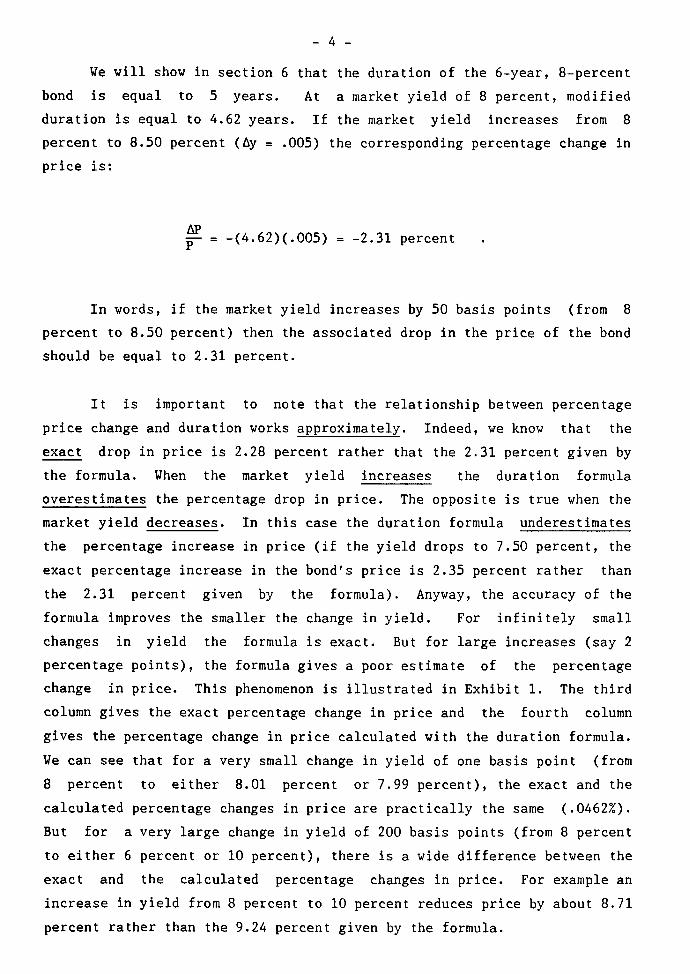
We will show in section 6 that the duration of the 6-year, 8-percent
bond is equal to 5 years. At a market yield of 8 percent, modified
duration is equal to 4.62 years. If the market yield increases from 8
percent to 8.50 percent (ày = .005) the corresponding percentage change in
price is:
AP = -(4.62)(.005) = -2.31 percent
In words, if the market yield increases by 50 basis points (from 8
percent to 8.50 percent) then the associated drop in the price of the bond
should be equal to 2.31 percent.
It is important to note that the relationship between percentage
price change and duration works approximately. Indeed, we know that the
exact drop in price is 2.28 percent rather that the 2.31 percent given by
the formula. When the market yield increases the duration formula
overestimates the percentage drop in price. The opposite is true when the
market yield decreases. In this case the duration formula underestimates
the percentage increase in price (if the yield drops to 7.50 percent, the
exact percentage increase in the bond's price is 2.35 percent rather than
the 2.31 percent given by the formula). Anyway, the accuracy of the
formula improves the smaller the change in yield. For infinitely small
changes in yield the formula is exact. But for large increases (say 2
percentage points), the formula gives a poor estimate of the percentage
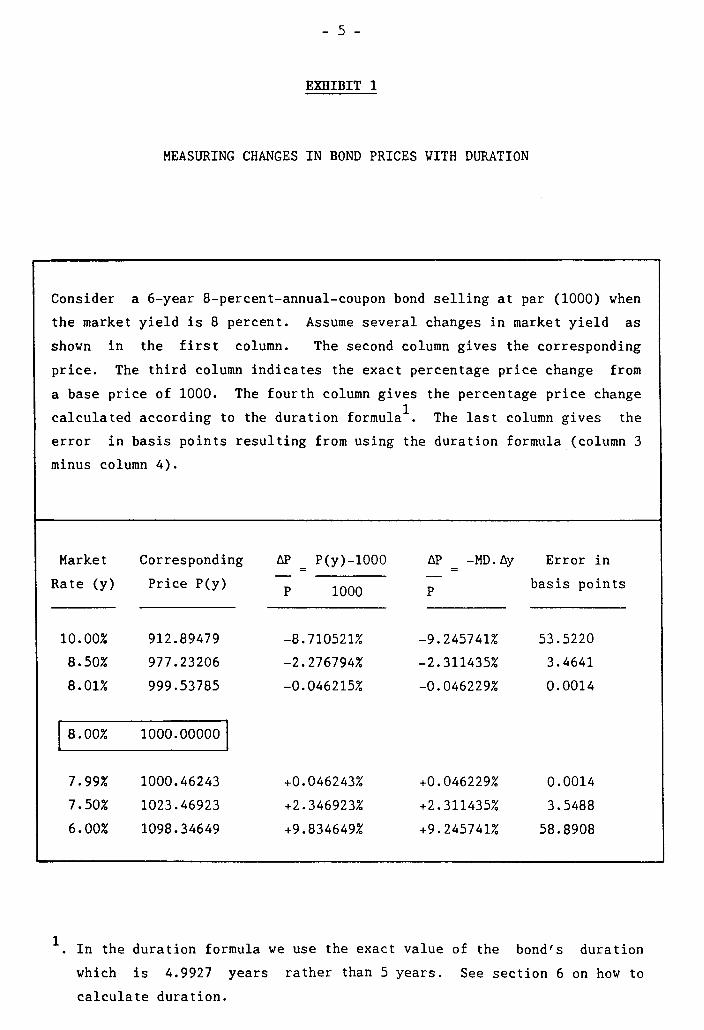
change in price. This phenomenon is illustrated in Exhibit 1. The third
column gives the exact percentage change in price and the fourth column
gives the percentage change in price calculated with the duration formula.
We can see that for a very small change in yield of one basis point (from
8 percent to either 8.01 percent or 7.99 percent), the exact and the
calculated percentage changes in price are practically the same (.0462%).
But for a very large change in yield of 200 basis points (from 8 percent
to either 6 percent or 10 percent), there is a wide difference between the
exact and the calculated percentage changes in price. For example an
increase in yield from 8 percent to 10 percent reduces price by about 8.71
percent rather than the 9.24 percent given by the formula.
- 5 -
EXHIBIT 1
MEASURING CHANGES IN BOND PRICES WITH DURATION
Consider a 6-year 8-percent-annual-coupon bond selling at par (1000) when
the market yield is 8 percent. Assume several changes in market yield as
shown in the first column. The second column gives the corresponding
price. The third column indicates the exact percentage price change from
a base price of 1000. The fourth column gives the percentage price change
calculated according to the duration formula1. The last column gives the
error in basis points resulting from using the duration formula (column 3
minus column 4).
Market
Rate (y)
Corresponding
Price P(y)
AP P(y)-1000 AP -MD.Ay =
P
Error in
basis points P 1000
10.00% 912.89479 -8.710521% -9.245741% 53.5220
8.50% 977.23206 -2.276794% -2.311435% 3.4641
8.01% 999.53785 -0.046215% -0.046229% 0.0014
8.00% 1000.00000
7.99% 1000.46243 +0.046243% +0.046229% 0.0014
7.50% 1023.46923 +2.346923% +2.311435% 3.5488
6.00% 1098.34649 +9.834649% +9.245741% 58.8908
1. In the duration formula we use the exact value of the bond's duration
which is 4.9927 years rather than 5 years. See section 6 on how to
calculate duration.
- 6 -
The duration formula doesn't provide exact percentage price changes
because it assumes a linear relationship between price changes and yield
changes whereas the exact relationship between bond prices and yields is
actually convex. The reader will find a discussion on bond convexity and
its relationship to bond duration in Appendix One where we give a formula
to calculate a bond's exposure to interest-rate risk when the change in
yield is relatively large.
3. A bond's duration can be used to modify its exposure to interest-rate
risk
Suppose that you wish to reduce the interest-rate risk exposure of a
bond (or a portfolio of bonds). You can achieve this by shortening the
duration of the bond (or a portfolio of bonds). If you wish to increase
interest-rate risk exposure you would do the opposite: you would lengthen
the duration of the bond (or a portfolio of bonds).
In order to modify the duration of a portfolio of bonds you must
rebalance the portfolio. For example, to reduce duration you sell bonds
with relatively long duration and purchase bonds with relatively short
duration in such a way as to achieve a desired shorter duration for the
portfolio. This will be illustrated in sections 9 and 10. And to modify
the duration of a single bond, you must combine it with another bond (or
another financial instrument) with a shorter or longer duration. This
will be illustrated in section 9.
4. A bond's duration is equal to its "immunized" holding period
As pointed out earlier, if the bond is held over a period of 5 years
(a length of time equal to its duration) then the bondholder is immunized
against a change in the level of the rate of interest. In other words,
the holder of the bond is assured a realized return of 8 percent (the
bond's original yield to maturity) even though the rate of interest may
change immediately after the bond is purchased.
It is important to note, however, that this immunization strategy
will work only if the yield curve is flat (i.e., the yield on all bonds is
the same regardless of their term to maturity) and changes in the market
yield are the same for ail bonds (i.e., that the flat yield curve moves in
- 7 -
a parallel fashion). We will refer to this strategy as "conventional"
immunization strategy. In Appendix Two we examine what happens when the
conditions for conventional immunization are not met. It should also
be pointed out that the 6-year, 8-percent coupon bond is immunized against
a change in the rate of interest that occurs immediately after the bond
is purchased. We will see that as time passes, the bond's duration will
no longer be equal to the remainder of the 5-year holding period and hence
the bond will no longer be immunized. Continuous immunization will
require "portfolio" rebalancing. This point is explained and illustrated
in section 10.
5. How does conventional immunization work ?
In order to understand how immunization works we must understand how
an unanticipated change in the rate of interest affects the profitability
of an investment in a bond (or a portfolio of bonds).
First, a change in the interest rate affects the price of the bond
(or the value of the portfolio). An increase in the interest rate creates
a capital loss and a decrease in the interest rate creates a capital gain
because the price of the bond (or the value of the portfolio) must adjust
downward or upward to reflect the new rate of interest prevailing in the
market. This is the price risk.
Second, a change in the interest rate affects the future income from
the reinvestment of the bond's (or portfolio) coupon payments. An
increase in the interest rate means that future coupon payments can be
reinvested at a higher rate thus creating additional income. A decrease
in the interest rate means that future coupon payments will be reinvested
at a lover rate thus creating a loss of income. This is the reinvestment
risk.
The interesting aspect of this phenomenon is that the two types of
risk work in opposite directions. An increase in interest rate creates a
capital loss but generates higher income from coupon reinvestment. A
decrease in interest rate creates a capital gain but reduces the income
from coupon reinvestment. The bond (or portfolio of bonds) has a "built-
in" hedge against interest-rate fluctuations. The important point is that
if the bond is held over a period of time equal to its duration the two
types of risk offset each other completely and the bond is perfectly
- 8 -
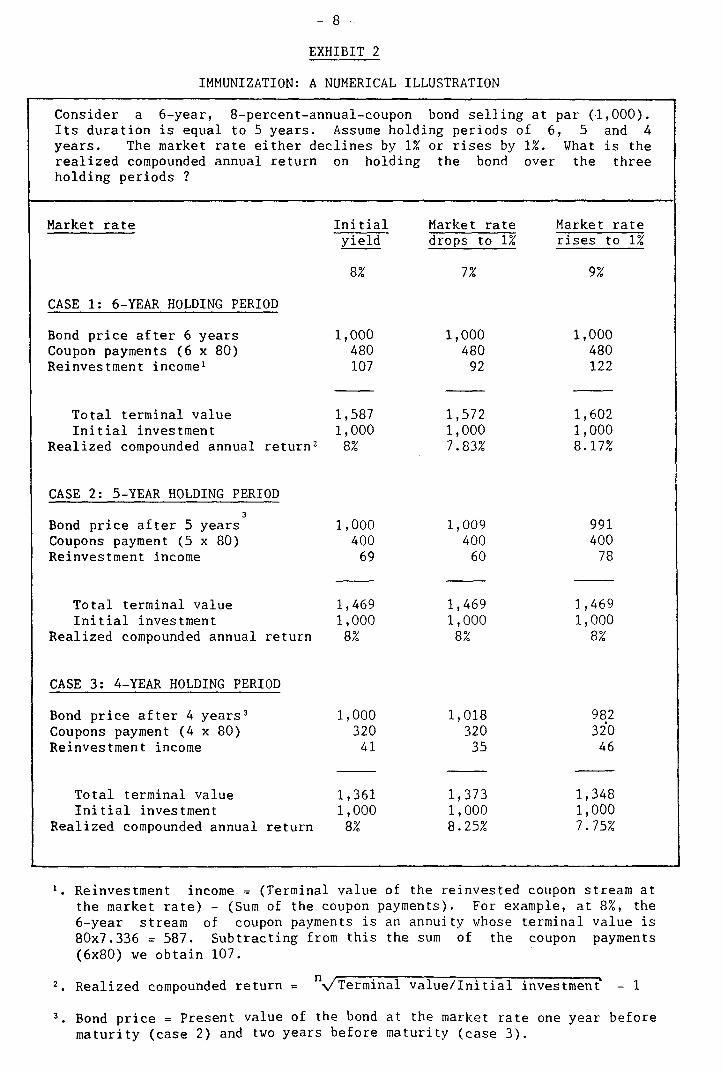
EXHIBIT 2
IMMUNIZATION: A NUMERICAL ILLUSTRATION
Consider a 6-year, 8-percent-annual-coupon bond selling at par (1,000). Its duration is equal to 5 years. Assume holding periods of 6, 5 and 4 years. The market rate either declines by 1% or rises by 1%. What is the realized compounded annual return on holding the bond over the three holding periods ?
Market rate Initial Market rate Market rate yield drops to 1% rises to 1%
CASE 1: 6-YEAR HOLDING PERIOD
8% 7% 9%
Bond price after 6 years 1,000 1,000 1,000 Coupon payments (6 x 80) 480 480 480 Reinvestment income' 107 92 122
Total terminal value 1,587 1,572 1,602 Initial investment 1,000 1,000 1,000
Realized compounded annual return' 8% 7.83% 8.17%
CASE 2: 5-YEAR HOLDING PERIOD
3
Bond price after 5 years 1,000 1,009 991 Coupons payment (5 x 80) 400 400 400 Reinvestment income 69 60 78
Total terminal value 1,469 1,469 1,469 Initial investment 1,000 1,000 1,000
Realized compounded annual return 8% 8% 8%
CASE 3: 4-YEAR HOLDING PERIOD
Bond price after 4 years' 1,000 1,018 982 Coupons payment (4 x 80) 320 320 320 Reinvestment income 41 35 46
Total terminal value 1,361 1,373 1,348 Initial investment 1,000 1,000 1,000
Realized compounded annual return 8% 8.25% 7.75%
1. Reinvestment income = (Terminal value of the reinvested coupon stream at the market rate) - (Sum of the coupon payments). For example, at 8%, the 6-year stream of coupon payments is an annuity whose terminal value is 80x7.336 = 587. Subtracting from this the sum of the coupon payments (6x80) we obtain 107.
2. Realized compounded return = n-./Terminal value/Initial investment. - 1
3. Bond price = Present value of the bond at the market rate one year before maturity (case 2) and two years before maturity (case 3).
- 9 -
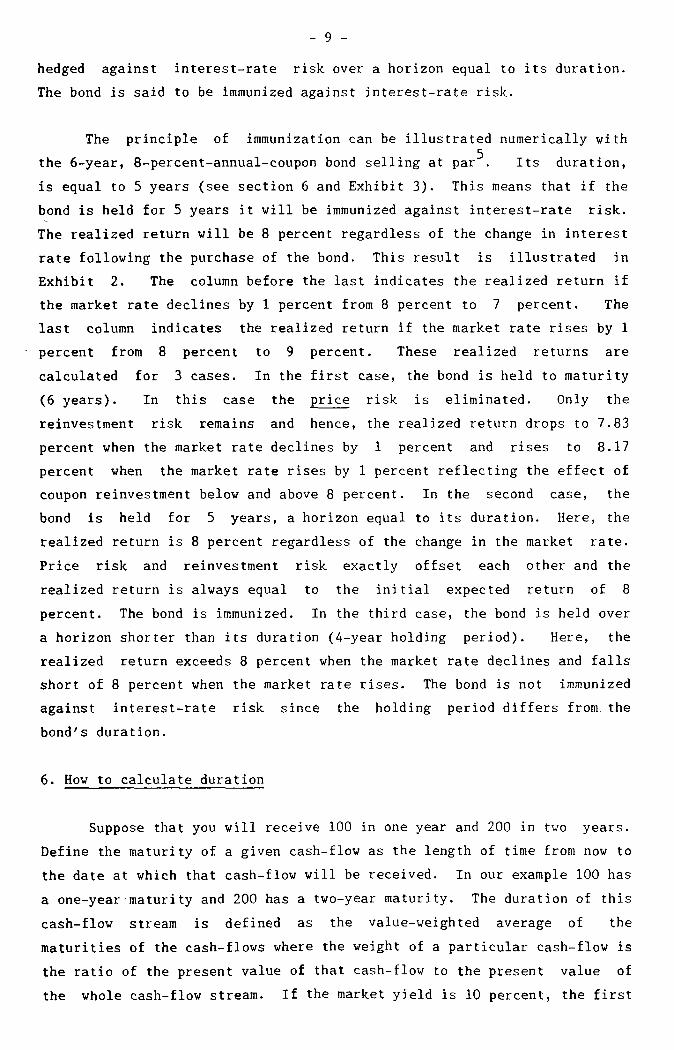
hedged against interest-rate risk over a horizon equal to its duration.
The bond is said to be immunized against interest-rate risk.
The principle of immunization can be illustrated numerically with
the 6-year, 8-percent-annual-coupon bond selling at par5. Its duration,
is equal to 5 years (see section 6 and Exhibit 3). This means that if the
bond is held for 5 years it will be immunized against interest-rate risk.
The realized return vin be 8 percent regardless of the change in interest
rate following the purchase of the bond. This result is illustrated in
Exhibit 2. The column before the last indicates the realized return if
the market rate declines by 1 percent from 8 percent to 7 percent. The
last column indicates the realized return if the market rate rises by 1
percent from 8 percent to 9 percent. These realized returns are
calculated for 3 cases. In the first case, the bond is held to maturity
(6 years). In this case the price risk is eliminated. Only the
reinvestment risk remains and hence, the realized return drops to 7.83
percent when the market rate declines by 1 percent and rises to 8.17
percent when the market rate rises by 1 percent reflecting the effect of
coupon reinvestment below and above 8 percent. In the second case, the
bond is held for 5 years, a horizon equal to its duration. Here, the
realized return is 8 percent regardless of the change in the market rate.
Price risk and reinvestment risk exactly offset each other and the
realized return is always equal to the initial expected return of 8
percent. The bond is immunized. In the third case, the bond is held over
a horizon shorter than its duration (4-year holding period). Here, the
realized return exceeds 8 percent when the market rate declines and falls
short of 8 percent when the market rate rises. The bond is not immunized
against interest-rate risk since the holding period differs from the
bond's duration.
6. How to calculate duration
Suppose that you will receive 100 in one year and 200 in two years.
Define the maturity of a given cash-flow as the length of time from now to
the date at which that cash-flow will be received. In our example 100 has
a one-year-maturity and 200 has a two-year maturity. The duration of this
cash-flow stream is defined as the value-weighted average of the
maturities of the cash-flows where the weight of a particular cash-flow is
the ratio of the present value of that cash-flow to the present value of
the whole cash-flow stream. If the market yield is 10 percent, the first
- 10 -
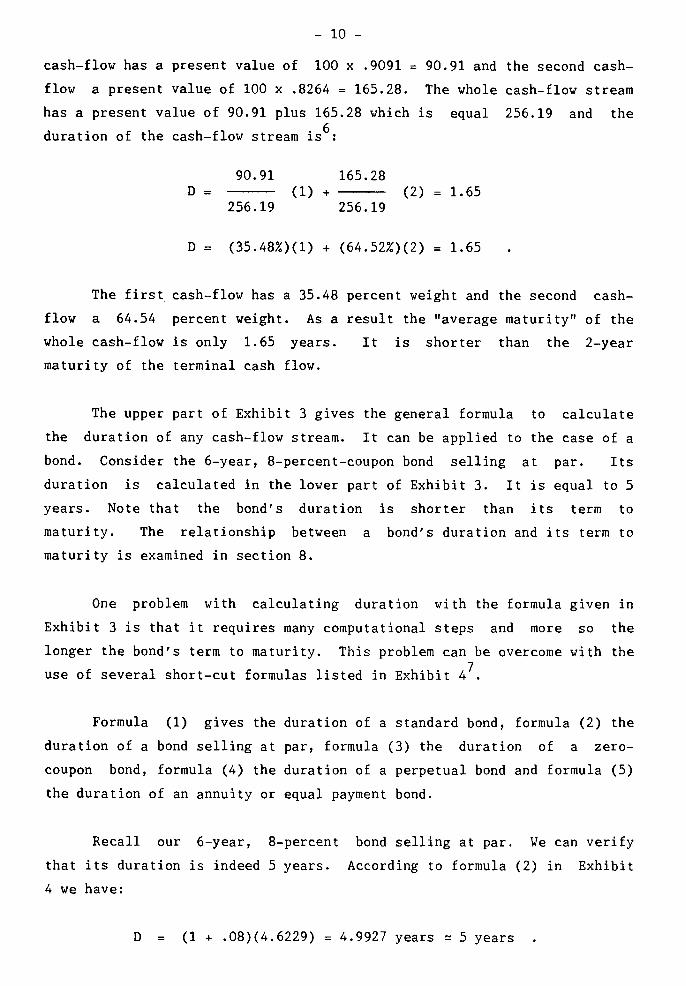
cash-flow has a present value of 100 x .9091 = 90.91 and the second cash-
flow a present value of 100 x .8264 = 165.28. The whole cash-flow stream
has a present value of 90.91 plus 165.28 which is equal 256.19 and the
duration of the cash-flow stream is6
:
90.91 165.28 D = = 1.65 (1) + (2)
256.19 256.19
D = (35.48%)(1) + (64.52%)(2) = 1.65
The first cash-flow has a 35.48 percent weight and the second cash-
flow a 64.54 percent weight. As a result the "average maturity" of the
whole cash-flow is only 1.65 years. It is shorter than the 2-year
maturity of the terminal cash flow.
The upper part of Exhibit 3 gives the general formula to calculate
the duration of any cash-flow stream. It can be applied to the case of a
bond. Consider the 6-year, 8-percent-coupon bond selling at par. Its
duration is calculated in the lover part of Exhibit 3. It is equal to 5
years. Note that the bond's duration is shorter than its term to
maturity. The relationship between a bond's duration and its term to
maturity is examined in section 8.
One problem with calculating duration with the formula given in
Exhibit 3 is that it requires many computational steps and more so the
longer the bond's term to maturity. This problem can be overcome with the
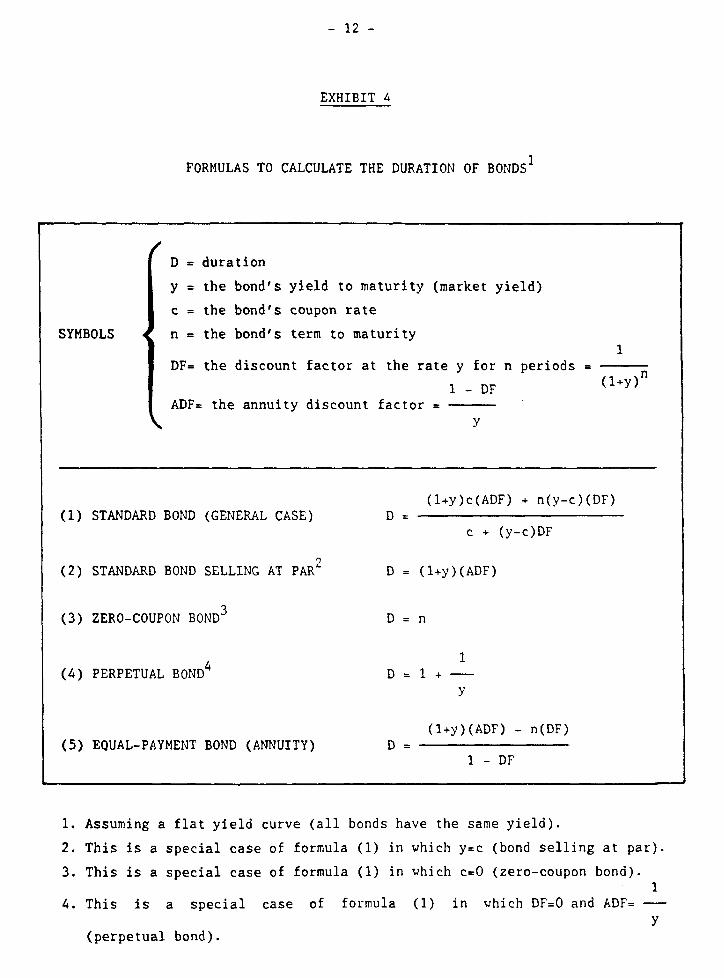
use of several short-cut formulas listed in Exhibit 47.
Formula (1) gives the duration of a standard bond, formula (2) the
duration of a bond selling at par, formula (3) the duration of a zero-
coupon bond, formula (4) the duration of a perpetual bond and formula (5)
the duration of an annuity or equal payment bond.
Recall our 6-year, 8-percent bond selling at par. We can verify
that its duration is indeed 5 years. According to formula (2) in Exhibit
4 we have:
D = (1 + .08)(4.6229) = 4.9927 years = 5 years .
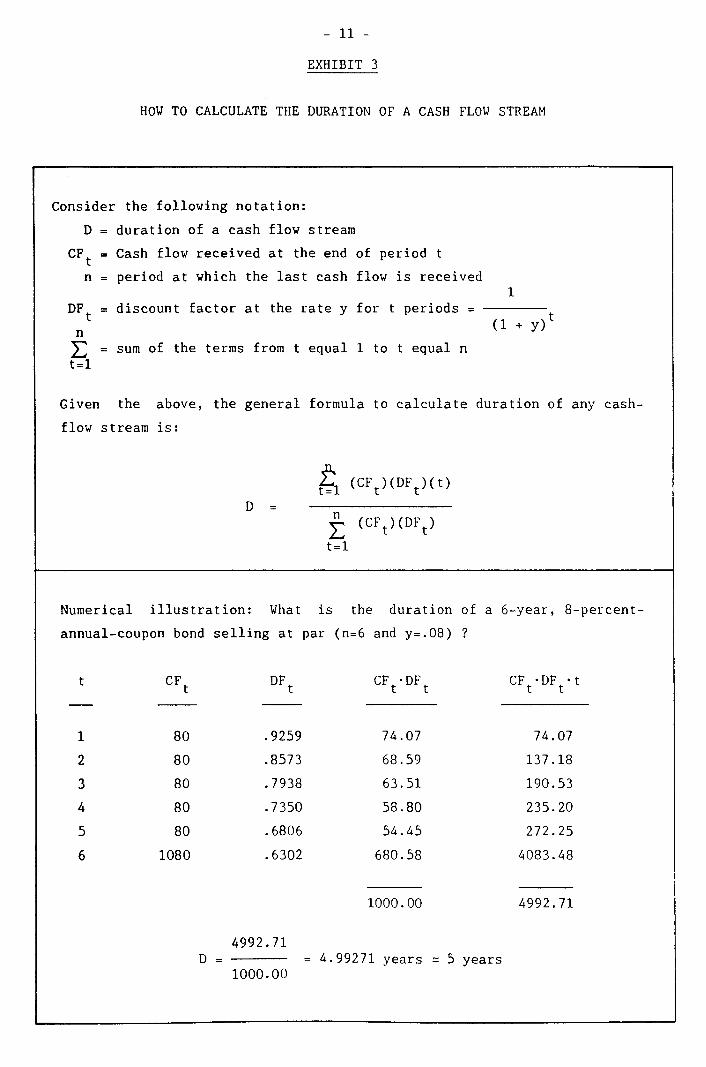
EXHIBIT 3
HOW TO CALCULATE THE DURATION OF A CASH FLOW STREAM
Consider the following notation:
D = duration of a cash flow stream
CFt = Cash flow received at the end of period t
n = period at which the last cash flow is received 1
DFt = discount factor at the rate y for t periods =
(1 + y)t
n sum of the terms from t equal 1 to t equal n
t=1
Given the above, the general formula to calculate duration of any cash-
flow stream is:
f1 (CFt)(DFt)(t) t= D=
(CFt)(DFt)
t=1
Numerical illustration: What is the duration of a 6-year, 8-percent-
annual-coupon bond selling at par (n=6 and y=.08) ?
t CFt
DFt
CFt.DF
t CF
t-DF
t.t
1 80 .9259 74.07 74.07
2 80 .8573 68.59 137.18
3 80 .7938 63.51 190.53
4 80 .7350 58.80 235.20
5 80 .6806 54.45 272.25
6 1080 .6302 680.58 4083.48
1000.00 4992.71
4992.71 D = 4.99271 5 years = years =
1000.00
DF= the discount factor at the rate y for n periods (1+y)n
1 - DF
- 12 -
EXHIBIT 4
FORMULAS TO CALCULATE THE DURATION OF BONDS1
D = duration
y = the bond's yield to maturity (market yield)
c = the bond's coupon rate
SYMBOLS n = the bond's terni to maturity 1
ADF= the annuity discount factor y
(1+y)c(ADF) + n(y-c)(DF) (1) STANDARD BOND (GENERAL CASE) D =
c + (y-c)DF
(2) STANDARD BOND SELLING AT PAR2 D = (1+y)(ADF)
(3) ZERO-COUPON BONDS D = n
1 (4) PERPETUAL BOND4 D = 1 + -
Y
(1+y)(ADF) - n(DF) (5) EQUAL-PAYMENT BOND (ANNUITY) D =
1 - DF
1. Assuming a flat yield curve (ail bonds have the same yield).
2. This is a special case of formula (1) in which y=c (bond selling at par).
3. This is a special case of formula (1) in which c=0 (zero-coupon bond). 1
4. This is a special case of formula (1) in which DF=O and ADF= -
y (perpetual bond).
- 13 -
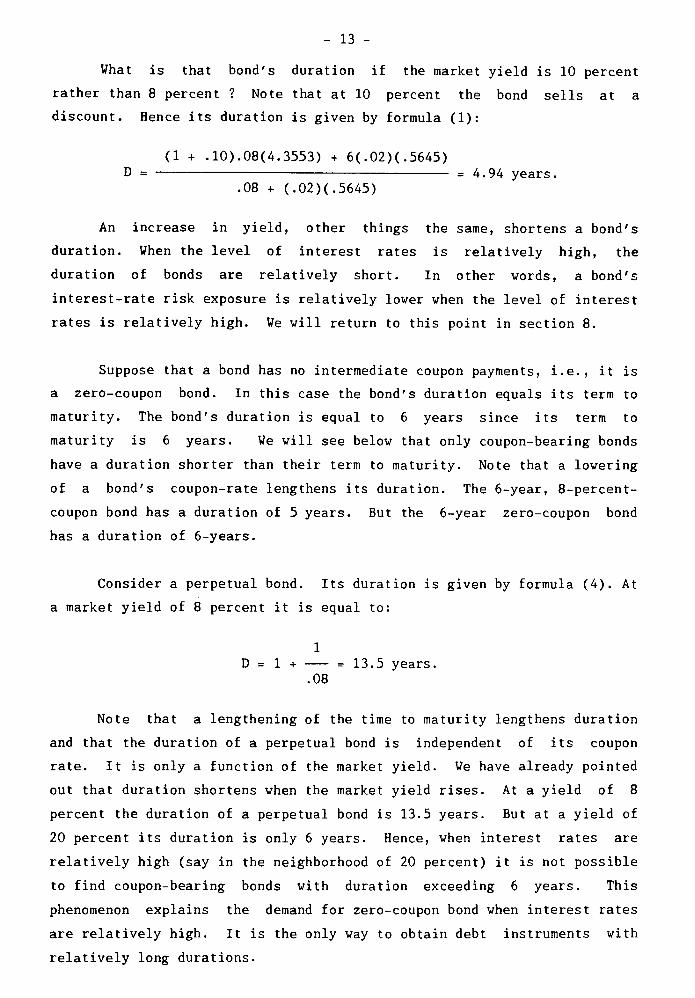
What is that bond's duration if the market yield is 10 percent
rather than 8 percent ? Note that at 10 percent the bond sells at a
discount. Hence its duration is given by formula (1):
(1 + .10).08(4.3553) + 6(.02)(.5645) D = = 4.94 years.
.08 + (.02)(.5645)
An increase in yield, other things the same, shortens a bond's
duration. When the level of interest rates is relatively high, the
duration of bonds are relatively short. In other words, a bond's
interest-rate risk exposure is relatively lover when the level of interest
rates is relatively high. We will return to this point in section 8.
Suppose that a bond has no intermediate coupon payments, i.e., it is
a zero-coupon bond. In this case the bond's duration equals its term to
maturity. The bond's duration is equal to 6 years since its term to
maturity is 6 years. We will see below that only coupon-bearing bonds
have a duration shorter than their term to maturity. Note that a lowering
of a bond's coupon-rate lengthens its duration. The 6-year, 8-percent-
coupon bond has a duration of 5 years. But the 6-year zero-coupon bond
has a duration of 6-years.
Consider a perpetual bond. Its duration is given by formula (4). At
a market yield of 8 percent it is equal to:
1 D = 1 + --- = 13.5 years.
.08
Note that a lengthening of the time to maturity lengthens duration
and that the duration of a perpetual bond is independent of its coupon
rate. It is only a function of the market yield. We have already pointed
out that duration shortens when the market yield rises. At a yield of 8
percent the duration of a perpetual bond is 13.5 years. But at a yield of
20 percent its duration is only 6 years. Hence, when interest rates are
relatively high (say in the neighborhood of 20 percent) it is not possible
to find coupon-bearing bonds with duration exceeding 6 years. This
phenomenon explains the demand for zero-coupon bond when interest rates
are relatively high. It is the only way to obtain debt instruments with
relatively long durations.
- 14 -
Finally, consider a 6-year equal-payment bond (a 6-year annuity).
Its duration is given by formula (5). At a market yield of 8 percent it
is equal to:
(1.08)(4.623) - 6(.630) D =
= 3.29 years. 1 - .630
As in the case of a perpetual bond, the duration of an equal-payment
bond is independent of its coupon rate. It is only a function of the
market yield and the term to maturity. Note that the equal-payment bond
has a shorter duration than the standard bond.8
7. Why is the duration of a coupon-bearing bond shorter than its maturity?
A duration shorter than maturity reflects the fact that bondholders
will get cash inflows (in the form of coupon payments) long before the
bond matures. As a matter of fact, the faster bondholders recover part of
their initial investment (via coupon payments) the shorter the bond's
duration relative to its maturity. Hence, duration is a measure of a
bond's value-weighted average maturity, i.e., a measure of its "longness"
that takes into account both the timing and the size of the bond's future
cash inflows.
If the bond does not have any intermediate coupon payments (a zero-
coupon bond) its duration equals its maturity. In this case, the bond's
value-weighted maturity is equal to the bond's term to maturity. If the
bond has relatively large intermediate payments (the extreme case is that
of the equal-payment bond) its duration will be shorter than its maturity.
8. What are the determinants of duration and the exposure to interest-rate
risk ?
The duration of a standard bond, and hence its exposure to interest-
rate risk, is a function of three parameters:
(1) the bond's term to maturity
(2) the bond's coupon rate, and
(3) the bond's yield to maturity (market yield).
= ri
duration
13.50
10.60
D = 1 +
7.15
4.31
10 13.50
term to
"0"-11 20
- 15 -
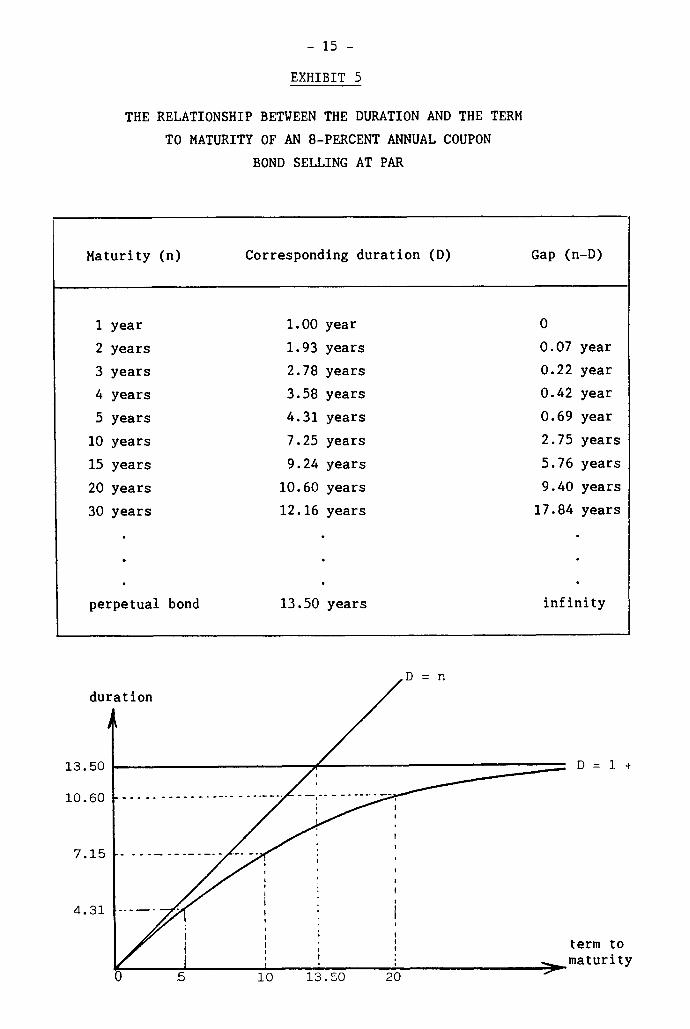
EXHIBIT 5
THE RELATIONSHIP BETWEEN THE DURATION AND THE TERM
TO MATURITY OF AN 8-PERCENT ANNUAL COUPON
BOND SELLING AT PAR
Maturity (n) Corresponding duration (D) Gap (n-D)
1 year 1.00 year 0
2 years 1.93 years 0.07 year
3 years 2.78 years 0.22 year
4 years 3.58 years 0.42 year
5 years 4.31 years 0.69 year
10 years 7.25 years 2.75 years
15 years 9.24 years 5.76 years
20 years 10.60 years 9.40 years
30 years 12.16 years 17.84 years
perpetual bond 13.50 years infinity
- 16 -
Together these three parameters determine the bondis duration
according to formula (1) in Exhibit 4. Let's examine the way each one of
them affect duration.
Maturity effect
Recall our earlier observation. The duration of a coupon-bearing
bond is shorter than its maturity. Only zero-coupon bonds have durations
equal to their maturity. What is the relationship between maturity and
duration ? Let's take an example. Consider the 8 percent annual coupon
bond selling at par. Exhibit 5 illustrates the relationship between this
bond's duration and its term to maturity.
Duration increases with maturity but at a comparatively smaller
rate. As maturity approaches infinity, duration approaches the limit (1 +
1/y) which is equal to 13.5 years when the yield is 8 percent. This is
the duration of an 8-percent perpetual bond. This relationship is
represented graphically in the lover part of Exhibit 5. The gap between
years to maturity and duration widens as maturity grows longer9. The
reason for this widening gap between maturity and duration is that the
more distant coupon payments of longer term bonds contribute very little
to these bond's present values.
Coupon effect
Recall our earlier observation. The higher a bond's coupon rate the
shorter its duration. This result follows directly from our discussion in
section 7. The holder of a high-coupon bond will recover part of his
initial investment faster. Hence, the shorter duration or "average"
maturity. Note that, in general, changes in coupon rates do not affect
duration as strongly as changes in maturity
Yield effect
We have already pointed out that everything else the same, the
higher a bond's yield to maturity, i.e., the higher is the level of
interest rates prevailing in the market, the shorter the bond's duration.
The yield effect is similar to the coupon effect. A higher yield means a
faster fractional recovery of initial investment because the present value
of future coupon payments is larger the higher the market yield (discount
rate).
The implication of the above results is important. Let us
summarize. The duration of a bond is a measure of its exposure to
- 17 -
interest-rate risk. Hence, A BOND'S EXPOSURE TO INTEREST-RATE RISK (WHICH
CAN BE MEASURED BY ITS DURATION) IS HIGHER THE LONGER ITS MATURITY, THE
LOVER ITS COUPON RATE AND THE LOVER THE GENERAL LEVEL OF INTEREST RATES.
9. The duration of a portfolio of bonds
The duration of a portfolio of bonds can be calculated according to
the general formula given in Exhibit 3. Rather than calculate the
duration of the cash-flow stream of one bond, we must calculate the dura-
tion of the cash-flow stream of a portfolio of bonds. Hence, the first
step in calculating the duration of a bond's portfolio is to identify the
portfolio's cash-flow stream.
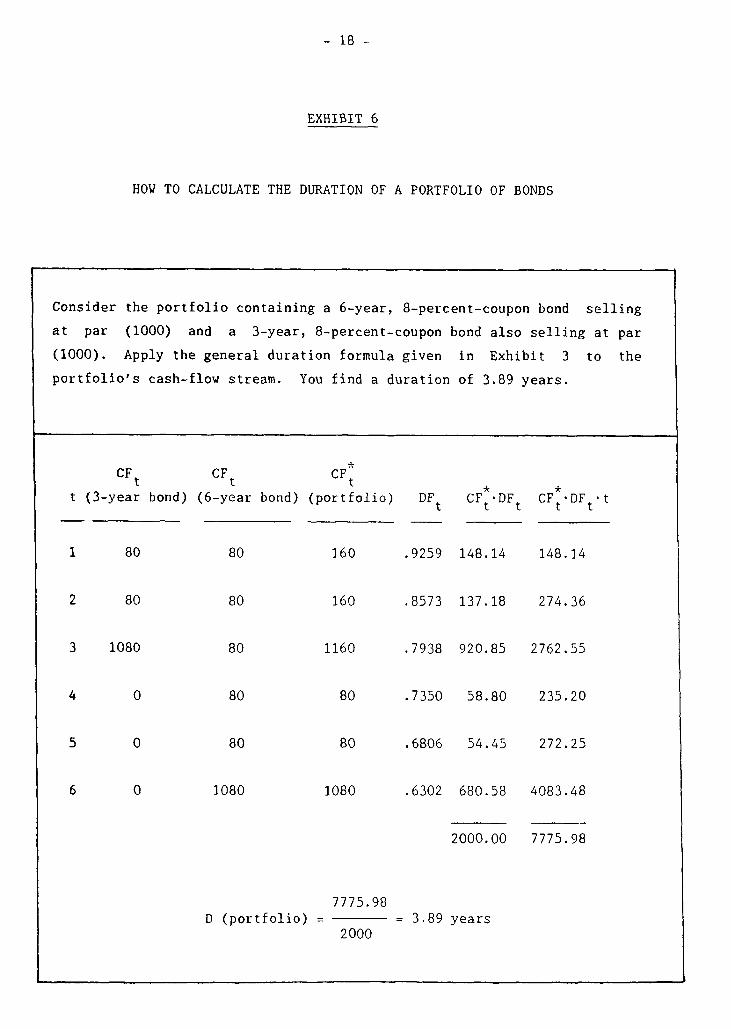
Consider a portfolio containing two bonds. The 6-year, 8-percent-
coupon bond selling at par (1000) and a 3-year, 8-percent-coupon bond also
selling at par (1000). The duration of this bond portfolio is calculated
in Exhibit 6 given the future cash-flow stream of the portfolio. It is
equal to 3.89 years.
If the yield curve is flat, i.e., if the yield on bonds is the same
for all maturities, then the duration of a portfolio of bonds is equal to
the value-weighted average of the duration of the bonds that make up the
portfolio. This is the case of the two bonds in our portfolio. They both
have an 8-percent yield. Hence, the yield curve is flat in this case.
The 6-year bond has a 5-year duration. The 3-year bond has a 2.78 year
duration (see Exhibit 5). The duration of the portfolio can thus be
computed as follows:
1000 1000 D = (5) + (2.78) = 3.89 years,
2000 2000
which is exactly the same duration as the one found in Exhibit 6 by
applying the general formula. But the calculation of the portfolio's
duration as the value-weighted average of the duration of the bonds that
make up that portfolio is only correct when the yield curve is flat10.
If the yield curve is not flat, taking the average duration of the
bonds in a portfolio will only give an approximate value of the
portfolio's duration.
- 18 -
EXHIBIT 6
HOW TO CALCULATE THE DURATION OF A PORTFOLIO OF BONDS
Consider the portfolio containing a 6-year, 8-percent-coupon bond selling
at par (1000) and a 3-year, 8-percent-coupon bond also selling at par
(1000). Apply the general duration formula given in Exhibit 3 to the
portfolio's cash-flow stream. You find a duration of 3.89 years.
CFt
t (3-year bond)
CFt
CFt
(6-year bond) (portfolio) *
DFt
CFt.DF
t
* CF
t.DF
t-t
1 80 80 160 .9259 148.14 148.14
2 80 80 160 .8573 137.18 274.36
3 1080 80 1160 .7938 920.85 2762.55
4 0 80 80 .7350 58.80 235.20
5 0 80 80 .6806 54.45 272.25
6 0 1080 1080 .6302 680.58 4083.48
2000.00 7775.98
7775.98 D (portfolio) _ - 3.89 years
2000
- 19 -
Note that since a portfolio of bonds has a measurable duration, two
portfolios with the same duration must have the same exposure to interest-
rate risk even if their composition differs significantly. Another way of
looking at this result is that a portfolio's exposure to interest-rate
risk can be managed by modifying its duration via portfolio rebalancing.
This is examined in the next section in the context of immunization
strategies.
10. How to implement an immunization strategy
The duration given by formula (1) in Exhibit 4 is known as
Macaulay's11
duration. It is the simplest of many duration formulas. But
it is based on a restrictive assumption. It assumes that the yield curve
is flat, i.e., that the yield on bonds is independent of their maturity.
In general, however, the yield curve is rising. Sometimes, it is
declining. When we use Macaulay's duration for bond immunization, the
assumption is that the flat yield curve changes in a parallel fashion
immediately after the bond is purchased. This is what we called
"conventional" immunization in section 4. In this section we conclude
with an illustration of how one can implement a conventional immunization
strategy. In Appendix Two we review some of the alternative measures of
duration which do not assume a flat yield curve that changes in a parallel
fashion.
But using Macaulay's duration to implement immunization raises an
important question. How do conventional immunization strategies, based on
Macaulay's duration, compare with strategies that use more complex
measures of duration ? Most empirical studies indicate that immunization
strategies based on Macaulay's duration perform at least as well as more
sophisticated riyals12. They also outperform maturity-based strategies
13
Hence, in practice most immunization strategies are based on Macaulay's
duration. In what follows we explain how this is done.
To show how conventional immunization strategy is implemented go
back to the numerical illustration of portfolio duration given in the
previous section. Suppose that a portfolio manager has a planning horizon
of 3.89 years over which he wants a guaranteed return of at least 8
percent. Assume that only two kinds of bonds are available for
investment: 6-year, 8-percent coupon bonds and 3-year, 8-percent coupon
bonds. An immunization strategy requires the construction of a bond
- 20 -
portfolio with an average yield of 8 percent and a duration equal to the
manager's planning horizon, i.e., a duration equal to 3.89 years. This is
exactly the portfolio described in the previous section which contains an
equal amount of 6-year and 3-year bonds14.
In order to achieve continuai immunization, the portfolio duration
must be kept equal to the remainder of the 3.89-year planning horizon.
But the passage of time will create a mismatch between the duration of the
portfolio and the remainder of the planning horizon. To see this, suppose
that one year has passed and that the market yield is 8 percent15. The
remainder of the planning horizon is 2.89 years (the original 3.89 years
less one year) and the bonds in the portfolio are now 5-year and 2-year
bonds with durations of 4.31 years and 1.93 years, respectively (see
Exhibit 5). As a result, the duration of the bond portfolio one year
after its original construction is equal to:
1000 1000 D = (4.31) + (1.91) = 3.11 years.
2000 2000
The planning horizon went from 3.89 years to 2.89 years but the
portfolio duration went from 3.89 years to 3.11 years. This, of course,
is a manifestation of the phenomenon illustrated in Exhibit 5: as the
targeted date approaches, the durations of the component bonds get shorter
but at a slower rate than the passage of time. As a consequence, one year
after its initial construction the portfolio is no longer immunized. To
re-immunize it, it must be rebalanced so as to bring its duration from
3.11 years down to 2.89 years (the remainder of the planning horizon).
This can be done by reinvesting the portfolio's first-year cash inflow
(160 of coupon payments) in the bond with the shortest duration (the 2-
year bond). This will shorten the portfolio duration to16:
1000 1160 D = (4.31) + (1.91) = 3.02 years.
2160 2160
The reinvestment of coupon payments is not sufficient to bring the
portfolio's duration down to 2.89 years. In this case some 5-year bonds
must be sold and the proceed used to purchase 2-year bonds17. The
following year, a similar rebalancing must be carried out so that the
resulting portfolio has a duration of 1.89 years, and so on until the
targeted date is reached. The strategy is to keep the duration of the
portfolio always equal to the length of time until the original targeted
- 21 -
horizon is attained18. By following this duration-matching strategy the
portfolio will be immunized against small changes in interest rates.
However, if the yield curve is not flat and if interest-rate fluctuations
are large, interest-rate risk will not be eliminated but it should be
greatly reduced.
999.53785 - 1000 8 [
10 00 CX = 10
1000.46243 - 1000]
1000 - 28 .
1000
- 22 -
APPENDIX ONE
BOND CONVEXITY AND ITS RELATIONSHIP
TO BOND DURATION
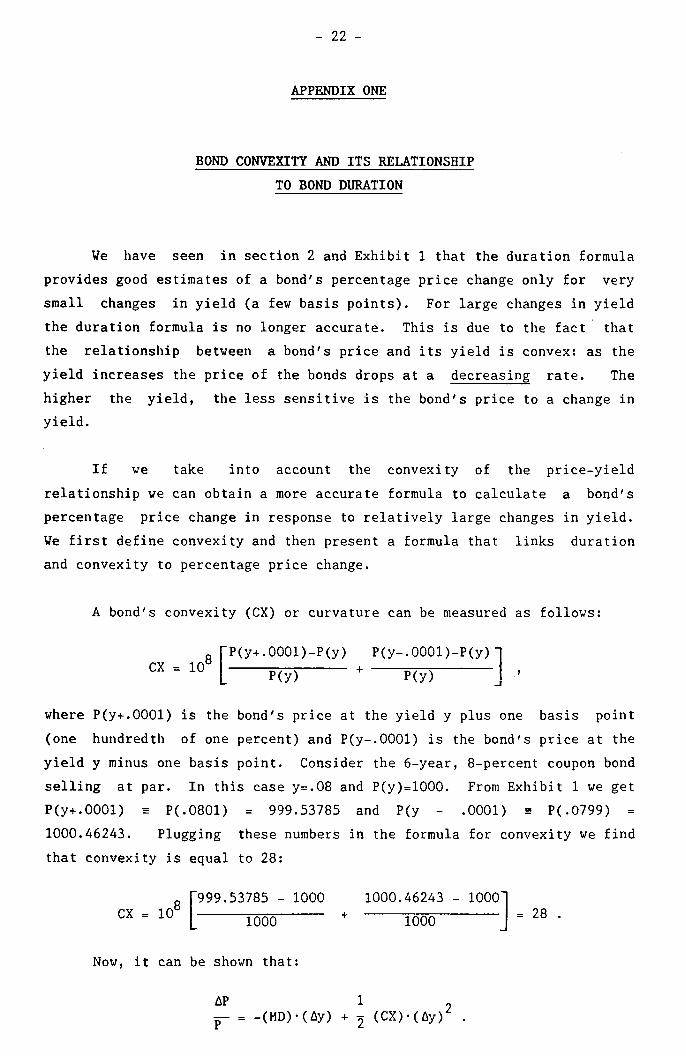
We have seen in section 2 and Exhibit 1 that the duration formula
provides good estimates of a bond's percentage price change only for very
small changes in yield (a few basis points). For large changes in yield
the duration formula is no longer accurate. This is due to the fact that
the relationship between a bond's price and its yield is convex: as the
yield increases the price of the bonds drops at a decreasing rate. The
higher the yield, the less sensitive is the bond's price to a change in
yield.
If we take into account the convexity of the price-yield
relationship we can obtain a more accurate formula to calculate a bond's
percentage price change in response to relatively large changes in yield.
We first define convexity and then present a formula that links duration
and convexity to percentage price change.
A bond's convexity (CX) or curvature can be measured as follows:
8 [P(y+.0001)-P(y) P(y-.0001)-P(y) 1 , CX = 10
P(y) P(Y)
where P(y+.0001) is the bond's price at the yield y plus one basis point
(one hundredth of one percent) and P(y-.0001) is the bond's price at the
yield y minus one basis point. Consider the 6-year, 8-percent coupon bond
selling at par. In this case y=.08 and P(y)=1000. From Exhibit 1 we get
P(y+.0001) E P(.0801) = 999.53785 and P(y - .0001) E P(.0799) =
1000.46243. Plugging these numbers in the formula for convexity we find
that convexity is equal to 28:
Now, it can be shown that:
AP 1
P= -(MD).(Ay) + (CX).(Ay)2 .
- 23 -
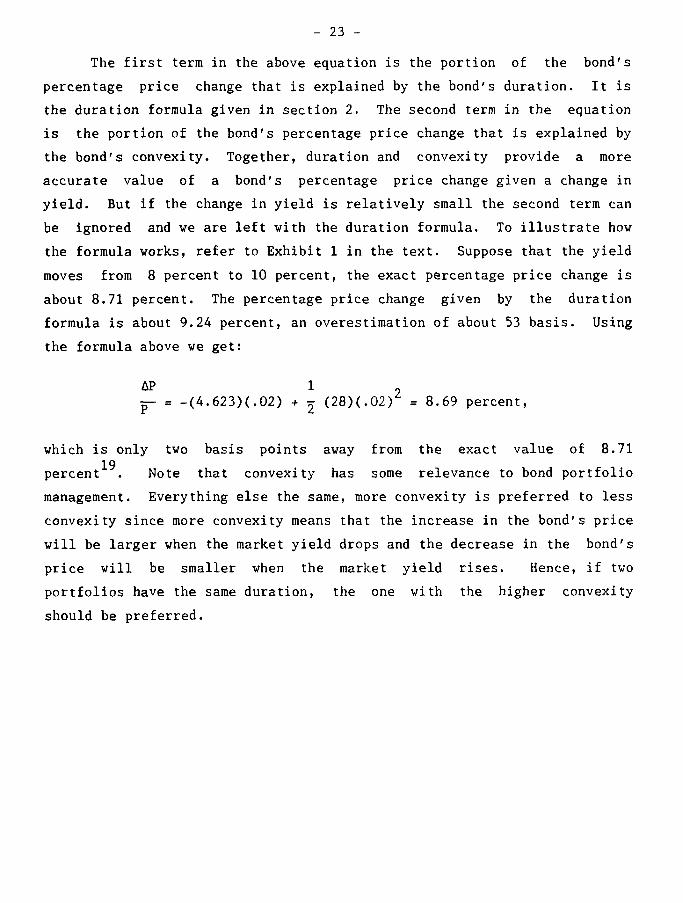
The first term in the above equation is the portion of the bond's
percentage price change that is explained by the bond's duration. It is
the duration formula given in section 2. The second term in the equation
is the portion of the bond's percentage price change that is explained by
the bond's convexity. Together, duration and convexity provide a more
accurate value of a bond's percentage price change given a change in
yield. But if the change in yield is relatively small the second term can
be ignored and we are left with the duration formula. To illustrate how
the formula works, refer to Exhibit 1 in the text. Suppose that the yield
moves from 8 percent to 10 percent, the exact percentage price change is
about 8.71 percent. The percentage price change given by the duration
formula is about 9.24 percent, an overestimation of about 53 basis. Using
the formula above we get:
1 -(4.623)(.02) + (28)(.02)
2 = 8.69 percent,
which is only two basis points away from the exact value of 8.71
percent19. Note that convexity has some relevance to bond portfolio
management. Everything else the same, more convexity is preferred to less
convexity since more convexity means that the increase in the bond's price
will be larger when the market yield drops and the decrease in the bond's
price will be smaller when the market yield rises. Hence, if two
portfolios have the same duration, the one with the higher convexity
should be preferred.
- 24 -
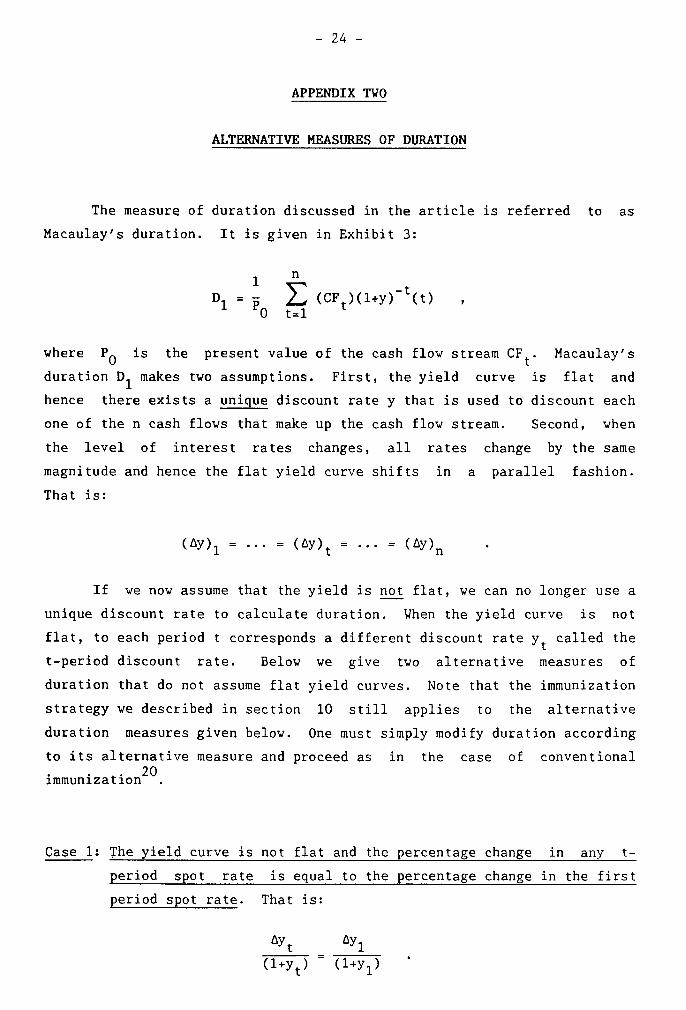
APPENDIX TWO
ALTERNATIVE MEASURES OF DURATION
The measure of duration discussed in the article is referred to as
Macaulay's duration. It is given in Exhibit 3:
1
D1 = (CF
t)(1+y)-t(t)
where P0 is the present value of the cash flow stream CF
t. Macaulay's
duration D1 makes two assumptions. First, the yield curve is flat and
hence there exists a unique discount rate y that is used to discount each
one of the n cash flows that make up the cash flow stream. Second, when
the level of interest rates changes, all rates change by the same
magnitude and hence the flat yield curve shifts in a parallel fashion.
That is:
(àY)1 = = (4k7)t = = (AY)n
If we now assume that the yield is not flat, we can no longer use a
unique discount rate to calculate duration. When the yield curve is not
flat, to each period t corresponds a different discount rate yt called the
t-period discount rate. Below we give two alternative measures of
duration that do not assume flat yield curves. Note that the immunization
strategy we described in section 10 still applies to the alternative
duration measures given below. One must simply modify duration according
to its alternative measure and proceed as in the case of conventional
immunization.
Case 1: The yield curve is not flat and the percentage change in any t-
period spot rate is equal to the percentage change in the first
period spot rate. That is:
AYt ày1
(1+yt) (1+y
1)
- 25 -
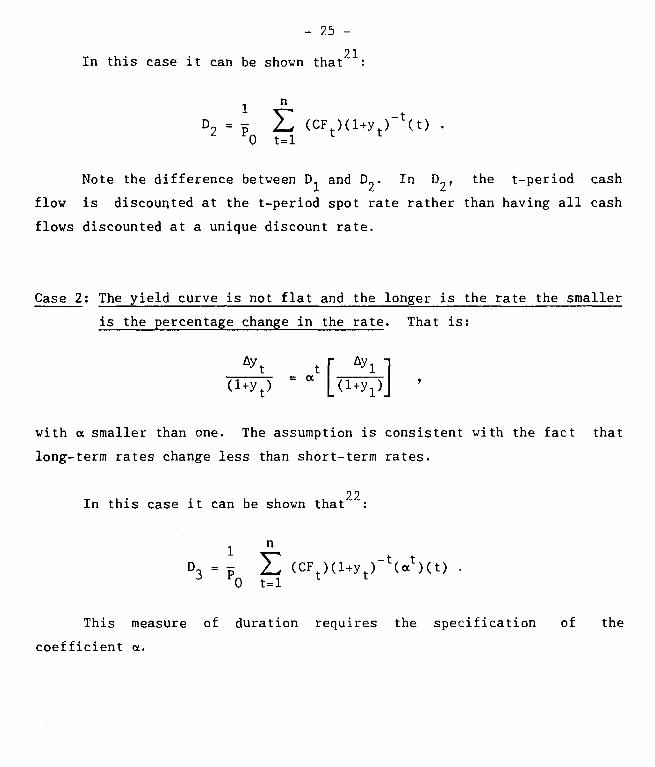
In this case it can be shown that21:
1 \--.ri D2 = Lw (CF
t)(1+y
t)-t(t) .
PO t=1
Note the difference between D1 and D
2. In D2, the t-period cash
flow is discounted at the t-period spot rate rather than having ail cash
flows discounted at a unique discount rate.
Case 2: The yield curve is not flat and the longer is the rate the smaller
is the percentage change in the rate. That is:
AYt_ a t [ Ily1 ]
(1+yt) (1+y
1)
with a smaller than one. The assumption is consistent with the fact that
long-term rates change less than short-term rates.
In this case it can be shown that22:
n 1
D3 = (CF
t)(1+y
t)-tat)(t) ( '
130 t=1
This measure of duration requires the specification of the
coefficient a.
- 26 -
Footnotes
1. Price = (coupon)(annuity discount factor) + (face)(discount factor) Price (8'h% and 6 years) = (80)(4.554) + (100)(.6129) = 97.72.
2. Note that the percentage change in the price of the bond is not symmetrical. A 'h percentage increase in the yield is associated with a 2.28 percent drop in price but a percentage decrease in yield is associated with a 2.35 percent rise in price. This phenomenon is due to the fact that the relationship between a bond's price and its yield is convex rather than linear. See section 2 and Appendix One for details.
3. This statement assumes a flat yield curve (i.e., the market yield of ail bonds is the same regardless of their term to maturity) and parallel shifts in the yield curve (i.e., the change in yield is the same for ail bonds regardless of their term to maturity). See section 3 and Appendix Two.
4. See, for example, Hawawini (1982) for proof.
5. See McEnally (1980) for a similar example.
6. Note that duration is calculated by discounting the first and the second cash flows at the same rate of 10 percent. This is what is meant by a "flat yield curve assumption". If the yield were rising or declining we would have discounted the two cash flows at différent rates as specified by the shape of the yield curve. See Appendix Two.
7. Proofs of these formulas are given in Hawawini (1984) and (1987). The original duration formula was established by Macaulay (1936). Most of the early papers describing the development of duration are reproduced in Hawawini (1982) including Macaulay's contribution. Recent developments are found in Hawawini (1982) and Bierwag et al. (1983 a,b).
8. The concept of duration as a measure of interest-rate risk exposure can be extended to financial instruments other than "straight" bonds. It has been applied to equity, options as well as bonds with options features such as callable bonds. See the articles in Platt (1986).
9. The curve at the lover part of Exhibit 5 illustrates the case of a bond selling at par. A similar curve applies to bond's selling at a premium but not for bonds selling at a deep discount. For these bonds, the curve may intersect the D . (1+1/i) line and then converge towards that line. In other words, for some bonds selling at a deep discount, duration and maturity may be inversely related over some maturity range. See Hawawini (1982, 1984).
10. When the yield curve is flat, the yield to maturity of ail bonds in the portfolio is the same and hence the portfolio's yield is equal to that of the bonds in the portfolio, and the portfolio's duration is a weighted average of the bond's duration.
11. See Macaulay (1936), Chapter III
- 27 -
12. See the articles in Bierwag et al. (1983 a) and the article by Schaeffer (1984).
13. See Bierwag et al. (1987)
14. The number of bonds one must buy today in order to achieve immunization depends on the dollar amount one wishes to have at the end of the 3.89-year horizon. Suppose that the portfolio manager has a liability of $1,000,000 due in 3.89 years. How many bonds should he.buy today to achieve immunization ? The present value of the liability at 8 percent is $741,068. Hence $370,534 worth of 6-year bonds and $370,534 worth of 3-year bonds must be purchased (equal to allocation in order to get a 3.89-year duration for the portfolio). Since the bonds sell for $1,000 a unit, we need about 371 bonds of each maturity.
15. For the sake of exposition and to facilitate the calculations we assume that the market yield is still at 8 percent. But the conclusions are the same if the yield changes.
16. We assume that we can buy and sell a fraction of a bond.
17. How much of the 5-year bond must be sold to bring duration down to 2.89 years ? It is the amount x that solves the equation:
1000 - x 1160 + x
D = 2160 (4.31) +
2160 (1.91) = 2.89 .
It is equal to 118, i.e. $118 worth of 5-year bonds must be sold and an equal amount of 2-year bonds purchased.
18. Note that the frequency of portfolio rebalancing can be increased. For example, rebalancing every 6 months instead of every year. But frequent portfolio rebalancing will raise transaction costs. There is a trade-off between the cost of frequent rebalancing and the benefit of frequent duration matching.
19. For additional information see Klotz (1985).
20. The immunization strategies discussed in this article are known as one-factor immunization models. There are also so-called two-factor models. In the former case, the change in yield is determined by a single factor (e.g., long-term rate). In the latter, it is determined by two factors (e.g., the short-term and the long-term rates). Two-factor models do not seem to outperform one-factor models. See Schaeffer (1984).
21. See Elton and Gruber (1984), Chapter 19.
22. See Elton and Gruber (1984), Chapter 19.
- 28 -
REFERENCES
BIERWAG, G.O., KAUFMAN, G.G., LATTA, C.M. and ROBERTS, G.S. (1987): "The
Usefulness of Duration: Response to Critics", Journal of Portfolio
Management, 13 (Winter), 48-52.
BIERWAG, G.O., KAUFMAN, G.G., and TOEVS, A.,(Eds.) (1983a): Innovations in
Bond Portfolio Management: Duration Analysis and Immunization,
Greenwhich, CT : JAI Press.
BIERWAG, G.O., KAUFMAN, G.G., and TOEVS, A., (1983b) : "Duration: Its
Development and Use in Bond Portfolio Management", Financial Analysts
Journal (July/August), 15-35.
ELTON, E. and GRUBER, M. (1984): Portfolio Analysis and Investment
Management, John Wiley.
HAWAWINI, G.A. (1982): Bond Duration and Immunization: Early Developments
and Recent Contributions, New York and London: Garland Publishing
Company.
HAWAWINI, G.A. (1984): "On the Relationship Between Macaulay's Bond
Duration and the Term to Maturity", Economics Letters, 16, 331-337.
HAWAWINI, G.A. (1987): "Discreet Pricing of Deep Discount Bonds",
Unpublished manuscript.
KLOTZ, R.G. (1985): Convexity of Fixed-Income Securities, Salomon Brothers
Inc., (October).
MACAULAY, F.R. (1938): Some Theoretical Problems Suggested by the
Movements of Interest Rates, Bond Yields, and Stock Prices in the U.S.
since 1856, National Bureau of Economic Research, New York : Columbia
University Press.
McENALLY, R.W. (1980): "How to Neutralize Reinvestment Rate Risk", Journal
of Portfolio Management, (Spring), 59-63.
- 29 -
PLATT, R.B. (1986): Controlling Interest Rate Risk, John Wiley.
SCHAEFFER, S. (1984): "Immunization and Duration: A Review of Theory,
Performance and Applications", Midland Corporate Finance Journal, 2,
(Fall), 41-.58.
INSEAD WORKING PAPERS SÉRIES 85/17 Manfred F.R. KETS DE VRIES and Danny MILLER
1985 85/18 Manfred F.R. KETS
DE VRIES 85/01 Jean DERMINE
85/19 Manfred F.R. KETS DE VRIES and Dany MILLER
"The measurement of interest rate risk by financial intermediaries", December 1983, Revised December 1984.
"Personality, culture and organisation".
"The darker aide of entrepreneurship".
"Narcissism and leadership: an object relations perspective".
85/02 Philippe A. NAERT and Els GIJSBRECHTS "Interpreting organizational tests".
"Diffusion modal for nev product introduction in existing markets" .
85/03 Philippe A. NAERT and Els GIJSBRECHTS
85/20 Manfred F.R. KETS DE VRIES and Dany MILLER
"Nationalization, compensation and vealth transfers: France 1981-1982" 1, Final version July 1985. 85/04 Philippe A. NAERT
and Marcel WEVERBERGH
"Tovards a decision support system for hierarchically allocating marketing resources arrosa and vithin product groupa" . "Market share specification, estimation and validation: tovards reconciling seemingly divergent vievs" .
85/21 Herwig M. LANGOHR and Claude J. VIALLET
"Takeover premiums, disclosure regulations, and the market for corporate control. A comparative analysis of public tender offers, controlling-block trades and minority buyout in France", July 1985.
85/22 Herwig M. LANGOHR and B. Espen ECKBO
85/05 Ahmet AYKAC, Marcel CORSTJENS, David GAUTSCHI and Ira HOROWITZ
"Estimation uncertainty and optimal advertising decisions", Second draft, April 1985.
85/06 Kasra FERDOWS 85/23 Manfred F.R. KETS DE
VRIES and Dany MILLER "Barriers to adaptation: personal, cultural and organizational perspectives". "The shifting paradigms of manufacturing:
inventory, quality and nov versatility", March 1985. "The art and science of forecasting: an
assessment and future directions". 85/07 Kasra FERDOWS,
Jeffrey G. MILLER, Jinchiro NAKANE and Thomas E.VOLLMANN.
"Evolving manufacturing strategies in Europe, Japan and North-America" "Financial innovation and recent developments
in the French capital markets", October 1985.
85/08 Spyros MAKRIDAKIS and Robert CARBONE
85/24 Spyros MAKRIDAKIS
85/25 Gabriel HAWAWINI
85/26 Karel O. COOL and Dan E. SCHENDEL
"Patterns of competition, strategic group formation and the performance case of the US pharmaceutical industry, 1963-1982", October 1985.
85/09 Spyros MAKRIDAKIS and Robert CARBONE 85/27 Arnoud DE MEYER
"Forecasting vhen pattern changes occur beyond the historical data" , April 1985.
"Sampling distribution of post-sample forecasting errors" , February 1985. "European manufacturing: a comparative study
(1985)". 85/10 Jean DERMINE °Portfolio optimisation by financial
intermediaries in an asset pricing modal". 1986
86/01
86/02
"The R & D/Production interface".
"Subjective estimation in integrating communication budget and allocation decisions: a case study", January 1986.
85/13 Arnoud DE MEYER
85/12 Arnoud DE MEYER
85/11 Antonio M. BORGES and "Energy demand in Portuguese manufacturing: a Alfredo M. PEREIRA tvo-stage modal".
"Large European manufacturera and the management of R & D".
"Defining a manufacturing strategy - a survey of European manufacturera".
86/03 Michael BRIMM
Arnoud DE MEYER
Philippe A. NAERT Marcel WEVERBERGH and Guido VERSWIJVEL
"Sponsorship and the diffusion of organizational innovation: a preliminary viev".
"Confidence intervals: an empirical investigation for the series in the M-Competition" .
86/04 Spyros MAKRIDAKIS and Michèle HIBON
85/14 Ahmet AYKAC, Marcel CORSTJENS, David GAUTSCHI and Douglas L. MacLACHLAN
"The advertising-sales relationship in the U.S. cigarette industry: a comparison of correlational and causality testing approaches".
85/15 Arnoud DE MEYER and Roland VAN DIERDONCK
86/05 Charles A. WYPLOSZ "Organizing a technology jump or overcoming the technological hurdlee.
"A note on the reduction of the vorkveek", July 1985.
85/16 Hervig M. LANGOHR and Antony N. SANTONERO
"Commercial bank refinancing and economic stability: an analyste of European features".
"Seasonality in the risk-return relationships some international evidence", July 1986.
86/06 Francesco GIAVAZZI, Jeff R. SHEEN and Charles A. WYPLOSZ
86/22 Albert CORHAY, Gabriel A. HAVAVINI and Pierre A. MICHEL
"The real exchange rate and the fiscal aspects of a natural resource discovery", Revised version: February 1986.
86/07 Douglas L. MacLACHLAN and Spyros MAKRIDAKIS
86/23 Arnoud DE MEYER "Judgmental bisses in sales forecasting", February 1986.
"An exploratory study on the integration of information systems in manufacturing", July 1986.
"A methodology for specification and aggregation in product concept testing", July 1986.
86/08 José de la TORRE and David H. NECKAR
"Forecasting political risks for international operations", Second Draft: March 3, 1986.
in of the 1986.
86/09 Philippe C. HASPESLAGH "Protection", August 1986.
"Conceptualizing the strategic process diversified firms: the role and nature corporate influence process", February
86/24 David GAUTSCHI and Vithala R. RAO
86/25 H. Peter GRAY and Ingo WALTER
86/26 Barry EICHENGREEN and Charles WYPLOSZ
86/27 Karel COOL
"The economic consequences of the Franc Poincare", September 1986.
86/10 R. MOENART, Arnoud DE MEYER, J. BARBE and D. DESCHOOLMEESTER.
"Analysing the issues concerning technological de -maturity".
and Ingemar DIERICKX "Negative risk-return relationships in business strategy: paradox or truism?", October 1986. 86/11 Philippe A. NAERT
and Alain BULTEZ "From "Lydiametry" to "Pinkhamization": misspecifying advertising dynamics rarely affects profitability". "Interpreting organizational texts.
86/12 Roger BETANCOURT and David GAUTSCHI
"The economics of retail firms", Revised April 1986.
86/13 S.P. ANDERSON and Damien J. NEVEN
"Spatial competition à la Cournot".
86/14 Charles WALDMAN "Comparaison internationale des marges brutes du commerce", June 1985.
Arnoud DE MEYER, Jinichiro NAKANE, Jeffrey G. MILLER and Kasra FERDOWS
86/28 Manfred KETS DE VRIES and Danny MILLER
86/29 Manfred KETS DE VRIES "Why follov the leader?".
86/30 Manfred KETS DE VRIES "The succession game: the real story.
86/31 Arnoud DE MEYER "Plexibility: the next competitive battle", October 1986.
86/31 Arnoud DE MEYER, "Flexibility: the next competitive battle", Revised Version: March 1987 86/15 Mihkel TOMBAK and
Arnoud DE MEYER "How the managerial attitudes of firms with PMS differ from other manufacturing firms: survey resuits", June 1986.
86/16 B. Espen ECKBO and Herwig M. LANGOHR
86/17 David B. JEMISON
86/18 James TEBOUL and V. MALLERET
Performance differences among strategic group members", October 1986.
"Les primes des offres publiques, la note d'information et le marché des transferts de contrôle des sociétés".
"Strategic capability transfer in acquisition integration", May 1986.
86/32 Karel COOL and Dan SCHENDEL
86/33 Ernst BALTENSPERGER and Jean DERMINE
"The role of public policy in insuring financial stability: a cross-country, comparative perspective", August 1986, Revised November 1986.
"Towards an operational definition of services", 1986. "Acquisitions: myths and reality",
July 1986.
86/19 Rob R. VEITZ "Nostradamus: a knovledge-based forecasting advisor". "Measuring the market value of a bank, a
primer", November 1986.
86/20 Albert CORHAY, Gabriel HAWAVINI and Pierre A. MICHEL
"The pricing of equity on the London stock exchange: seasonality and size premium", June 1986.
86/21 Albert CORHAY, Gabriel A. HAWAVINI and Pierre A. MICHEL
"Seasonality in the risk-return relationship: some international evidence", July 1986.
"The evolution of retailing: a suggested economic interpretation".
"Risk-premia seasonality in U.S. and European equity markets", February 1986.
"Financial innovation and recent developments in the French capital markets", Updated: September 1986.
86/34 Philippe HASPESLAGH and David JEMISON
86/35 Jean DERMINE
86/36 Albert CORHAY and Gabriel HAWAVINI
86/37 David GAUTSCHI and Roger BETANCOURT
86/38 Gabriel HAWAVINI
87/13 Sumantra GHOSHAL and Nitin NOHRIA
86/39 Gabriel HAWAWINI Pierre MICHEL and Albert CORHAY
"Multinational corporations as differentiated netvorks", April 1987.
"The pricing of common stocks on the Brussels stock exchange: a re-ezamination of the evidence", November 1986.
87/14 Landis GABEL
86/40 Charles WYPLOSZ "Capital flovs liberalization and the EMS, a French perspective", December 1986.
"Product Standards and Competitive Strategy: An Analysis of the Principles", May 1987.
87/15 Spyros MAKRIDAKIS "METAFORECASTING: Vays of improving Forecasting. Accuracy and Usefulness", May 1987.
86/41 Kasra FERDOWS and Wickham SKINNER
"Manufacturing in a nev perspective", July 1986.
86/42 Kasra FERDOWS and Per LINDBERG
"FMS as indicator of manufacturing strategy", December 1986.
87/16 Susan SCHNEIDER and Roger DUNBAR
"Takeover attempts: vhat does the language tell us?, June 1987.
86/43 Damien NEVEN 87/17 André LAURENT and Fernando BARTOLOME
"On the existence of equilibrium in hotelling's model", November 1986.
"Managers' cognitive maps for upvard and dovnvard relationships", June 1987.
86/44 Ingemar DIERICKX Carmen MATUTES and Damien NEVEN
"Patents and the European biotechnology lag: a study of large European pharmaceutical firms", June 1987.
1987
"Value added tax and competition", December 1986.
87/19 David BEGG and Charles WYPLOSZ
87/18 Reinhard ANGELMAR and Christoph LIEBSCHER
"Why the EMS? Dynamic games and the equilibrium policy regime, May 1987.
"A nev approach to statistical forecasting", June 1987.
87/01 Manfred KETS DE VRIES "Prisoners of leadership".
87/02 Claude VIALLET "An empirical investigation of international asset pricing", November 1986. "Strategy formulation: the impact of national
culture", Revised: July 1987.
"Conflicting ideologies: structural and motivational consequences", August 1987.
87/03 David GAUTSCHI and Vithala RAO
"A methodology for specification and aggregation in product concept testing", Revised Version: January 1987.
"The demand for retail products and the household production model: nev vievs on complementarity and substitutability".
87/04 Sumantra GHOSHAL and Christopher BARTLETT
"Organizing for innovations: case of the multinational corporation", February 1987.
"The internai and external careers: a theoretical and cross-cultural perspective", Spring 1987.
87/20 Spyros MAKRIDAKIS
87/21 Susan SCHNEIDER
87/22 Susan SCHNEIDER
87/23 Roger BETANCOURT David GAUTSCHI
87/24 C.B. DERR and André LAURENT
87/05 Arnoud DE MEYER and Kasra FERDOWS
"Managerial focal points in manufacturing strategy", February 1987.
"Customer loyalty as a construct in the marketing of banking services", July 1986.
"The robustness of MDS configurations in the face of incomplete data", March 1987, Revised: July 1987.
87/06 Arun K. JAIN, Christian PINSON and Naresh K. MALHOTRA
87/07 Rolf BANZ and Gabriel HAWAWINI
87/25 A. K. JAIN, N. K. MALHOTRA and Christian PINSON "Equity pricing and stock market anomalies",
February 1987. "Demand complementarities, household production and retail assortments", July 1987.
87/09 Lister VICKERY, Mark PILKINGTON and Paul READ
87/08 Manfred KETS DE VRIES "Leaders vho can't manage", February 1987.
87/27 Michael BURDA "Entrepreneurial activities of European MBAs", March 1987.
87/26 Roger BETANCOURT and David GAUTSCHI
"Is there a capital shortage in Europe?", August 1987.
87/10 André LAURENT "A cultural viev of organizational change", March 1987
87/11 Robert FILDES and Spyros MAKRIDAKIS
"Forecasting and loss functions", March 1987.
87/12 Fernando BARTOLOME and André LAURENT
"The Janus Head: learning from the superior and subordinate faces of the manager's job", April 1987.
1M 1I-ilA I7Ln ir Aggfge. tc.a4iii UMM UMM wrff ;fp&
°j]
Boulevard de Constance 77309 Fontainebleau Cedex, France Telephone (I) 60 72 40 40 Telecopy (1) 60 72 40 49 Telex 690389
EAC RESEARCH PAPERS
EAC RESEARCH PAPERS
(Academic papers based on the research of EAC Faculty and research staff)
1. LASSERRE Philippe (Research Paper n° 1) A contribution to the study of entrepreneurship development in Indonesia. 1980.
2. BOISOT Max and LASSERRE Philippe (Research Paper n° 2) The transfer of technology from European to ASEAN entreprises: strategies and practices in the chemical and pharmaceutical sectors. 1980.
3. AMAKO Tetsuo (Research Paper n° 3) Possibilité d'un transfert à l'étranger des techniques japonaises de gestion du personnel: le cas français. 1982.
4. SCHUTTE Hellmut (Research Paper n° 8) Wirtschaftliche Kooperation zwischen den ASEAN - Lândern und Nordrhein-Westfalen - Hemmungsfaktoren und Chancen für die deutsche Wirtschaft. 1983.
5. ISHIYAMA Yoshihide (Research Paper n° 14) The political economy of liberalisation of the financial system in Japan. 1984.
6. LASSERRE Philippe (Research Paper n° 17) Singapour comme centre régional. L'expérience d'entreprises françaises. 1985.
7. Von KIRCHBACH Friedrich (Research Paper n° 18) Patterns of export channels to developing Asia. 1984.
8. MITTER Rajan (Research Paper n° 19) A survey of European business in India. 1984.
9. CHAPON Marie-Claude (Research Paper n° 22) Stratégies des entreprises japonaises en Afrique. 1985.
Recommended