MEDIA LITERACY IN
Italy

Cl@ss 2.0 - the most technologically advanced project in Italy so farThe initiative began in 2009 in 156 classrooms across Italy
The idea of project Cl@ss 2.0 is that students don’t have to visit a computer laboratory but instead each classroom becomes an informatic laboratory
Students are given the technology (computers, television, Internet connections) on their desks
The current overall geographical distribution of classrooms which participate in Cl@ss 2.0
This project has grown enormously since the start in 2009, but it is still only in less than 500 classrooms across the country
14
14
14
1414
14
14
18
38 30
34
32
20
4028
16
28
34
Northern Italy = 156
Central Italy = 110
Southern Italy = 150
Total = 416
The total number of students who currently participate in Cl@ss 2.0 in 5 well known Italian regions
PRIMARY SCHOOL age from 5/6 - to 10 Students in cl@sses 2.0 = 266LOWER SECONDARY SCHOOL age from 11 – to 13 Students in cl@sses 2.0 = 264UPPER SECONDARY SCHOOL age from 14 – to 18 Students in cl@sses 2.0 = 322
Milano
Lombardia (Milano)

PRIMARY SCHOOL age from 5/6 - to 10 Students in cl@sses 2.0 = 190LOWER SECONDARY SCHOOL age from 11 – to 13 Students in cl@sses 2.0 = 264UPPER SECONDARY SCHOOL age from 14 – to 18 Students in cl@sses 2.0 = 276
Roma
The total number of students who currently participate in Cl@ss 2.0 in 5 well known Italian regions
Lazio (Roma)

PRIMARY SCHOOL age from 5/6 - to 10 Students in cl@sses 2.0 = 228LOWER SECONDARY SCHOOL age from 11 – to 13 Students in cl@sses 2.0 = 264UPPER SECONDARY SCHOOL age from 14 – to 18 Students in cl@sses 2.0 = 322
Napoli
Campania (Napoli)
The total number of students who currently participate in Cl@ss 2.0 in 5 well known Italian regions

PRIMARY SCHOOL age from 5/6 - to 10 Students in cl@sses 2.0 = 76LOWER SECONDARY SCHOOL age from 11 – to 13 Students in cl@sses 2.0 = 132UPPER SECONDARY SCHOOL age from 14 – to 18 Students in cl@sses 2.0 = 92
L’Aquila
The total number of students who currently participate in Cl@ss 2.0 in 5 well known Italian regions
Abruzzo (L’Aquila)

PRIMARY SCHOOL age from 5/6 - to 10 Students in cl@sses 2.0 = 190LOWER SECONDARY SCHOOL age from 11 – to 13 Students in cl@sses 2.0 = 264UPPER SECONDARY SCHOOL age from 14 – to 18 Students in cl@sses 2.0 = 276
Sicily
Sicilia
The total number of students who currently participate in Cl@ss 2.0 in 5 well known Italian regions

Cl@ss 2.0 vs. School 2.0 This image shows a different
initiative: SCHOOL 2.0 in which the ENTIRE school (not just one classroom like project Cl@ss 2.0) is being funded
• to buy informatic devices• to organize courses for
teachers to refresh their skills
2
1
1
11
1
1
1
1
11
1
The total number of schools participating is 13
Primary school = 1Istitutions including primary school and lower secondary school = 2Lower secondary school = 1Upper secondary school = 9This is a developing project which hasn’t yet been fully realized
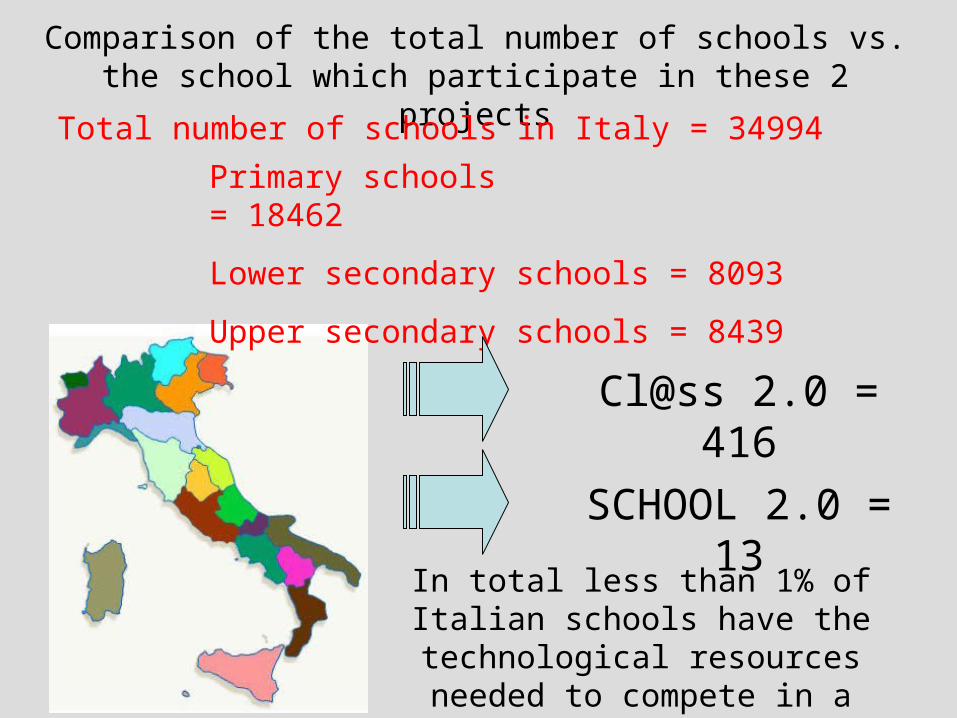
Primary schools = 18462
Lower secondary schools = 8093
Upper secondary schools = 8439
Comparison of the total number of schools vs. the school which participate in these 2 projects
SCHOOL 2.0 = 13
Total number of schools in Italy = 34994
Cl@ss 2.0 = 416
In total less than 1% of Italian schools have the technological
resources needed to compete in a global environment
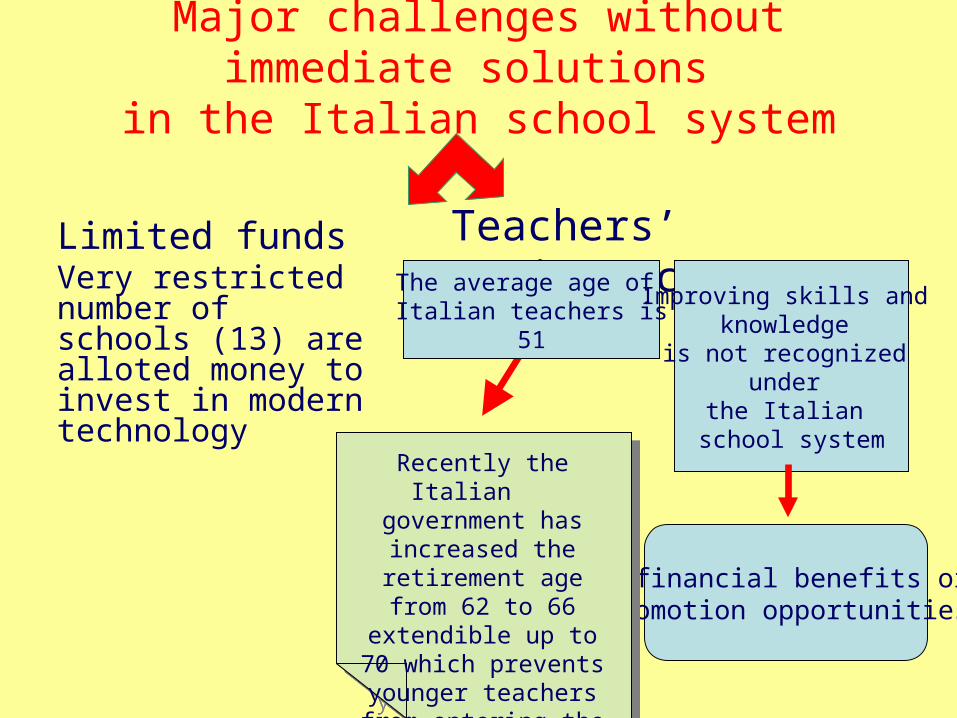
Major challenges without immediate solutions
in the Italian school system
Limited fundsVery restricted number of schools (13) are alloted money to invest in modern technology
Teachers’ resistanceThe average age of
Italian teachers is51
Improving skills and knowledge
is not recognized under
the Italian school system
No financial benefits or promotion opportunities
Recently the Italian government has
increased the retirement age from 62 to 66 extendible up to
70 which prevents younger teachers from
entering the classrooms
Recently the Italian government has
increased the retirement age from 62 to 66 extendible up to
70 which prevents younger teachers from
entering the classrooms

The average age of Italian teachers(data collection 2011)
Primary school
Average age = 49,3
Lower secondary school
Average age = 52,1
Upper secondary school
Average age = 51,8
Usually teachers are women but head teachers are men and significantly older than teachers
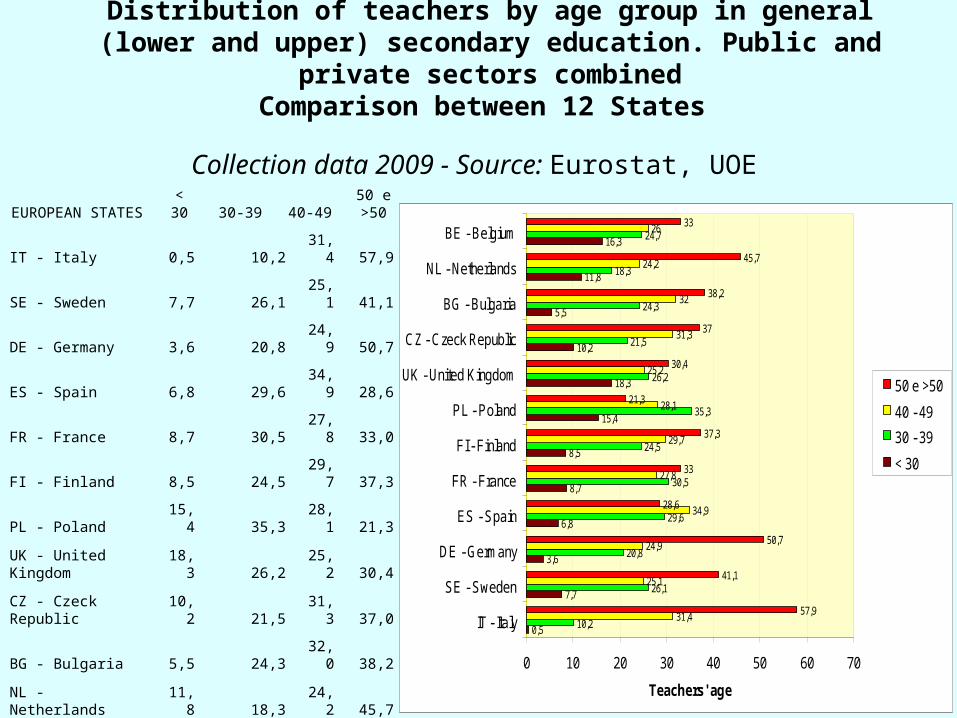
Distribution of teachers by age group in general (lower and upper) secondary education. Public and private sectors combined
Comparison between 12 States
Collection data 2009 - Source: Eurostat, UOE
0,5
7,7
3,6
6,8
8,7
8,5
15,4
18,3
10,2
5,5
11,8
16,3
10,2
26,1
20,8
29,6
30,5
24,5
35,3
26,2
21,5
24,3
18,3
24,7
31,4
25,1
24,9
34,9
27,8
29,7
28,1
25,2
31,3
32
24,2
26
57,9
41,1
50,7
28,6
33
37,3
21,3
30,4
37
38,2
45,7
33
0 10 20 30 40 50 60 70
IT - Italy
SE - Sweden
DE - Germany
ES - Spain
FR - France
FI - Finland
PL - Poland
UK - United Kingdom
CZ - Czeck Republic
BG - Bulgaria
NL - Netherlands
BE - Belgium
Teachers' age
50 e >50
40 - 49
30 - 39
< 30
EUROPEAN STATES < 30 30-39 40-49
50 e >50
IT - Italy 0,5 10,2 31,4 57,9
SE - Sweden 7,7 26,1 25,1 41,1
DE - Germany 3,6 20,8 24,9 50,7
ES - Spain 6,8 29,6 34,9 28,6
FR - France 8,7 30,5 27,8 33,0
FI - Finland 8,5 24,5 29,7 37,3
PL - Poland 15,4 35,3 28,1 21,3
UK - United Kingdom 18,3 26,2 25,2 30,4
CZ - Czeck Republic 10,2 21,5 31,3 37,0
BG - Bulgaria 5,5 24,3 32,0 38,2
NL - Netherlands 11,8 18,3 24,2 45,7
BE - Belgium 16,3 24,7 26 33,0
Recommended