ContentsBoard of Directors 4
Chairman’s Letter 6
Management Discussion and Analysis 10
Corporate Governance 26
Additional Shareholder Information 40
Directors’ Report 48
Auditor’s Report 62
Balance Sheet and Profit & Loss Account 68
Bajaj Auto Ltd. and its Subsidiaries,
Associates and Joint Ventures-
Consolidated Balance Sheet and
Profit and Loss Account 122

2
N H Hingorani Rajiv Bajaj Sanjiv Bajaj
Pradeep Shrivastava Kevin D’sa
Madhur Bajaj Rahul Bajaj
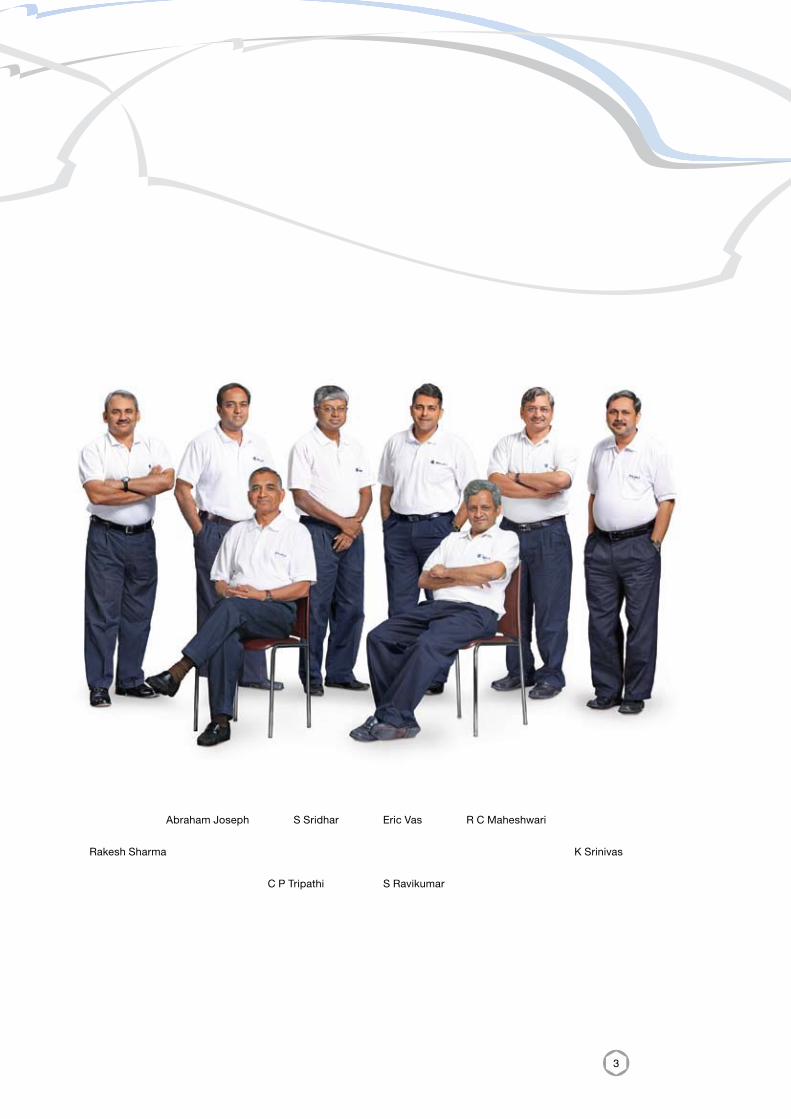
ManagementTeam
3
Abraham Joseph S Sridhar Eric Vas R C Maheshwari
Rakesh Sharma K Srinivas
C P Tripathi S Ravikumar
4
Board of Directors
Rahul Bajaj
Chairman
Madhur Bajaj
Vice Chairman
Rajiv Bajaj
Managing Director
Sanjiv Bajaj
Executive Director
D S Mehta
Kantikumar R Podar
Shekhar Bajaj
Auditors
Dalal & ShahChartered Accountants
Cost Auditor
A P RamanCost Accountant
D J Balaji Rao
J N Godrej
S H Khan
Ms Suman Kirloskar
Naresh Chandra
Nanoo Pamnani
Manish Kejriwal
P Murari
Niraj Bajaj
Bankers
Central Bank of IndiaState Bank of IndiaCitibank N AStandard Chartered BankBank of AmericaICICI BankHDFC Bank
Registered under the Indian Companies Act, 1956
5
Management
Rahul BajajChairman
Madhur BajajVice Chairman
Rajiv BajajManaging Director
Sanjiv BajajExecutive Director
Pradeep ShrivastavaPresident (Engineering)
Rakesh SharmaCEO (International Business)
R C MaheshwariCEO (Commercial Vehicles)
S SridharCEO (Two Wheelers)
Abraham JosephPresident (Research & Development)
Eric VasPresident (New Projects)
C P TripathiVice President (Corporate)
Kevin D’saVice President (Finance)
K SrinivasVice President (Human Resources)
N H HingoraniVice President (Commercial)
S RavikumarVice President (Business Development)
Company Secretary
J Sridhar
Registered Office
Mumbai-Pune Road Akurdi, Pune 411 035
Works
• Mumbai-Pune Road Akurdi, Pune 411 035
• Bajaj Nagar, Waluj Aurangabad 431 136
• Chakan Industrial Area Chakan, Pune 410 501
• Plot No.2, Sector 10 IIE Pantnagar Udhamsinghnagar Uttarakhand 263 531
6
Dear Shareholder,
In April 2008, hardly anyone could have predicted
what the global economy would turn out to be by
31 March 2009. If you recall, we began the year
with one of the world’s worst inflationary spirals
since World War II. Today, it seems strange that
in the first week of July 2008, the spot price of
crude was quoting at above $144 per barrel,
and pundits were talking of the imminent arrival
Chairman’s Letter
of $200 oil. Nobody believed that the scourge
of global inflation would suddenly disappear to
make way for the worst economic downturn since
the Great Depression.
Yet, it happened with a vengeance since the
second half of September 2008, after the fall of
Lehman Brothers. As I write this letter to you,
the US, countries belonging to the European
Union, the UK, Japan, Russia, China, India and
7
others have already pumped in over $2.5 trillion
worth of funds and government guarantees to
support their economies and financial systems;
and the G20 has promised another $1.1 trillion of
support, including to the International Monetary
Fund.
While such concerted action has put an end to
the severe liquidity crunch and instability across
global financial institutions, the crisis has spread
to the real economy. Consider the facts:
• US GDP is expected to shrink by 2.7%
in 2009. Its unemployment rate is at
8.5% (March 2009), and rising — the
highest since the early 1980s. Between
October 2008 and March 2009, net payroll
employment has shrunk by over 3.5 million.
And the job losses continue.
• The Euro Zone’s GDP is likely to contract
by 3.4% in 2009. Unemployment is
already at 8.5%.
• GDP of the UK is forecast to reduce by
3.5% in 2009.
• Japan’s GDP will most likely contract
by a massive 6.5% in 2009. Thanks to
lower global demand, industrial production
was down by a staggering 38% in
February 2009.
• China’s growth rate has crashed. From
heady double-digit rates, GDP growth in
2009 is expected to be 6%.
• And the World Trade Organisation estimates
a shrinking of global trade by as much as
9% in 2009.
Simply put, 2008-09 has been one of the worst
years for the global economy. And 2009-10
is unlikely to be better. Indeed, most experts
believe that the real turnaround will occur only in
calendar 2010 — probably from the April-June
quarter.
India has not been immune to these tumultuous
times. After three consecutive years of over 9%
GDP growth in 2005-06, 2006-07 and 2007-08,
quarterly growth rates have steadily fallen from
the second half of 2007-08. GDP growth for
2008-09 is expected at somewhere between
8
6.5% and 7%, which would be some 200-250
basis points lower than the previous year. And
the prospects are fairly grim for 2009-10, with
estimates varying from a low of 5% to 6.5%.
To be sure, we are better off compared to the
OECD countries: we are growing, albeit at a
lower rate; they are shrinking. Besides, we
are better insulated from the global scenario
with domestic demand comprising 68% of our
GDP. Even so, these are difficult times. A fall in
demand growth translates to lower order books;
lower capacity utilisation; and severe pressure
on prices. The relatively worse performance
of most manufacturing and service sector
companies in the third and fourth quarters of
2008-09 reflect this reality.
The Indian automotive sector has been hit by
the combined effect of a severe credit crunch
and a fall in demand growth. The third quarter
of 2008-09 was particularly fierce. Average
monthly sales of motorcycles in India fell by
over 17% in Q3 2008-09 versus Q2 — from an
average of 524,939 units per month to 435,114.
Your company has been affected by this
downturn.
• Net sales and other operating income fell by
2.6% to Rs.88.11 billion in 2008-09.
• Operating EBITDA was Rs.12.02 billion. The
company continued earning a double-digit
operating EBITDA margin: at 13.6% of net
sales and other operating income for
2008-09, rising to 15.2% margin for the
fourth quarter.
• Operating profit before tax (PBT) was
Rs.8.46 billion, with an operating profit
margin of 9.6% of net sales and other
operating income.
In a difficult year, there have been some positive
news. The first is Bajaj Auto’s exports. During
2008-09, your company’s exports achieved
an all-time high of 772,519 units of two- and
three-wheelers — representing a growth of
25% over the previous year. The growth was
driven by the export of two-wheelers, which
9
increased by 31% over 2007-08 to achieve
sales of 633,463 units in 2008-09. Last year,
too, I had expressed my satisfaction with our
exports. Given the excellent performance for
three successive years and the establishment of
significant bridgeheads in many geographies, I
feel confident that the company’s products will
continue to do well in international markets.
The second good development is that your
company will be introducing upgraded Pulsar
models in May 2009 and brand new models for
the executive segment in the second quarter of
2009-10. With these, and the positive response
to the XCD 135 cc which was introduced in
February 2009, I expect sales to recover in
2009-10 — not to the levels seen in 2006-07,
but better than most of 2008-09.
I would add another heartening news. Despite
the severe contraction in your company’s sales
in 2008-09, it has been able to maintain healthy
operating margins. Indeed, the fourth quarter
saw a rise in the margin to 15.2% of net sales
and other operating income. This has much to
do with a better product mix, higher productivity
and lower input costs. I wholeheartedly support
the management focus on lower costs and
greater profitability.
The path ahead is going to be challenging — that
of growing sales without eroding profit margins
in an economy which will be witnessing a 250
basis point drop in growth rates compared to
the last four years. But I am confident that your
company’s management will deliver superior
results in 2009-10. The building blocks are in
place. With easier credit conditions, we can
achieve growth with better profits.
My thanks to all employees of Bajaj Auto for
their unstinting support, especially in hard
times. And to you for being with us.
Rahul Bajaj
Chairman
10
2008-09 has been a tumultuous year for
the global economy. The year began with a
continuation of a world-wide inflationary spiral
and ended with the worst slowdown since the
Great Depression of the 1930s. While India
did not face a contraction in GDP growth like
the USA, the Euro zone, the UK and Japan, it
has witnessed a 250 basis point compression
in growth rate — from 9% in 2007-08 to an
expected 6.5% or thereabout in 2008-09.
The second half of 2008-09 has seen severe
financial distress across broad sections of
Indian industry — especially the manufacturing
sectors. Companies have got re-rated; have
Management Discussion and Analysis
scrapped investment plans and capital
expenditure; cut down capacities; struggled with
finances because of their earlier over-leveraged
positions; delayed payments to vendors; and
had to borrow funds at prohibitive interest rates.
It is in this context that one must look at the
performance of Bajaj Auto Limited (‘Bajaj
Auto’, ‘BAL’ or ‘the Company’). Despite falling
demand in the motorcycle segment, the
company has succeeded in maintaining an
operating EBITDA (earnings before interest,
taxes, depreciation and amortisation) margin
of 13.6% of net sales and other operating
income. In a situation where many companies
11
are suffering from a severe financial crunch,
Bajaj Auto remains debt free. Whereas
many companies have been forced to delay
payments to vendors, Bajaj Auto has gone the
other way — helped its suppliers and dealers
by offering improved payment terms. Instead of
cutting back on investments, the company has
proceeded with its business plans, including
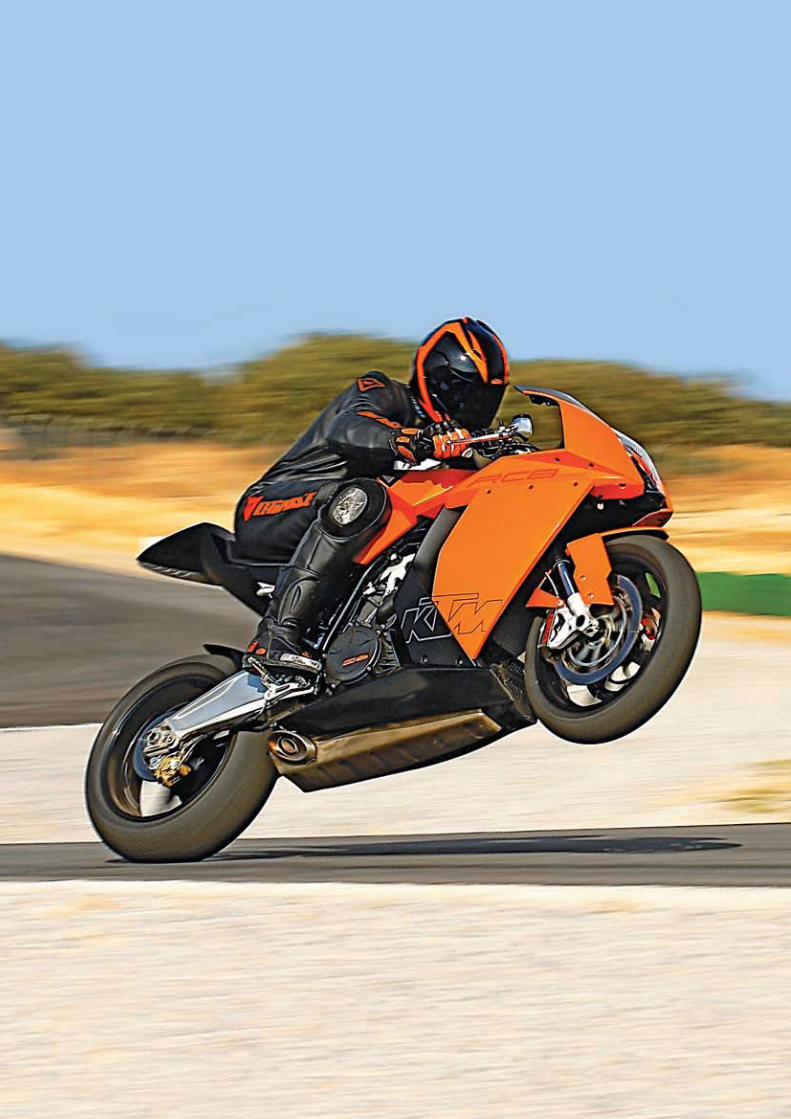
a spend of Rs.1.4 billion to raise its stake in
the Austrian motorcycle company, KTM, from
24.45% to 31.72%. All this has occurred from
Bajaj Auto’s internal accruals.
As in earlier Annual Reports, this chapter moves
on to markets, then to the company’s sales
across segments, then to operations, and finally
to the financials.
Markets
Motorcycles: Overall
Two-wheeler sales of Indian players is
dominated by the domestic market and, within
it, by motorcycles. After growing at a sharp
clip from the late 1990s, motorcycle sales
witnessed a 7.8% drop in volume in 2007-08,
due to falling domestic demand as a result of
rising interest rates and many private sector
banks reducing their retail lending exposures.
2008-09 saw a modest increase in motorcycle
sales of 4%, driven largely by growth in cash
sales. Even so, sales of motorcycles (both
domestic and exports) in 2008-09 has been
lower than what it was in 2006-07, before the
The salient features of Bajaj Auto’s performance for 2008-09 are:
Highlights for 2008-09 versus 2007-08: Bajaj Auto Standalone
• Net sales (excluding excise duty) and other operating income fell by 2.6% to Rs.88.11 billion.
• Exports of two-wheelers — mostly motorcycles — grew by 31% to 633,463 units.
• Domestic sales of motorcycles (inclusive of excise duty) fell in value by 20% to Rs.46.59 billion;
by volume, it was 1.28 million in 2008-09 — a fall of 23% over the previous year.
• Despite a sharp decline in domestic sales of motorcycles, the company’s operating EBITDA
stood at Rs.12.02 billion. The operating EBITDA margin was 13.6% of net sales and other
operating income for 2008-09, and recorded a 15.2% margin for Q4, 2008-09.
• Operating profit before tax (PBT) fell by 16.4% to Rs.8.46 billion. This was largely due to a voluntary
retirement scheme (VRS) of Rs.1.83 billion and mark-to-market losses of Rs.218 million. Even so, the
operating profit margin was 9.6% of net sales and other operating income.
• Surplus cash and cash equivalents in the company’s balance sheet as on 31 March 2009 stood
at Rs.9.33 billion.
12
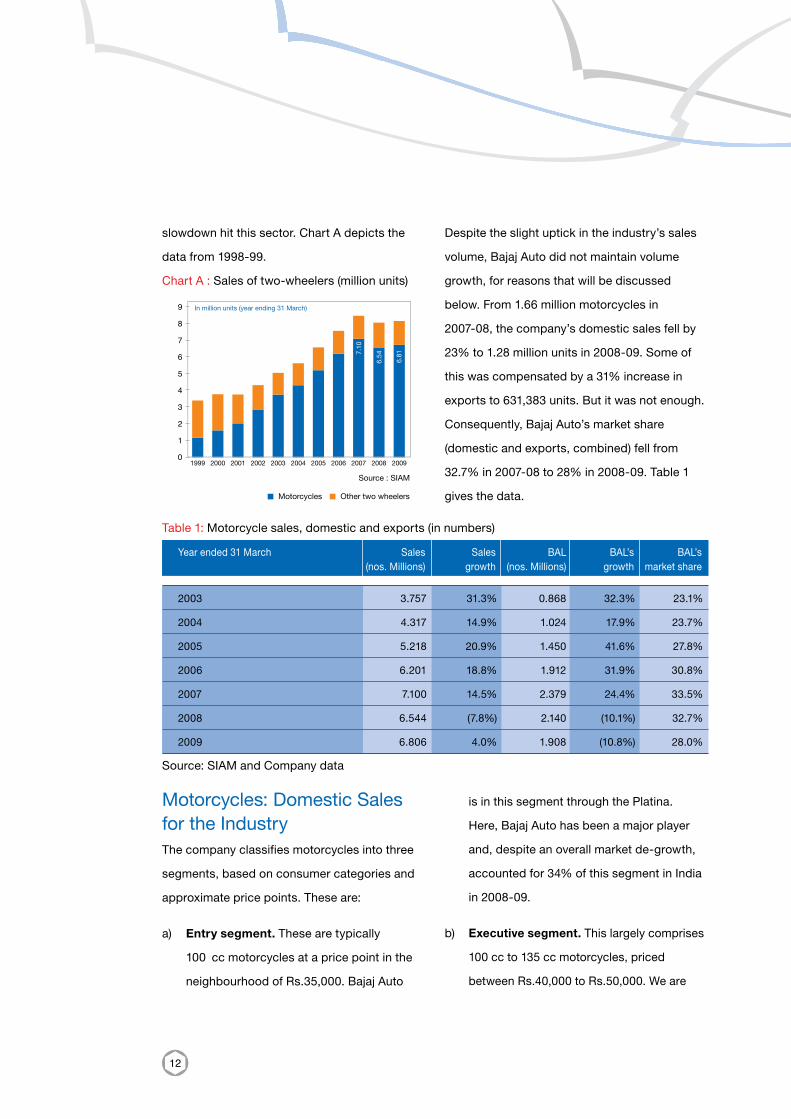
slowdown hit this sector. Chart A depicts the
data from 1998-99.
Chart A : Sales of two-wheelers (million units)
Despite the slight uptick in the industry’s sales
volume, Bajaj Auto did not maintain volume
growth, for reasons that will be discussed
below. From 1.66 million motorcycles in
2007-08, the company’s domestic sales fell by
23% to 1.28 million units in 2008-09. Some of
this was compensated by a 31% increase in
exports to 631,383 units. But it was not enough.
Consequently, Bajaj Auto’s market share
(domestic and exports, combined) fell from
32.7% in 2007-08 to 28% in 2008-09. Table 1
gives the data.
Table 1: Motorcycle sales, domestic and exports (in numbers)
Year ended 31 March Sales Sales BAL BAL’s BAL’s (nos. Millions) growth (nos. Millions) growth market share
2003 3.757 31.3% 0.868 32.3% 23.1%
2004 4.317 14.9% 1.024 17.9% 23.7%
2005 5.218 20.9% 1.450 41.6% 27.8%
2006 6.201 18.8% 1.912 31.9% 30.8%
2007 7.100 14.5% 2.379 24.4% 33.5%
2008 6.544 (7.8%) 2.140 (10.1%) 32.7%
2009 6.806 4.0% 1.908 (10.8%) 28.0%
Source: SIAM and Company data
Motorcycles: Domestic Sales for the IndustryThe company classifies motorcycles into three
segments, based on consumer categories and
approximate price points. These are:
a) Entry segment. These are typically
100 cc motorcycles at a price point in the
neighbourhood of Rs.35,000. Bajaj Auto
is in this segment through the Platina.
Here, Bajaj Auto has been a major player
and, despite an overall market de-growth,
accounted for 34% of this segment in India
in 2008-09.
b) Executive segment. This largely comprises
100 cc to 135 cc motorcycles, priced
between Rs.40,000 to Rs.50,000. We are
Other two wheelersMotorcycles
Source : SIAM
9
8
7
6
5
4
3
2
1
01999 2000 2001 2002 2003 2004 2005 2006 2007 2008 2009
7.10
6.54
6.81
In million units (year ending 31 March)
13
in this segment with two brands: XCD
and Discover.
c) Performance segment. These are sleek,
high performance, with price points in
excess of Rs.50,000. We are present here
with our flagship brand, the Pulsar, and
our cruiser, the Avenger. We dominate this
space, with a domestic market share in
excess of 47%.
If the domestic motorcycle market is segregated
as above, it becomes clear that industry sales
showed significant ups and downs in 2008-09.
Chart B plots the data for the industry as a whole.
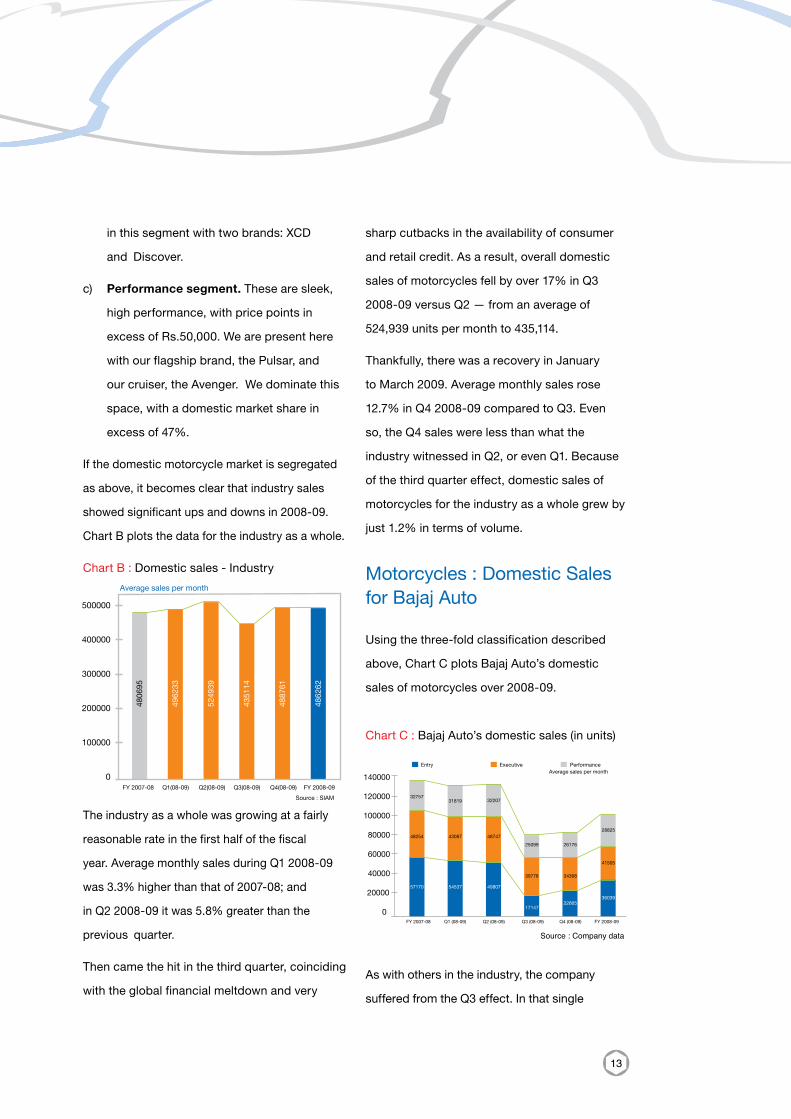
Chart B : Domestic sales - Industry
The industry as a whole was growing at a fairly
reasonable rate in the first half of the fiscal
year. Average monthly sales during Q1 2008-09
was 3.3% higher than that of 2007-08; and
in Q2 2008-09 it was 5.8% greater than the
previous quarter.
Then came the hit in the third quarter, coinciding
with the global financial meltdown and very
sharp cutbacks in the availability of consumer
and retail credit. As a result, overall domestic
sales of motorcycles fell by over 17% in Q3
2008-09 versus Q2 — from an average of
524,939 units per month to 435,114.
Thankfully, there was a recovery in January
to March 2009. Average monthly sales rose
12.7% in Q4 2008-09 compared to Q3. Even
so, the Q4 sales were less than what the
industry witnessed in Q2, or even Q1. Because
of the third quarter effect, domestic sales of
motorcycles for the industry as a whole grew by
just 1.2% in terms of volume.
Motorcycles : Domestic Sales for Bajaj Auto
Using the three-fold classification described
above, Chart C plots Bajaj Auto’s domestic
sales of motorcycles over 2008-09.
Chart C : Bajaj Auto’s domestic sales (in units)
As with others in the industry, the company
suffered from the Q3 effect. In that single
FY 2007-08 Q1(08-09) Q2(08-09) Q3(08-09) Q4(08-09) FY 2008-09
0
100000
200000
300000
400000
500000
4806
95
4962
33
5249
39
4351
14
4887
61
4862
62
Source : SIAM
Average sales per month
FY 2007-08 Q1 (08-09) Q2 (08-09) Q3 (08-09) Q4 (08-09) FY 2008-09
Source : Company data
0
20000
40000
60000
80000
100000
120000
140000
32757
48254
57170
31819
43087
54537
32207
25099
39778
17147
26176
34368
22665
28825
41505
36039
48747
49807
Entry Executive PerformanceAverage sales per month
14
quarter, Bajaj Auto’s motor cycle sales by volume
dropped by 37% — from an average of 130,800
units in Q2 2008-09 to 82,024 units in Q3. The
sharpest drop was in the entry level segment,
which fell from an average monthly sale of 49,807
units in Q2 to 17,147 units in Q3 — a reduction of
66% over two successive quarters.
The two other segments also showed
declining sales, but nowhere near as sharply
as the entry level.
There have been some signs of recovery since
then. Thanks to an excellent launch of the
XCD 135 cc in February and sales in excess
of 21,000 units per month in the February and
March 2009, the executive segment is back
on the growth path. Demand for our Pulsars
has also picked up, resulting in a 4% growth in
the sales volume of our performance segment
offerings in Q4 2008-09 compared to Q3. The
full impact of the XCD 135 cc will be apparent in
2009-10; and this will be supplemented by our
launch of the new Pulsar models in May 2009.
While the company commands a significant
market share at the entry level segment (34%
in 2008-09), its sale of Platina 100 cc showed
a decline of almost 37% by volume. The sharp
contraction of retail credit by Indian banks,
especially to the relatively less well off, has
been a significant factor in reduced sales in
the aggregate as well as for Bajaj Auto. The
silver lining is that since Platina is a low margin
product, this substantial fall in growth has not
proportionately reduced Bajaj Auto’s operating
EBITDA margins.
On the positive side, we have improved
realisations in this segment through marketing
initiatives, improved operations at our Pantnagar
plant, as well as the launch of our Platina 125
DTS-Si with better margins. With financing
support from Bajaj Auto Finance, we expect to at
least hold on to the average monthly volumes of
2008-09 in the entry segment, if not grow them.
Bajaj Auto has not been a dominant player in
the executive segment, where it accounted for
under 18% market share in 2007-08. However,
this fell to 15% in 2008-09 due to intense
competition from the market leader and the fact
that we did not have a major new offering in the
category in the first three quarters of 2008-09.
15
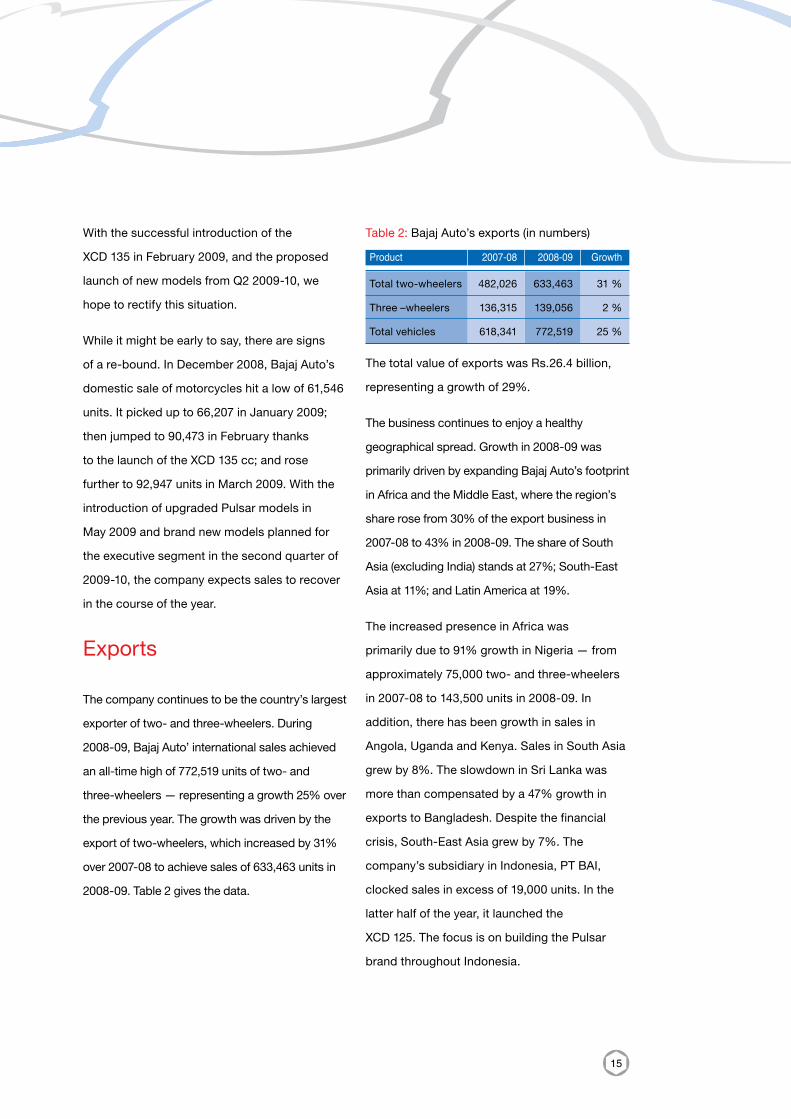
Table 2: Bajaj Auto’s exports (in numbers)
Product 2007-08 2008-09 Growth
Total two-wheelers 482,026 633,463 31 %
Three –wheelers 136,315 139,056 2 %
Total vehicles 618,341 772,519 25 %
The total value of exports was Rs.26.4 billion,
representing a growth of 29%.
The business continues to enjoy a healthy
geographical spread. Growth in 2008-09 was
primarily driven by expanding Bajaj Auto’s footprint
in Africa and the Middle East, where the region’s
share rose from 30% of the export business in
2007-08 to 43% in 2008-09. The share of South
Asia (excluding India) stands at 27%; South-East
Asia at 11%; and Latin America at 19%.
The increased presence in Africa was
primarily due to 91% growth in Nigeria — from
approximately 75,000 two- and three-wheelers
in 2007-08 to 143,500 units in 2008-09. In
addition, there has been growth in sales in
Angola, Uganda and Kenya. Sales in South Asia
grew by 8%. The slowdown in Sri Lanka was
more than compensated by a 47% growth in
exports to Bangladesh. Despite the financial
crisis, South-East Asia grew by 7%. The
company’s subsidiary in Indonesia, PT BAI,
clocked sales in excess of 19,000 units. In the
latter half of the year, it launched the
XCD 125. The focus is on building the Pulsar
brand throughout Indonesia.
With the successful introduction of the
XCD 135 in February 2009, and the proposed
launch of new models from Q2 2009-10, we
hope to rectify this situation.
While it might be early to say, there are signs
of a re-bound. In December 2008, Bajaj Auto’s
domestic sale of motorcycles hit a low of 61,546
units. It picked up to 66,207 in January 2009;
then jumped to 90,473 in February thanks
to the launch of the XCD 135 cc; and rose
further to 92,947 units in March 2009. With the
introduction of upgraded Pulsar models in
May 2009 and brand new models planned for
the executive segment in the second quarter of
2009-10, the company expects sales to recover
in the course of the year.
Exports
The company continues to be the country’s largest
exporter of two- and three-wheelers. During
2008-09, Bajaj Auto’ international sales achieved
an all-time high of 772,519 units of two- and
three-wheelers — representing a growth 25% over
the previous year. The growth was driven by the
export of two-wheelers, which increased by 31%
over 2007-08 to achieve sales of 633,463 units in
2008-09. Table 2 gives the data.
16
Latin American sales commenced well at the
beginning of 2008-09, but then got negatively
affected by the global meltdown and sudden
curtailing of bank finance. Consequently,
the region clocked a negative growth of 5%.
However, given Bajaj Auto’s strong brand
presence in these markets, it is expected that
the company will be again able to ramp up the
volumes as the markets ease.
As a part of the company’s policy to be closer
to the markets in which it operates, Bajaj Auto
has offices in Monterrey (Mexico), Dubai and
Colombo (Sri Lanka) in addition to its subsidiary
PT BAI in Indonesia.
Three-wheelers
The company’s domestic sales of three-wheelers
in 2008-09 was 12% lower compared to the
previous year, and stood at 135,473 units.
Export demand grew at 2% to 139,056 units
(see Table 2 above). However that was not
sufficient to prevent a decline in the company’s
total three-wheeler sales — which fell by 5.4%
to 274,529 units in 2008-09. Given that total
industry sales shrank by 1.6% in 2008-09 over
the previous year, while Bajaj Auto’s fell by 5.4%,
the company’s market share dropped by 2.3
percentage points to 55.1%. At this market share,
however, Bajaj Auto remains the leading three-
wheeler player in India. Table 3 gives the data.
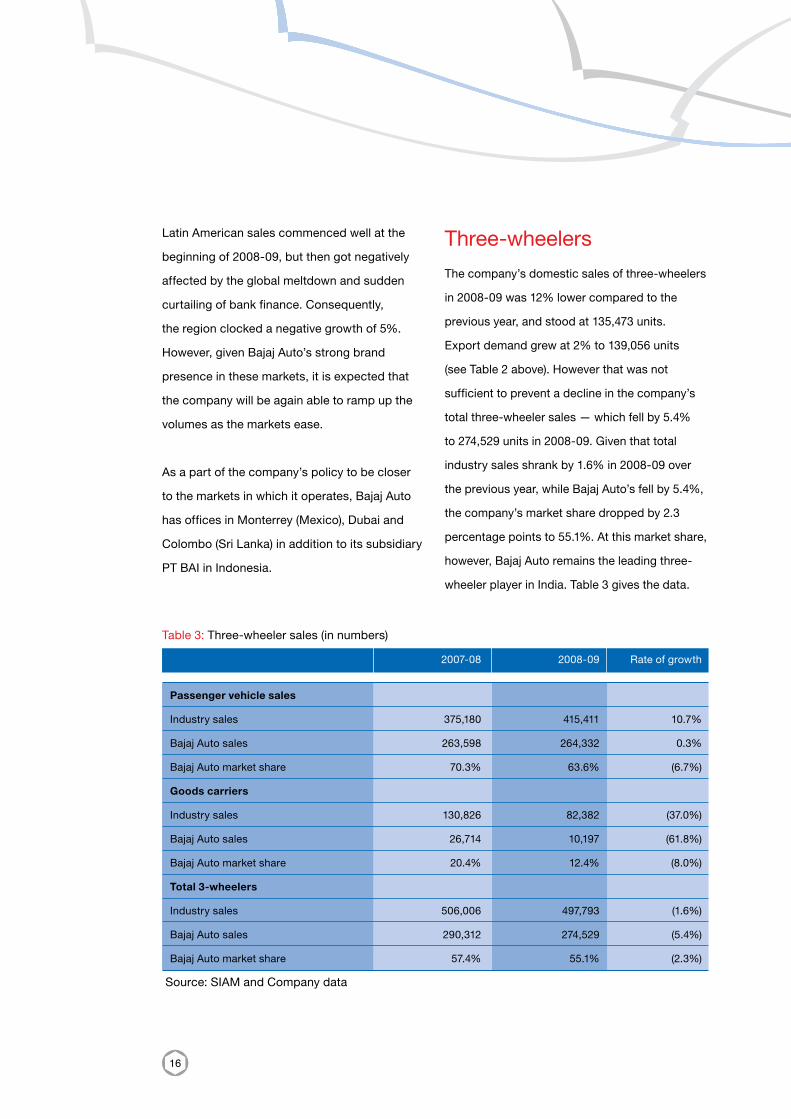
Table 3: Three-wheeler sales (in numbers)
2007-08 2008-09 Rate of growth
Passenger vehicle sales
Industry sales 375,180 415,411 10.7%
Bajaj Auto sales 263,598 264,332 0.3%
Bajaj Auto market share 70.3% 63.6% (6.7%)
Goods carriers
Industry sales 130,826 82,382 (37.0%)
Bajaj Auto sales 26,714 10,197 (61.8%)
Bajaj Auto market share 20.4% 12.4% (8.0%)
Total 3-wheelers
Industry sales 506,006 497,793 (1.6%)
Bajaj Auto sales 290,312 274,529 (5.4%)
Bajaj Auto market share 57.4% 55.1% (2.3%)
Source: SIAM and Company data
17
The heartening news for this segment is that
state governments have increased the permits
for plying energy efficient three-wheelers.
Bajaj Auto has a market share in excess of 90%
in the permit-driven markets. The company
also intends to introduce a RE Diesel upgrade
in 2009-10, which will have a high mileage,
accommodate more passengers with a luggage
hold area, and will attempt to capture a larger
share of the rural market.
Spare parts
Automobiles need periodic replacement of
parts. Not surprisingly, therefore, spare parts
comprise a profitable business for major
automobile manufacturers.
The objectives of spare parts business of
Bajaj Auto are to perform an effective role in
supporting new vehicle sales, maintain ‘vehicle
goodwill’ across different geographies, makes
and consumer groups, and contribute to the
bottom-line. These translate into three goals:
• Make spare parts available to customer at
all time.
• Make them affordable.
• Achieve profitable business growth and
greater penetration.
The company’s spare parts business has done
well. Domestic sales of spare parts grew by
17.5% to achieve a revenue of Rs.5.88 billion in
2008-09. And exports rose by 84% to
Rs.1.45 billion.
There is huge head room for further growth of
this business. Even today, despite significant
expansion of Bajaj Auto’s authorised service
network, more than 70% of the services
during post-warranty period happens in the
neighbourhood private garages. Hence, the
challenge — and the business opportunity — is
to make the company’s spare parts available
in not only the authorised service centres but
also the private garages and spare part shops
that dot the country. This is a high volume,
credit intensive business that requires mastery
over the supply of heterogeneous products. To
do so, Bajaj Auto created a separate channel
exclusively for distribution of spare parts in
2004-05. Today, the channel has 73 distributors,
who cater directly to over 15,000 retail shops
across the country. This channel now accounts
for over 70% of total spare parts sales of BAL.
The results demonstrate the success of the
channel; and the data suggests that there is still
scope for significant growth.
18
Operations
Plants
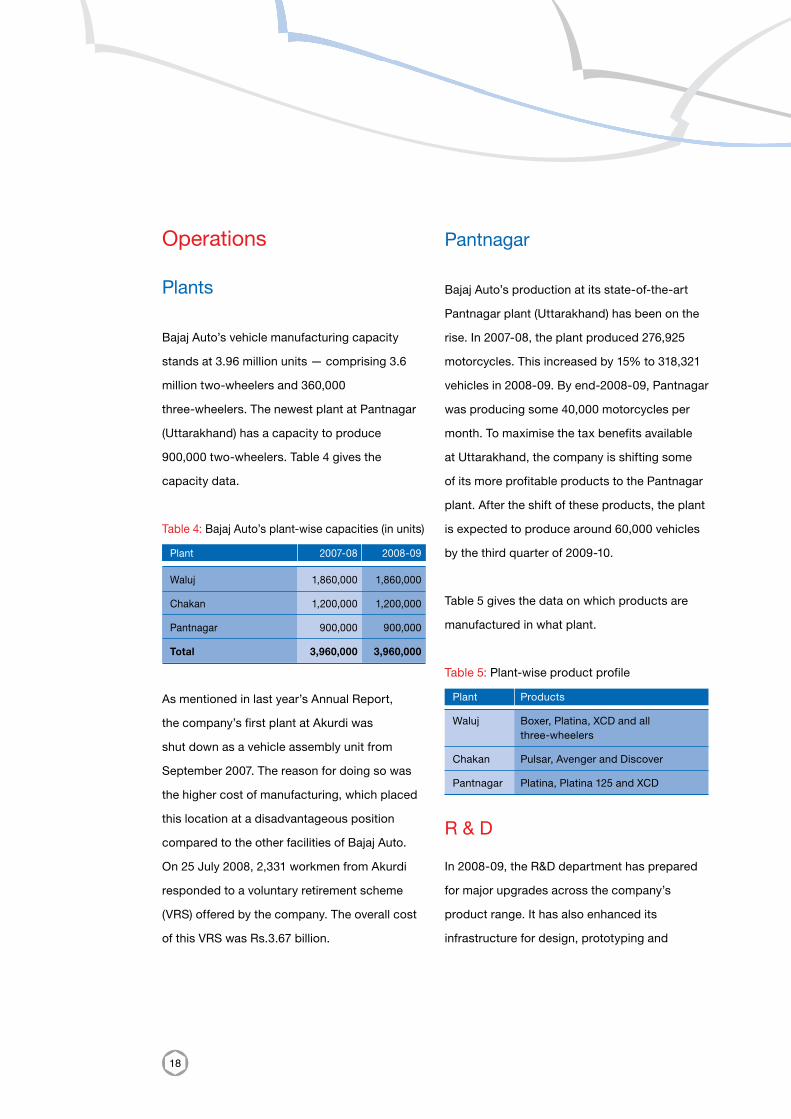
Bajaj Auto’s vehicle manufacturing capacity
stands at 3.96 million units — comprising 3.6
million two-wheelers and 360,000
three-wheelers. The newest plant at Pantnagar
(Uttarakhand) has a capacity to produce
900,000 two-wheelers. Table 4 gives the
capacity data.
Table 4: Bajaj Auto’s plant-wise capacities (in units)
Plant 2007-08 2008-09
Waluj 1,860,000 1,860,000
Chakan 1,200,000 1,200,000
Pantnagar 900,000 900,000
Total 3,960,000 3,960,000
As mentioned in last year’s Annual Report,
the company’s first plant at Akurdi was
shut down as a vehicle assembly unit from
September 2007. The reason for doing so was
the higher cost of manufacturing, which placed
this location at a disadvantageous position
compared to the other facilities of Bajaj Auto.
On 25 July 2008, 2,331 workmen from Akurdi
responded to a voluntary retirement scheme
(VRS) offered by the company. The overall cost
of this VRS was Rs.3.67 billion.
Pantnagar
Bajaj Auto’s production at its state-of-the-art
Pantnagar plant (Uttarakhand) has been on the
rise. In 2007-08, the plant produced 276,925
motorcycles. This increased by 15% to 318,321
vehicles in 2008-09. By end-2008-09, Pantnagar
was producing some 40,000 motorcycles per
month. To maximise the tax benefits available
at Uttarakhand, the company is shifting some
of its more profitable products to the Pantnagar
plant. After the shift of these products, the plant
is expected to produce around 60,000 vehicles
by the third quarter of 2009-10.
Table 5 gives the data on which products are
manufactured in what plant.
Table 5: Plant-wise product profile
Plant Products
Waluj Boxer, Platina, XCD and all three-wheelers
Chakan Pulsar, Avenger and Discover
Pantnagar Platina, Platina 125 and XCD
R & D
In 2008-09, the R&D department has prepared
for major upgrades across the company’s
product range. It has also enhanced its
infrastructure for design, prototyping and
19
20
testing. Two of the important products launched
during 2008-09 are listed below.
Platina 125 cc DTS-si
Platina 125 cc DTS-si brings the twin spark
technology with a special focus on fuel
efficiency to the Platina model. The bike has
an enhanced style as well as a new frame to
accommodate the DTS-si engine. The engine
manages to maintain the legendary fuel
economy of the Platina while giving almost 30%
more torque and 15% more power.
XCD 135 cc DTS-si
Bajaj Auto developed the XCD 135 cc DTS-si —
a model that brings excitement and sportiness
to the commuting world. Launched in February
2009, it has gained considerable acceptance in
the market. The XCD 135 cc has several 150 cc
features, which give it superior performance and
value. The bike is powered by a 135cc DTS-si
engine which gives over 10 bhp of power at
7,500 rpm; 1.18 kg-m of torque at 5,000 rpm;
and does 0-60 kph in 8 seconds. Despite such
power and torque, the XCD 135 DTS-si gives
a fuel consumption of 55 km per litre — in the
league of a 100cc engine while giving excellent
overall drive feel.
This bike also brings together features like
starter motor, five-speed gear box, split LED
tail lamps, Digital speedo with stepper motor
controlled tachometer, nitrogen filled shock
absorbers, fat rear tyres and a front disc brake,
DC ignition and DC head lamps. These features
make the XCD 135 cc DTS-si a very up market
product at extremely affordable prices.
In 2009-10, the company proposes to launch
two new models of Pulsar, including the 220 cc
variant, as well as new models to attack the
‘middle of the market’ in the deluxe commuter
segment. In addition, it is working on a new
135 cc model plus a new version of the Avenger.
The ‘Lite’ range of Bajaj Auto’s four-wheeler
vehicles, both in the passenger and cargo
segments, are under re-design to sharpen the
competitive positioning of the products. The
cargo version is expected to be
launched in 2011.
The techno-economic feasibility for the
proposed passenger car will be evaluated
by Bajaj Auto, Renault and Nissan for a final
decision — which will lead to firming up the
cooperation parameters among the partners
and a suitable Joint Venture agreement.
R&D has been also focusing on expanding its
design and testing teams. It has enhanced its
digital computational capabilities along with
the ability to prototype and test the products

21
to even higher standards. This has enabled
Bajaj Auto to design and produce ready-to-
manufacture prototypes for the new
generation products.
In addition, advanced machines have been
installed in the prototype shop to enable quick
and precise building and inspection of parts.
Moreover, the testing areas have been enhanced
with special equipments to enable performance
and durability testing from component to
full assembly — resulting in end-to-end self
sufficiency of R&D department.
Subsidiaries
Bajaj Auto International Holdings BV (BAIH BV)
As mentioned last year, a 100% Netherlands
based subsidiary of Bajaj Auto (Bajaj Auto
International Holdings BV) was formed to focus
on international ventures, including possible
acquisitions. In 2007-08, BAIH BV invested
€98.36 million (Rs.5.68 billion) to acquire a
24.45% equity stake in KTM Power Sports
AG of Austria, Europe’s second largest sport
motorcycle manufacturer. With products such
as Motocross, Supermoto, Enduro and on-
road bike products like the Super Duke, KTM
is a strong brand in Europe and the USA. It is a
Vienna Stock Exchange listed company.
In the course of 2008-09, BAIH BV increased its
ownership of KTM’s shares to 31.72% at a cost
of €21.26 million.
PT Bajaj Indonesia (PT BAI)
PT BAI was incorporated in 2006-07 as
a subsidiary in Indonesia with an issued
and subscribed capital of US$ 12.5 million
(Rs.562 million). Bajaj Auto holds 97.5% shares
in PT BAI, with the balance being held by the
local partner.
The subsidiary assembles and markets Pulsars
in Indonesia. During 2008-09, the XCD was also
launched through PT BAI. Being in the early
stages of market development and given that it
assembles semi-knocked down parts at higher
customs duties, PT BAI has not yet broken even.
However, Bajaj Auto plans to move into assembling
of completely knocked down parts in the latter half
of 2009-10 — which will attract lower duties — and
also expand PT BAI’s product portfolio. Given the
nature of the business, especially that of garnering
a significant market presence in a new and highly
competitive market, the gestation period is
expected to be long.
22
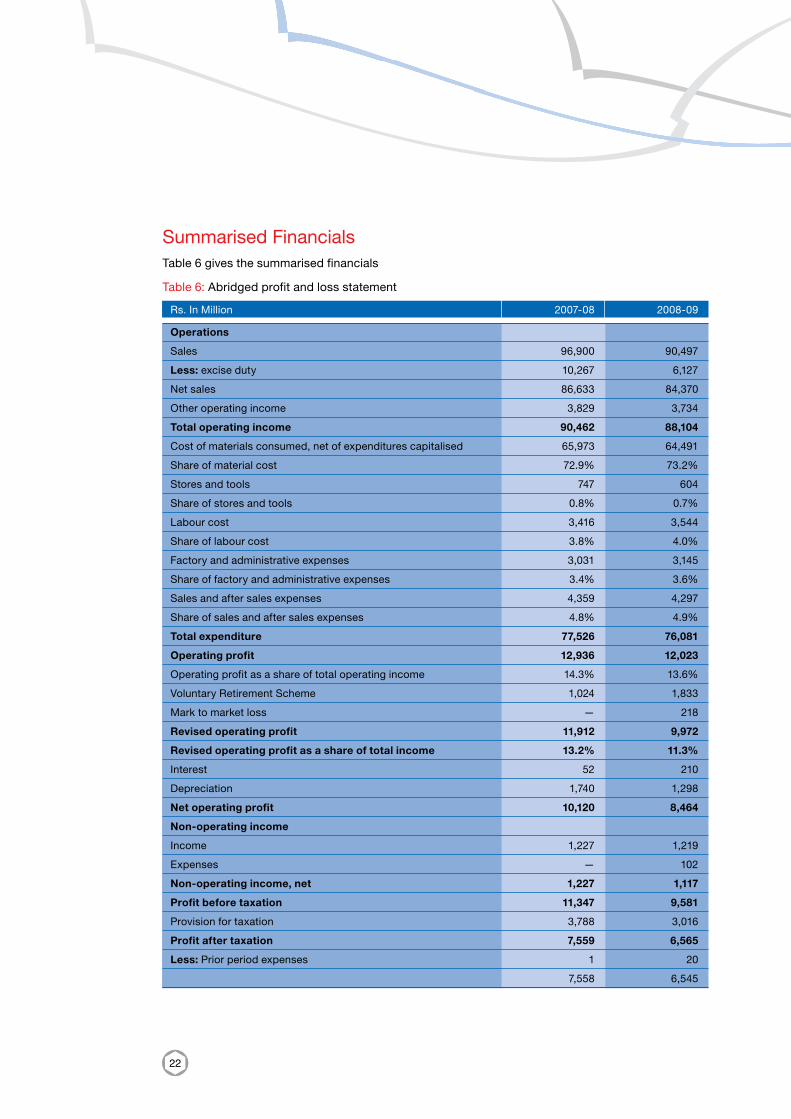
Summarised FinancialsTable 6 gives the summarised financials
Table 6: Abridged profit and loss statement
Rs. In Million 2007-08 2008-09
Operations
Sales 96,900 90,497
Less: excise duty 10,267 6,127
Net sales 86,633 84,370
Other operating income 3,829 3,734
Total operating income 90,462 88,104
Cost of materials consumed, net of expenditures capitalised 65,973 64,491
Share of material cost 72.9% 73.2%
Stores and tools 747 604
Share of stores and tools 0.8% 0.7%
Labour cost 3,416 3,544
Share of labour cost 3.8% 4.0%
Factory and administrative expenses 3,031 3,145
Share of factory and administrative expenses 3.4% 3.6%
Sales and after sales expenses 4,359 4,297
Share of sales and after sales expenses 4.8% 4.9%
Total expenditure 77,526 76,081
Operating profit 12,936 12,023
Operating profit as a share of total operating income 14.3% 13.6%
Voluntary Retirement Scheme 1,024 1,833
Mark to market loss — 218
Revised operating profit 11,912 9,972
Revised operating profit as a share of total income 13.2% 11.3%
Interest 52 210
Depreciation 1,740 1,298
Net operating profit 10,120 8,464
Non-operating income
Income 1,227 1,219
Expenses — 102
Non-operating income, net 1,227 1,117
Profit before taxation 11,347 9,581
Provision for taxation 3,788 3,016
Profit after taxation 7,559 6,565
Less: Prior period expenses 1 20
7,558 6,545

23
Foreign Exchange Transactions
The Board of Directors of Bajaj Auto has
approved the company’s foreign exchange
management and risk policy. In line with this
policy, Bajaj Auto covers its foreign exchange
exposure only in the currency in which it
transacts the underlying export business.
Thus, it does not enter into any cross-currency
derivative contracts.
Given the rising trend of the Indian rupee in the
second half of 2007-08, Bajaj Auto had taken
a forward cover for part of its exports at an
average rate of Rs.40.27 = USD 1 for the whole
of 2008-09. At this average rate, the company
covered its budgeted costs and profits.
However, with the rupee depreciating sharply
starting from April 2008, Bajaj Auto lost an
opportunity to make extra profits on the treasury
side. This opportunity cost was Rs.2.91 billion.
For the next year, i.e. 2009-10, the company has
entered into a Range Forward-Options Contract.
What this means is that if the rupee remains
within the range, the company will get the benefit
of the spot rate. For example, for a Range
Forward-Options Contract of Rs. 47 to
Rs. 57 per USD, if the rupee goes below Rs. 47 to
a dollar, the company gains by being protected at
Rs.47 = USD 1. However, if it weakens and goes
above Rs.57 to a dollar, the company loses the
difference. These are zero cost options.
Operating Working Capital
Table 7 gives Bajaj Auto’s operating working
capital. In the cash strapped situation of
H2 2008-09, the management consciously took
a call to support its vendors, by significantly
reducing payment cycle. This, and the rise in
export debtors, shows up in an increase in
operating working capital as at 31 March 2009.
Table 7: Operating working capital
Rs. In Million As at As at 31 March 2008 31 March 2009
Current assets
Inventories 3,496 3,388
Sundry debtors 2,753 3,587
Cash and bank balances 561 1,369
VAT receivable 1,311 1,408
Excise duty receivable on export 399 2,061
Other current assets 2,728 3,239
Sub-total 11,248 15,052
Less: Current liabilities
Sundry creditors 8,788 8,000
Annuity payable 657 2,813
Advance against orders 948 1,196
Other current liabilities 1,032 1,598
Sub-total 11,425 13,607
Working capital (177) 1,445
24
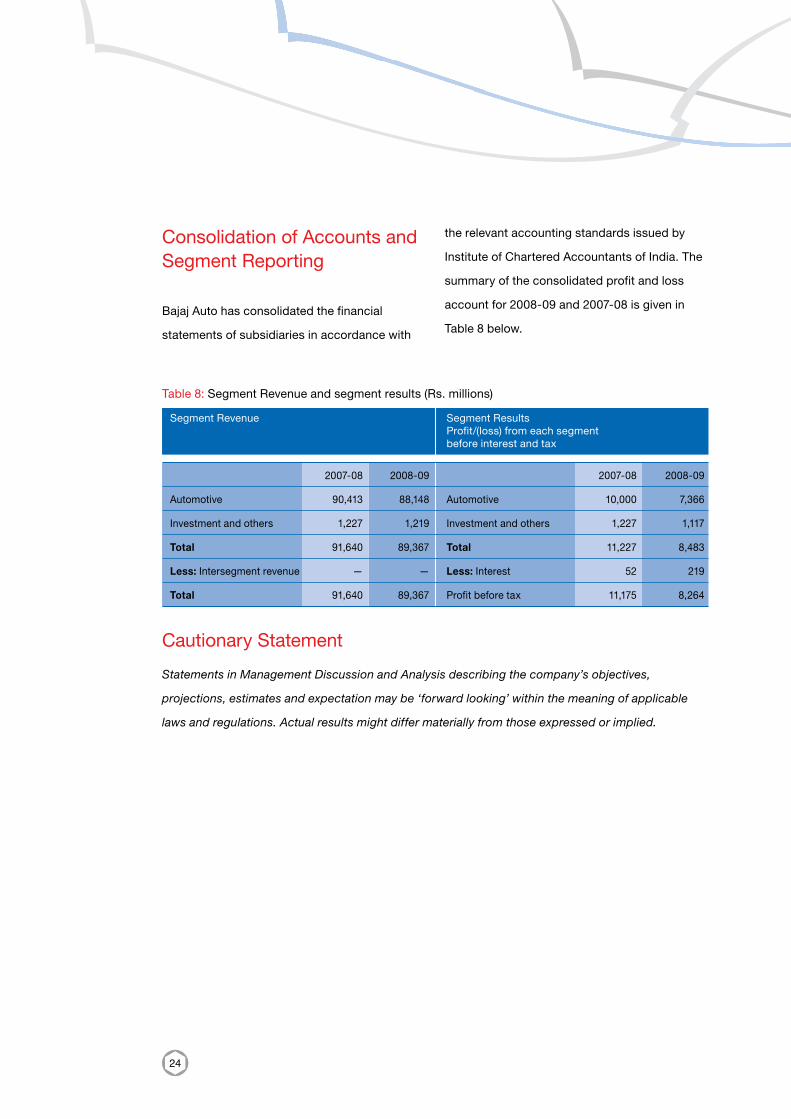
Consolidation of Accounts and Segment Reporting
Bajaj Auto has consolidated the financial
statements of subsidiaries in accordance with
the relevant accounting standards issued by
Institute of Chartered Accountants of India. The
summary of the consolidated profit and loss
account for 2008-09 and 2007-08 is given in
Table 8 below.
Table 8: Segment Revenue and segment results (Rs. millions)
Segment Revenue Segment Results Profit/(loss) from each segment before interest and tax
2007-08 2008-09 2007-08 2008-09
Automotive 90,413 88,148 Automotive 10,000 7,366
Investment and others 1,227 1,219 Investment and others 1,227 1,117
Total 91,640 89,367 Total 11,227 8,483
Less: Intersegment revenue — — Less: Interest 52 219
Total 91,640 89,367 Profit before tax 11,175 8,264
Cautionary Statement
Statements in Management Discussion and Analysis describing the company’s objectives,
projections, estimates and expectation may be ‘forward looking’ within the meaning of applicable
laws and regulations. Actual results might differ materially from those expressed or implied.
25
26
The commitment of Bajaj Group to the highest
standards of good corporate governance
practices predates SEBI and clause 49 of the
listing agreements. Transparency, fairness,
disclosure and accountability are central to
the working of the Bajaj Group. Bajaj Auto
Limited (‘BAL’ or ‘the company’ or ‘Bajaj Auto’)
maintains the same tradition and commitment.
Given below are the company’s corporate
governance policies and practices for 2008-09.
Board of directors
In keeping with the commitment of the
management for the principle of integrity and
Corporate Governance
transparency in business operations for good
corporate governance, the company’s policy
is to have an appropriate blend of executive
and independent directors to maintain the
independence of the board, and to separate
the board functions of governance and
management.
Composition
As on 31 March 2009, the board of
Bajaj Auto consisted of sixteen directors, of
whom four directors were executive. Nine out
of the twelve non-executive directors were
independent. The board has no institutional
nominee directors.
27
According to clause 49, if the chairman is
executive, at least one half of the board should
consist of non-executive, independent directors.
As Table 1 below shows, this provision is met at
Bajaj Auto.
Non-executive directors’ compensation
The non-executive directors of the company
were paid sitting fee of Rs.20,000 per
meeting for every meeting of the board and
its committees and commission at the rate
of Rs.50,000 per meeting of the board and
its committees attended by them. In addition
to this, non-executive directors may be paid
commission on a case to case basis depending
on the services rendered for the company within
the overall ceiling of one percent of net profit of
the company in the aggregate.
The company currently does not have a stock
option programme for the non-executive
directors.
Board procedures
During 2008-09, the board of directors met six
times: on 22 May 2008, 10 July 2008,
11 September 2008, 23 October 2008, 16 January
2009 and 25 March 2009. The gap between any
two meetings has been less than four months.
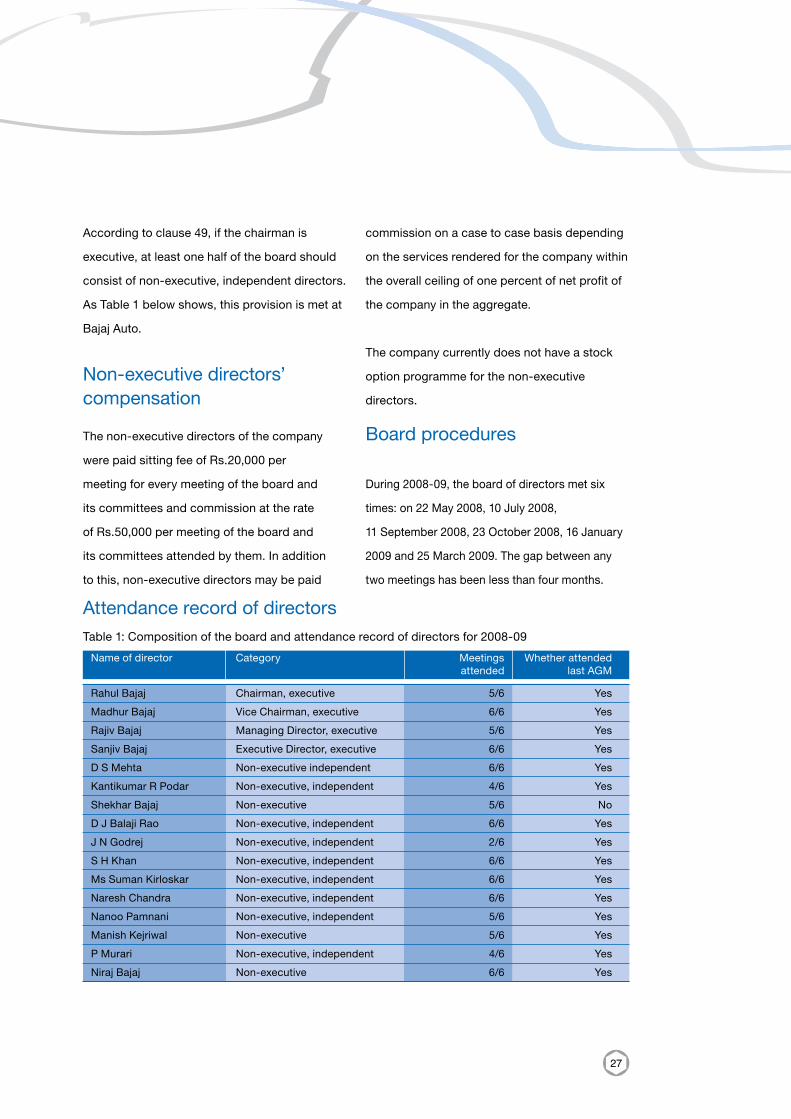
Attendance record of directorsTable 1: Composition of the board and attendance record of directors for 2008-09
Name of director Category Meetings Whether attended attended last AGM
Rahul Bajaj Chairman, executive 5/6 Yes
Madhur Bajaj Vice Chairman, executive 6/6 Yes
Rajiv Bajaj Managing Director, executive 5/6 Yes
Sanjiv Bajaj Executive Director, executive 6/6 Yes
D S Mehta Non-executive independent 6/6 Yes
Kantikumar R Podar Non-executive, independent 4/6 Yes
Shekhar Bajaj Non-executive 5/6 No
D J Balaji Rao Non-executive, independent 6/6 Yes
J N Godrej Non-executive, independent 2/6 Yes
S H Khan Non-executive, independent 6/6 Yes
Ms Suman Kirloskar Non-executive, independent 6/6 Yes
Naresh Chandra Non-executive, independent 6/6 Yes
Nanoo Pamnani Non-executive, independent 5/6 Yes
Manish Kejriwal Non-executive 5/6 Yes
P Murari Non-executive, independent 4/6 Yes
Niraj Bajaj Non-executive 6/6 Yes
28
Information supplied to the board
In advance of each meeting, the board is
presented with the relevant information on
various matters related to the working of
the company, especially those that require
deliberation at the highest level. Presentations
are also made to the board by the different
functional heads on various issues concerning
the company from time to time. Directors
have separate and independent access to
senior management at all times. In addition to
items which are required to be placed before
the board for its noting and / or approval,
information is provided on various significant
items. In terms of quality and importance,
the information supplied by management to
the board of the company is far ahead of the
list mandated under clause 49 of the listing
agreement.
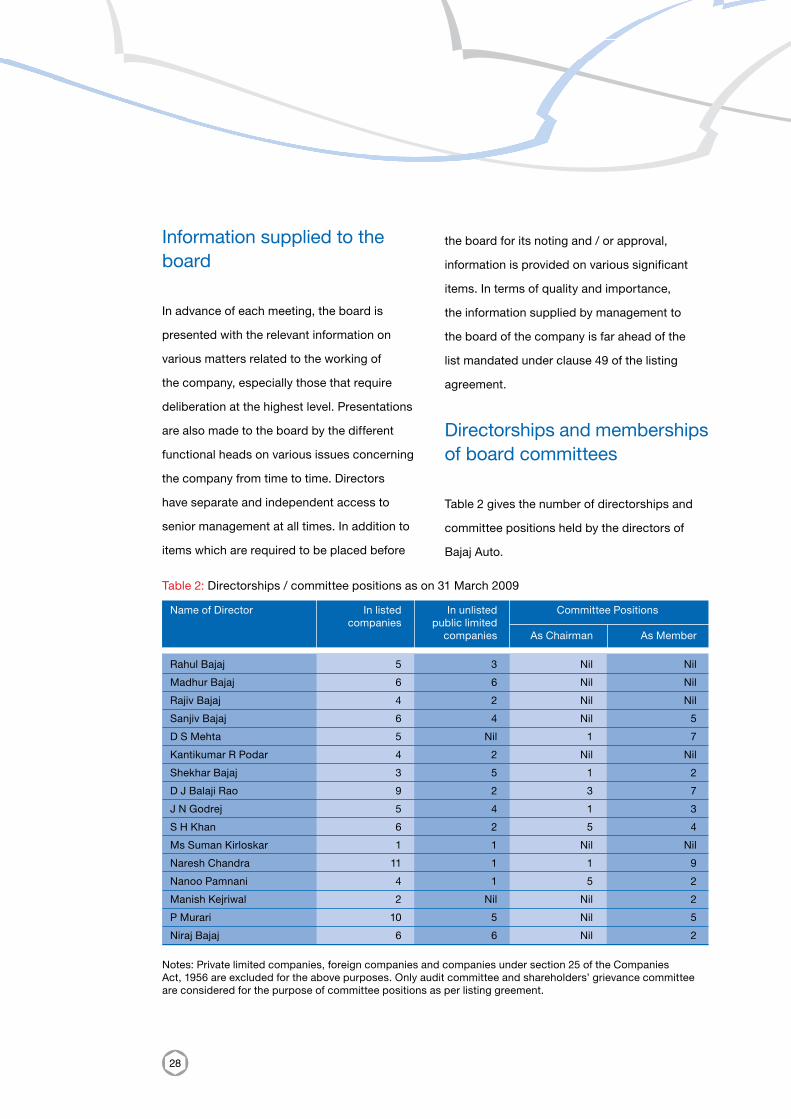
Directorships and memberships of board committees
Table 2 gives the number of directorships and
committee positions held by the directors of
Bajaj Auto.
Table 2: Directorships / committee positions as on 31 March 2009
Name of Director In listed In unlisted Committee Positions companies public limited companies As Chairman As Member
Rahul Bajaj 5 3 Nil Nil
Madhur Bajaj 6 6 Nil Nil
Rajiv Bajaj 4 2 Nil Nil
Sanjiv Bajaj 6 4 Nil 5
D S Mehta 5 Nil 1 7
Kantikumar R Podar 4 2 Nil Nil
Shekhar Bajaj 3 5 1 2
D J Balaji Rao 9 2 3 7
J N Godrej 5 4 1 3
S H Khan 6 2 5 4
Ms Suman Kirloskar 1 1 Nil Nil
Naresh Chandra 11 1 1 9
Nanoo Pamnani 4 1 5 2
Manish Kejriwal 2 Nil Nil 2
P Murari 10 5 Nil 5
Niraj Bajaj 6 6 Nil 2
Notes: Private limited companies, foreign companies and companies under section 25 of the Companies Act, 1956 are excluded for the above purposes. Only audit committee and shareholders’ grievance committee are considered for the purpose of committee positions as per listing greement.
29
None of the directors was a member in more
than 10 committees, nor a chairman in more
than five committees across all companies in
which he / she was a director.
Review of legal compliance reports
During the year, the board periodically reviewed
compliance reports with respect to the various
laws applicable to the company, as prepared
and placed before it by the management.
Code of conduct
The board at its meeting on 30 January 2008
laid down a code of conduct for all directors and
senior management of the company, which has
been posted on the website www.bajajauto.com.
All directors and senior management personnel
have affirmed compliance with the code for
2008-09. A declaration to this effect signed by
the Managing Director / Chief Executive Officer is
given in this annual report.
Audit committee
Constitution and composition
With a view to comply with various requirements
under the Companies Act, 1956 and clause 49
of the listing agreement, the company has set
up its audit committee in the board of directors
meeting held on 30 January 2008. The present
audit committee consists of the
following directors :
1. S H Khan, Chairman
2. D J Balaji Rao
3. J N Godrej
4. Naresh Chandra
5. Nanoo Pamnani
All members of the audit committee are
independent, non-executive directors and are
‘financially literate’ as required by clause 49.
Moreover, S H Khan, D J Balaji Rao, J N Godrej
and Nanoo Pamnani have ‘accounting or related
financial management expertise’.
Meetings, attendance and topics discussed
During 2008-09, the audit committee met four
times: 22 May 2008, 10 July 2008,
23 October 2008 and 16 January 2009. The
meetings were scheduled well in advance. In
addition to the members of the audit committee,
these meetings were attended by the heads
of finance and internal audit functions, the
statutory auditors and cost auditors of the
company, and those executives who were
considered necessary for providing inputs to the
committee. The company secretary acted as the
secretary to the audit committee.
30
The terms of reference of the audit committee
are extensive and go beyond what is mandated
in clause 49 of the listing agreement and section
292A of the Companies Act, 1956.
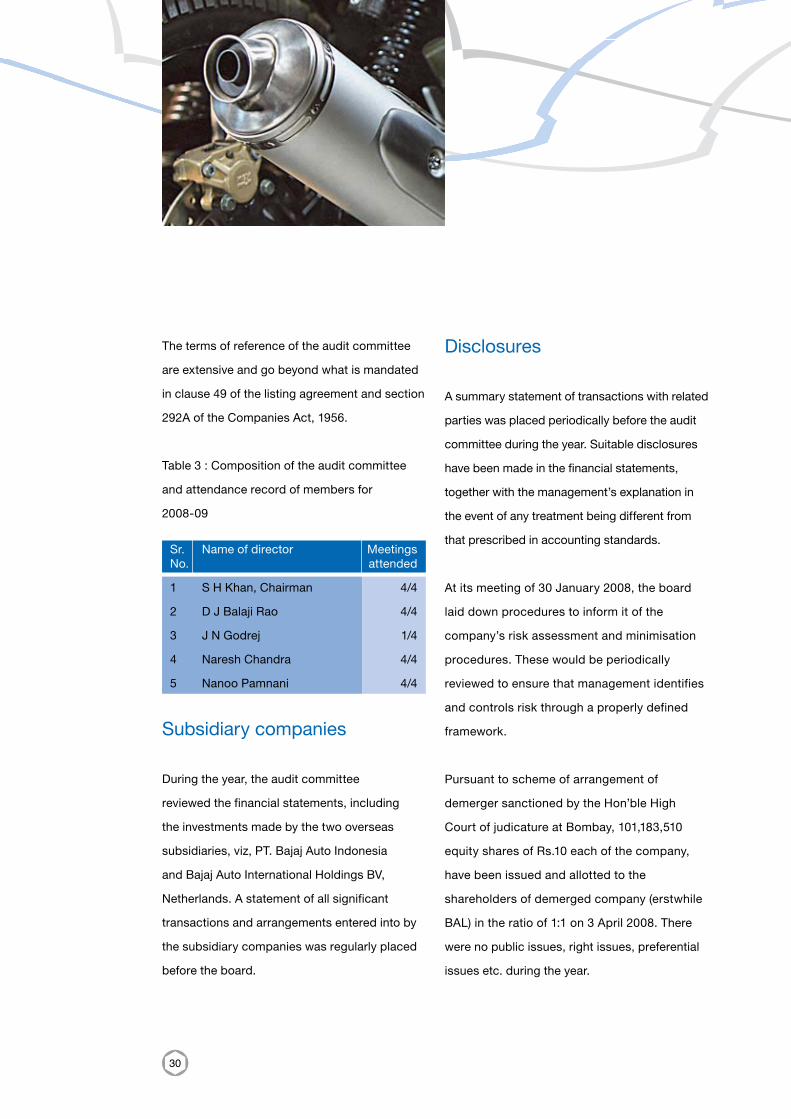
Table 3 : Composition of the audit committee
and attendance record of members for
2008-09
Sr. Name of director Meetings No. attended
1 S H Khan, Chairman 4/4
2 D J Balaji Rao 4/4
3 J N Godrej 1/4
4 Naresh Chandra 4/4
5 Nanoo Pamnani 4/4
Subsidiary companies
During the year, the audit committee
reviewed the financial statements, including
the investments made by the two overseas
subsidiaries, viz, PT. Bajaj Auto Indonesia
and Bajaj Auto International Holdings BV,
Netherlands. A statement of all significant
transactions and arrangements entered into by
the subsidiary companies was regularly placed
before the board.
Disclosures
A summary statement of transactions with related
parties was placed periodically before the audit
committee during the year. Suitable disclosures
have been made in the financial statements,
together with the management’s explanation in
the event of any treatment being different from
that prescribed in accounting standards.
At its meeting of 30 January 2008, the board
laid down procedures to inform it of the
company’s risk assessment and minimisation
procedures. These would be periodically
reviewed to ensure that management identifies
and controls risk through a properly defined
framework.
Pursuant to scheme of arrangement of
demerger sanctioned by the Hon’ble High
Court of judicature at Bombay, 101,183,510
equity shares of Rs.10 each of the company,
have been issued and allotted to the
shareholders of demerged company (erstwhile
BAL) in the ratio of 1:1 on 3 April 2008. There
were no public issues, right issues, preferential
issues etc. during the year.
31
Remuneration & Nomination Committee
At the meeting of the board of directors held on
30 January 2008, remuneration committee was
constituted with the following non-executive
independent directors as its members :
1. D J Balaji Rao, Chairman
2. S H Khan
3. Naresh Chandra
Subsequently, at the meeting of the board
of directors held on 16 January 2009, the
board has extended the terms of reference
of the existing remuneration committee so as
to include the duties to assist the board for
having a formal and transparent procedure in
making board appointments. Accordingly, the
existing remuneration committee was restyled
as ‘remuneration and nomination committee’
and Rahul Bajaj was inducted as member of this
committee in light of the extended scope.
The committee now has the following members :
1. D J Balaji Rao, Chairman
2. S H Khan
3. Naresh Chandra
4. Rahul Bajaj
The remuneration and nomination committee
met on 25 March 2009 and recommended the
re-appointment of Sanjiv Bajaj as Executive
Director for a period of five years commencing
from 1 April 2009 to 31 March 2014 and also the
terms of remuneration payable to Sanjiv Bajaj,
during this tenure.
Remuneration of directors
Pecuniary relationship or transactions of non-executive directors
1. J N Godrej is a director and shareholder of
Godrej & Boyce Manufacturing Company
Limited, which is a vendor to Bajaj Auto.
Purchases of goods from this company has
been in the ordinary course of business
and, for the year ended 31 March 2009,
amounted to Rs. 7.1 million.
2. Shekhar Bajaj is a director of
Bajaj Electricals Ltd. During the year under
review, the total value of services availed
by Bajaj Auto from Bajaj Electricals Ltd.
amounted to Rs. 22.8 million.
3. Shekhar Bajaj is a director of Hind Musafir
Agency Limited, an accredited travel
agency. During the year under review, the
total value of services availed of by
Bajaj Auto from Hind Musafir Agency
Limited amounted to Rs. 79.1 million.
4. The register of contracts maintained by
the company under section 301 of the
Companies Act, 1956, contains record of
32
the transactions entered into with the above
companies. The register is signed by all
the directors present during the respective
board meetings.
Criteria of making payments to non-executive directors
Non-executive directors of the company play a
crucial role in the independent functioning of the
board. They bring in an external perspective to
decision-making, and provide leadership and
strategic guidance while maintaining objective
judgement. They also oversee corporate
governance framework of the company. The
criteria of making payments to non-executive
directors as approved by the board at its meeting
held on 30 January 2008 has been put on the
company’s website www.bajajauto.com
Non-executive directors
Non-executive directors are paid sitting fees
and commission on net profits as separately
stated in this report.
Executive directors
During the year under review, there was no
change in the terms of remuneration paid to
Rahul Bajaj, Madhur Bajaj,
Rajiv Bajaj and Sanjiv Bajaj. On their
retirement, all the executive directors are
entitled to superannuation benefits payable in
the form of an annuity from the Life Insurance
Corporation of India — and these form a part of
the perquisites allowed to them. No pension is
paid by the company.
The company has no stock option plans for
the directors and hence it does not form a
part of the remuneration package payable to
any executive and / or non-executive director.
During the year under review, none of the
directors was paid any performance-linked
incentive. In 2008-09, the company did not
advance any loans to any of the executive and
/ or non-executive directors. Table 4 gives
details of the remuneration paid or payable to
directors during 2008-09.

33
Table 4: Remuneration paid / payable to directors during 2008-09
Name of director Relationship with Sitting Salary & Commission Total other directors fees perquisites Rs. Rs. Rs. Rs.
Rahul Bajaj Father of Rajiv Bajaj, Sanjiv Bajaj, father-in-law of Manish Kejriwal Nil 26,689,888 36,000,000 62,689,888
Madhur Bajaj Brother of Shekhar Bajaj & Niraj Bajaj Nil 16,203,876 25,200,000 41,403,876
Rajiv Bajaj Son of Rahul Bajaj, brother of Sanjiv Bajaj, brother-in-law of Manish Kejriwal Nil 11,517,213 21,600,000 33,117,213
Sanjiv Bajaj Son of Rahul Bajaj, brother of Rajiv Bajaj, brother-in-law of Manish Kejriwal Nil 2,621,457 6,300,000 8,921,457
D S Mehta — 120,000 — 300,000 420,000
Kantikumar R Podar — 80,000 — 200,000 280,000
Shekhar Bajaj Brother of Madhur Bajaj & Niraj Bajaj 100,000 — 250,000 350,000
D J Balaji Rao — 240,000 — 600,000 840,000
J N Godrej — 80,000 — 200,000 280,000
S H Khan — 240,000 — 600,000 840,000
Suman Kirloskar — 120,000 — 300,000 420,000
Naresh Chandra — 240,000 — 600,000 840,000
Nanoo Pamnani — 180,000 — 450,000 630,000
Manish Kejriwal Son-in-law of Rahul Bajaj, brother-in-law of Rajiv Bajaj and Sanjiv Bajaj 100,000 — 250,000 350,000
P Murari — 80,000 — 200,000 280,000
Niraj Bajaj Brother of Madhur Bajaj & Shekhar Bajaj 120,000 — 300,000 420,000
Notes: Salary and perquisites include all elements of remuneration i.e. salary, allowances and benefits. No bonus, pension or incentive is paid to any of the directors. The company has not issued any stock options to any of the directors. The term of executive directors does not exceed five years.
34
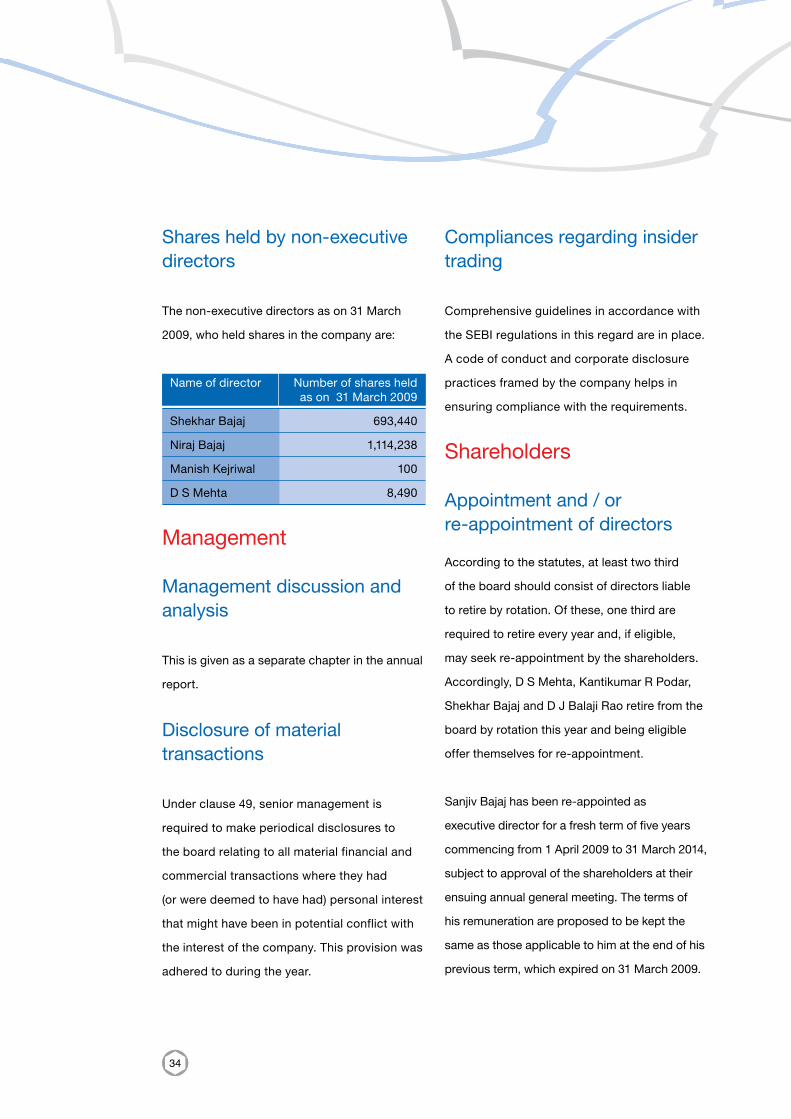
Shares held by non-executive directors
The non-executive directors as on 31 March
2009, who held shares in the company are:
Name of director Number of shares held as on 31 March 2009
Shekhar Bajaj 693,440
Niraj Bajaj 1,114,238
Manish Kejriwal 100
D S Mehta 8,490
Management
Management discussion and analysis
This is given as a separate chapter in the annual
report.
Disclosure of material transactions
Under clause 49, senior management is
required to make periodical disclosures to
the board relating to all material financial and
commercial transactions where they had
(or were deemed to have had) personal interest
that might have been in potential conflict with
the interest of the company. This provision was
adhered to during the year.
Compliances regarding insider trading
Comprehensive guidelines in accordance with
the SEBI regulations in this regard are in place.
A code of conduct and corporate disclosure
practices framed by the company helps in
ensuring compliance with the requirements.
Shareholders
Appointment and / or re-appointment of directors
According to the statutes, at least two third
of the board should consist of directors liable
to retire by rotation. Of these, one third are
required to retire every year and, if eligible,
may seek re-appointment by the shareholders.
Accordingly, D S Mehta, Kantikumar R Podar,
Shekhar Bajaj and D J Balaji Rao retire from the
board by rotation this year and being eligible
offer themselves for re-appointment.
Sanjiv Bajaj has been re-appointed as
executive director for a fresh term of five years
commencing from 1 April 2009 to 31 March 2014,
subject to approval of the shareholders at their
ensuing annual general meeting. The terms of
his remuneration are proposed to be kept the
same as those applicable to him at the end of his
previous term, which expired on 31 March 2009.
35
Brief profiles of the retiring directors and
Sanjiv Bajaj are given in the notice being issued
to the shareholders of the ensuing annual
general meeting of the company.
Communication to shareholders
Quarterly, half-yearly and annual financial results
are published in numerous leading dailies, such
as Business Standard, The Economic Times,
DNA – Money, Kesari and The Hindu. The official
press release is also issued. The company also
sends the half-yearly financial results, along
with a detailed write-up, to each household of
shareholders.
Bajaj Auto has its own website,
www.bajajauto.com, which contains all
important public domain information, including
presentations made to the media, analysts,
institutional investors. The website also
contains information on matters such as
dividend history, answers to frequently asked
queries (FAQs) by the various shareholder
categories and details of the corporate contact
persons. All financial and other vital official
news releases are also communicated to the
concerned stock exchanges, besides being
placed on the company’s website.
The company also files the following
information, statements, reports on the web-site
as specified by SEBI:
• Full version of the annual report including
the balance sheet, profit and loss
account, directors’ report and auditors’
report, cash flow statement, half-yearly
financial statement and quarterly financial
statements.
• Corporate governance report.
• Shareholding pattern.
Information on general body meetings
As the company was incorporated on
30 April 2007, the first annual general meeting of
the company was held on 10 July 2008 at
11.30 a.m. at the registered office of the company.
The shares of the company got listed for the first
time on 26 May 2008. Subsequent to this date, the
company has not passed any special resolution at
the general meetings of the company.
So far, the company has not adopted postal
ballot for passing any resolution at the general
meetings, because there has been no occasion
for doing so.
36
Material disclosure of related party transactions
Material transactions entered into with related
parties have been already disclosed in this
chapter. None of these have had any potential
conflict with the interests of the company.
Details of capital market non-compliance, if any
There has been no non-compliance by the
company of any legal requirements; nor has
there been any penalty, stricture imposed on
the company by any stock exchange, SEBI or
any statutory authority on any matter related to
capital markets during the period under review.
Shareholders’ and investors’ grievance committee
The board of directors of Bajaj Auto
constituted its shareholders’ and investors’
grievance committee in its meeting held
on 30 January 2008. This committee has
been constituted to specifically look into
the shareholders’ and investors’ complaints
on matters relating to transfer of shares,
non-receipt of annual report, non-receipt of
dividend etc. In addition, the committee also
looks into matters that can facilitate better
investor services and relations.
The committee consisted of the following
non-executive independent directors as on
31 March 2009:
1. D J Balaji Rao, Chairman
2. J N Godrej
3. Naresh Chandra
4. S H Khan
During the year under review, the committee
met on 25 March 2009 to review the status of
investors’ services rendered. All members were
present at the meeting. The secretarial auditor
as well as company secretary (who is also the
compliance officer) were also present.
During the year under review, the company
appointed Karvy Computershare Pvt. Ltd. as its
share transfer agent.
37
38
More details have been furnished in the chapter
on Additional Shareholder Information.
CEO / CFO certification
The CEO and CFO have certified to the board
with regard to the financial statements and other
matters as required by clause 49 of the listing
agreement. The certificate is contained in this
annual report.
Report on corporate governance
This chapter, read together with the information
given in the chapters on Management
Discussion and Analysis and Additional
Shareholder Information, constitute the
compliance report on corporate governance
during 2008-09.
Auditors’ certificate on corporate governance
The company has obtained the certificate from
its statutory auditors regarding compliance
with the provisions relating to corporate
governance laid down in clause 49 of the
listing agreement. This report is annexed to the
directors’ report, and will be sent to the stock
exchanges along with the annual return to be
filed by the company.
Compliance of mandatory and non-mandatory requirements under clause 49
Mandatory
The company has complied with all the
mandatory requirements of clause 49 of the
listing agreement.
Non-mandatory
The company has also complied with the
non-mandatory requirements as under :
1. The Board
The requirement regarding non-executive
chairman is not applicable, since the
chairman of the company is executive
chairman.
None of the nine independent directors of
the company have tenures exceeding a
period of nine years on the board.
39
2. Remuneration committee
The company has a remuneration
committee. A detailed note on this
committee is provided in the annual report.
3. Shareholder rights
A half-yearly declaration of financial
performance including summary of significant
events in the preceding six months, is sent to
each household of shareholders.
4. Audit qualifications
There are no qualifications in the financial
statements of the company for the year
2008-09.
5. Whistle blower policy
The company has a whistle blower
policy to enable employees to report to
the management their concerns about
unethical behaviour, actual or suspected
fraud or violation of company’s code of
conduct or ethics policy. This mechanism
provides safeguards against victimisation
of employees, who avail of the mechanism.
This also provides for direct access to
the chairman of the audit committee in
exceptional cases. The policy has been
appropriately communicated to the
employees within the organisation.
40
Annual general meeting
Date : 16 July 2009
Time : 11.30 a.m.
Venue : Registered office at Mumbai-Pune
Road, Akurdi, Pune 411 035
Financial calendar
Audited annual results for year ending 31 March - May
Mailing of annual reports - June
Annual general meeting - July
Unaudited first quarter financial results - July
Unaudited second quarter financial results - October
Unaudited third quarter financial results - January
Additional Shareholder Information
Dividend
The board of directors of Bajaj Auto has
proposed a dividend of Rs.22 per equity share
(220 per cent) for the financial year 2008-09,
subject to approval by the shareholders at the
annual general meeting. Dividend paid in the
previous year was Rs.20 per equity share (200
percent).
Dates of book closure
The register of members and share transfer
books of the company will remain closed from
Saturday, 4 July 2009 to Thursday, 16 July 2009,
both days inclusive.
41
Date of dividend payment
The payment of dividend, upon declaration by the
shareholders at the forthcoming annual general
meeting, will be made on or after 20 July 2009:
a) to all those beneficial owners holding
shares in electronic form, as per the
ownership data made available to the
company by National Securities Depository
Limited (NSDL) and the Central Depository
Services (India) Limited (CDSL) as of the
end-of-the-day on Friday, 3 July 2009; and
b) to all those shareholders holding shares
in physical form, after giving effect to all
the valid share transfers lodged with the
company on or before the closing hours on
Friday, 3 July 2009.
Payment of dividend
Dividend will be paid by account payee / non-
negotiable instruments or through the electronic
clearing service (ECS), as notified by the SEBI
through the stock exchanges. In view of the
significant advantages and the convenience,
the company will pay dividend through ECS in
all major cities to cover maximum number of
shareholders, as per applicable guidelines.
Shareholders are advised to refer to the notice
of the annual general meeting for details of
action required to be taken by them in this
regard. For additional details or clarifications,
shareholders are welcome to contact the
registered office of the company.
Unclaimed dividends
The shareholders who have not encashed
their dividend warrants for the year 2007-08
are requested to claim the amount from Karvy
Computershare Pvt Ltd / registered office of the
company.
As per section 205 of the Companies
Act, 1956, any money transferred by the
company to the unpaid dividend account and
remaining unclaimed for a period of seven
years from the date of such transfer shall
be transferred to a fund called ‘The Investor
Education and Protection Fund’ set up by the
central government. No claims shall lie against
the fund or the company in respect of amount
so transferred.
Registrar and share transfer agent
During the year under review, the company
appointed Karvy Computershare Pvt Ltd
as its share transfer agent and accordingly,
processing of share transfer / dematerialisation
/ rematerialisation and allied activities was
42
outsourced to Karvy Computershare Pvt Ltd,
Hyderabad with effect from 10 July 2008.
This transition was carried out smoothly after
obtaining the necessary approvals from both
the depositories.
Personal communications intimating the
appointment of share transfer agent were
sent to all the shareholders, in addition to
communications to stock exchanges and press
release on the website of the company.
All physical transfers, transmission,
transposition, issue of duplicate share
certificate/s, issue of demand drafts in lieu
of dividend warrants etc as well as requests
for dematerialisation / rematerialisation are
being processed in weekly cycles at Karvy
Computershare Pvt Ltd. The work related
to dematerialisation / rematerialisation is
handled by Karvy Computershare Pvt Ltd
through connectivities with National Securities
Depository Ltd and Central Depository Services
(India) Ltd.
Share transfer system
Share transfers received by the share transfer
agent / company would be registered within
15 days from the date of receipt, provided
the documents are complete in all respects.
Total number of shares transferred in physical
category during 2008-09 was 43,779,205.
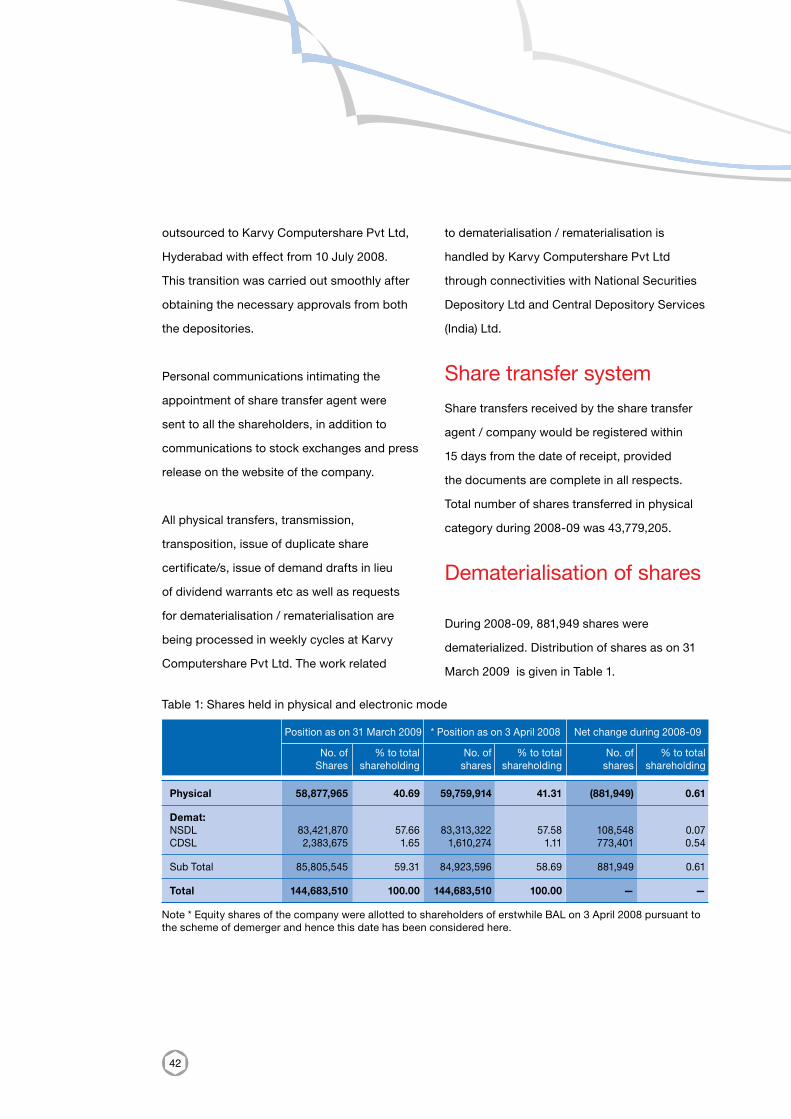
Dematerialisation of shares
During 2008-09, 881,949 shares were
dematerialized. Distribution of shares as on 31
March 2009 is given in Table 1.
Table 1: Shares held in physical and electronic mode
Position as on 31 March 2009 * Position as on 3 April 2008 Net change during 2008-09
No. of % to total No. of % to total No. of % to total Shares shareholding shares shareholding shares shareholding
Physical 58,877,965 40.69 59,759,914 41.31 (881,949) 0.61
Demat: NSDL 83,421,870 57.66 83,313,322 57.58 108,548 0.07CDSL 2,383,675 1.65 1,610,274 1.11 773,401 0.54
Sub Total 85,805,545 59.31 84,923,596 58.69 881,949 0.61
Total 144,683,510 100.00 144,683,510 100.00 — —
Note * Equity shares of the company were allotted to shareholders of erstwhile BAL on 3 April 2008 pursuant to the scheme of demerger and hence this date has been considered here.
43
Global depository receipts (GDRs)
Bajaj Auto issued and allotted Global Depository
Receipts (GDRs) on 3 April 2008 to the
shareholders of BHIL (formerly BAL) pursuant
to the scheme of demerger sanctioned by the
Hon’ble High Court of Judicature at Bombay
vide its order dated 18 December 2007 and
the underlying shares against each GDR were
issued in the name of the overseas depository,
i.e. Deutsche Bank Trust Company Americas
(DBTCA).
The company has entered into deposit
agreement with DBTCA on 21 August 2008. The
company is in the process of getting the said
GDRs listed on the London Stock Exchange in
due course of time.
Stock code
1. BSE, Mumbai 532977
2. National Stock Exchange BAJAJ-AUTO
3. ISIN for INE917I01010 Depositories (NSDL and CDSL)
4. Bloomberg BJAUT.IN
5. Reuters BAJA.BO
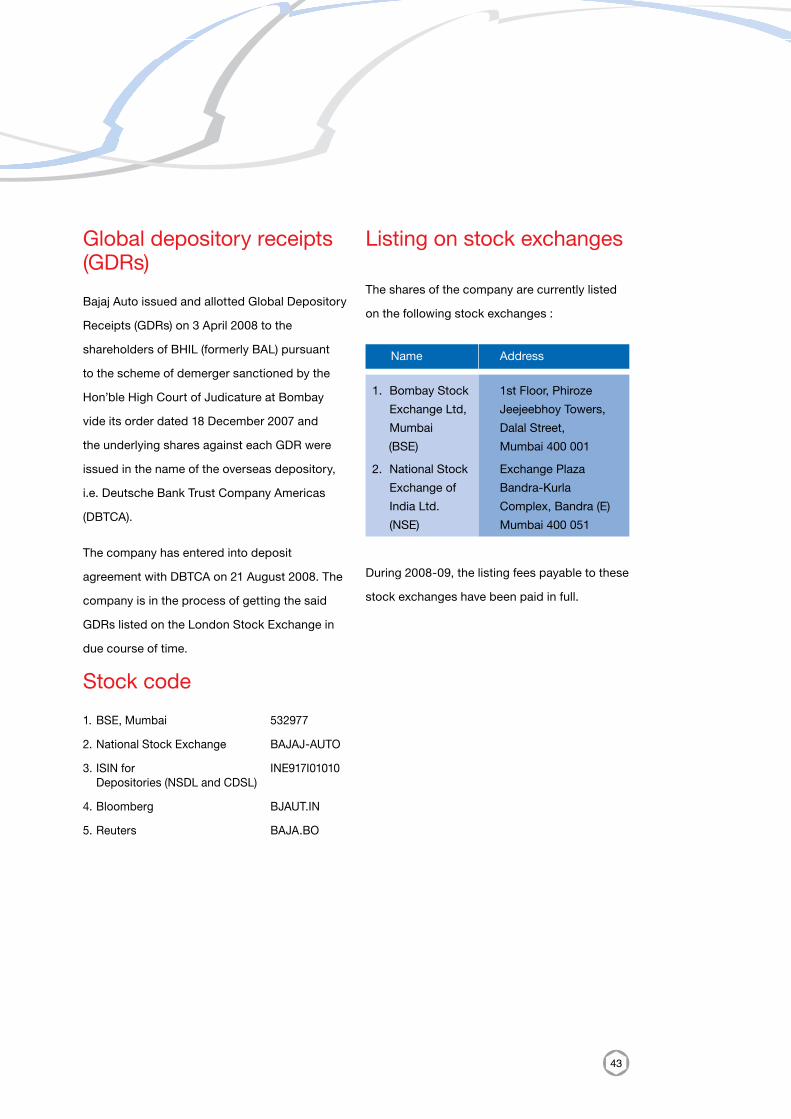
Listing on stock exchanges
The shares of the company are currently listed
on the following stock exchanges :
Name Address
1. Bombay Stock 1st Floor, Phiroze
Exchange Ltd, Jeejeebhoy Towers,
Mumbai Dalal Street,
(BSE) Mumbai 400 001
2. National Stock Exchange Plaza
Exchange of Bandra-Kurla
India Ltd. Complex, Bandra (E)
(NSE) Mumbai 400 051
During 2008-09, the listing fees payable to these
stock exchanges have been paid in full.

44
Market price data
Table 2 gives the monthly highs and lows of Bajaj Auto’s shares on the Bombay Stock Exchange Ltd.
(BSE) and National Stock Exchange of India Ltd. (NSE) :
Table 2: Monthly highs and lows of Bajaj Auto Ltd. shares during 2008-09 (Rs.) vis-a-vis BSE Sensex
Month BSE NSE Closing BSE High Low High Low Sensex
Apr-081 — — — — 17,287.31
May-08 945.00 543.00 898.00 538.00 16,415.57
Jun-08 618.00 436.10 615.00 435.00 13,461.60
Jul-08 544.90 395.00 539.00 390.15 14,355.75
Aug-08 612.95 490.00 590.25 501.00 14,564.53
Sep-08 641.00 530.15 641.90 535.25 12,860.43
Oct-08 615.05 435.00 617.00 425.00 9,788.06
Nov-08 550.00 307.15 550.00 305.50 9,092.72
Dec-08 444.00 294.65 440.00 262.00 9,647.31
Jan-09 502.00 378.00 503.25 377.00 9,424.24
Feb-09 536.00 445.00 539.00 441.15 8,891.61
Mar-09 635.00 480.10 640.00 477.00 9,708.50
1 Equity shares of the company were listed at BSE and NSE on 26 May 2008 and hence there are
no stock quotes for the period upto 25 May 2008.
45
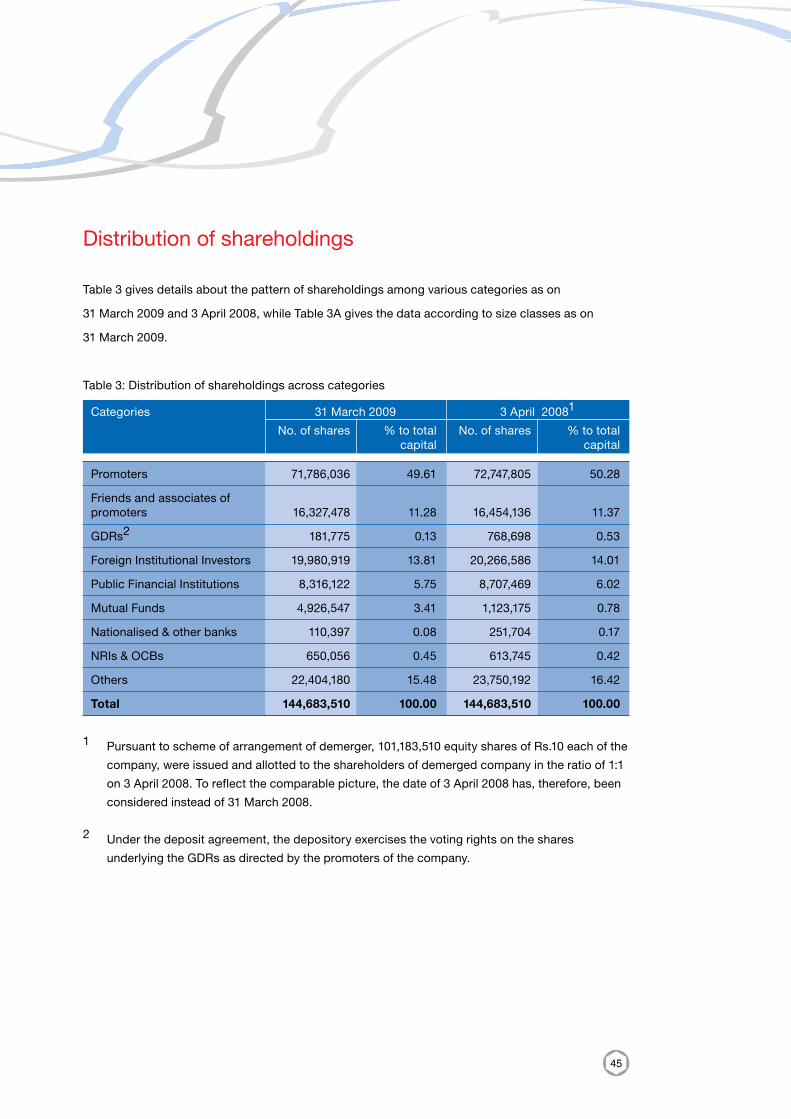
Distribution of shareholdings
Table 3 gives details about the pattern of shareholdings among various categories as on
31 March 2009 and 3 April 2008, while Table 3A gives the data according to size classes as on
31 March 2009.
Table 3: Distribution of shareholdings across categories
Categories 31 March 2009 3 April 20081
No. of shares % to total No. of shares % to total capital capital
Promoters 71,786,036 49.61 72,747,805 50.28
Friends and associates of promoters 16,327,478 11.28 16,454,136 11.37
GDRs2 181,775 0.13 768,698 0.53
Foreign Institutional Investors 19,980,919 13.81 20,266,586 14.01
Public Financial Institutions 8,316,122 5.75 8,707,469 6.02
Mutual Funds 4,926,547 3.41 1,123,175 0.78
Nationalised & other banks 110,397 0.08 251,704 0.17
NRIs & OCBs 650,056 0.45 613,745 0.42
Others 22,404,180 15.48 23,750,192 16.42
Total 144,683,510 100.00 144,683,510 100.00
1 Pursuant to scheme of arrangement of demerger, 101,183,510 equity shares of Rs.10 each of the
company, were issued and allotted to the shareholders of demerged company in the ratio of 1:1
on 3 April 2008. To reflect the comparable picture, the date of 3 April 2008 has, therefore, been
considered instead of 31 March 2008.
2 Under the deposit agreement, the depository exercises the voting rights on the shares
underlying the GDRs as directed by the promoters of the company.
46
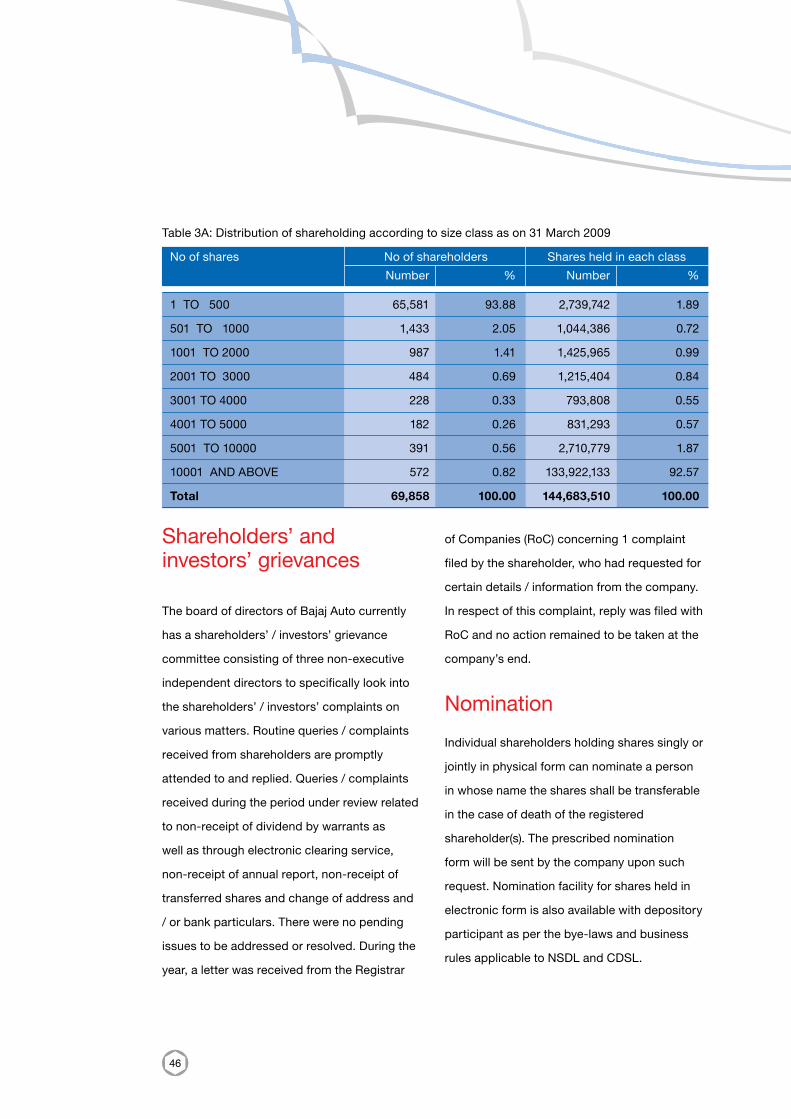
Table 3A: Distribution of shareholding according to size class as on 31 March 2009
No of shares No of shareholders Shares held in each class
Number % Number %
1 TO 500 65,581 93.88 2,739,742 1.89
501 TO 1000 1,433 2.05 1,044,386 0.72
1001 TO 2000 987 1.41 1,425,965 0.99
2001 TO 3000 484 0.69 1,215,404 0.84
3001 TO 4000 228 0.33 793,808 0.55
4001 TO 5000 182 0.26 831,293 0.57
5001 TO 10000 391 0.56 2,710,779 1.87
10001 AND ABOVE 572 0.82 133,922,133 92.57
Total 69,858 100.00 144,683,510 100.00
Shareholders’ and investors’ grievances
The board of directors of Bajaj Auto currently
has a shareholders’ / investors’ grievance
committee consisting of three non-executive
independent directors to specifically look into
the shareholders’ / investors’ complaints on
various matters. Routine queries / complaints
received from shareholders are promptly
attended to and replied. Queries / complaints
received during the period under review related
to non-receipt of dividend by warrants as
well as through electronic clearing service,
non-receipt of annual report, non-receipt of
transferred shares and change of address and
/ or bank particulars. There were no pending
issues to be addressed or resolved. During the
year, a letter was received from the Registrar
of Companies (RoC) concerning 1 complaint
filed by the shareholder, who had requested for
certain details / information from the company.
In respect of this complaint, reply was filed with
RoC and no action remained to be taken at the
company’s end.
Nomination
Individual shareholders holding shares singly or
jointly in physical form can nominate a person
in whose name the shares shall be transferable
in the case of death of the registered
shareholder(s). The prescribed nomination
form will be sent by the company upon such
request. Nomination facility for shares held in
electronic form is also available with depository
participant as per the bye-laws and business
rules applicable to NSDL and CDSL.
47
Plant locations
Bajaj Auto has plants located at the following
places:
1. Mumbai-Pune Road, Akurdi, Pune 411 035 (Maharashtra)
2. Bajaj Nagar, Waluj, Aurangabad 431 136 (Maharashtra)
3. MIDC, Plot No A1, Mahalunge Village, Chakan 410 501 Dist. Pune (Maharashtra)
4. Plot No.2, Sector 10, IIE Pantnagar, Udhamsinghnagar 263 531 (Uttarakhand)
Address for correspondence
Investors and shareholders can correspond with
the share transfer agent or at registered office of
the company at the following address:
Karvy Computershare Pvt Ltd
Plot No.17 to 24, Vittalrao Nagar,
Madhapur,
HYDERABAD 500 081
Contact persons
Mr M S Madhusudhan
Mr Mohd. Mohsinuddin
Tel No. (040) 23420815 to 824
(040) 23431598
e-mail : [email protected]
Website: www.karvy.com
Bajaj Auto Limited
Bajaj Auto Limited Complex
Mumbai-Pune Road
Akurdi, Pune 411 035.
Tel : (020) 27472851(Extn 6063), 27406063
Fax : (020) 27407380
e-mail : [email protected]
Website : www.bajajauto.com
48
Introduction
The directors present their second annual report and the audited statements of accounts for the
year ended 31 March 2009.
The highlights are as under:-
Sales 2008-09 2007-08 (Nos) (Nos)
Motorcycles 1,907,853 2,139,779
Other two-wheelers 11,772 21,316
Total Two wheelers 1,919,625 2,161,095
Three wheelers 274,529 290,312
Total Two & Three wheelers 2,194,154 2,451,407
Of the above, exports were
Two wheelers 633,463 482,026
Three wheelers 139,056 136,315
Total Exports 772,519 618,341
Directors’Report
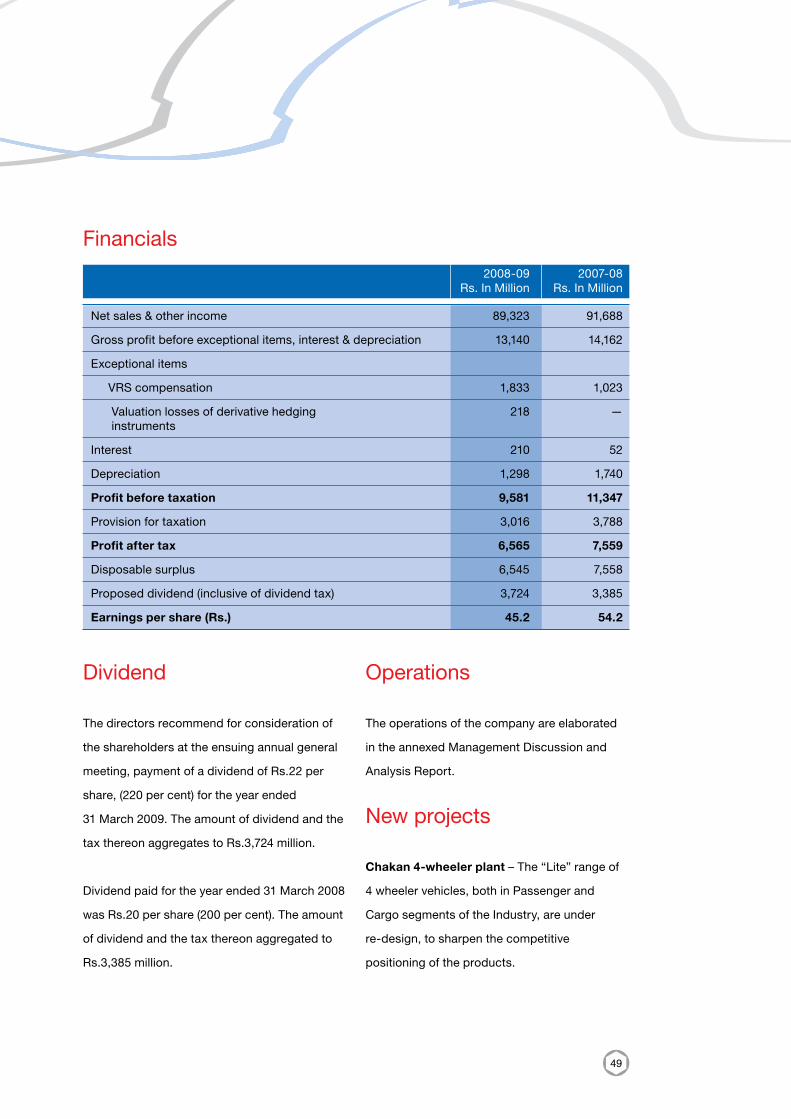
49
Financials
2008-09 2007-08 Rs. In Million Rs. In Million
Net sales & other income 89,323 91,688
Gross profit before exceptional items, interest & depreciation 13,140 14,162
Exceptional items
VRS compensation 1,833 1,023
Valuation losses of derivative hedging 218 — instruments
Interest 210 52
Depreciation 1,298 1,740
Profit before taxation 9,581 11,347
Provision for taxation 3,016 3,788
Profit after tax 6,565 7,559
Disposable surplus 6,545 7,558
Proposed dividend (inclusive of dividend tax) 3,724 3,385
Earnings per share (Rs.) 45.2 54.2
Dividend
The directors recommend for consideration of
the shareholders at the ensuing annual general
meeting, payment of a dividend of Rs.22 per
share, (220 per cent) for the year ended
31 March 2009. The amount of dividend and the
tax thereon aggregates to Rs.3,724 million.
Dividend paid for the year ended 31 March 2008
was Rs.20 per share (200 per cent). The amount
of dividend and the tax thereon aggregated to
Rs.3,385 million.
Operations
The operations of the company are elaborated
in the annexed Management Discussion and
Analysis Report.
New projects
Chakan 4-wheeler plant – The “Lite” range of
4 wheeler vehicles, both in Passenger and
Cargo segments of the Industry, are under
re-design, to sharpen the competitive
positioning of the products.
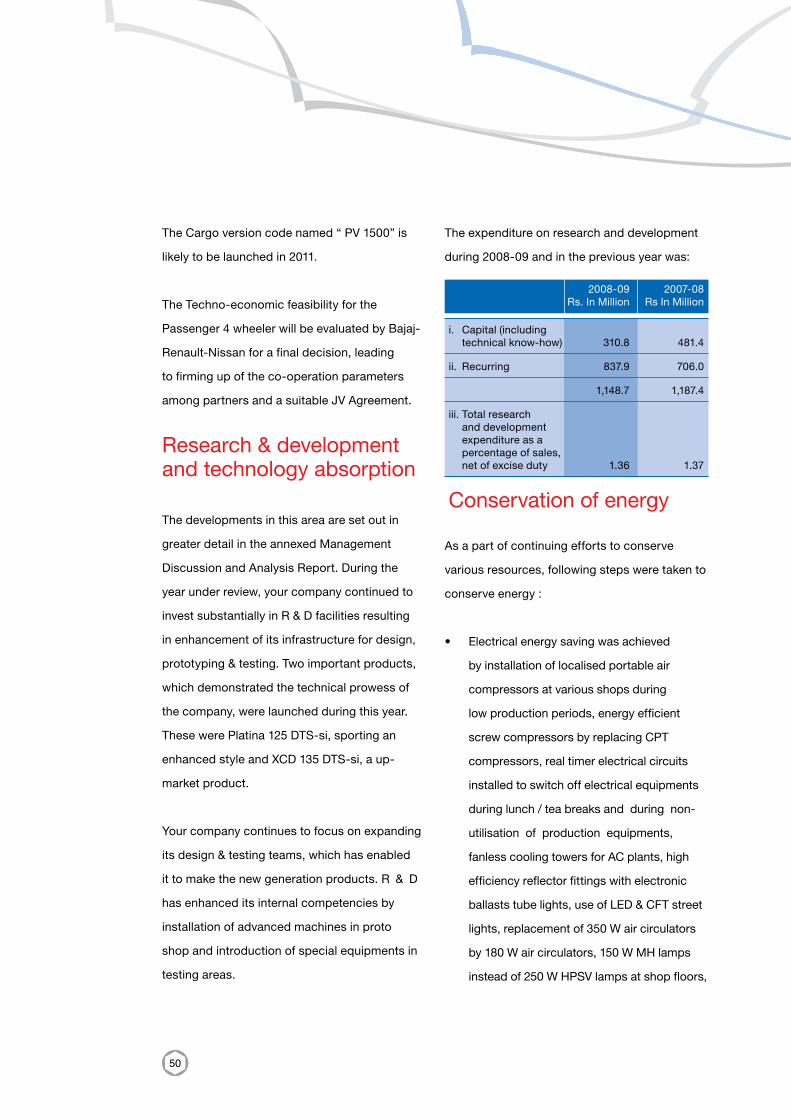
50
The Cargo version code named “ PV 1500” is
likely to be launched in 2011.
The Techno-economic feasibility for the
Passenger 4 wheeler will be evaluated by Bajaj-
Renault-Nissan for a final decision, leading
to firming up of the co-operation parameters
among partners and a suitable JV Agreement.
Research & development and technology absorption
The developments in this area are set out in
greater detail in the annexed Management
Discussion and Analysis Report. During the
year under review, your company continued to
invest substantially in R & D facilities resulting
in enhancement of its infrastructure for design,
prototyping & testing. Two important products,
which demonstrated the technical prowess of
the company, were launched during this year.
These were Platina 125 DTS-si, sporting an
enhanced style and XCD 135 DTS-si, a up-
market product.
Your company continues to focus on expanding
its design & testing teams, which has enabled
it to make the new generation products. R & D
has enhanced its internal competencies by
installation of advanced machines in proto
shop and introduction of special equipments in
testing areas.
The expenditure on research and development
during 2008-09 and in the previous year was:
2008-09 2007-08 Rs. In Million Rs In Million
i. Capital (including technical know-how) 310.8 481.4
ii. Recurring 837.9 706.0
1,148.7 1,187.4
iii. Total research and development expenditure as a percentage of sales, net of excise duty 1.36 1.37
Conservation of energy
As a part of continuing efforts to conserve
various resources, following steps were taken to
conserve energy :
• Electrical energy saving was achieved
by installation of localised portable air
compressors at various shops during
low production periods, energy efficient
screw compressors by replacing CPT
compressors, real timer electrical circuits
installed to switch off electrical equipments
during lunch / tea breaks and during non-
utilisation of production equipments,
fanless cooling towers for AC plants, high
efficiency reflector fittings with electronic
ballasts tube lights, use of LED & CFT street
lights, replacement of 350 W air circulators
by 180 W air circulators, 150 W MH lamps
instead of 250 W HPSV lamps at shop floors,
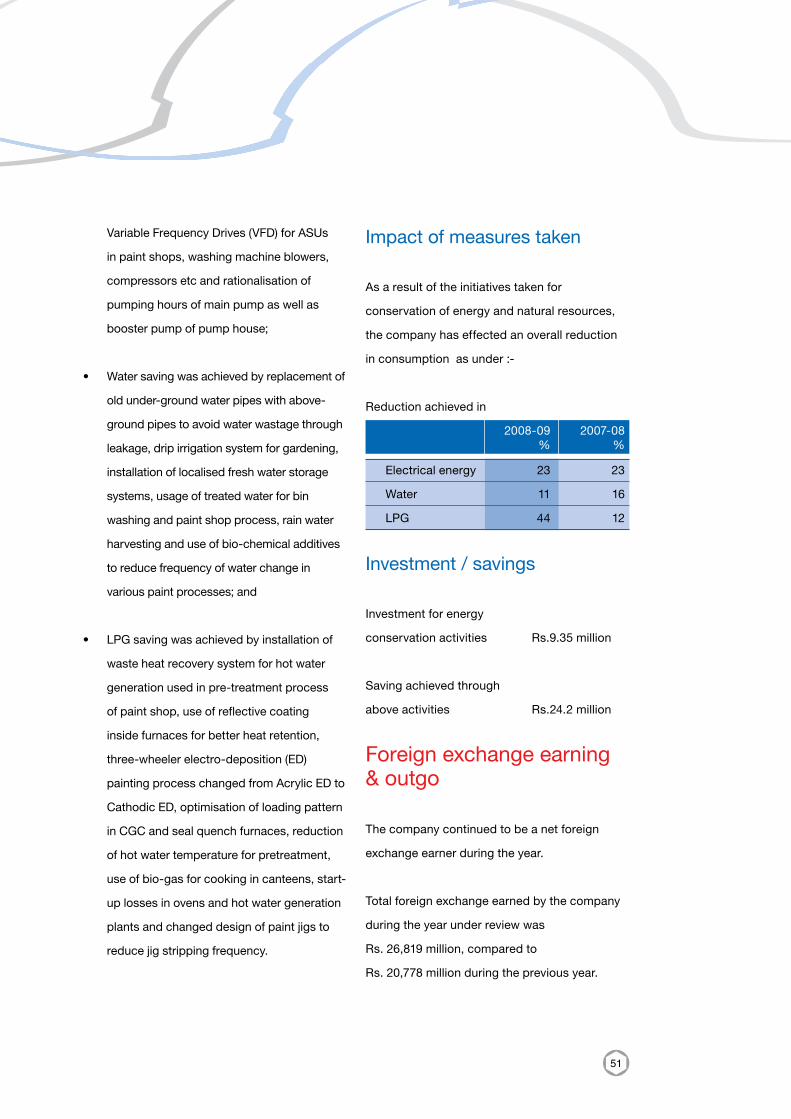
51
Variable Frequency Drives (VFD) for ASUs
in paint shops, washing machine blowers,
compressors etc and rationalisation of
pumping hours of main pump as well as
booster pump of pump house;
• Water saving was achieved by replacement of
old under-ground water pipes with above-
ground pipes to avoid water wastage through
leakage, drip irrigation system for gardening,
installation of localised fresh water storage
systems, usage of treated water for bin
washing and paint shop process, rain water
harvesting and use of bio-chemical additives
to reduce frequency of water change in
various paint processes; and
• LPG saving was achieved by installation of
waste heat recovery system for hot water
generation used in pre-treatment process
of paint shop, use of reflective coating
inside furnaces for better heat retention,
three-wheeler electro-deposition (ED)
painting process changed from Acrylic ED to
Cathodic ED, optimisation of loading pattern
in CGC and seal quench furnaces, reduction
of hot water temperature for pretreatment,
use of bio-gas for cooking in canteens, start-
up losses in ovens and hot water generation
plants and changed design of paint jigs to
reduce jig stripping frequency.
Impact of measures taken
As a result of the initiatives taken for
conservation of energy and natural resources,
the company has effected an overall reduction
in consumption as under :-
Reduction achieved in
2008-09 2007-08 % %
Electrical energy 23 23
Water 11 16
LPG 44 12
Investment / savings
Investment for energy
conservation activities Rs.9.35 million
Saving achieved through
above activities Rs.24.2 million
Foreign exchange earning & outgo
The company continued to be a net foreign
exchange earner during the year.
Total foreign exchange earned by the company
during the year under review was
Rs. 26,819 million, compared to
Rs. 20,778 million during the previous year.
52
Total foreign exchange outflow during the year
under review was Rs 7,286 million as against
Rs. 9,261 million during the previous year.
The above outflow includes an investment of
Rs.1,378 million (Previous Year 5,692 million)
in its 100% subsidiary, Bajaj Auto International
Holdings BV. Netherlands for increasing its stake
in KTM Power Sports AG from 24.45% to 31.72%.
Industrial relations
At Akurdi, the management signed the wage
settlement on 18 July 2008 with Vishwakalyan
Kamgar Sanghatana, the recognised union, in
conciliation and accordingly, the benefits of the
settlement have been given to all daily-rated
employees at Akurdi.
Subsequently, with a view to downsizing the
workforce at Akurdi, Voluntary Retirement
Scheme was floated for the permanent daily-
rated workmen. 2,331 workmen availed of the
benefit under the scheme.
Relations with staff and workmen across the
plants at Akurdi, Waluj, Chakan and Pantnagar
remained cordial.
During the year, 135 workmen at Akurdi and
16 workmen at Waluj have been taken into
staff category in the vacancies under the staff
category in R&D, PE, TE and MTD departments
of the company.
Government of Maharashtra declared 51
Gunwant Kamgars for the year 2008. Out of
these, 11 awards were received by the workers
of the Waluj Plant of the company.
Subsidiaries
PT. Bajaj Auto Indonesia (PT BAI), was
incorporated as a subsidiary company in
Indonesia with an issued, subscribed & paid-up
capital of US$ 12.5 million (Rs.562 million) in
2006-07. Bajaj Auto holds 97.5% shares in this
company, with balance being held by a local
partner.
53
The subsidiary company has accumulated
losses of Rs. 830.7 million as on 31 March 2009.
Through the efforts, which are planned in the
coming years, it is expected that PT BAI will turn
around within a reasonable time.
During the year under review, sales and
service network reach have been expanded
substantially covering the major cities of
Jawa, Sumatara, Bali and Sulawesi islands.
Total showroom strength stands at around 63
numbers, covering 46 cities of Indonesia.
PT BAI assembles and markets Bajaj Pulsar and
Bajaj XCD in Indonesia, establishing Bajaj as a
high quality tech-savvy brand. PT BAI plans to
expand its presence, product range and reach
towards becoming a strong player in this market
currently dominated by Japanese 2-wheeler
majors.
Bajaj Auto International Holdings BV,
Netherlands (BAIHBV) – was incorporated as a
wholly owned subsidiary company in Netherlands
with an issued, subscribed and paid-up capital
of Euros 200,000 during 2007-08. Further capital
of Euro 98.2 million was invested in this company
during the previous year, by way of premium.
It is proposed to make strategic investments in
overseas ventures, by way of equity shares and
/ or loans and to undertake related activities
through this company.
During the year, 21.2 million Euros
(Rs.1,378 million) were further invested in
BAIHBV, taking the total investment to
Euro 119.6 million (Rs.7,070 million).
During 2008-09, BAIHBV invested
Euro 21.2 million to acquire additional 719,466
equity shares of KTM Power Sports AG
(KTMPS), Austria. As on 31 March 2009,
BAIHBV owned 31.72% of KTMPS.
The joint development programs are
progressing satisfactorily and the products are
likely to be marketed in 2010-11.
Corporate social responsibility
During the year, your company continued
affirmative action and corporate social
responsibility initiatives in various fields.
Code of conduct for affirmative action
The company continues to place emphasis on
inclusive growth and has put in place certain
processes for delivering the intended social
outcome in measurable terms. The company
has adopted a voluntary code of conduct for
affirmative action, which is effective from
1 December 2006 and has placed the same
54
on its website. The company believes strongly
that its competitiveness is interlinked with
the well being of all sections of Indian society
and that equal opportunity for all sections of
the society is a component of its growth and
competitiveness. The company will constantly
endeavour to ensure that no discrimination of
any type is shown to the socially disadvantaged
sections of the society in the work place.
872 fresh employees were added during the
year. Of this, 99 Nos (11.4%) belong to the
weaker sections, in line with the affirmative
action plan of the company. It may be noted that
hitherto, the same was 5.9% in normal course.
Education
The company has launched a programme that
would help SC / ST students achieve academic
excellence and make them on par with those,
who can afford coaching for entrance to IITs.
During the year under review, one student
with a brilliant academic record was identified
from the underprivileged and low-income
group, for reimbursement of complete fees for
the preparation of IIT entrance test under the
guidance of IITians Prashikshan Kendra.
Under the central government initiative of Public
Private Participation (PPP), your company has
volunteered to adopt 3 ITIs (Industrial Training
Institute) for up-gradation:
• ITI Mulshi – A Memorandum of Agreement
and Institute Development Plan are awaiting
approval by the central government and
funds are expected in the financial year
2009-10. The construction of a new building
at Pirangut is in an advanced stage and is
expected to be occupied by June 2009.
• ITI Haveli - A Memorandum of Agreement
and Institute Development Plan are awaiting
final clearance from the central government.
• ITI Ramnager near the Pantnagar Plant
(Uttarakhand) - The Central Government
has approved the Institute Development
Plan. The Institute Management Committee
has received the funds for the up-gradation.
Further developmental actions are currently
underway.
The company organised a two day training
program for the Principals, Instructors and staff
of the Institutes. This was done to “open the
minds” to “aim high” and receive better ideas
and go out and achieve excellence.
A detailed individual action plan was set by each
participant for further action by themselves.
Other social activities
During the year, our employees volunteered for
blood donation camp at Deenanath Mangeshkar
Hospital, Pune and Dr Susheela Tiwari Hospital,
Pantnagar

55
Fire fighting teams of the company along with
vehicles responded to 20 Fire assistance calls
from Government Fire Department / other
industrial units outside the factory premises in
the larger interests of saving invaluable life and
property.
Community Care
In line with our commitment to enrich the life of
all with whom we deal, we showed sensitivity
to the employees, who opted for voluntary
retirement at our Akurdi Plant.
Soon after the Akurdi employees expressed
their interest in accepting the Voluntary
Retirement Scheme, the company organised
a series of interactive meetings with leading
financial institutions. The officers explained the
need to prudently and safely invest the monies
received, considering the various options
available today.
The company devised attractive schemes for
interested employees so that they could receive
regular monthly payments, in addition to lump
sum compensation announced. They were
also provided with options of taking loans at
competitive rates of interest.
By these actions, it is the company’s endeavour
that the employees, who have accepted
voluntary retirement scheme, are independently
self-sustaining and can take good care of
their families. Employees were also guided for
alternative possibilities, whether as employee or
entrepreneur.
Health
Government of India – Ministry of Health
and Family Welfare – National Aids Control
Organisation (NACO) and CII have initiated
Public Private Partnership (PPP) in order to
provide better healthcare to AIDs patients.
Your company has signed a tripartite MoU with
NACO and Yeshwantrao Chavan Municipal
Hospital (YCMH) in Pimpri to set up an Anti
Retroviral Treatment Centre (ART Centre) at
YCMH in Pimpri, Pune with the cooperation of
Pimpri Chinchwad Municipal Corporation for HIV
patients.
Many dignitaries from Global Fund, WHO
and such other organisations have visited the
ART centre, which is the largest unit run by
an industry under Public Private Partnership
programme. Apart from two doctors and
six supporting medical staff, the ART centre
has added audio-visual facilities for group
counseling, as a result of which the ART centre
registration has reached 1,900 numbers and the
unit is recognised today as one of the best ART
centres in the country.
56
Rural and community development activities and empowerment of women
The company continued with its rural
development activities in Pune and Aurangabad
districts of Maharashtra through its trust,
Jankidevi Bajaj Gram Vikas Sanstha (JBGVS).
JBGVS aims at an integrated development of
43 selected villages, to be carried out by the
villagers under their own leadership and through
united efforts forged by local organisations with
JBGVS acting as a catalyst.
During the year, JBGVS undertook a number
of development initiatives viz. watershed
development, sanitation, healthcare,
HIV / AIDs awareness and prevention,
basic education, women empowerment etc.
It also initiated various income generation
programmes, supporting 50 self-help groups
women members and developed 400 vermi-
compost plots. It encouraged and facilitated
entrepreneurship development through projects,
like goat rearing, candle and paper dish
production, shops and stalls etc.
Through JBGVS encouragement and technical
assistance, 4 educated youths installed
cultivation facilities under polynet and 32
farmers have established WADI concept mango
groves of 20 trees each. NABARD will partner
with JBGVS for a Rs.3.50 crore WADI Project for
the next seven years.
The trust supported construction of low cost
houses and latrines; conducted tests and
provided treatment during the HIV / AIDs
awareness programmes.
Samaj Seva Kendra (SSK) as part of JBGVS
provides facilities for social development of
the residents of Akurdi, Nigdi and adjoining
townships, with the aim of improving their
quality of life, through skill development
training, hobby centre, nursery education,
health care, sports, music, dance, cultural
programmes etc.
Employees Stock Option Scheme (ESOS)
In the present competitive economic
environment in the country and in the long-term
interests of the company and its shareholders,
it is necessary that the company adopts
suitable measures for attracting and retaining
qualified, talented and competent personnel. An
ESOS, designed to foster a sense of ownership
and belonging amongst personnel, is a well-
accepted approach to this end. In view of this,
an ESOS has been proposed, the terms and
conditions of which are being placed for the
approval of the members by way of special
57
resolutions at the ensuing Annual General
Meeting. The board of directors recommends
the same for approval.
Directors
D S Mehta, Kantikumar R Podar, Shekhar
Bajaj and D J Balaji Rao retire from the board
by rotation this year and being eligible, offer
themselves for re-appointment.
Sanjiv Bajaj has been re-appointed as Executive
Director for a further term of five years
commencing from 1 April 2009 and ending
31 March 2014.
Directors’ responsibility statement
As required by sub-section (2AA) of section 217
of the Companies Act, 1956, directors state:
• that in the preparation of annual accounts,
the applicable accounting standards
have been followed along with proper
explanation relating to material departures.
• that the directors have selected such
accounting policies and applied them
consistently and made judgments and
estimates that are reasonable and prudent,
so as to give a true and fair view of the
state of affairs of the company at the end
of the financial year and of the profit of the
company for that period.
• that the directors have taken proper and
sufficient care for the maintenance of
adequate accounting records in accordance
with the provisions of the Companies Act,
1956 for safeguarding the assets of the
company and for preventing and detecting
fraud and other irregularities.
• that the annual accounts have been
prepared on a going concern basis.
Consolidated financial statements
The directors also present the audited
consolidated financial statements incorporating
the duly audited financial statements of the
subsidiaries, viz. PT. Bajaj Auto Indonesia
and Bajaj Auto International Holdings BV,
Netherlands and as prepared in compliance with
the accounting standards and listing agreement
as prescribed by SEBI.
Information in aggregate for each subsidiary
company is disclosed in one page of the
consolidated balance sheet.
58
Statutory disclosures
The company has received an exemption
from the central government under section
212 (8) of the Companies Act, 1956 with
regard to attaching of the balance sheet,
profit and loss account and other documents
of its subsidiary companies, viz. PT Bajaj
Auto Indonesia and Bajaj Auto International
Holdings BV, Netherlands for the year
2008-09. The summary of the key financials of
the company’s subsidiaries is included in this
annual report.
The annual accounts of the subsidiary
companies and the related detailed information
will be made available to the members of
the company and its subsidiary companies,
seeking such information at any point of
time. The annual accounts of the subsidiary
companies will be kept for inspection by any
member of the company at its registered
office and also at the registered office of the
concerned subsidiary company.
As required under the provisions of sub-section
(2A) of section 217 of the Companies Act,
1956 read with the Companies (Particulars of
Employees) Rules 1975 as amended, particulars
of the employees are set out in the Annexure to
the directors report. As per provisions of section
219 (1)(b)(iv) of the said Act, these particulars
will be made available to any shareholder on
request.
Particulars regarding technology absorption,
conservation of energy and foreign exchange
earning and outgo required under
section 217(1)(e) of the Companies Act, 1956
and Companies (Disclosure of Particulars in the
report of board of directors) Rules, 1988 have
been given in preceding paragraphs.
Directors’ Responsibility Statement as required
by section 217(2AA) of the Companies Act, 1956
appears in a preceding paragraph.
Certificate from auditors of the company
regarding compliance of conditions of corporate
governance is annexed to this report as
Annexure 1.
A cash flow statement for the year 2008-09 is
attached to the balance sheet.
59
Corporate governance
Pursuant to clause 49 of the listing agreement
with stock exchanges, a separate section titled
‘Corporate Governance’ has been included in
this annual report, along with the reports on
Management Discussion and Analysis and
Additional Shareholder Information.
All board members and senior management
personnel have affirmed compliance with
the code of conduct for the year 2008-09. A
declaration to this effect signed by the Chief
Executive Officer (CEO) of the company is
contained in this annual report.
The CEO and Chief Financial Officer (CFO)
have certified to the board with regard to the
financial statements and other matters as
specified in clause 49 of the listing agreement
and the said certificate is contained in this
annual report.
Secretarial standards of ICSI
Secretarial standards issued by the Institute
of Company Secretaries of India (ICSI) from
time to time are currently recommendatory in
nature. Your company is, however, complying
with the same.
Auditors’ report
The observations made in the Auditors’ Report,
read together with the relevant notes thereon are
self-explanatory and hence, do not call for any
comments under section 217 of the Companies
Act, 1956.
Auditors
The members are requested to appoint Messers
Dalal & Shah, Chartered Accountants, as
auditors for the period from the conclusion
of the ensuing annual general meeting till the
conclusion of the next annual general meeting
and to fix their remuneration.
Your company has applied for government
order to conduct the audit of cost accounts,
maintained by the company for the year
ended 31 March 2010. Mr. A P Raman, cost
accountant, Pune has been appointed as cost
auditor to conduct the said audit, and the
government approval in this regard has been
received.
On behalf of the board of directors
Rahul Bajaj
Chairman 21 May 2009
60
To the nembers of
Bajaj Auto Limited
(Formerly Bajaj Holdings & Investment Limited)
We have reviewed the records concerning the company’s compliance of the conditions of Corporate
Governance as stipulated in Clause 49 of the Listing Agreement entered into by the company with
the Stock Exchanges of India for the financial year ended on March 31, 2009.
The compliance of conditions of corporate governance is the responsibility of the management.
Our review was limited to procedures and implementation thereof, adopted by the company for
ensuring the compliance of the conditions of the Corporate Governance. It is neither an audit nor an
expression of an opinion on the financial statements of the company.
We have conducted our review on the basis of the relevant records and documents maintained by
the company and furnished to us for examination and the information and explanations given to us
by the company.
Based on such a review, and to the best of our information and according to the explanations given
to us, in our opinion, the company has complied with the conditions of Corporate Governance as
stipulated in Clause 49 of the Listing Agreement of the Stock Exchanges of India.
We further state that such compliance is neither an assurance as to the future viability of
the company nor to the efficiency with which the management has conducted the affairs of
the company.
For and on behalf of
Dalal & Shah
Chartered Accountants
Anish Amin
Membership No. 40451
Partner
Mumbai: 21 May 2009
Annexure 1
Certificate by the Auditors on Corporate Governance
61
Annexure 2Declaration by Chief Executive Officer (CEO)
I, Rajiv Bajaj, Managing Director of Bajaj Auto Limited hereby declare that all the board members
and senior managerial personnel have affirmed for the year ended 31 March 2009 compliance with
the code of conduct of the company laid down for them.
Rajiv Bajaj
Managing Director
Mumbai : 21 May 2009
Annexure 3Certificate by Chief Executive Officer (CEO) and Chief Financial Officer (CFO)
We, Rajiv Bajaj, Managing Director and Kevin D’Sa, Vice President (Finance) of Bajaj Auto Limited, certify:
1. That we have reviewed the financial statements for the year ended 31 March 2009 and that to
the best of our knowledge and belief;
• these statements do not contain any materially untrue statement nor omit any material fact
nor contain statements that might be misleading, and
• these statements present a true and fair view of the company’s affairs and are in
compliance with the existing accounting standards, applicable laws and regulations.
2. That there are, to the best of our knowledge and belief, no transactions entered into by the company
during the year, which are fraudulent, illegal or violative of the company’s code of conduct;
3. That we accept responsibility for establishing and maintaining internal controls, we have
evaluated the effectiveness of the internal control systems of the company and we have
disclosed to the auditors and the audit committee, deficiencies in the design or operation of
internal controls, if any, of which we are aware and the steps that we have taken or propose to
take to rectify the identified deficiencies and
4. That we have informed the auditors and the audit committee of:
i. significant changes in internal control during the year;
ii. significant changes in accounting policies during the year and that the same have been
disclosed in the notes to the financial statements; and
iii. instances of significant fraud of which we have become aware and the involvement therein,
if any, of the management or an employee having a significant role in the company’s internal
control system.
Rajiv Bajaj Kevin D’sa
Managing Director Vice President (Finance)
Mumbai : 21 May 2009
62
We have audited the attached Balance Sheet of
BAJAJ AUTO LIMITED, as at 31 March 2009
and also the annexed Profit and Loss Account
and the statement of Cash Flows of the
company for the year ended on that date. These
financial statements are the responsibility of
the company’s management. Our responsibility
is to express an opinion on these financial
statements based on our Audit.
(1) We conducted our audit in accordance
with auditing standards generally accepted
in India. Those Standards require that
we plan and perform the audit to obtain
reasonable assurance about whether
the financial statements are free of
material misstatements. An Audit includes
examining, on a test basis, evidence
supporting the amounts and disclosures in
financial statements. An audit also includes
assessing the accounting principles
used and significant estimates made by
management, as well as evaluating the
overall financial statement presentation. We
believe that our audit provides a reasonable
basis for our opinion.
(2) As required by the Companies (Auditor’s
Report) Order, 2003 (CARO, 2003), issued
by the Central Government of India in terms
of Section 227(4A) of the Companies
Act, 1956, we annexe hereto a Statement on
the matters specified in paragraphs 4 of the
said Order;
(3) Further to our comments in Annexure referred
to in paragraph 2 above, we report that:
Report of the Auditors to the Members
(a) We have obtained all the information
and explanations, which to the best
of our knowledge and belief were
necessary for the purposes of our
audit;
(b) In our opinion, proper books of account
as required by law have been kept by
the company so far as appears from
our examination of the Books of the
company;
(c) The Balance Sheet, Profit and Loss
Account and the Cash Flow Statement
dealt with by the report are in
agreement with the Books of Account
of the company;
(d) In our opinion, the Balance Sheet, the
Profit and Loss Account and the Cash
Flow Statement dealt with by this report
comply with the Accounting Standards
referred to in Section 211 (3C) of the
Companies Act, 1956, to the extent
applicable.
(e) On the basis of the written
representations received from the
Directors as at 31 March 2009, and
taken on record by the Board of
Directors, we report that none of the
Directors are disqualified as on
31 March 2009 from being appointed
as a director in terms of clause (g) of
sub-section (1) of section 274 of the
Companies Act, 1956.
63
Report of the Auditors to the Members (Contd.)
(f) Without qualifying our opinion, we draw
reference to
1] Note No. 10 a) – relating to change
in the method of accounting
for compensation payable for
voluntary retirement of workmen
by recognising the same as an
expense over a period of two
years, as against the past practice
of recognising the same as an
expense in the year of retirement
and hence Rs 1,833 million has
been carried forward for recognition
as an expense in the subsequent
year, as detailed in the note.
2] Note No. 10 b) – relating to change
in the method of recognising
gains and losses of derivative
instruments to hedge highly
probable forecast transactions, by
applying the principles of hedge
accounting as detailed in the note.
(g) In our opinion and to the best of our
information and according to the
explanations given to us, the said
Financial Statements, read together
with the notes thereon, give the
information required by the Companies
Act, 1956, in the manner so required
and present a true and fair view
in conformity with the accounting
principles generally accepted in India:
(i) In the case of the Balance Sheet,
of the state of the affairs of the
company as at 31 March 2009,
(ii) In the case of the Profit and Loss
Account, of the Profit for the year
ended on that date, and
(iii) In the case of the Cash Flow
Statement, of the cash flows of the
company for the year ended on
that date
For and on behalf of
DALAL & SHAH
Chartered Accountants
Anish Amin
Partner
Membership No: 40451
Mumbai: 21 May 2009.
64
Annexure to the Auditors’ Report:
Statement referred to in Paragraph 2 of
the Auditors’ Report of even date to the
Members of BAJAJ AUTO LIMITED on the
Accounts for the year ended 31 March 2009.
On the basis of the records produced to us for
our verification / perusal, such checks as we
considered appropriate, in terms of information
and explanations given to us on our enquiries,
we state that:
i) (a) The company has maintained proper
records showing full particulars
including quantitative details and
situation of fixed assets.
(b) As explained to us, considering
the nature of the Fixed Assets and
to ensure minimum disruptions in
production schedules, the fixed assets
have been physically verified by the
management at reasonable intervals
during the year in accordance with
the verification policy adopted by the
company, whereby all the assets are
verified, in a phased manner, once in a
block of three years. According to the
information and explanations given to
us and the records produced to us for
our verification, discrepancies noticed
on such physical verification were not,
in our opinion, material and the same
have been properly dealt with in the
Books of Account.
(c) As per the information and explanations
given to us on our enquiries the disposal
of assets during the year were not
substantial and would not have an impact
on the operations of the company.
ii) (a) The inventories have been physically
verified by the management at
reasonable intervals during the year
and partially at the close of the year;
(b) The procedures of physical verification
of inventories followed by the
management as explained to us are, in
our opinion, reasonable and adequate
in relation to the size of the company
and the nature of its business;
(c) According to the records produced
to us for our verification, which in our
opinion were adequately maintained,
the discrepancies noticed on physical
verification of inventories referred to
above, as compared to book records,
though not material, have been properly
dealt with in the books of account;
iii) (a) As per the information and explanations
given to us and the records produced
to us for our verification, the company
has not granted loans, secured or
unsecured, to any company, firms or
other parties covered in the register
maintained under section 301 of the
Companies Act, 1956.
(b) The company has not taken any
loans, secured or unsecured, from
companies, firms or other parties
covered in the register maintained
under section 301 of the Companies
Act, 1956.
65
Annexure to the Auditors’ Report: (Contd.)
iv) In our opinion and according to the
information and explanations given to us,
there are adequate internal control systems
commensurate with the size of the company
and the nature of its business with regard to
the purchase of inventory and fixed assets
and for the sale of goods and services, if
any. As per the information given to us, no
major weaknesses in the internal controls
have been identified by the management
or the internal audit department of the
company during the year. During the course
of our audit, nothing had come to our notice
that may suggest a major weakness in the
internal control systems of the company;
v) (a) On the basis of the audit procedures
performed by us and according to the
information and explanations given to
us and on our enquiries on this behalf
and the records produced to us for our
verification, the particulars of contracts
and arrangements required to be
entered into the register in pursuance
of section 301 of the Companies
Act, 1956 have been so entered.
(b) The transactions effected in pursuance
of such contracts and arrangements,
as the case may be, aggregating in
excess of Rs.500,000/- in respect of
each party during the year, have been,
in our opinion, as per the information
and explanations given to us, made
at prices which are reasonable having
regard to prevailing market prices
as available with the company for
such transactions or prices at which
transactions, if any, for similar goods
have been made with other parties at
the relevant time;
vi) In our opinion, the company has complied
with the directives issued by the Reserve
Bank of India and the provisions of
Section 58A of the Companies Act,1956,
other relevant provisions of the said Act
including the Companies (Acceptance of
Deposits) Rules, 1975, where applicable,
with regard to the deposits accepted by
it from the public. Since the company has
not defaulted in repayments of deposits,
compliance of Section 58AA or obtaining
any order from the Company Law Board,
National Company Law Tribunal or Reserve
Bank of India or any other Court or Tribunal,
does not arise;
vii) On the basis of the internal audit reports
broadly reviewed by us, we are of the
opinion that, the company has an adequate
internal audit system commensurate with
the size and nature of its business;
viii) We have broadly reviewed the Books
of Account maintained by the company
pursuant to the rules made by the Central
Government for the maintenance of Cost
Records under Section 209(1)(d) of the
Companies Act,1956, and are of the
opinion that prima facie the prescribed
accounts and records have been made
and maintained. We have, however, not
made a detailed examination of the records
with a view to determine whether they are
accurate;
66
ix) (a) According to the records of the company,
the company has been regular in
depositing undisputed statutory dues
including Provident Fund, Investor
Education and Protection Fund, Employees
State Insurance, Income Tax, Sales Tax,
Wealth Tax, Service Tax, Customs Duty,
Excise duty, Cess and other Statutory dues
with the appropriate authorities;
(b) According to the records of the company
and the information and explanations
given to us & upon our enquiries in this
regards, disputed dues in respect of Sales
Tax, Income-tax, Wealth-tax, Service Tax,
Customs Duty, Excise Duty and Cess
unpaid as at the last day of the financial
year, are as follows
FORUM BEFORE WHOM PENDING
Statutes Commissioner Tribunal High Supreme Total Appeals Court Court
Rs. In Million Rs. In Million Rs. In Million Rs. In Million Rs. In Million
Sales Tax 2,511.4 0.7 63.0 — 2,575.1
Income Tax — — — — —
Wealth Tax — — — — —
Service Tax — 1.9 37.8 — 39.7
Customs Duty — 2.4 38.4 — 40.8
Excise 9.9 154.4 16.9 62.6 243.8
Octroi 6.9 — — 18.8 25.7
x) The company has not defaulted in
repayment of dues to banks. The company
has not borrowed any sums from Financial
Institutions nor through debentures;
xi) The company has, not granted any loans
and advances on the basis of security by
way of pledge of shares, debentures and
other investments
Annexure to the Auditors’ Report: (Contd.)
xii) The company, in our opinion, has
maintained proper records and contracts
with respect to its investments wherein
timely entries of transactions are made.
xiii) No guarantees have been given by the
company for loans taken from financial
institutions and / or banks by others, are, in
our opinion, not prejudicial to the interest of
the company;
xiv) The company has raised working capital
funds, which are used for the purpose as
and when needed. Internal generations
have been mainly deployed in fixed assets
and investments and partially ploughed
back into the business.
xv) As per the information and explanations
given to us and on our enquiries on this
behalf there were no frauds on or by the
company which have been noticed or
reported during the year,
In view of the nature of business carried on by
the company clause no (xiii) of CARO, 2003 is
not applicable to the company. Further in view
of the absence of conditions prerequisite to the
reporting requirement of clauses (iii) (b), (c), (d),
(x), (xvi), (xviii), (xix) and (xx) the said clauses are,
at present, not applicable.
For and on behalf of
DALAL & SHAH
Chartered Accountants
Anish Amin
Partner
Membership No: 40451
Mumbai: 21 May 2009.
67
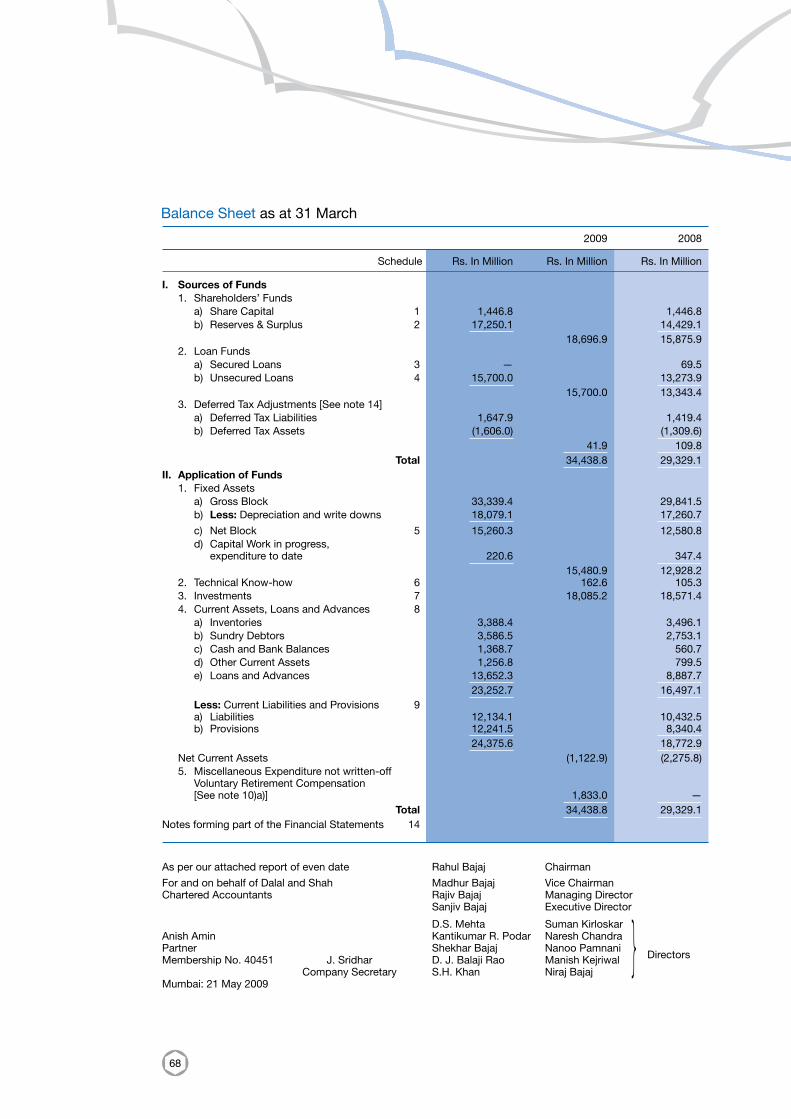
68
Balance Sheet as at 31 March
Schedule Rs. In Million Rs. In Million Rs. In Million
2009 2008
I. Sources of Funds 1. Shareholders’ Funds a) Share Capital 1 1,446.8 1,446.8 b) Reserves & Surplus 2 17,250.1 14,429.1 18,696.9 15,875.9 2. Loan Funds a) Secured Loans 3 — 69.5 b) Unsecured Loans 4 15,700.0 13,273.9 15,700.0 13,343.4 3. Deferred Tax Adjustments [See note 14] a) Deferred Tax Liabilities 1,647.9 1,419.4 b) Deferred Tax Assets (1,606.0) (1,309.6) 41.9 109.8 Total 34,438.8 29,329.1 II. Application of Funds 1. Fixed Assets a) Gross Block 33,339.4 29,841.5 b) Less: Depreciation and write downs 18,079.1 17,260.7 c) Net Block 5 15,260.3 12,580.8 d) Capital Work in progress, expenditure to date 220.6 347.4 15,480.9 12,928.2 2. Technical Know-how 6 162.6 105.3 3. Investments 7 18,085.2 18,571.4 4. Current Assets, Loans and Advances 8 a) Inventories 3,388.4 3,496.1 b) Sundry Debtors 3,586.5 2,753.1 c) Cash and Bank Balances 1,368.7 560.7 d) Other Current Assets 1,256.8 799.5 e) Loans and Advances 13,652.3 8,887.7 23,252.7 16,497.1 Less: Current Liabilities and Provisions 9 a) Liabilities 12,134.1 10,432.5 b) Provisions 12,241.5 8,340.4 24,375.6 18,772.9 Net Current Assets (1,122.9) (2,275.8) 5. Miscellaneous Expenditure not written-off Voluntary Retirement Compensation [See note 10)a)] 1,833.0 — Total 34,438.8 29,329.1 Notes forming part of the Financial Statements 14
As per our attached report of even date Rahul Bajaj Chairman
For and on behalf of Dalal and Shah Madhur Bajaj Vice ChairmanChartered Accountants Rajiv Bajaj Managing Director Sanjiv Bajaj Executive Director
D.S. Mehta Suman KirloskarAnish Amin Kantikumar R. Podar Naresh ChandraPartner Shekhar Bajaj Nanoo Pamnani Membership No. 40451 J. Sridhar D. J. Balaji Rao Manish Kejriwal Directors
Company Secretary S.H. Khan Niraj BajajMumbai: 21 May 2009
}
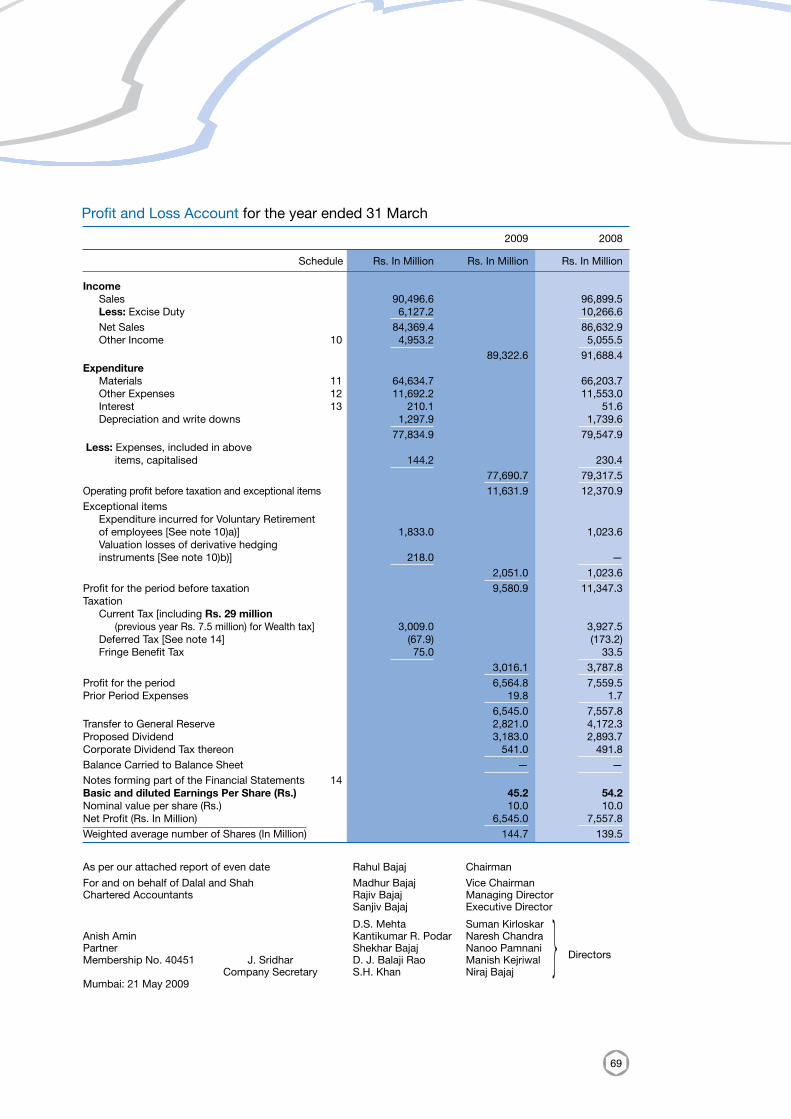
69
Profit and Loss Account for the year ended 31 March
Schedule Rs. In Million Rs. In Million Rs. In Million
2009 2008
Income Sales 90,496.6 96,899.5 Less: Excise Duty 6,127.2 10,266.6 Net Sales 84,369.4 86,632.9 Other Income 10 4,953.2 5,055.5 89,322.6 91,688.4 Expenditure Materials 11 64,634.7 66,203.7 Other Expenses 12 11,692.2 11,553.0 Interest 13 210.1 51.6 Depreciation and write downs 1,297.9 1,739.6 77,834.9 79,547.9 Less: Expenses, included in above items, capitalised 144.2 230.4 77,690.7 79,317.5 Operating profit before taxation and exceptional items 11,631.9 12,370.9 Exceptional items Expenditure incurred for Voluntary Retirement of employees [See note 10)a)] 1,833.0 1,023.6 Valuation losses of derivative hedging instruments [See note 10)b)] 218.0 — 2,051.0 1,023.6 Profit for the period before taxation 9,580.9 11,347.3 Taxation Current Tax [including Rs. 29 million (previous year Rs. 7.5 million) for Wealth tax] 3,009.0 3,927.5 Deferred Tax [See note 14] (67.9) (173.2) Fringe Benefit Tax 75.0 33.5 3,016.1 3,787.8 Profit for the period 6,564.8 7,559.5 Prior Period Expenses 19.8 1.7 6,545.0 7,557.8 Transfer to General Reserve 2,821.0 4,172.3 Proposed Dividend 3,183.0 2,893.7 Corporate Dividend Tax thereon 541.0 491.8 Balance Carried to Balance Sheet — — Notes forming part of the Financial Statements 14Basic and diluted Earnings Per Share (Rs.) 45.2 54.2 Nominal value per share (Rs.) 10.0 10.0 Net Profit (Rs. In Million) 6,545.0 7,557.8 Weighted average number of Shares (In Million) 144.7 139.5
As per our attached report of even date Rahul Bajaj Chairman
For and on behalf of Dalal and Shah Madhur Bajaj Vice ChairmanChartered Accountants Rajiv Bajaj Managing Director Sanjiv Bajaj Executive Director
D.S. Mehta Suman KirloskarAnish Amin Kantikumar R. Podar Naresh ChandraPartner Shekhar Bajaj Nanoo Pamnani Membership No. 40451 J. Sridhar D. J. Balaji Rao Manish Kejriwal Directors
Company Secretary S.H. Khan Niraj BajajMumbai: 21 May 2009
}
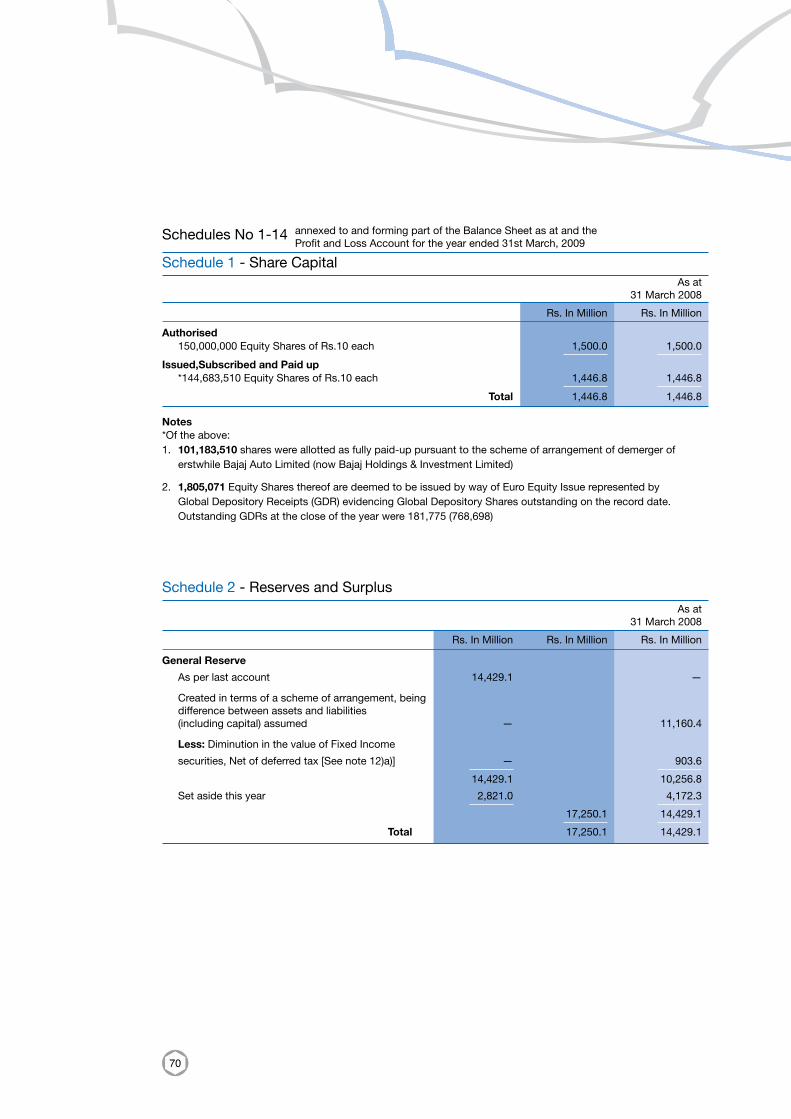
70
General Reserve
As per last account 14,429.1 —
Created in terms of a scheme of arrangement, being difference between assets and liabilities (including capital) assumed — 11,160.4
Less: Diminution in the value of Fixed Income
securities, Net of deferred tax [See note 12)a)] — 903.6 14,429.1 10,256.8
Set aside this year 2,821.0 4,172.3 17,250.1 14,429.1 Total 17,250.1 14,429.1
Schedule 1 - Share Capital
Schedule 2 - Reserves and Surplus
As at 31 March 2008
Rs. In Million Rs. In Million
As at 31 March 2008
Rs. In Million Rs. In Million Rs. In Million
Schedules No 1-14 annexed to and forming part of the Balance Sheet as at and the Profit and Loss Account for the year ended 31st March, 2009
Authorised 150,000,000 Equity Shares of Rs.10 each 1,500.0 1,500.0 Issued,Subscribed and Paid up *144,683,510 Equity Shares of Rs.10 each 1,446.8 1,446.8 Total 1,446.8 1,446.8
Notes*Of the above: 1. 101,183,510 shares were allotted as fully paid-up pursuant to the scheme of arrangement of demerger of
erstwhile Bajaj Auto Limited (now Bajaj Holdings & Investment Limited)
2. 1,805,071 Equity Shares thereof are deemed to be issued by way of Euro Equity Issue represented by Global Depository Receipts (GDR) evidencing Global Depository Shares outstanding on the record date. Outstanding GDRs at the close of the year were 181,775 (768,698)
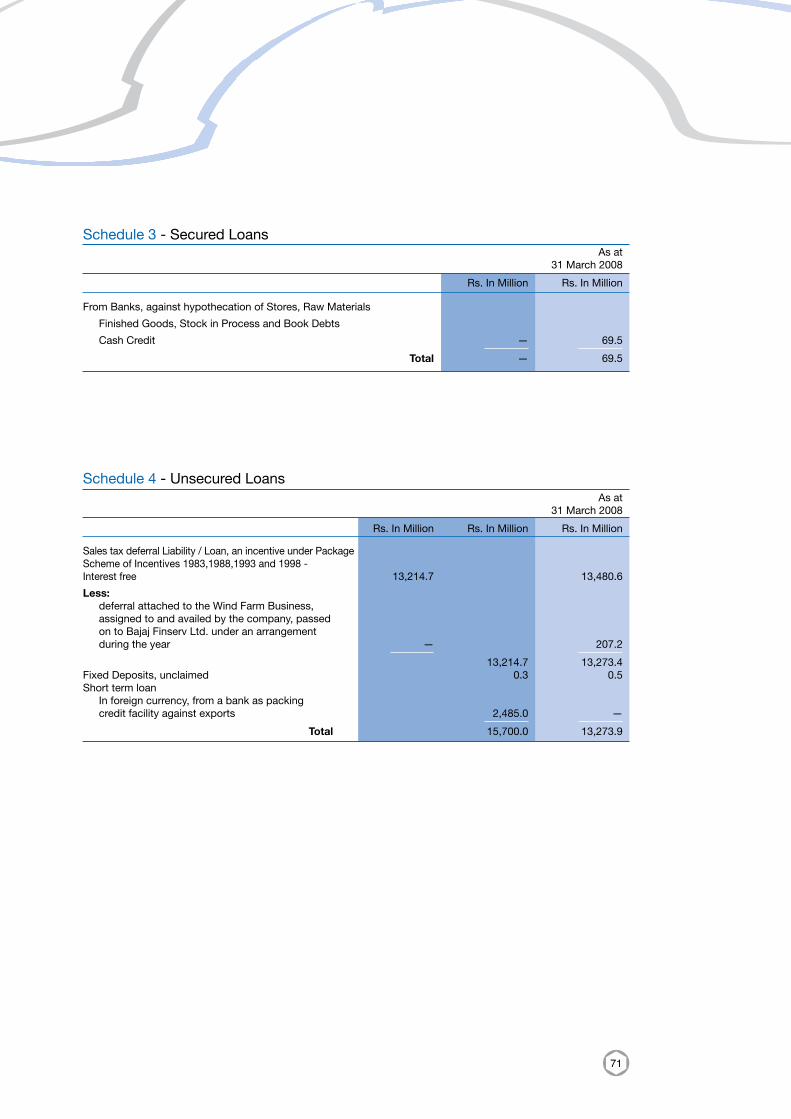
71
From Banks, against hypothecation of Stores, Raw Materials
Finished Goods, Stock in Process and Book Debts
Cash Credit — 69.5 Total — 69.5
Schedule 3 - Secured Loans
Schedule 4 - Unsecured Loans
As at 31 March 2008
Rs. In Million Rs. In Million
As at 31 March 2008
Rs. In Million Rs. In Million Rs. In Million
Sales tax deferral Liability / Loan, an incentive under Package Scheme of Incentives 1983,1988,1993 and 1998 - Interest free 13,214.7 13,480.6
Less: deferral attached to the Wind Farm Business,
assigned to and availed by the company, passed on to Bajaj Finserv Ltd. under an arrangement during the year — 207.2
13,214.7 13,273.4 Fixed Deposits, unclaimed 0.3 0.5 Short term loan In foreign currency, from a bank as packing
credit facility against exports 2,485.0 — Total 15,700.0 13,273.9
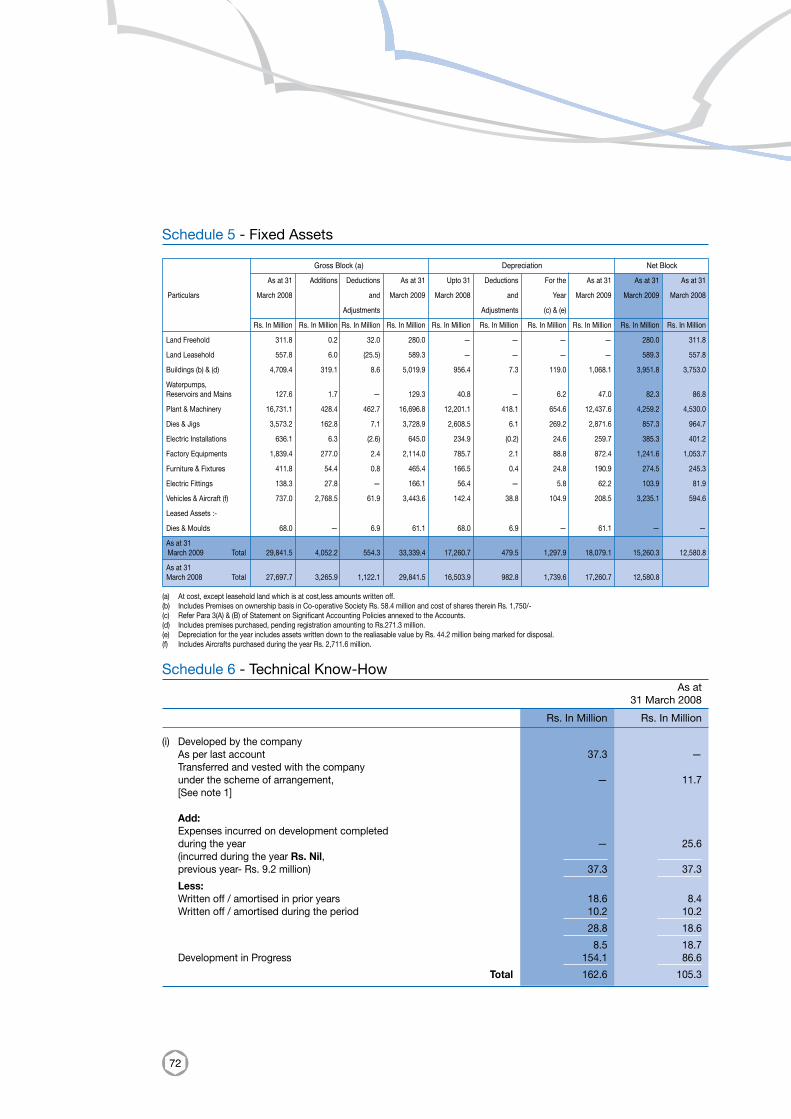
72
Gross Block (a) Depreciation Net Block As at 31 Additions Deductions As at 31 Upto 31 Deductions For the As at 31 As at 31 As at 31 Particulars March 2008 and March 2009 March 2008 and Year March 2009 March 2009 March 2008 Adjustments Adjustments (c) & (e)
Rs. In Million Rs. In Million Rs. In Million Rs. In Million Rs. In Million Rs. In Million Rs. In Million Rs. In Million Rs. In Million Rs. In Million Land Freehold 311.8 0.2 32.0 280.0 — — — — 280.0 311.8
Land Leasehold 557.8 6.0 (25.5) 589.3 — — — — 589.3 557.8
Buildings (b) & (d) 4,709.4 319.1 8.6 5,019.9 956.4 7.3 119.0 1,068.1 3,951.8 3,753.0
Waterpumps,Reservoirs and Mains 127.6 1.7 — 129.3 40.8 — 6.2 47.0 82.3 86.8
Plant & Machinery 16,731.1 428.4 462.7 16,696.8 12,201.1 418.1 654.6 12,437.6 4,259.2 4,530.0
Dies & Jigs 3,573.2 162.8 7.1 3,728.9 2,608.5 6.1 269.2 2,871.6 857.3 964.7
Electric Installations 636.1 6.3 (2.6) 645.0 234.9 (0.2) 24.6 259.7 385.3 401.2
Factory Equipments 1,839.4 277.0 2.4 2,114.0 785.7 2.1 88.8 872.4 1,241.6 1,053.7
Furniture & Fixtures 411.8 54.4 0.8 465.4 166.5 0.4 24.8 190.9 274.5 245.3
Electric Fittings 138.3 27.8 — 166.1 56.4 — 5.8 62.2 103.9 81.9
Vehicles & Aircraft (f) 737.0 2,768.5 61.9 3,443.6 142.4 38.8 104.9 208.5 3,235.1 594.6
Leased Assets :-
Dies & Moulds 68.0 — 6.9 61.1 68.0 6.9 — 61.1 — —
As at 31 March 2009 Total 29,841.5 4,052.2 554.3 33,339.4 17,260.7 479.5 1,297.9 18,079.1 15,260.3 12,580.8
As at 31 March 2008 Total 27,697.7 3,265.9 1,122.1 29,841.5 16,503.9 982.8 1,739.6 17,260.7 12,580.8
(a) At cost, except leasehold land which is at cost,less amounts written off.(b) Includes Premises on ownership basis in Co-operative Society Rs. 58.4 million and cost of shares therein Rs. 1,750/-(c) Refer Para 3(A) & (B) of Statement on Significant Accounting Policies annexed to the Accounts. (d) Includes premises purchased, pending registration amounting to Rs.271.3 million. (e) Depreciation for the year includes assets written down to the realiasable value by Rs. 44.2 million being marked for disposal.(f) Includes Aircrafts purchased during the year Rs. 2,711.6 million.
Schedule 5 - Fixed Assets
Schedule 6 - Technical Know-How As at 31 March 2008
Rs. In Million Rs. In Million
(i) Developed by the company As per last account 37.3 — Transferred and vested with the company
under the scheme of arrangement, — 11.7 [See note 1]
Add: Expenses incurred on development completed during the year — 25.6
(incurred during the year Rs. Nil, previous year- Rs. 9.2 million) 37.3 37.3 Less: Written off / amortised in prior years 18.6 8.4 Written off / amortised during the period 10.2 10.2 28.8 18.6 8.5 18.7 Development in Progress 154.1 86.6 Total 162.6 105.3
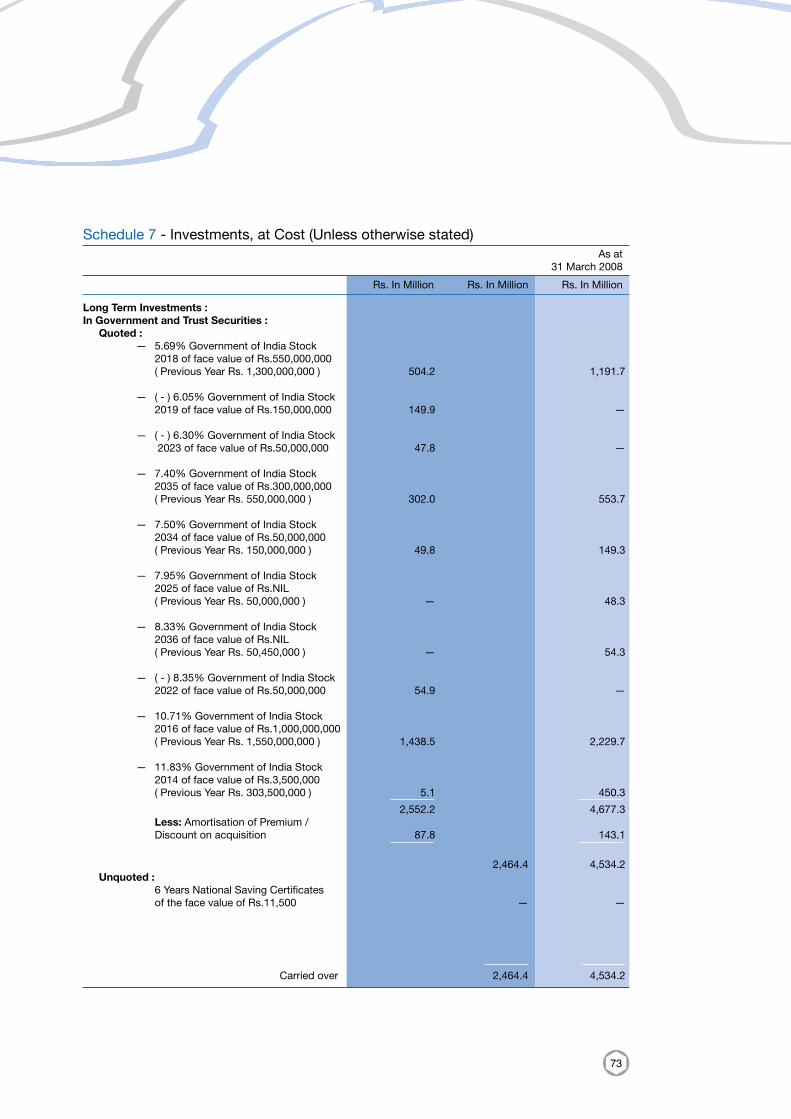
73
Long Term Investments : In Government and Trust Securities : Quoted : — 5.69% Government of India Stock
2018 of face value of Rs.550,000,000 ( Previous Year Rs. 1,300,000,000 ) 504.2 1,191.7 — ( - ) 6.05% Government of India Stock 2019 of face value of Rs.150,000,000 149.9 —
— ( - ) 6.30% Government of India Stock 2023 of face value of Rs.50,000,000 47.8 — — 7.40% Government of India Stock
2035 of face value of Rs.300,000,000 ( Previous Year Rs. 550,000,000 ) 302.0 553.7
— 7.50% Government of India Stock 2034 of face value of Rs.50,000,000
( Previous Year Rs. 150,000,000 ) 49.8 149.3
— 7.95% Government of India Stock 2025 of face value of Rs.NIL
( Previous Year Rs. 50,000,000 ) — 48.3
— 8.33% Government of India Stock 2036 of face value of Rs.NIL
( Previous Year Rs. 50,450,000 ) — 54.3
— ( - ) 8.35% Government of India Stock 2022 of face value of Rs.50,000,000 54.9 —
— 10.71% Government of India Stock 2016 of face value of Rs.1,000,000,000
( Previous Year Rs. 1,550,000,000 ) 1,438.5 2,229.7 — 11.83% Government of India Stock
2014 of face value of Rs.3,500,000 ( Previous Year Rs. 303,500,000 ) 5.1 450.3 2,552.2 4,677.3 Less: Amortisation of Premium / Discount on acquisition 87.8 143.1
2,464.4 4,534.2 Unquoted : 6 Years National Saving Certificates of the face value of Rs.11,500 — —
Schedule 7 - Investments, at Cost (Unless otherwise stated) As at 31 March 2008
Rs. In Million Rs. In Million Rs. In Million
Carried over 2,464.4 4,534.2

74
Schedule 7 - Investments, at Cost (Unless otherwise stated) (Contd.) As at 31 March 2008
Rs. In Million Rs. In Million Rs. In Million
In Fully Paid Preference Shares : Unquoted :
1,130,000 12.50% Redeemable Cumulative Preference Shares of Rs.10 each in
Durovalves India Private Limited. 11.3 11.3
In Fully Paid Equity Shares : In Subsidiary Company : Unquoted :
2,000 Shares of Euro 100 each in Bajaj Auto International Holding B V Amsterdam,
Netherlands 7,070.4 5,692.3 121,875 Shares of US $ 100 each in P T Bajaj Auto Indonesia 566.8 566.8 7,637.2 6,259.1 In Fully Paid Equity Shares : Others : Unquoted :
565,000 Shares of Rs.10 each in Durovalves India Private Limited 5.7 5.7
In Debentures: Fully Paid: Other : Quoted: - (200) 5.85% Redeemable Non
Convertible Debentures of Rs.1,000,000 each of Housing Development Finance
Corporation Limited — 197.5 150 7.15% Redeemable Non Convertible
Debentures of Rs.1,000,000 each of Housing Development Finance
Corporation Limited 150.0 150.0 100 7.75% Unsecured, Redeemable,
subordinated Bonds in the nature of Debentures of Rs.1,000,000/- each of
HDFC Bank Limited - Series 5/2005 100.0 100.0
Brought over 2,464.4 4,534.2
Carried over 250.0 447.5 Carried over 10,118.6 10,810.3
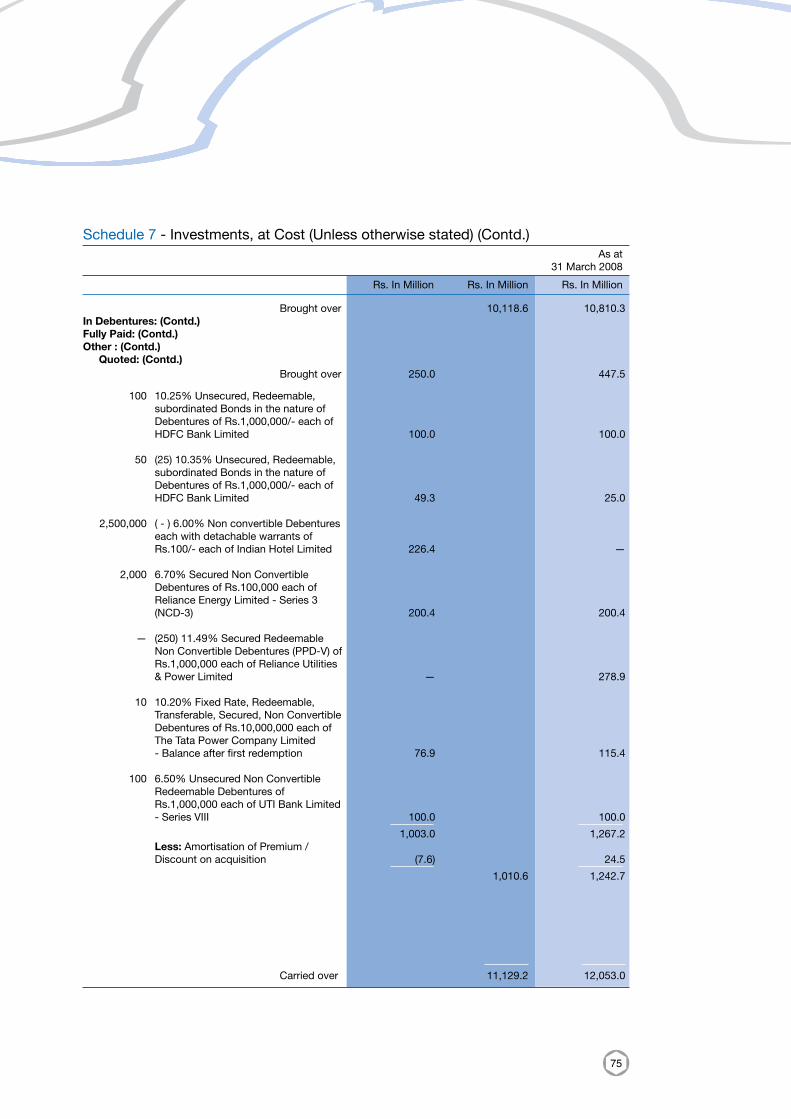
75
Schedule 7 - Investments, at Cost (Unless otherwise stated) (Contd.) As at 31 March 2008
Rs. In Million Rs. In Million Rs. In Million
100 10.25% Unsecured, Redeemable, subordinated Bonds in the nature of Debentures of Rs.1,000,000/- each of
HDFC Bank Limited 100.0 100.0
50 (25) 10.35% Unsecured, Redeemable, subordinated Bonds in the nature of Debentures of Rs.1,000,000/- each of
HDFC Bank Limited 49.3 25.0
2,500,000 ( - ) 6.00% Non convertible Debentures each with detachable warrants of
Rs.100/- each of Indian Hotel Limited 226.4 —
2,000 6.70% Secured Non Convertible Debentures of Rs.100,000 each of Reliance Energy Limited - Series 3
(NCD-3) 200.4 200.4
— (250) 11.49% Secured Redeemable Non Convertible Debentures (PPD-V) of Rs.1,000,000 each of Reliance Utilities
& Power Limited — 278.9
10 10.20% Fixed Rate, Redeemable, Transferable, Secured, Non Convertible Debentures of Rs.10,000,000 each of
The Tata Power Company Limited - Balance after first redemption 76.9 115.4
100 6.50% Unsecured Non Convertible Redeemable Debentures of Rs.1,000,000 each of UTI Bank Limited
- Series VIII 100.0 100.0 1,003.0 1,267.2 Less: Amortisation of Premium / Discount on acquisition (7.6) 24.5 1,010.6 1,242.7
Brought over 10,118.6 10,810.3In Debentures: (Contd.)Fully Paid: (Contd.)Other : (Contd.) Quoted: (Contd.) Brought over 250.0 447.5
Carried over 11,129.2 12,053.0
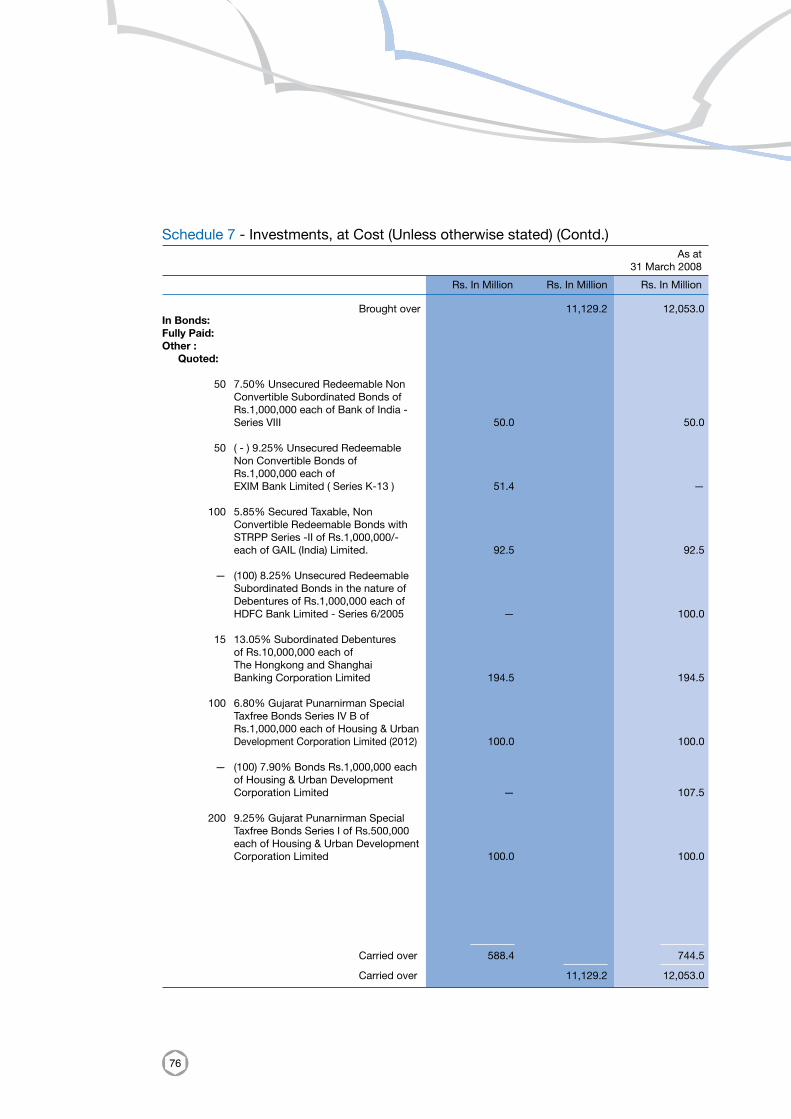
76
Schedule 7 - Investments, at Cost (Unless otherwise stated) (Contd.) As at 31 March 2008
Rs. In Million Rs. In Million Rs. In Million
In Bonds: Fully Paid: Other : Quoted:
50 7.50% Unsecured Redeemable Non Convertible Subordinated Bonds of Rs.1,000,000 each of Bank of India -
Series VIII 50.0 50.0
50 ( - ) 9.25% Unsecured Redeemable Non Convertible Bonds of Rs.1,000,000 each of
EXIM Bank Limited ( Series K-13 ) 51.4 —
100 5.85% Secured Taxable, Non Convertible Redeemable Bonds with STRPP Series -II of Rs.1,000,000/-
each of GAIL (India) Limited. 92.5 92.5 — (100) 8.25% Unsecured Redeemable
Subordinated Bonds in the nature of Debentures of Rs.1,000,000 each of
HDFC Bank Limited - Series 6/2005 — 100.0 15 13.05% Subordinated Debentures
of Rs.10,000,000 each of The Hongkong and Shanghai
Banking Corporation Limited 194.5 194.5 100 6.80% Gujarat Punarnirman Special
Taxfree Bonds Series IV B of Rs.1,000,000 each of Housing & Urban
Development Corporation Limited (2012) 100.0 100.0
— (100) 7.90% Bonds Rs.1,000,000 each of Housing & Urban Development
Corporation Limited — 107.5
200 9.25% Gujarat Punarnirman Special Taxfree Bonds Series I of Rs.500,000 each of Housing & Urban Development
Corporation Limited 100.0 100.0
Brought over 11,129.2 12,053.0
Carried over 588.4 744.5 Carried over 11,129.2 12,053.0
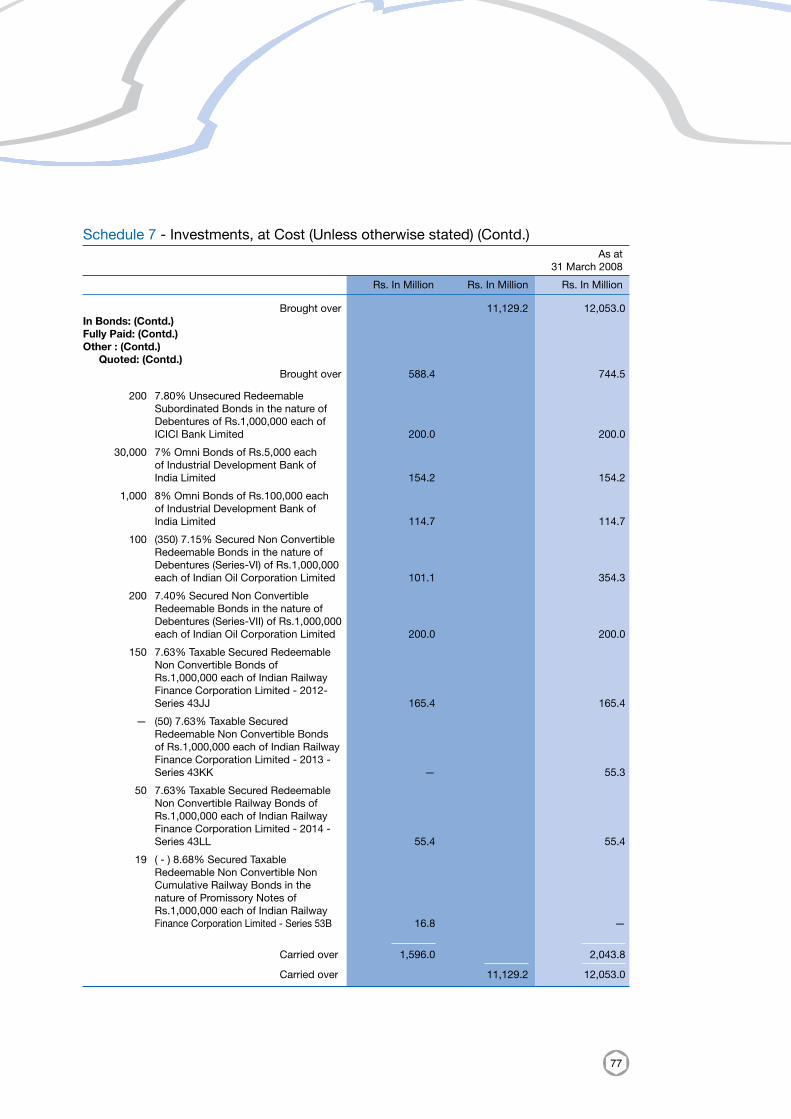
77
Schedule 7 - Investments, at Cost (Unless otherwise stated) (Contd.) As at 31 March 2008
Rs. In Million Rs. In Million Rs. In Million
200 7.80% Unsecured Redeemable Subordinated Bonds in the nature of Debentures of Rs.1,000,000 each of
ICICI Bank Limited 200.0 200.0
30,000 7% Omni Bonds of Rs.5,000 each of Industrial Development Bank of
India Limited 154.2 154.2
1,000 8% Omni Bonds of Rs.100,000 each of Industrial Development Bank of
India Limited 114.7 114.7
100 (350) 7.15% Secured Non Convertible Redeemable Bonds in the nature of Debentures (Series-VI) of Rs.1,000,000
each of Indian Oil Corporation Limited 101.1 354.3
200 7.40% Secured Non Convertible Redeemable Bonds in the nature of Debentures (Series-VII) of Rs.1,000,000
each of Indian Oil Corporation Limited 200.0 200.0
150 7.63% Taxable Secured Redeemable Non Convertible Bonds of Rs.1,000,000 each of Indian Railway Finance Corporation Limited - 2012-
Series 43JJ 165.4 165.4
— (50) 7.63% Taxable Secured Redeemable Non Convertible Bonds of Rs.1,000,000 each of Indian Railway Finance Corporation Limited - 2013 -
Series 43KK — 55.3
50 7.63% Taxable Secured Redeemable Non Convertible Railway Bonds of Rs.1,000,000 each of Indian Railway Finance Corporation Limited - 2014 -
Series 43LL 55.4 55.4
19 ( - ) 8.68% Secured Taxable Redeemable Non Convertible Non Cumulative Railway Bonds in the nature of Promissory Notes of Rs.1,000,000 each of Indian Railway
Finance Corporation Limited - Series 53B 16.8 —
Brought over 11,129.2 12,053.0 In Bonds: (Contd.)Fully Paid: (Contd.)Other : (Contd.) Quoted: (Contd.) Brought over 588.4 744.5
Carried over 1,596.0 2,043.8 Carried over 11,129.2 12,053.0
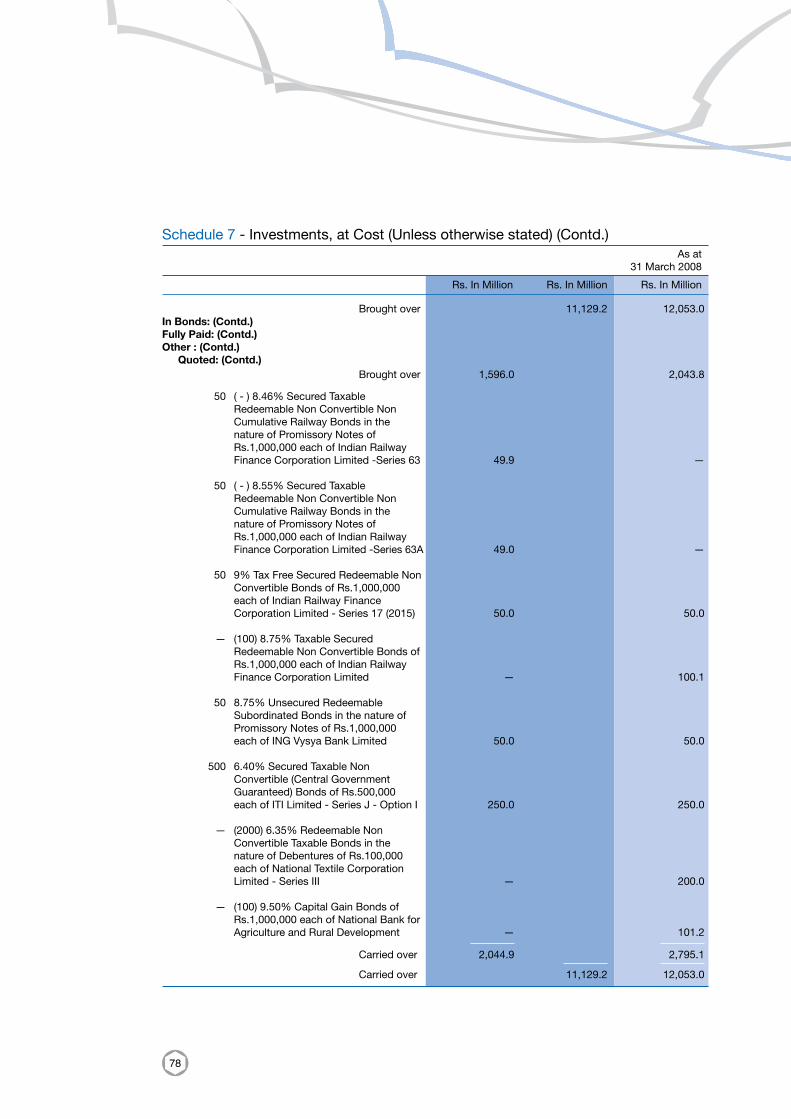
78
Schedule 7 - Investments, at Cost (Unless otherwise stated) (Contd.) As at 31 March 2008
Rs. In Million Rs. In Million Rs. In Million
50 ( - ) 8.46% Secured Taxable Redeemable Non Convertible Non Cumulative Railway Bonds in the nature of Promissory Notes of Rs.1,000,000 each of Indian Railway
Finance Corporation Limited -Series 63 49.9 —
50 ( - ) 8.55% Secured Taxable Redeemable Non Convertible Non Cumulative Railway Bonds in the nature of Promissory Notes of Rs.1,000,000 each of Indian Railway
Finance Corporation Limited -Series 63A 49.0 —
50 9% Tax Free Secured Redeemable Non Convertible Bonds of Rs.1,000,000 each of Indian Railway Finance
Corporation Limited - Series 17 (2015) 50.0 50.0
— (100) 8.75% Taxable Secured Redeemable Non Convertible Bonds of Rs.1,000,000 each of Indian Railway
Finance Corporation Limited — 100.1
50 8.75% Unsecured Redeemable Subordinated Bonds in the nature of Promissory Notes of Rs.1,000,000
each of ING Vysya Bank Limited 50.0 50.0
500 6.40% Secured Taxable Non Convertible (Central Government Guaranteed) Bonds of Rs.500,000
each of ITI Limited - Series J - Option I 250.0 250.0
— (2000) 6.35% Redeemable Non Convertible Taxable Bonds in the nature of Debentures of Rs.100,000 each of National Textile Corporation
Limited - Series III — 200.0
— (100) 9.50% Capital Gain Bonds of Rs.1,000,000 each of National Bank for
Agriculture and Rural Development — 101.2
Brought over 11,129.2 12,053.0 In Bonds: (Contd.)Fully Paid: (Contd.)Other : (Contd.) Quoted: (Contd.) Brought over 1,596.0 2,043.8
Carried over 2,044.9 2,795.1 Carried over 11,129.2 12,053.0
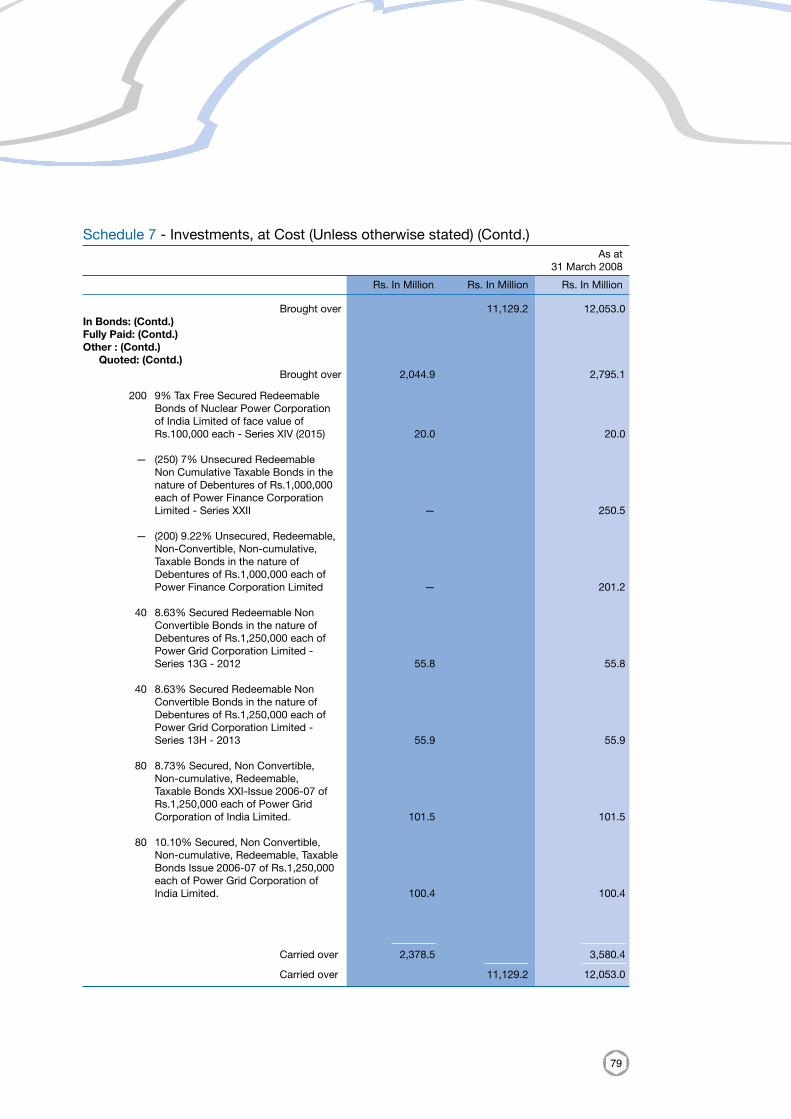
79
Schedule 7 - Investments, at Cost (Unless otherwise stated) (Contd.) As at 31 March 2008
Rs. In Million Rs. In Million Rs. In Million
200 9% Tax Free Secured Redeemable Bonds of Nuclear Power Corporation of India Limited of face value of
Rs.100,000 each - Series XIV (2015) 20.0 20.0
— (250) 7% Unsecured Redeemable Non Cumulative Taxable Bonds in the nature of Debentures of Rs.1,000,000 each of Power Finance Corporation
Limited - Series XXII — 250.5
— (200) 9.22% Unsecured, Redeemable, Non-Convertible, Non-cumulative, Taxable Bonds in the nature of Debentures of Rs.1,000,000 each of
Power Finance Corporation Limited — 201.2
40 8.63% Secured Redeemable Non Convertible Bonds in the nature of Debentures of Rs.1,250,000 each of Power Grid Corporation Limited -
Series 13G - 2012 55.8 55.8
40 8.63% Secured Redeemable Non Convertible Bonds in the nature of Debentures of Rs.1,250,000 each of Power Grid Corporation Limited -
Series 13H - 2013 55.9 55.9 80 8.73% Secured, Non Convertible,
Non-cumulative, Redeemable, Taxable Bonds XXI-Issue 2006-07 of Rs.1,250,000 each of Power Grid
Corporation of India Limited. 101.5 101.5
80 10.10% Secured, Non Convertible, Non-cumulative, Redeemable, Taxable Bonds Issue 2006-07 of Rs.1,250,000 each of Power Grid Corporation of
India Limited. 100.4 100.4
Brought over 11,129.2 12,053.0 In Bonds: (Contd.)Fully Paid: (Contd.)Other : (Contd.) Quoted: (Contd.) Brought over 2,044.9 2,795.1
Carried over 2,378.5 3,580.4 Carried over 11,129.2 12,053.0
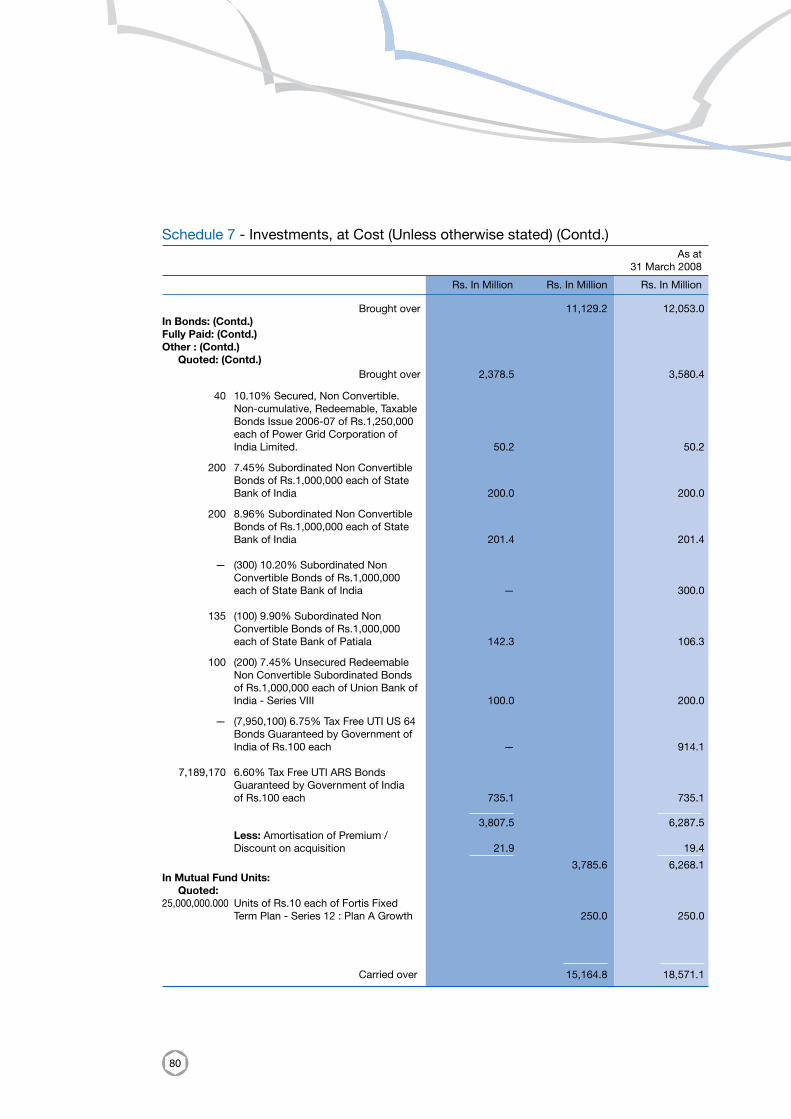
80
Schedule 7 - Investments, at Cost (Unless otherwise stated) (Contd.) As at 31 March 2008
Rs. In Million Rs. In Million Rs. In Million
40 10.10% Secured, Non Convertible. Non-cumulative, Redeemable, Taxable Bonds Issue 2006-07 of Rs.1,250,000 each of Power Grid Corporation of
India Limited. 50.2 50.2
200 7.45% Subordinated Non Convertible Bonds of Rs.1,000,000 each of State
Bank of India 200.0 200.0
200 8.96% Subordinated Non Convertible Bonds of Rs.1,000,000 each of State
Bank of India 201.4 201.4 — (300) 10.20% Subordinated Non
Convertible Bonds of Rs.1,000,000 each of State Bank of India — 300.0 135 (100) 9.90% Subordinated Non
Convertible Bonds of Rs.1,000,000 each of State Bank of Patiala 142.3 106.3
100 (200) 7.45% Unsecured Redeemable Non Convertible Subordinated Bonds of Rs.1,000,000 each of Union Bank of
India - Series VIII 100.0 200.0
— (7,950,100) 6.75% Tax Free UTI US 64 Bonds Guaranteed by Government of
India of Rs.100 each — 914.1 7,189,170 6.60% Tax Free UTI ARS Bonds
Guaranteed by Government of India of Rs.100 each 735.1 735.1 3,807.5 6,287.5 Less: Amortisation of Premium / Discount on acquisition 21.9 19.4 3,785.6 6,268.1 In Mutual Fund Units: Quoted: 25,000,000.000 Units of Rs.10 each of Fortis Fixed Term Plan - Series 12 : Plan A Growth 250.0 250.0
Brought over 11,129.2 12,053.0 In Bonds: (Contd.)Fully Paid: (Contd.)Other : (Contd.) Quoted: (Contd.) Brought over 2,378.5 3,580.4
Carried over 15,164.8 18,571.1
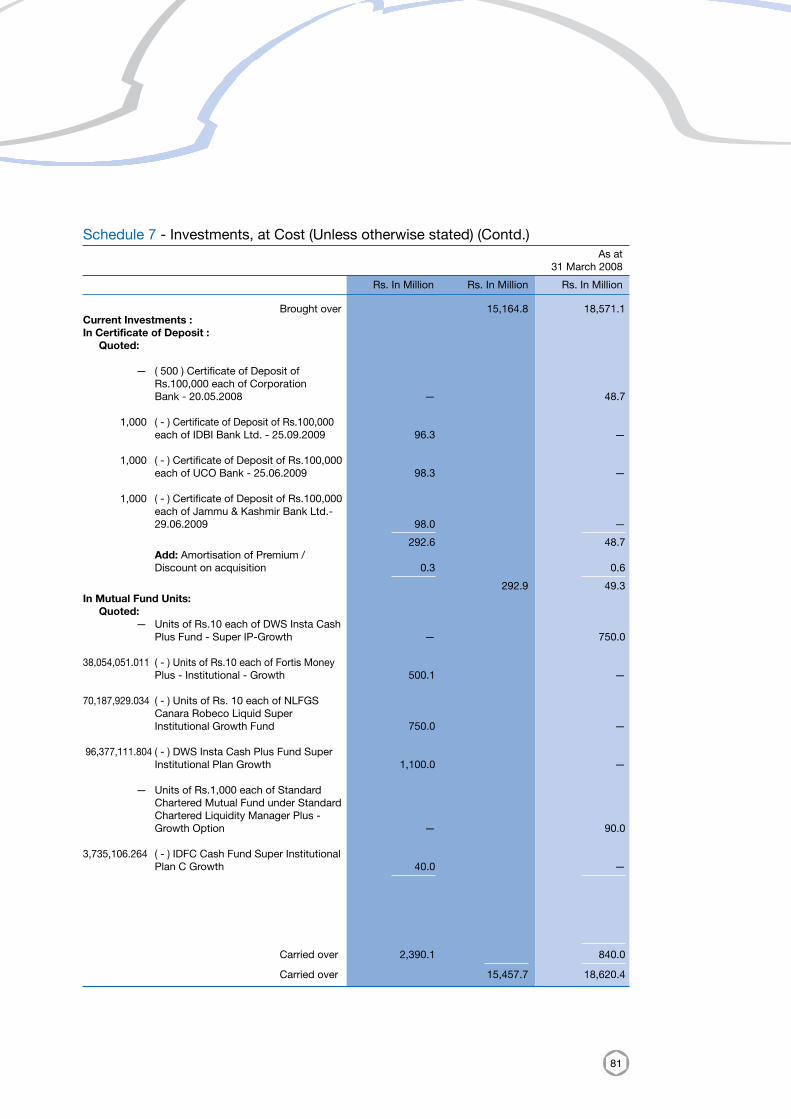
81
Schedule 7 - Investments, at Cost (Unless otherwise stated) (Contd.) As at 31 March 2008
Rs. In Million Rs. In Million Rs. In Million
Current Investments :In Certificate of Deposit : Quoted:
— ( 500 ) Certificate of Deposit of Rs.100,000 each of Corporation Bank - 20.05.2008 — 48.7
1,000 ( - ) Certificate of Deposit of Rs.100,000 each of IDBI Bank Ltd. - 25.09.2009 96.3 —
1,000 ( - ) Certificate of Deposit of Rs.100,000 each of UCO Bank - 25.06.2009 98.3 —
1,000 ( - ) Certificate of Deposit of Rs.100,000 each of Jammu & Kashmir Bank Ltd.-
29.06.2009 98.0 — 292.6 48.7 Add: Amortisation of Premium / Discount on acquisition 0.3 0.6 292.9 49.3 In Mutual Fund Units: Quoted: — Units of Rs.10 each of DWS Insta Cash Plus Fund - Super IP-Growth — 750.0
38,054,051.011 ( - ) Units of Rs.10 each of Fortis Money Plus - Institutional - Growth 500.1 —
70,187,929.034 ( - ) Units of Rs. 10 each of NLFGS Canara Robeco Liquid Super
Institutional Growth Fund 750.0 —
96,377,111.804 ( - ) DWS Insta Cash Plus Fund Super Institutional Plan Growth 1,100.0 —
— Units of Rs.1,000 each of Standard Chartered Mutual Fund under Standard Chartered Liquidity Manager Plus -
Growth Option — 90.0
3,735,106.264 ( - ) IDFC Cash Fund Super Institutional Plan C Growth 40.0 —
Brought over 15,164.8 18,571.1
Carried over 2,390.1 840.0 Carried over 15,457.7 18,620.4
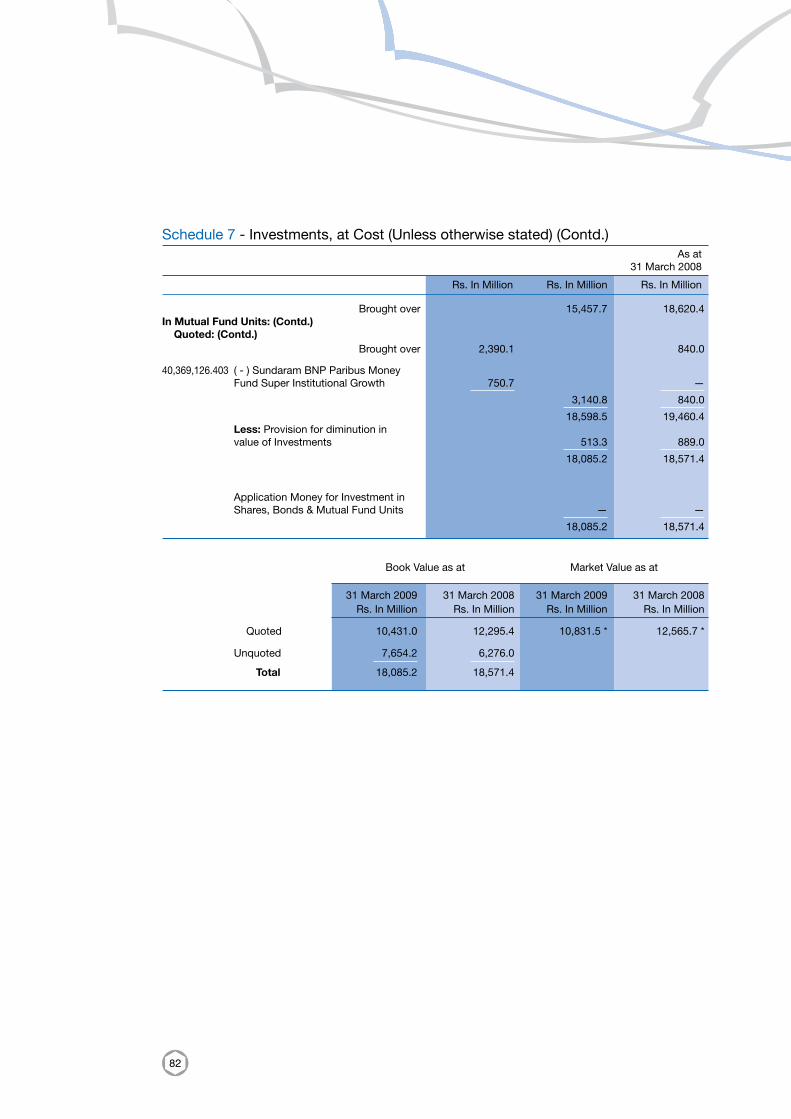
82
Schedule 7 - Investments, at Cost (Unless otherwise stated) (Contd.) As at 31 March 2008
Rs. In Million Rs. In Million Rs. In Million
40,369,126.403 ( - ) Sundaram BNP Paribus Money Fund Super Institutional Growth 750.7 — 3,140.8 840.0 18,598.5 19,460.4 Less: Provision for diminution in
value of Investments 513.3 889.0 18,085.2 18,571.4
Application Money for Investment in Shares, Bonds & Mutual Fund Units — — 18,085.2 18,571.4
Book Value as at Market Value as at 31 March 2009 31 March 2008 31 March 2009 31 March 2008 Rs. In Million Rs. In Million Rs. In Million Rs. In Million
Quoted 10,431.0 12,295.4 10,831.5 * 12,565.7 *
Unquoted 7,654.2 6,276.0 Total 18,085.2 18,571.4
Brought over 15,457.7 18,620.4In Mutual Fund Units: (Contd.) Quoted: (Contd.) Brought over 2,390.1 840.0
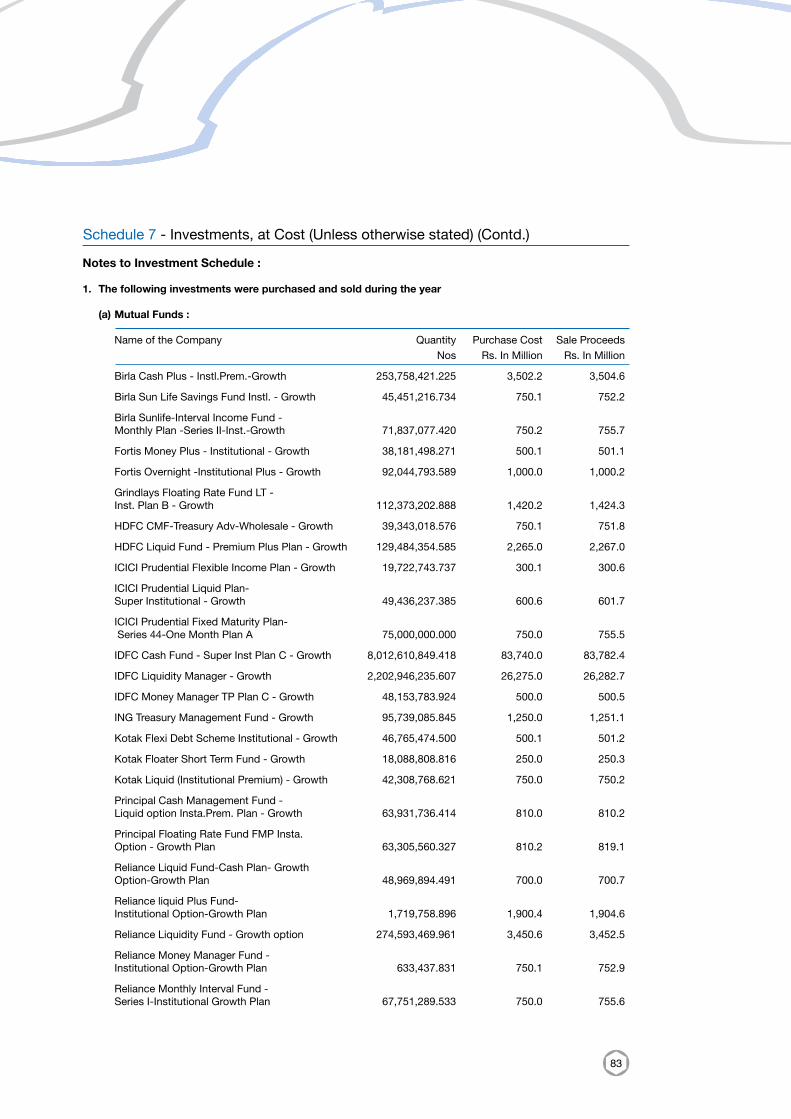
83
Schedule 7 - Investments, at Cost (Unless otherwise stated) (Contd.)
Notes to Investment Schedule :
1. The following investments were purchased and sold during the year
(a) Mutual Funds :
Name of the Company Quantity Purchase Cost Sale Proceeds Nos Rs. In Million Rs. In Million
Birla Cash Plus - Instl.Prem.-Growth 253,758,421.225 3,502.2 3,504.6
Birla Sun Life Savings Fund Instl. - Growth 45,451,216.734 750.1 752.2
Birla Sunlife-Interval Income Fund - Monthly Plan -Series II-Inst.-Growth 71,837,077.420 750.2 755.7
Fortis Money Plus - Institutional - Growth 38,181,498.271 500.1 501.1
Fortis Overnight -Institutional Plus - Growth 92,044,793.589 1,000.0 1,000.2
Grindlays Floating Rate Fund LT - Inst. Plan B - Growth 112,373,202.888 1,420.2 1,424.3
HDFC CMF-Treasury Adv-Wholesale - Growth 39,343,018.576 750.1 751.8
HDFC Liquid Fund - Premium Plus Plan - Growth 129,484,354.585 2,265.0 2,267.0
ICICI Prudential Flexible Income Plan - Growth 19,722,743.737 300.1 300.6
ICICI Prudential Liquid Plan- Super Institutional - Growth 49,436,237.385 600.6 601.7
ICICI Prudential Fixed Maturity Plan- Series 44-One Month Plan A 75,000,000.000 750.0 755.5
IDFC Cash Fund - Super Inst Plan C - Growth 8,012,610,849.418 83,740.0 83,782.4
IDFC Liquidity Manager - Growth 2,202,946,235.607 26,275.0 26,282.7
IDFC Money Manager TP Plan C - Growth 48,153,783.924 500.0 500.5
ING Treasury Management Fund - Growth 95,739,085.845 1,250.0 1,251.1
Kotak Flexi Debt Scheme Institutional - Growth 46,765,474.500 500.1 501.2
Kotak Floater Short Term Fund - Growth 18,088,808.816 250.0 250.3
Kotak Liquid (Institutional Premium) - Growth 42,308,768.621 750.0 750.2
Principal Cash Management Fund - Liquid option Insta.Prem. Plan - Growth 63,931,736.414 810.0 810.2
Principal Floating Rate Fund FMP Insta. Option - Growth Plan 63,305,560.327 810.2 819.1
Reliance Liquid Fund-Cash Plan- Growth Option-Growth Plan 48,969,894.491 700.0 700.7
Reliance liquid Plus Fund- Institutional Option-Growth Plan 1,719,758.896 1,900.4 1,904.6
Reliance Liquidity Fund - Growth option 274,593,469.961 3,450.6 3,452.5
Reliance Money Manager Fund - Institutional Option-Growth Plan 633,437.831 750.1 752.9
Reliance Monthly Interval Fund - Series I-Institutional Growth Plan 67,751,289.533 750.0 755.6
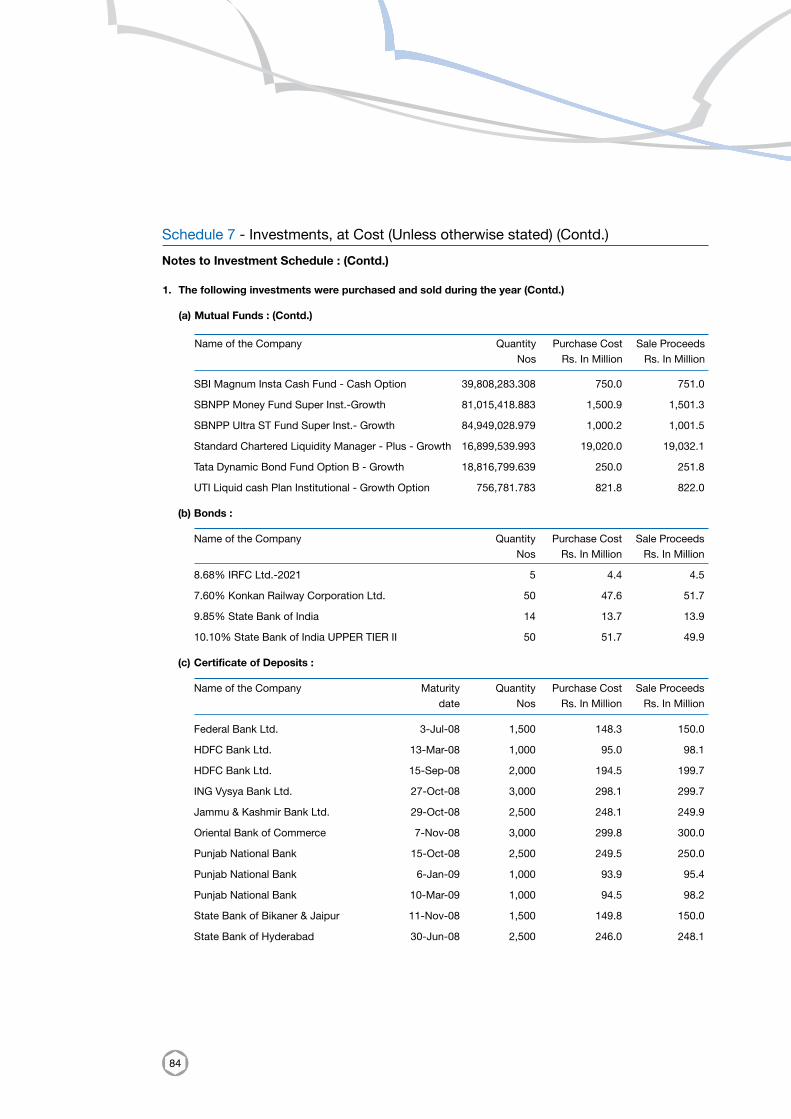
84
SBI Magnum Insta Cash Fund - Cash Option 39,808,283.308 750.0 751.0
SBNPP Money Fund Super Inst.-Growth 81,015,418.883 1,500.9 1,501.3
SBNPP Ultra ST Fund Super Inst.- Growth 84,949,028.979 1,000.2 1,001.5
Standard Chartered Liquidity Manager - Plus - Growth 16,899,539.993 19,020.0 19,032.1
Tata Dynamic Bond Fund Option B - Growth 18,816,799.639 250.0 251.8
UTI Liquid cash Plan Institutional - Growth Option 756,781.783 821.8 822.0
(b) Bonds :
Name of the Company Quantity Purchase Cost Sale Proceeds Nos Rs. In Million Rs. In Million
8.68% IRFC Ltd.-2021 5 4.4 4.5
7.60% Konkan Railway Corporation Ltd. 50 47.6 51.7
9.85% State Bank of India 14 13.7 13.9
10.10% State Bank of India UPPER TIER II 50 51.7 49.9
(c) Certificate of Deposits :
Name of the Company Maturity Quantity Purchase Cost Sale Proceeds date Nos Rs. In Million Rs. In Million
Federal Bank Ltd. 3-Jul-08 1,500 148.3 150.0
HDFC Bank Ltd. 13-Mar-08 1,000 95.0 98.1
HDFC Bank Ltd. 15-Sep-08 2,000 194.5 199.7
ING Vysya Bank Ltd. 27-Oct-08 3,000 298.1 299.7
Jammu & Kashmir Bank Ltd. 29-Oct-08 2,500 248.1 249.9
Oriental Bank of Commerce 7-Nov-08 3,000 299.8 300.0
Punjab National Bank 15-Oct-08 2,500 249.5 250.0
Punjab National Bank 6-Jan-09 1,000 93.9 95.4
Punjab National Bank 10-Mar-09 1,000 94.5 98.2
State Bank of Bikaner & Jaipur 11-Nov-08 1,500 149.8 150.0
State Bank of Hyderabad 30-Jun-08 2,500 246.0 248.1
Notes to Investment Schedule : (Contd.)
1. The following investments were purchased and sold during the year (Contd.)
(a) Mutual Funds : (Contd.)
Name of the Company Quantity Purchase Cost Sale Proceeds Nos Rs. In Million Rs. In Million
Schedule 7 - Investments, at Cost (Unless otherwise stated) (Contd.)
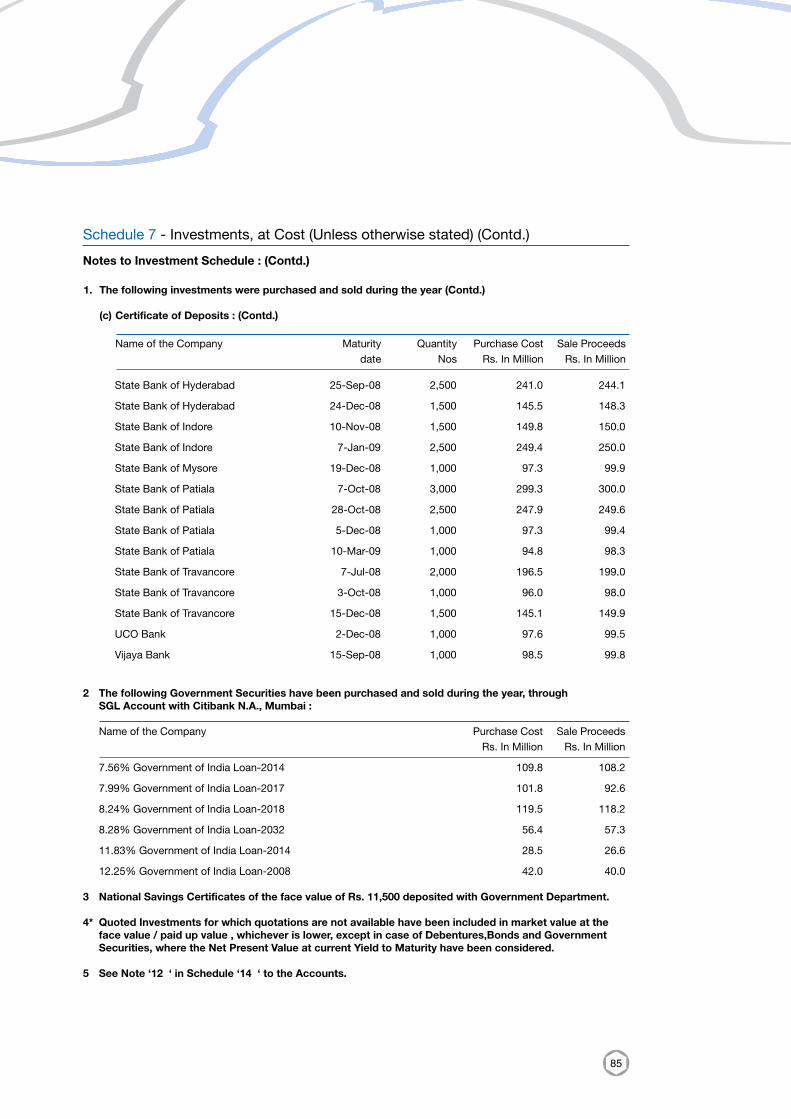
85
State Bank of Hyderabad 25-Sep-08 2,500 241.0 244.1
State Bank of Hyderabad 24-Dec-08 1,500 145.5 148.3
State Bank of Indore 10-Nov-08 1,500 149.8 150.0
State Bank of Indore 7-Jan-09 2,500 249.4 250.0
State Bank of Mysore 19-Dec-08 1,000 97.3 99.9
State Bank of Patiala 7-Oct-08 3,000 299.3 300.0
State Bank of Patiala 28-Oct-08 2,500 247.9 249.6
State Bank of Patiala 5-Dec-08 1,000 97.3 99.4
State Bank of Patiala 10-Mar-09 1,000 94.8 98.3
State Bank of Travancore 7-Jul-08 2,000 196.5 199.0
State Bank of Travancore 3-Oct-08 1,000 96.0 98.0
State Bank of Travancore 15-Dec-08 1,500 145.1 149.9
UCO Bank 2-Dec-08 1,000 97.6 99.5
Vijaya Bank 15-Sep-08 1,000 98.5 99.8
2 The following Government Securities have been purchased and sold during the year, through SGL Account with Citibank N.A., Mumbai :
Name of the Company Purchase Cost Sale Proceeds Rs. In Million Rs. In Million
7.56% Government of India Loan-2014 109.8 108.2
7.99% Government of India Loan-2017 101.8 92.6
8.24% Government of India Loan-2018 119.5 118.2
8.28% Government of India Loan-2032 56.4 57.3
11.83% Government of India Loan-2014 28.5 26.6
12.25% Government of India Loan-2008 42.0 40.0
3 National Savings Certificates of the face value of Rs. 11,500 deposited with Government Department.
4* Quoted Investments for which quotations are not available have been included in market value at the face value / paid up value , whichever is lower, except in case of Debentures,Bonds and Government Securities, where the Net Present Value at current Yield to Maturity have been considered.
5 See Note ‘12 ‘ in Schedule ‘14 ‘ to the Accounts.
Notes to Investment Schedule : (Contd.)
1. The following investments were purchased and sold during the year (Contd.)
(c) Certificate of Deposits : (Contd.)
Name of the Company Maturity Quantity Purchase Cost Sale Proceeds date Nos Rs. In Million Rs. In Million
Schedule 7 - Investments, at Cost (Unless otherwise stated) (Contd.)
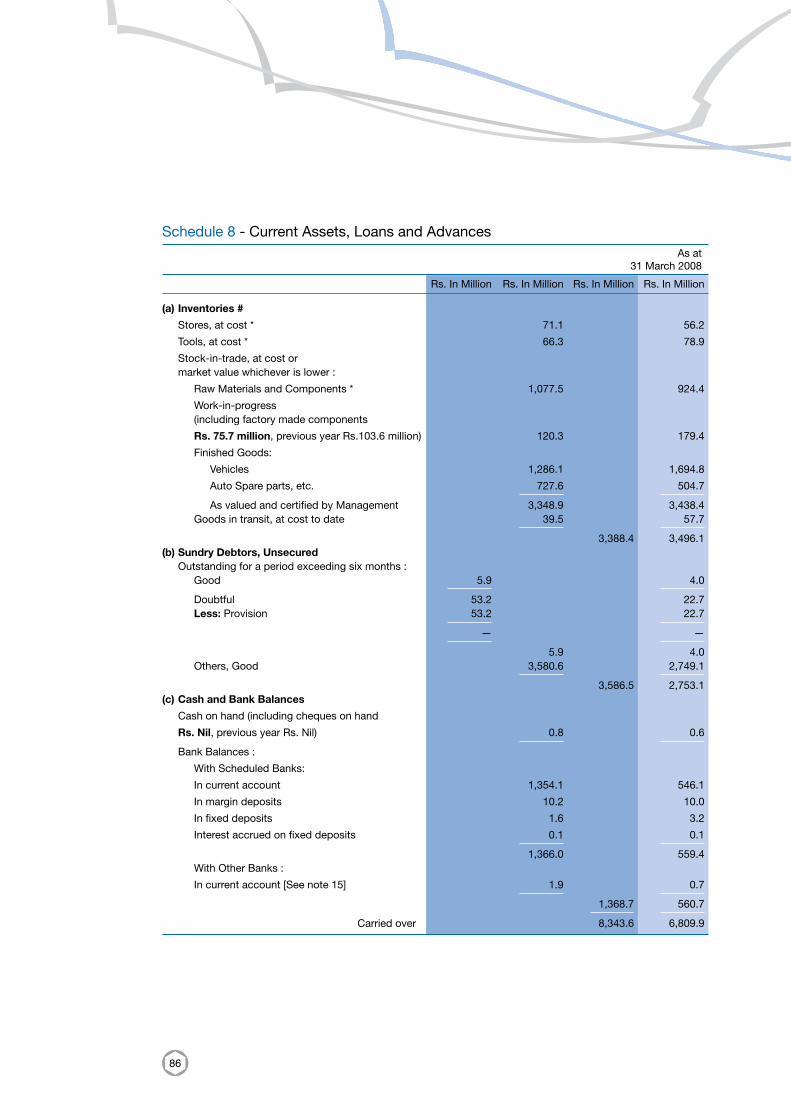
86
Schedule 8 - Current Assets, Loans and Advances As at 31 March 2008
Rs. In Million Rs. In Million Rs. In Million Rs. In Million
(a) Inventories #
Stores, at cost * 71.1 56.2
Tools, at cost * 66.3 78.9
Stock-in-trade, at cost or market value whichever is lower :
Raw Materials and Components * 1,077.5 924.4
Work-in-progress (including factory made components
Rs. 75.7 million, previous year Rs.103.6 million) 120.3 179.4
Finished Goods:
Vehicles 1,286.1 1,694.8
Auto Spare parts, etc. 727.6 504.7 As valued and certified by Management 3,348.9 3,438.4 Goods in transit, at cost to date 39.5 57.7 3,388.4 3,496.1 (b) Sundry Debtors, Unsecured Outstanding for a period exceeding six months : Good 5.9 4.0 Doubtful 53.2 22.7 Less: Provision 53.2 22.7 — — 5.9 4.0 Others, Good 3,580.6 2,749.1 3,586.5 2,753.1 (c) Cash and Bank Balances
Cash on hand (including cheques on hand
Rs. Nil, previous year Rs. Nil) 0.8 0.6 Bank Balances :
With Scheduled Banks:
In current account 1,354.1 546.1
In margin deposits 10.2 10.0
In fixed deposits 1.6 3.2
Interest accrued on fixed deposits 0.1 0.1 1,366.0 559.4 With Other Banks :
In current account [See note 15] 1.9 0.7 1,368.7 560.7 Carried over 8,343.6 6,809.9
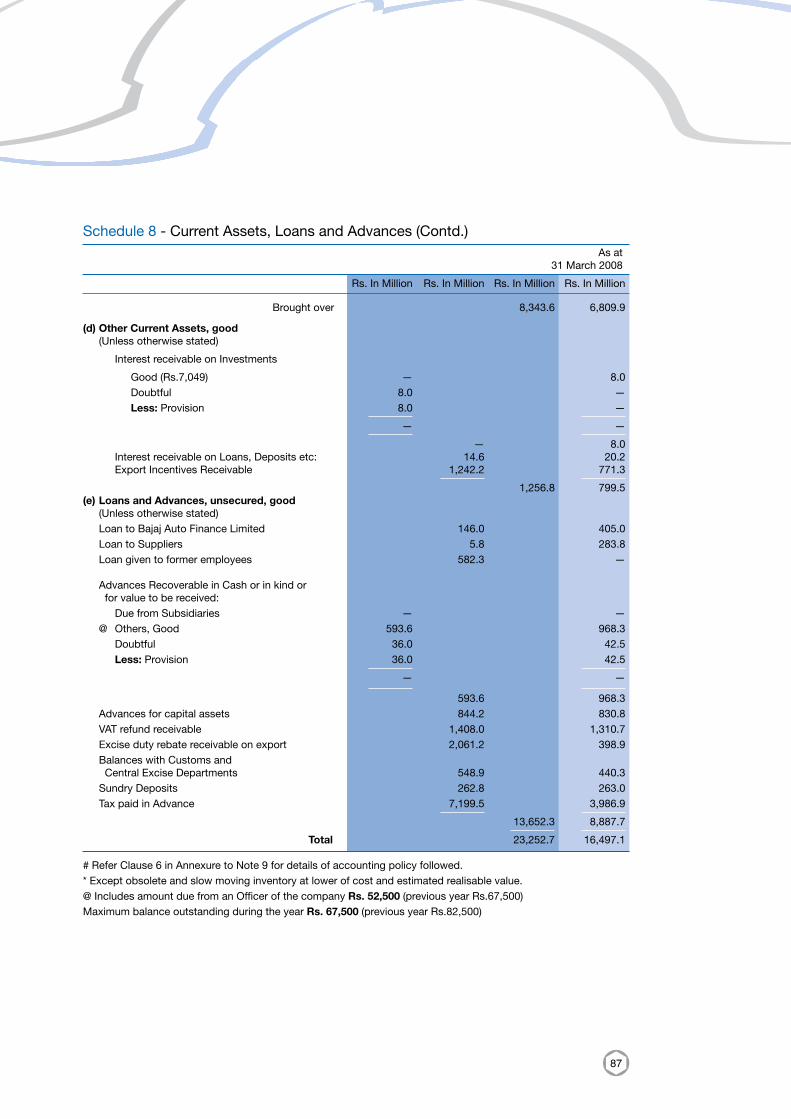
87
Schedule 8 - Current Assets, Loans and Advances (Contd.) As at 31 March 2008
Rs. In Million Rs. In Million Rs. In Million Rs. In Million
Brought over 8,343.6 6,809.9
(d) Other Current Assets, good (Unless otherwise stated)
Interest receivable on Investments
Good (Rs.7,049) — 8.0 Doubtful 8.0 — Less: Provision 8.0 — — — — 8.0 Interest receivable on Loans, Deposits etc: 14.6 20.2 Export Incentives Receivable 1,242.2 771.3 1,256.8 799.5 (e) Loans and Advances, unsecured, good (Unless otherwise stated) Loan to Bajaj Auto Finance Limited 146.0 405.0 Loan to Suppliers 5.8 283.8 Loan given to former employees 582.3 —
Advances Recoverable in Cash or in kind or for value to be received: Due from Subsidiaries — — @ Others, Good 593.6 968.3 Doubtful 36.0 42.5 Less: Provision 36.0 42.5 — — 593.6 968.3 Advances for capital assets 844.2 830.8 VAT refund receivable 1,408.0 1,310.7 Excise duty rebate receivable on export 2,061.2 398.9 Balances with Customs and Central Excise Departments 548.9 440.3 Sundry Deposits 262.8 263.0 Tax paid in Advance 7,199.5 3,986.9 13,652.3 8,887.7 Total 23,252.7 16,497.1
# Refer Clause 6 in Annexure to Note 9 for details of accounting policy followed.* Except obsolete and slow moving inventory at lower of cost and estimated realisable value.@ Includes amount due from an Officer of the company Rs. 52,500 (previous year Rs.67,500) Maximum balance outstanding during the year Rs. 67,500 (previous year Rs.82,500)
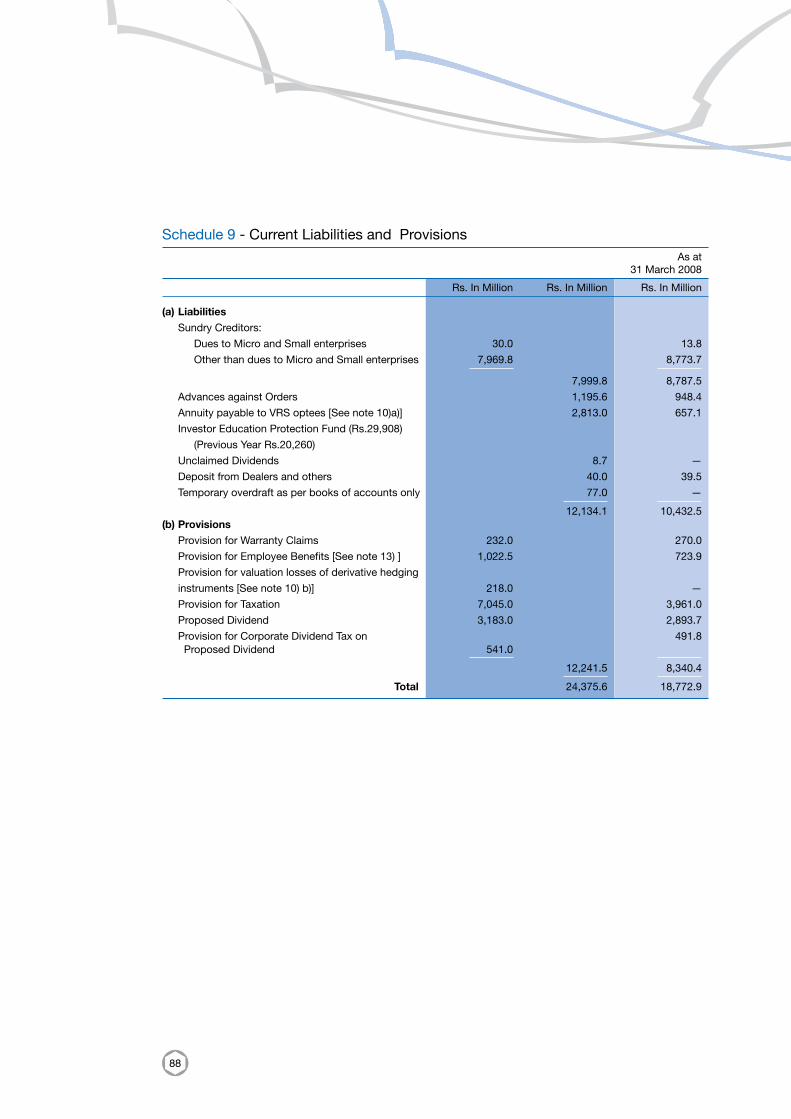
88
Schedule 9 - Current Liabilities and Provisions As at 31 March 2008
Rs. In Million Rs. In Million Rs. In Million
(a) Liabilities
Sundry Creditors:
Dues to Micro and Small enterprises 30.0 13.8
Other than dues to Micro and Small enterprises 7,969.8 8,773.7
7,999.8 8,787.5
Advances against Orders 1,195.6 948.4
Annuity payable to VRS optees [See note 10)a)] 2,813.0 657.1
Investor Education Protection Fund (Rs.29,908)
(Previous Year Rs.20,260)
Unclaimed Dividends 8.7 —
Deposit from Dealers and others 40.0 39.5
Temporary overdraft as per books of accounts only 77.0 — 12,134.1 10,432.5 (b) Provisions
Provision for Warranty Claims 232.0 270.0
Provision for Employee Benefits [See note 13) ] 1,022.5 723.9
Provision for valuation losses of derivative hedging
instruments [See note 10) b)] 218.0 —
Provision for Taxation 7,045.0 3,961.0
Proposed Dividend 3,183.0 2,893.7
Provision for Corporate Dividend Tax on 491.8 Proposed Dividend 541.0 12,241.5 8,340.4 Total 24,375.6 18,772.9
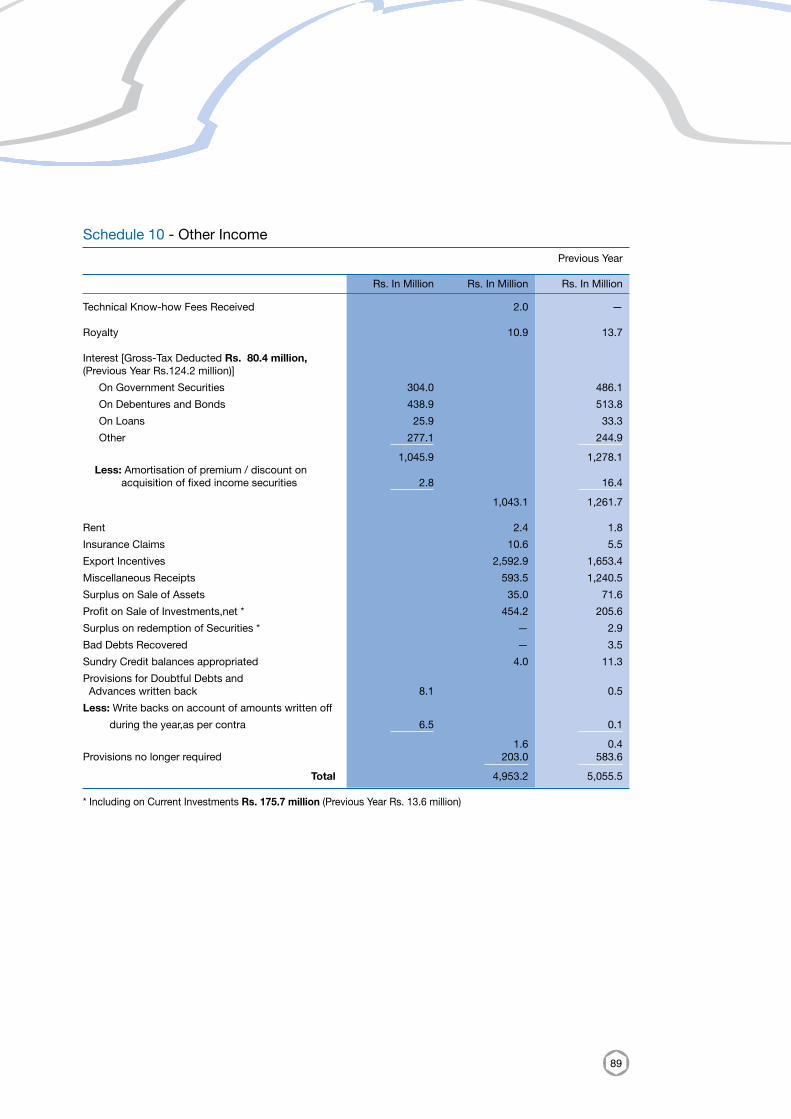
89
Schedule 10 - Other Income
Previous Year
Rs. In Million Rs. In Million Rs. In Million
Technical Know-how Fees Received 2.0 — Royalty 10.9 13.7 Interest [Gross-Tax Deducted Rs. 80.4 million, (Previous Year Rs.124.2 million)]
On Government Securities 304.0 486.1
On Debentures and Bonds 438.9 513.8
On Loans 25.9 33.3
Other 277.1 244.9 1,045.9 1,278.1 Less: Amortisation of premium / discount on acquisition of fixed income securities 2.8 16.4 1,043.1 1,261.7
Rent 2.4 1.8
Insurance Claims 10.6 5.5
Export Incentives 2,592.9 1,653.4
Miscellaneous Receipts 593.5 1,240.5
Surplus on Sale of Assets 35.0 71.6
Profit on Sale of Investments,net * 454.2 205.6
Surplus on redemption of Securities * — 2.9
Bad Debts Recovered — 3.5
Sundry Credit balances appropriated 4.0 11.3
Provisions for Doubtful Debts and Advances written back 8.1 0.5
Less: Write backs on account of amounts written off
during the year,as per contra 6.5 0.1 1.6 0.4 Provisions no longer required 203.0 583.6 Total 4,953.2 5,055.5 * Including on Current Investments Rs. 175.7 million (Previous Year Rs. 13.6 million)
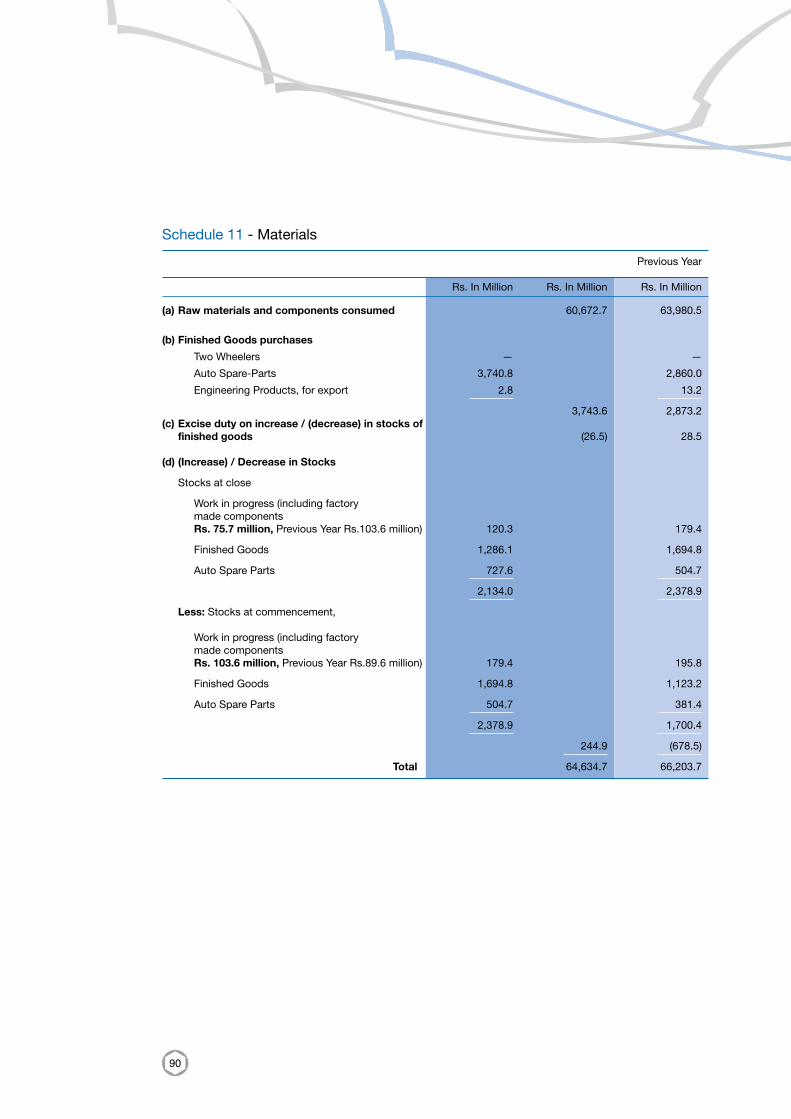
90
Schedule 11 - Materials
(a) Raw materials and components consumed 60,672.7 63,980.5
(b) Finished Goods purchases
Two Wheelers — —
Auto Spare-Parts 3,740.8 2,860.0
Engineering Products, for export 2.8 13.2 3,743.6 2,873.2 (c) Excise duty on increase / (decrease) in stocks of finished goods (26.5) 28.5
(d) (Increase) / Decrease in Stocks
Stocks at close
Work in progress (including factory made components Rs. 75.7 million, Previous Year Rs.103.6 million) 120.3 179.4
Finished Goods 1,286.1 1,694.8
Auto Spare Parts 727.6 504.7 2,134.0 2,378.9 Less: Stocks at commencement,
Work in progress (including factory made components Rs. 103.6 million, Previous Year Rs.89.6 million) 179.4 195.8
Finished Goods 1,694.8 1,123.2
Auto Spare Parts 504.7 381.4 2,378.9 1,700.4 244.9 (678.5) Total 64,634.7 66,203.7
Previous Year
Rs. In Million Rs. In Million Rs. In Million
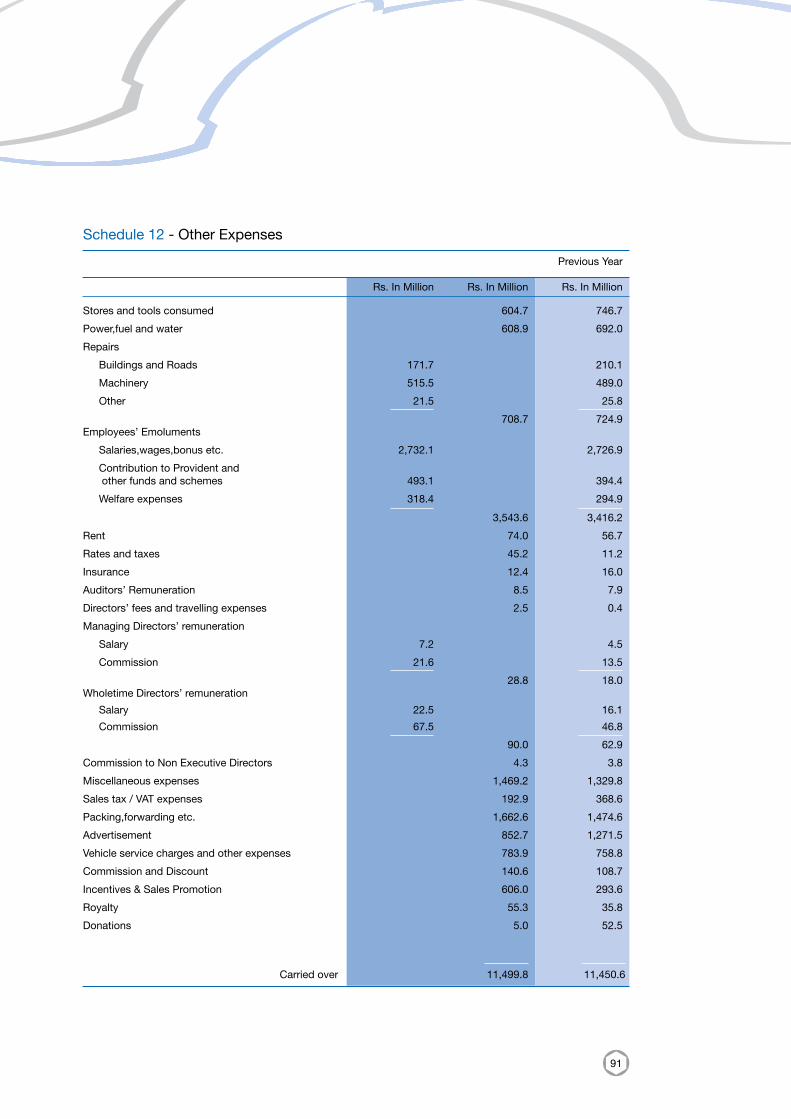
91
Schedule 12 - Other Expenses
Stores and tools consumed 604.7 746.7
Power,fuel and water 608.9 692.0
Repairs
Buildings and Roads 171.7 210.1
Machinery 515.5 489.0
Other 21.5 25.8 708.7 724.9 Employees’ Emoluments
Salaries,wages,bonus etc. 2,732.1 2,726.9
Contribution to Provident and other funds and schemes 493.1 394.4
Welfare expenses 318.4 294.9 3,543.6 3,416.2
Rent 74.0 56.7
Rates and taxes 45.2 11.2
Insurance 12.4 16.0
Auditors’ Remuneration 8.5 7.9
Directors’ fees and travelling expenses 2.5 0.4
Managing Directors’ remuneration
Salary 7.2 4.5
Commission 21.6 13.5 28.8 18.0 Wholetime Directors’ remuneration
Salary 22.5 16.1
Commission 67.5 46.8 90.0 62.9
Commission to Non Executive Directors 4.3 3.8
Miscellaneous expenses 1,469.2 1,329.8
Sales tax / VAT expenses 192.9 368.6
Packing,forwarding etc. 1,662.6 1,474.6
Advertisement 852.7 1,271.5
Vehicle service charges and other expenses 783.9 758.8
Commission and Discount 140.6 108.7
Incentives & Sales Promotion 606.0 293.6
Royalty 55.3 35.8
Donations 5.0 52.5
Previous Year
Rs. In Million Rs. In Million Rs. In Million
Carried over 11,499.8 11,450.6
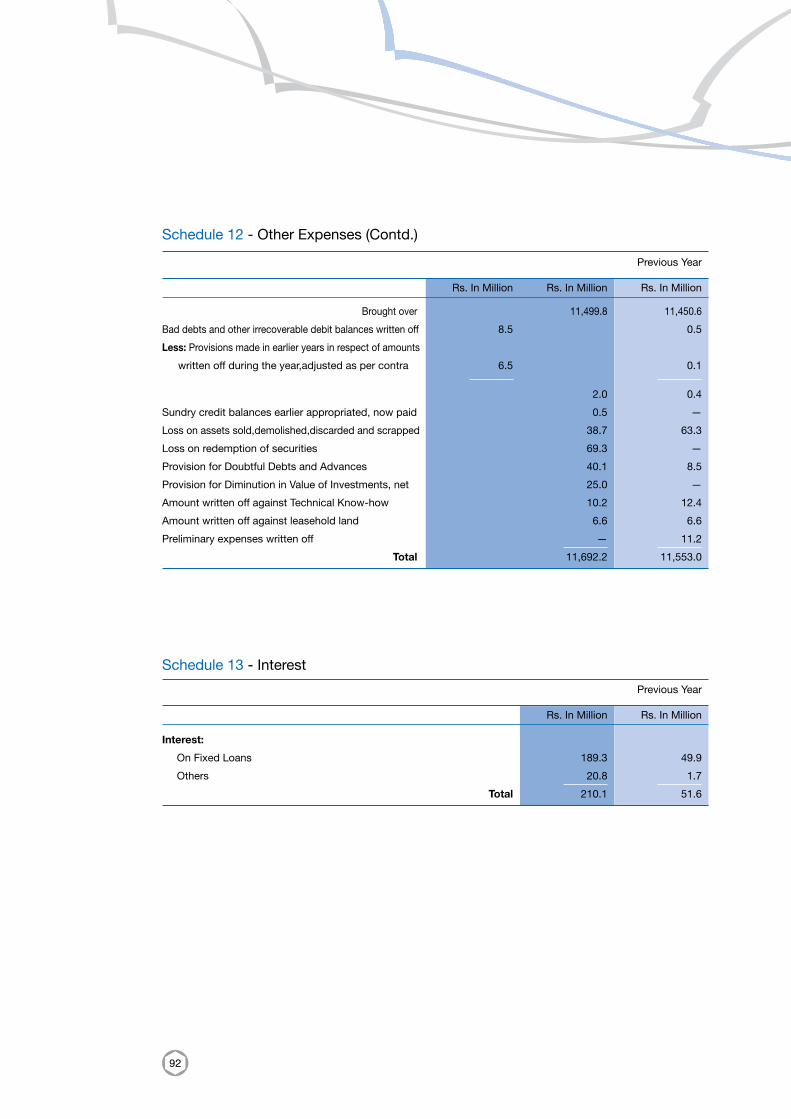
92
Schedule 12 - Other Expenses (Contd.)
Schedule 13 - Interest
Interest:
On Fixed Loans 189.3 49.9
Others 20.8 1.7 Total 210.1 51.6
Brought over 11,499.8 11,450.6
Bad debts and other irrecoverable debit balances written off 8.5 0.5
Less: Provisions made in earlier years in respect of amounts
written off during the year,adjusted as per contra 6.5 0.1
2.0 0.4
Sundry credit balances earlier appropriated, now paid 0.5 —
Loss on assets sold,demolished,discarded and scrapped 38.7 63.3
Loss on redemption of securities 69.3 —
Provision for Doubtful Debts and Advances 40.1 8.5
Provision for Diminution in Value of Investments, net 25.0 —
Amount written off against Technical Know-how 10.2 12.4
Amount written off against leasehold land 6.6 6.6
Preliminary expenses written off — 11.2 Total 11,692.2 11,553.0
Previous Year
Rs. In Million Rs. In Million Rs. In Million
Previous Year
Rs. In Million Rs. In Million
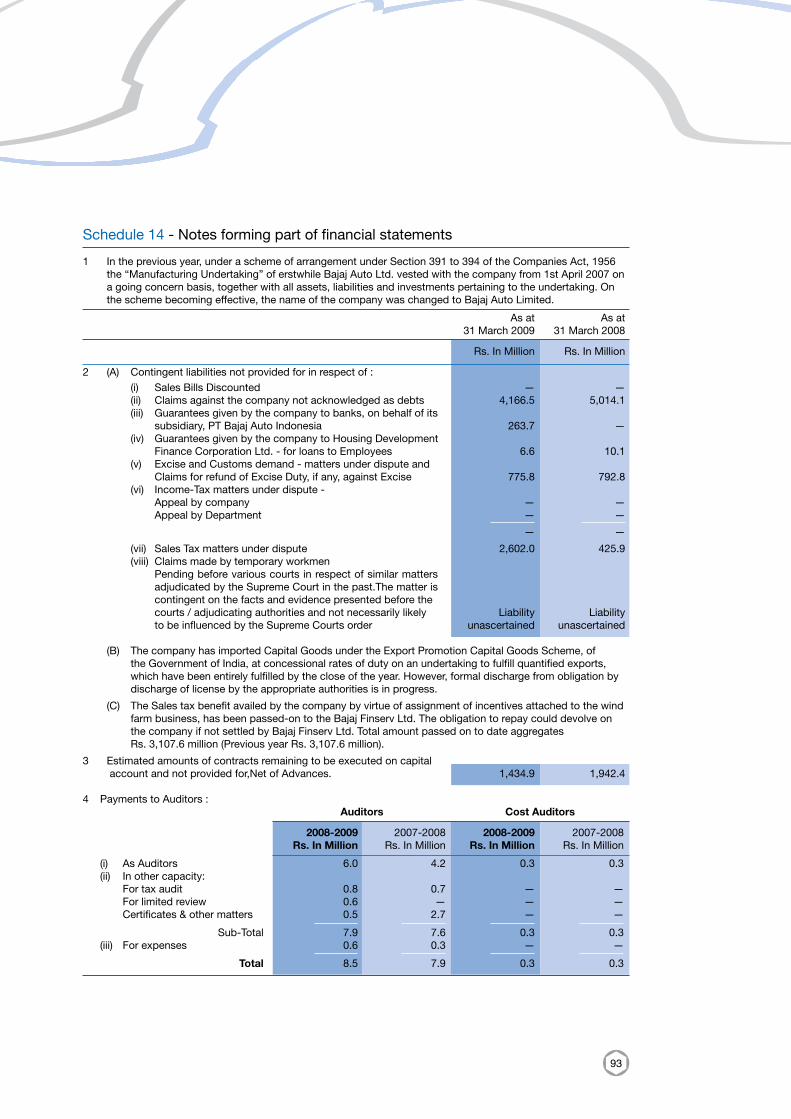
93
Schedule 14 - Notes forming part of financial statements
1 In the previous year, under a scheme of arrangement under Section 391 to 394 of the Companies Act, 1956 the “Manufacturing Undertaking” of erstwhile Bajaj Auto Ltd. vested with the company from 1st April 2007 on a going concern basis, together with all assets, liabilities and investments pertaining to the undertaking. On the scheme becoming effective, the name of the company was changed to Bajaj Auto Limited.
As at As at 31 March 2009 31 March 2008
Rs. In Million Rs. In Million
2 (A) Contingent liabilities not provided for in respect of : (i) Sales Bills Discounted — — (ii) Claims against the company not acknowledged as debts 4,166.5 5,014.1 (iii) Guarantees given by the company to banks, on behalf of its subsidiary, PT Bajaj Auto Indonesia 263.7 — (iv) Guarantees given by the company to Housing Development Finance Corporation Ltd. - for loans to Employees 6.6 10.1 (v) Excise and Customs demand - matters under dispute and Claims for refund of Excise Duty, if any, against Excise 775.8 792.8 (vi) Income-Tax matters under dispute - Appeal by company — — Appeal by Department — — — —
(vii) Sales Tax matters under dispute 2,602.0 425.9 (viii) Claims made by temporary workmen Pending before various courts in respect of similar matters
adjudicated by the Supreme Court in the past.The matter is contingent on the facts and evidence presented before the
courts / adjudicating authorities and not necessarily likely Liability Liability to be influenced by the Supreme Courts order unascertained unascertained
(B) The company has imported Capital Goods under the Export Promotion Capital Goods Scheme, of the Government of India, at concessional rates of duty on an undertaking to fulfill quantified exports, which have been entirely fulfilled by the close of the year. However, formal discharge from obligation by discharge of license by the appropriate authorities is in progress.
(C) The Sales tax benefit availed by the company by virtue of assignment of incentives attached to the wind farm business, has been passed-on to the Bajaj Finserv Ltd. The obligation to repay could devolve on the company if not settled by Bajaj Finserv Ltd. Total amount passed on to date aggregates Rs. 3,107.6 million (Previous year Rs. 3,107.6 million).
3 Estimated amounts of contracts remaining to be executed on capital account and not provided for,Net of Advances. 1,434.9 1,942.4
4 Payments to Auditors : Auditors Cost Auditors
2008-2009 2007-2008 2008-2009 2007-2008 Rs. In Million Rs. In Million Rs. In Million Rs. In Million
(i) As Auditors 6.0 4.2 0.3 0.3 (ii) In other capacity: For tax audit 0.8 0.7 — — For limited review 0.6 — — — Certificates & other matters 0.5 2.7 — — Sub-Total 7.9 7.6 0.3 0.3 (iii) For expenses 0.6 0.3 — — Total 8.5 7.9 0.3 0.3
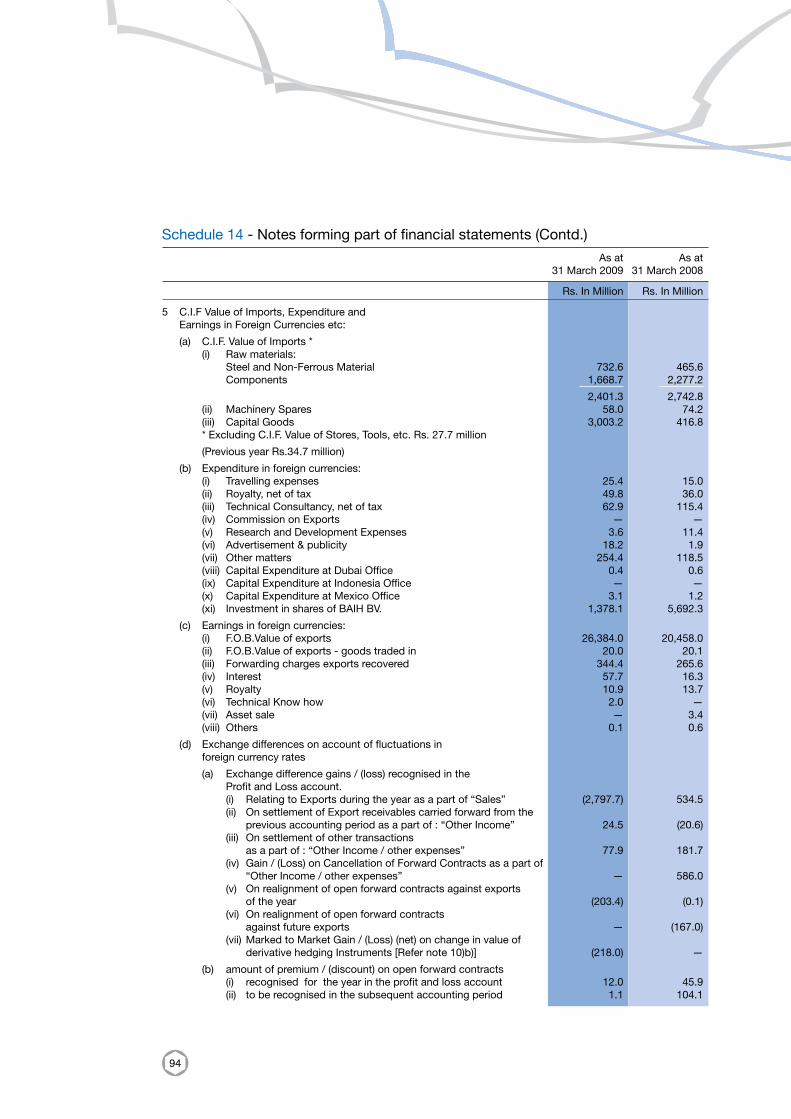
94
Schedule 14 - Notes forming part of financial statements (Contd.)
As at As at 31 March 2009 31 March 2008
Rs. In Million Rs. In Million
5 C.I.F Value of Imports, Expenditure and Earnings in Foreign Currencies etc:
(a) C.I.F. Value of Imports * (i) Raw materials: Steel and Non-Ferrous Material 732.6 465.6 Components 1,668.7 2,277.2 2,401.3 2,742.8 (ii) Machinery Spares 58.0 74.2 (iii) Capital Goods 3,003.2 416.8 * Excluding C.I.F. Value of Stores, Tools, etc. Rs. 27.7 million
(Previous year Rs.34.7 million)
(b) Expenditure in foreign currencies: (i) Travelling expenses 25.4 15.0 (ii) Royalty, net of tax 49.8 36.0 (iii) Technical Consultancy, net of tax 62.9 115.4 (iv) Commission on Exports — — (v) Research and Development Expenses 3.6 11.4 (vi) Advertisement & publicity 18.2 1.9 (vii) Other matters 254.4 118.5 (viii) Capital Expenditure at Dubai Office 0.4 0.6 (ix) Capital Expenditure at Indonesia Office — — (x) Capital Expenditure at Mexico Office 3.1 1.2 (xi) Investment in shares of BAIH BV. 1,378.1 5,692.3
(c) Earnings in foreign currencies: (i) F.O.B.Value of exports 26,384.0 20,458.0 (ii) F.O.B.Value of exports - goods traded in 20.0 20.1 (iii) Forwarding charges exports recovered 344.4 265.6 (iv) Interest 57.7 16.3 (v) Royalty 10.9 13.7 (vi) Technical Know how 2.0 — (vii) Asset sale — 3.4 (viii) Others 0.1 0.6
(d) Exchange differences on account of fluctuations in foreign currency rates
(a) Exchange difference gains / (loss) recognised in the Profit and Loss account. (i) Relating to Exports during the year as a part of “Sales” (2,797.7) 534.5 (ii) On settlement of Export receivables carried forward from the previous accounting period as a part of : “Other Income” 24.5 (20.6) (iii) On settlement of other transactions as a part of : “Other Income / other expenses” 77.9 181.7 (iv) Gain / (Loss) on Cancellation of Forward Contracts as a part of “Other Income / other expenses” — 586.0 (v) On realignment of open forward contracts against exports of the year (203.4) (0.1) (vi) On realignment of open forward contracts against future exports — (167.0) (vii) Marked to Market Gain / (Loss) (net) on change in value of derivative hedging Instruments [Refer note 10)b)] (218.0) —
(b) amount of premium / (discount) on open forward contracts (i) recognised for the year in the profit and loss account 12.0 45.9 (ii) to be recognised in the subsequent accounting period 1.1 104.1
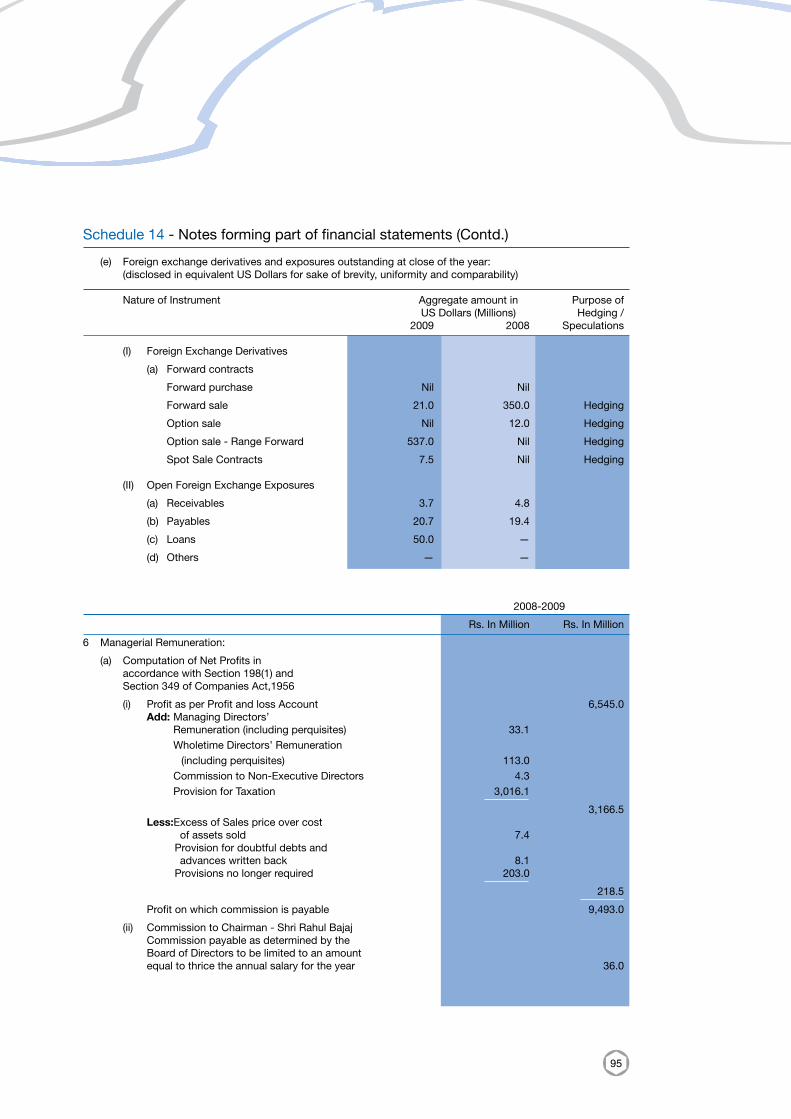
95
Schedule 14 - Notes forming part of financial statements (Contd.)
(e) Foreign exchange derivatives and exposures outstanding at close of the year: (disclosed in equivalent US Dollars for sake of brevity, uniformity and comparability) Nature of Instrument Aggregate amount in Purpose of US Dollars (Millions) Hedging / 2009 2008 Speculations
(I) Foreign Exchange Derivatives
(a) Forward contracts
Forward purchase Nil Nil
Forward sale 21.0 350.0 Hedging
Option sale Nil 12.0 Hedging
Option sale - Range Forward 537.0 Nil Hedging
Spot Sale Contracts 7.5 Nil Hedging
(II) Open Foreign Exchange Exposures
(a) Receivables 3.7 4.8
(b) Payables 20.7 19.4
(c) Loans 50.0 —
(d) Others — —
2008-2009
Rs. In Million Rs. In Million
6 Managerial Remuneration:
(a) Computation of Net Profits in accordance with Section 198(1) and Section 349 of Companies Act,1956
(i) Profit as per Profit and loss Account 6,545.0 Add: Managing Directors’ Remuneration (including perquisites) 33.1 Wholetime Directors’ Remuneration (including perquisites) 113.0 Commission to Non-Executive Directors 4.3 Provision for Taxation 3,016.1 3,166.5 Less:Excess of Sales price over cost of assets sold 7.4 Provision for doubtful debts and advances written back 8.1 Provisions no longer required 203.0 218.5 Profit on which commission is payable 9,493.0
(ii) Commission to Chairman - Shri Rahul Bajaj Commission payable as determined by the Board of Directors to be limited to an amount equal to thrice the annual salary for the year 36.0
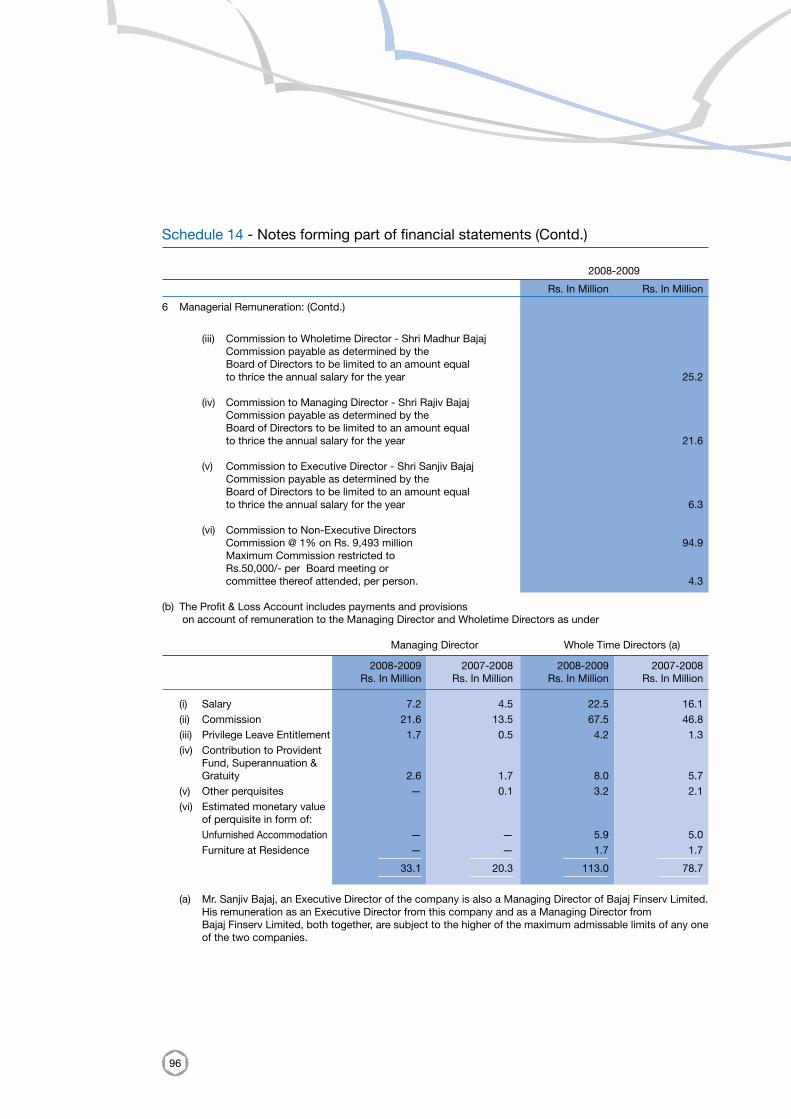
96
(iii) Commission to Wholetime Director - Shri Madhur Bajaj Commission payable as determined by the Board of Directors to be limited to an amount equal to thrice the annual salary for the year 25.2 (iv) Commission to Managing Director - Shri Rajiv Bajaj Commission payable as determined by the Board of Directors to be limited to an amount equal to thrice the annual salary for the year 21.6
(v) Commission to Executive Director - Shri Sanjiv Bajaj Commission payable as determined by the Board of Directors to be limited to an amount equal to thrice the annual salary for the year 6.3
(vi) Commission to Non-Executive Directors Commission @ 1% on Rs. 9,493 million 94.9 Maximum Commission restricted to
Rs.50,000/- per Board meeting or committee thereof attended, per person. 4.3
(b) The Profit & Loss Account includes payments and provisions on account of remuneration to the Managing Director and Wholetime Directors as under
Managing Director Whole Time Directors (a)
2008-2009 2007-2008 2008-2009 2007-2008 Rs. In Million Rs. In Million Rs. In Million Rs. In Million
(i) Salary 7.2 4.5 22.5 16.1 (ii) Commission 21.6 13.5 67.5 46.8 (iii) Privilege Leave Entitlement 1.7 0.5 4.2 1.3 (iv) Contribution to Provident Fund, Superannuation & Gratuity 2.6 1.7 8.0 5.7 (v) Other perquisites — 0.1 3.2 2.1 (vi) Estimated monetary value of perquisite in form of: Unfurnished Accommodation — — 5.9 5.0 Furniture at Residence — — 1.7 1.7 33.1 20.3 113.0 78.7
(a) Mr. Sanjiv Bajaj, an Executive Director of the company is also a Managing Director of Bajaj Finserv Limited. His remuneration as an Executive Director from this company and as a Managing Director from Bajaj Finserv Limited, both together, are subject to the higher of the maximum admissable limits of any one of the two companies.
Schedule 14 - Notes forming part of financial statements (Contd.)
2008-2009
Rs. In Million Rs. In Million
6 Managerial Remuneration: (Contd.)
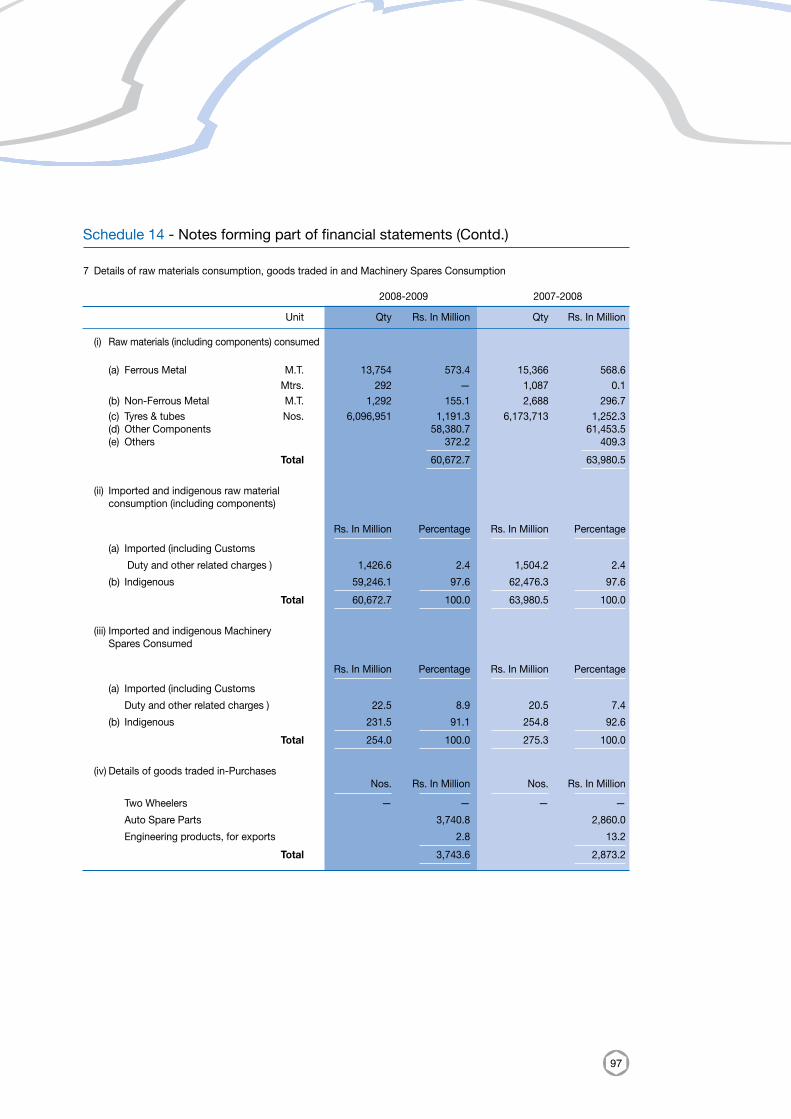
97
7 Details of raw materials consumption, goods traded in and Machinery Spares Consumption 2008-2009 2007-2008
Unit Qty Rs. In Million Qty Rs. In Million
(i) Raw materials (including components) consumed
(a) Ferrous Metal M.T. 13,754 573.4 15,366 568.6 Mtrs. 292 — 1,087 0.1 (b) Non-Ferrous Metal M.T. 1,292 155.1 2,688 296.7 (c) Tyres & tubes Nos. 6,096,951 1,191.3 6,173,713 1,252.3 (d) Other Components 58,380.7 61,453.5 (e) Others 372.2 409.3 Total 60,672.7 63,980.5
(ii) Imported and indigenous raw material consumption (including components)
Rs. In Million Percentage Rs. In Million Percentage (a) Imported (including Customs
Duty and other related charges ) 1,426.6 2.4 1,504.2 2.4
(b) Indigenous 59,246.1 97.6 62,476.3 97.6 Total 60,672.7 100.0 63,980.5 100.0
(iii) Imported and indigenous Machinery Spares Consumed
Rs. In Million Percentage Rs. In Million Percentage (a) Imported (including Customs
Duty and other related charges ) 22.5 8.9 20.5 7.4
(b) Indigenous 231.5 91.1 254.8 92.6 Total 254.0 100.0 275.3 100.0
(iv) Details of goods traded in-Purchases Nos. Rs. In Million Nos. Rs. In Million Two Wheelers — — — —
Auto Spare Parts 3,740.8 2,860.0
Engineering products, for exports 2.8 13.2 Total 3,743.6 2,873.2
Schedule 14 - Notes forming part of financial statements (Contd.)
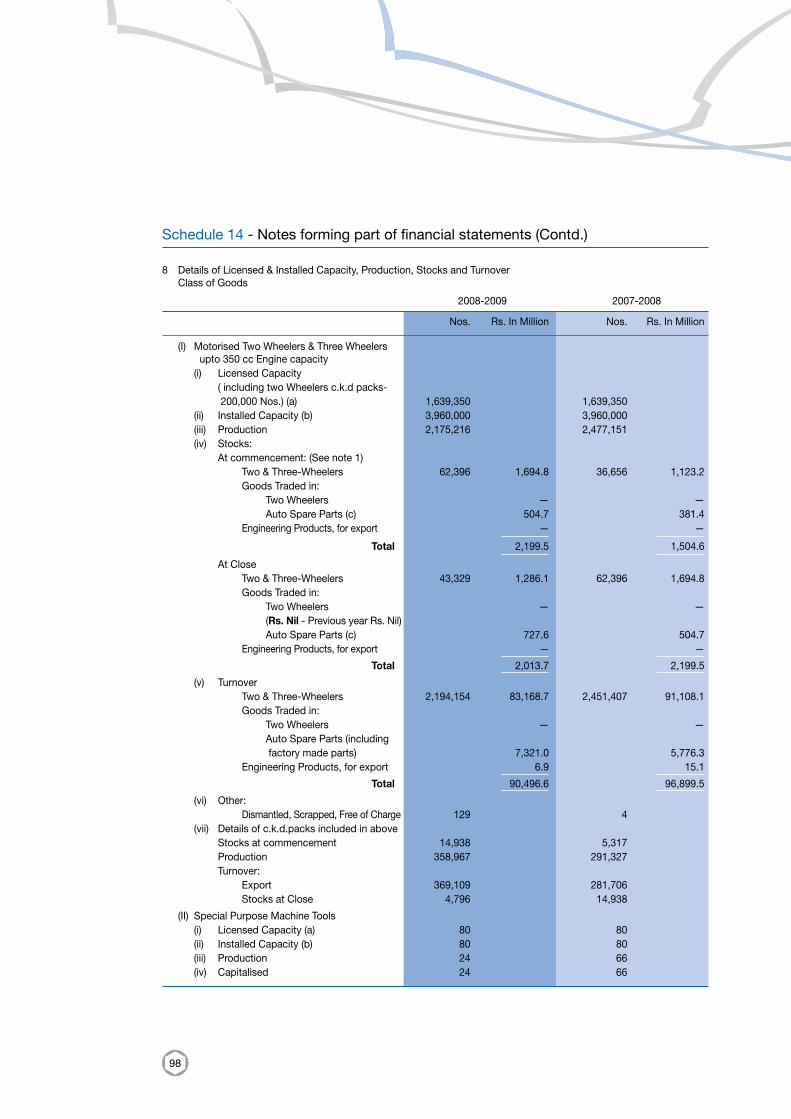
98
8 Details of Licensed & Installed Capacity, Production, Stocks and Turnover Class of Goods
2008-2009 2007-2008
Nos. Rs. In Million Nos. Rs. In Million
(I) Motorised Two Wheelers & Three Wheelers upto 350 cc Engine capacity (i) Licensed Capacity ( including two Wheelers c.k.d packs- 200,000 Nos.) (a) 1,639,350 1,639,350 (ii) Installed Capacity (b) 3,960,000 3,960,000 (iii) Production 2,175,216 2,477,151 (iv) Stocks: At commencement: (See note 1) Two & Three-Wheelers 62,396 1,694.8 36,656 1,123.2 Goods Traded in: Two Wheelers — — Auto Spare Parts (c) 504.7 381.4 Engineering Products, for export — — Total 2,199.5 1,504.6 At Close Two & Three-Wheelers 43,329 1,286.1 62,396 1,694.8 Goods Traded in: Two Wheelers — — (Rs. Nil - Previous year Rs. Nil) Auto Spare Parts (c) 727.6 504.7 Engineering Products, for export — — Total 2,013.7 2,199.5 (v) Turnover Two & Three-Wheelers 2,194,154 83,168.7 2,451,407 91,108.1 Goods Traded in: Two Wheelers — — Auto Spare Parts (including factory made parts) 7,321.0 5,776.3 Engineering Products, for export 6.9 15.1 Total 90,496.6 96,899.5 (vi) Other: Dismantled, Scrapped, Free of Charge 129 4 (vii) Details of c.k.d.packs included in above Stocks at commencement 14,938 5,317 Production 358,967 291,327 Turnover: Export 369,109 281,706 Stocks at Close 4,796 14,938
(II) Special Purpose Machine Tools (i) Licensed Capacity (a) 80 80 (ii) Installed Capacity (b) 80 80 (iii) Production 24 66 (iv) Capitalised 24 66
Schedule 14 - Notes forming part of financial statements (Contd.)
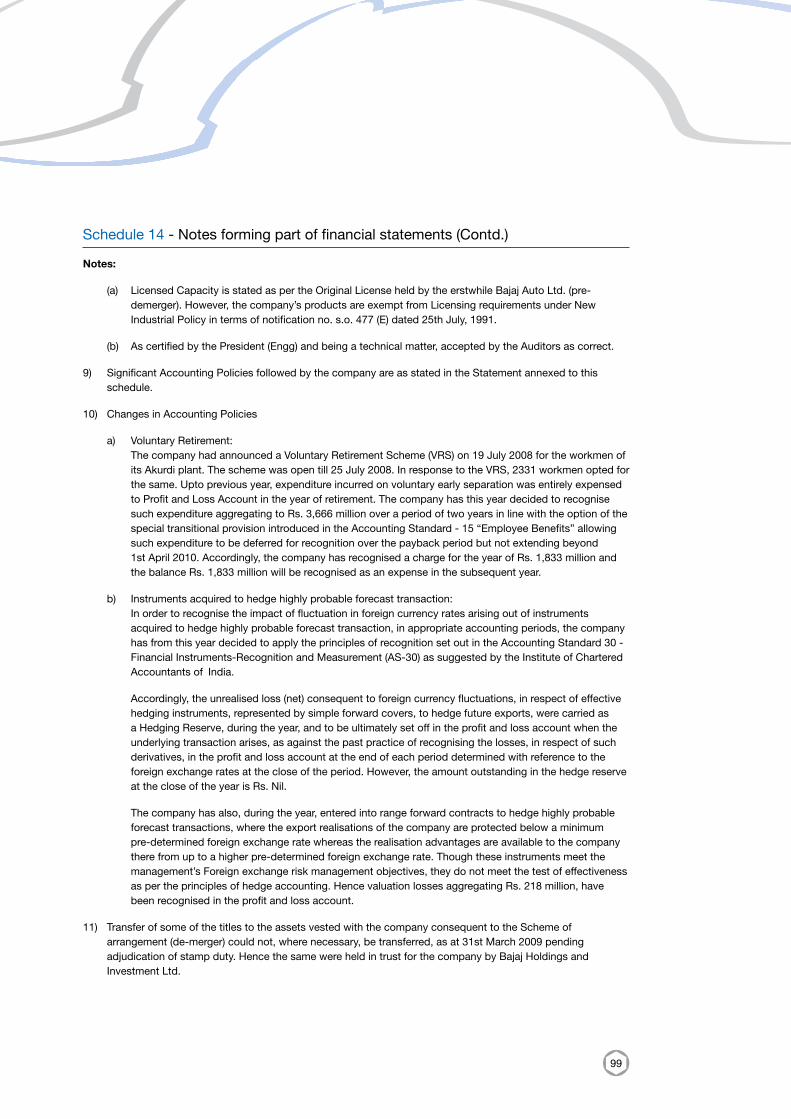
99
Notes:
(a) Licensed Capacity is stated as per the Original License held by the erstwhile Bajaj Auto Ltd. (pre-demerger). However, the company’s products are exempt from Licensing requirements under New Industrial Policy in terms of notification no. s.o. 477 (E) dated 25th July, 1991.
(b) As certified by the President (Engg) and being a technical matter, accepted by the Auditors as correct.
9) Significant Accounting Policies followed by the company are as stated in the Statement annexed to this schedule.
10) Changes in Accounting Policies
a) Voluntary Retirement: The company had announced a Voluntary Retirement Scheme (VRS) on 19 July 2008 for the workmen of
its Akurdi plant. The scheme was open till 25 July 2008. In response to the VRS, 2331 workmen opted for the same. Upto previous year, expenditure incurred on voluntary early separation was entirely expensed to Profit and Loss Account in the year of retirement. The company has this year decided to recognise such expenditure aggregating to Rs. 3,666 million over a period of two years in line with the option of the special transitional provision introduced in the Accounting Standard - 15 “Employee Benefits” allowing such expenditure to be deferred for recognition over the payback period but not extending beyond 1st April 2010. Accordingly, the company has recognised a charge for the year of Rs. 1,833 million and the balance Rs. 1,833 million will be recognised as an expense in the subsequent year.
b) Instruments acquired to hedge highly probable forecast transaction: In order to recognise the impact of fluctuation in foreign currency rates arising out of instruments
acquired to hedge highly probable forecast transaction, in appropriate accounting periods, the company has from this year decided to apply the principles of recognition set out in the Accounting Standard 30 - Financial Instruments-Recognition and Measurement (AS-30) as suggested by the Institute of Chartered Accountants of India.
Accordingly, the unrealised loss (net) consequent to foreign currency fluctuations, in respect of effective hedging instruments, represented by simple forward covers, to hedge future exports, were carried as a Hedging Reserve, during the year, and to be ultimately set off in the profit and loss account when the underlying transaction arises, as against the past practice of recognising the losses, in respect of such derivatives, in the profit and loss account at the end of each period determined with reference to the foreign exchange rates at the close of the period. However, the amount outstanding in the hedge reserve at the close of the year is Rs. Nil.
The company has also, during the year, entered into range forward contracts to hedge highly probable forecast transactions, where the export realisations of the company are protected below a minimum pre-determined foreign exchange rate whereas the realisation advantages are available to the company there from up to a higher pre-determined foreign exchange rate. Though these instruments meet the management’s Foreign exchange risk management objectives, they do not meet the test of effectiveness as per the principles of hedge accounting. Hence valuation losses aggregating Rs. 218 million, have been recognised in the profit and loss account.
11) Transfer of some of the titles to the assets vested with the company consequent to the Scheme of arrangement (de-merger) could not, where necessary, be transferred, as at 31st March 2009 pending adjudication of stamp duty. Hence the same were held in trust for the company by Bajaj Holdings and Investment Ltd.
Schedule 14 - Notes forming part of financial statements (Contd.)
100
Schedule 14 - Notes forming part of financial statements (Contd.)
12) Investments:
a. Fixed Income Securities transferred to and vested with the company, consequent to the demerger of erstwhile bajaj auto ltd. were as per the scheme of arrangement (de-merger) recognised at their fair market values, where the carrying cost on 1st April 2007 was higher. The resulting diminution (net of deferred tax aggregating Rs. 323.7 million) amounting to Rs. 903.6 million, as per the said scheme, was provided for by a debit to the General Reserve.
b. Investments made by the company other than those with a maturity of and those intended to be held for less than one year, being of long-term nature, diminution in the value of quoted Investments are not considered to be of a permanent nature. On an assessment of non-performing investments (quoted and unquoted) as per guidelines adopted by the company during the period ended 31st March 2009, the management has determined further provisions for possible diminution / losses aggregating Rs. 25.0 million during the year.
c. PT. Bajaj Auto Indonesia (PT. BAI), a subsidiary of the company, in which the company holds 97.5%, has registered accumulated losses which exceed its paid-up capital. The company thru PT. BAI made a foray into the Indonesian market, which is very competitive but promising. Considering the challenges in setting up an appropriate dealer and service network, creation of brand awareness, appropriate tie ups with finance agencies, understanding customer behavior and preferences, in addition to setting up an assembly plant, the gestation period is expected to be long but eventually profitable. Hence diminution in the value of the investments made in PT. BAI are not considered to be of a permanent nature and hence no provisions are required to be made in this regard, as per the policy followed by the company, at this point of time.
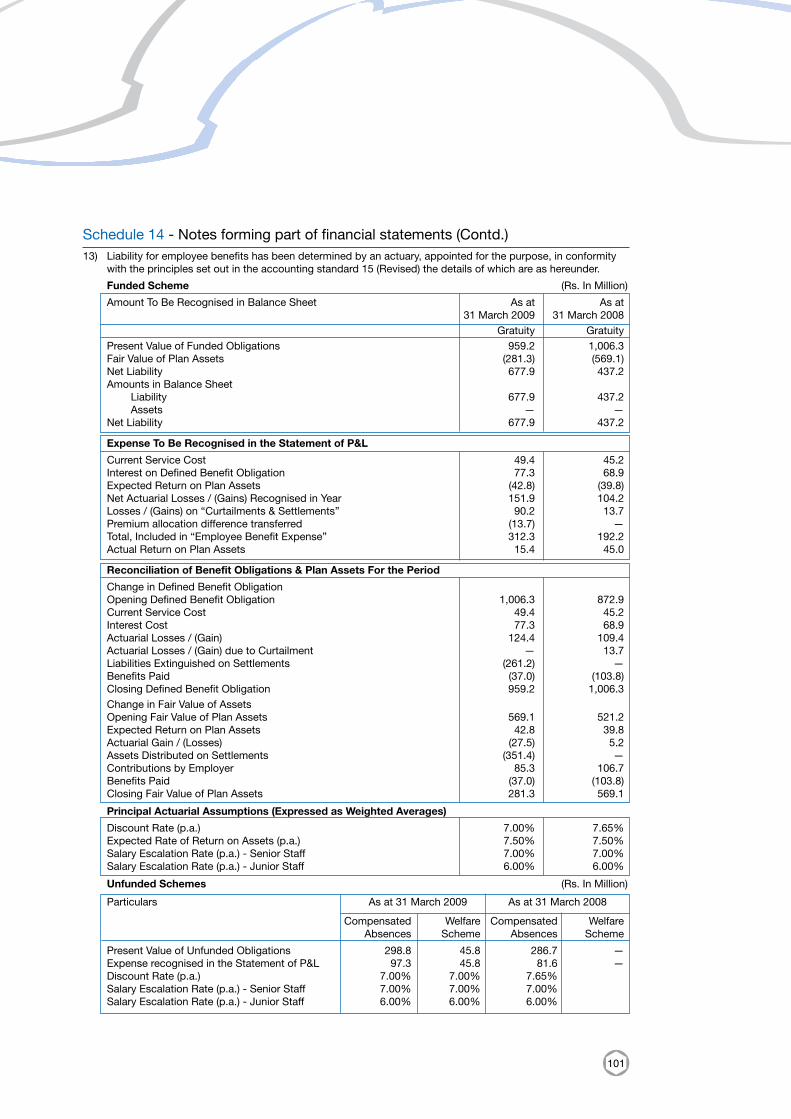
101
Schedule 14 - Notes forming part of financial statements (Contd.)13) Liability for employee benefits has been determined by an actuary, appointed for the purpose, in conformity
with the principles set out in the accounting standard 15 (Revised) the details of which are as hereunder.
Funded Scheme (Rs. In Million)
Amount To Be Recognised in Balance Sheet As at As at 31 March 2009 31 March 2008 Gratuity Gratuity Present Value of Funded Obligations 959.2 1,006.3 Fair Value of Plan Assets (281.3) (569.1) Net Liability 677.9 437.2 Amounts in Balance Sheet Liability 677.9 437.2 Assets — — Net Liability 677.9 437.2
Expense To Be Recognised in the Statement of P&L
Current Service Cost 49.4 45.2 Interest on Defined Benefit Obligation 77.3 68.9 Expected Return on Plan Assets (42.8) (39.8) Net Actuarial Losses / (Gains) Recognised in Year 151.9 104.2 Losses / (Gains) on “Curtailments & Settlements” 90.2 13.7 Premium allocation difference transferred (13.7) — Total, Included in “Employee Benefit Expense” 312.3 192.2 Actual Return on Plan Assets 15.4 45.0
Reconciliation of Benefit Obligations & Plan Assets For the Period
Change in Defined Benefit Obligation Opening Defined Benefit Obligation 1,006.3 872.9 Current Service Cost 49.4 45.2 Interest Cost 77.3 68.9 Actuarial Losses / (Gain) 124.4 109.4 Actuarial Losses / (Gain) due to Curtailment — 13.7 Liabilities Extinguished on Settlements (261.2) — Benefits Paid (37.0) (103.8) Closing Defined Benefit Obligation 959.2 1,006.3 Change in Fair Value of Assets Opening Fair Value of Plan Assets 569.1 521.2 Expected Return on Plan Assets 42.8 39.8 Actuarial Gain / (Losses) (27.5) 5.2 Assets Distributed on Settlements (351.4) — Contributions by Employer 85.3 106.7 Benefits Paid (37.0) (103.8) Closing Fair Value of Plan Assets 281.3 569.1
Principal Actuarial Assumptions (Expressed as Weighted Averages)
Discount Rate (p.a.) 7.00% 7.65% Expected Rate of Return on Assets (p.a.) 7.50% 7.50% Salary Escalation Rate (p.a.) - Senior Staff 7.00% 7.00% Salary Escalation Rate (p.a.) - Junior Staff 6.00% 6.00%
Unfunded Schemes (Rs. In Million)
Particulars As at 31 March 2009 As at 31 March 2008
Compensated Welfare Compensated Welfare Absences Scheme Absences Scheme
Present Value of Unfunded Obligations 298.8 45.8 286.7 — Expense recognised in the Statement of P&L 97.3 45.8 81.6 — Discount Rate (p.a.) 7.00% 7.00% 7.65% Salary Escalation Rate (p.a.) - Senior Staff 7.00% 7.00% 7.00% Salary Escalation Rate (p.a.) - Junior Staff 6.00% 6.00% 6.00%
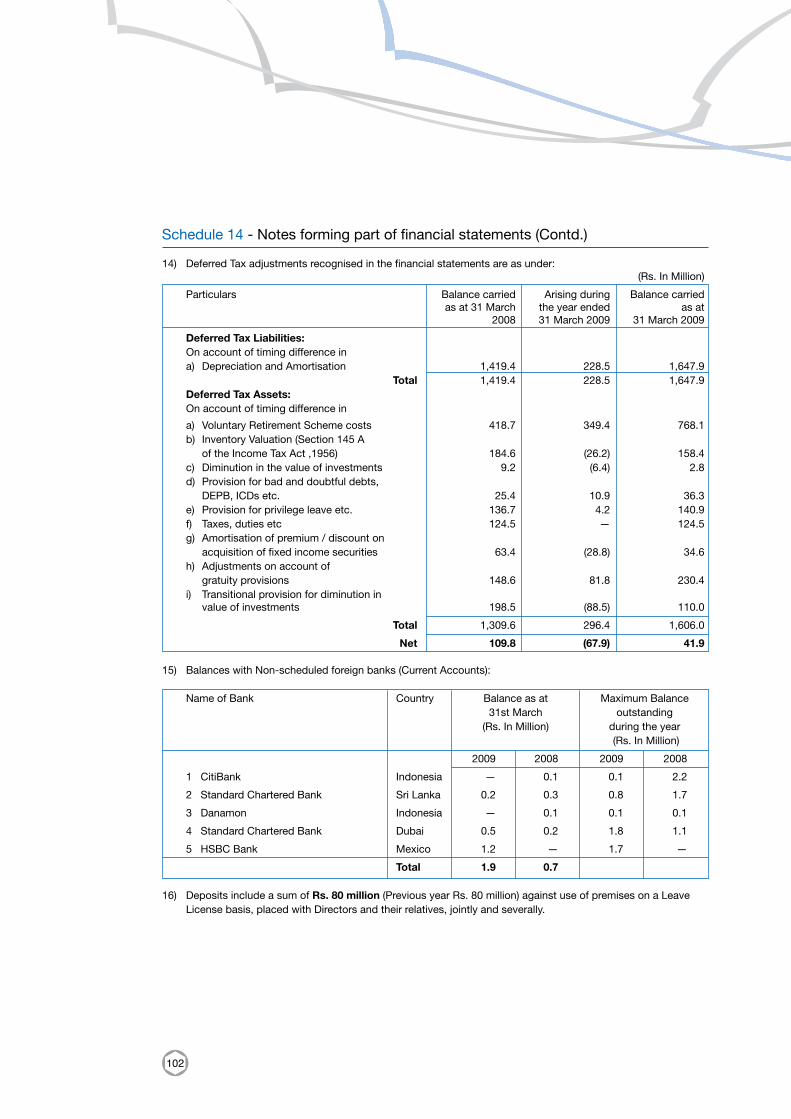
102
14) Deferred Tax adjustments recognised in the financial statements are as under: (Rs. In Million)
Particulars Balance carried Arising during Balance carried as at 31 March the year ended as at 2008 31 March 2009 31 March 2009
Deferred Tax Liabilities: On account of timing difference in a) Depreciation and Amortisation 1,419.4 228.5 1,647.9 Total 1,419.4 228.5 1,647.9 Deferred Tax Assets: On account of timing difference in
a) Voluntary Retirement Scheme costs 418.7 349.4 768.1 b) Inventory Valuation (Section 145 A of the Income Tax Act ,1956) 184.6 (26.2) 158.4 c) Diminution in the value of investments 9.2 (6.4) 2.8 d) Provision for bad and doubtful debts, DEPB, ICDs etc. 25.4 10.9 36.3 e) Provision for privilege leave etc. 136.7 4.2 140.9 f) Taxes, duties etc 124.5 — 124.5 g) Amortisation of premium / discount on acquisition of fixed income securities 63.4 (28.8) 34.6 h) Adjustments on account of gratuity provisions 148.6 81.8 230.4 i) Transitional provision for diminution in value of investments 198.5 (88.5) 110.0
Total 1,309.6 296.4 1,606.0
Net 109.8 (67.9) 41.9 15) Balances with Non-scheduled foreign banks (Current Accounts):
Name of Bank Country Balance as at Maximum Balance 31st March outstanding (Rs. In Million) during the year (Rs. In Million)
2009 2008 2009 2008
1 CitiBank Indonesia — 0.1 0.1 2.2
2 Standard Chartered Bank Sri Lanka 0.2 0.3 0.8 1.7
3 Danamon Indonesia — 0.1 0.1 0.1
4 Standard Chartered Bank Dubai 0.5 0.2 1.8 1.1
5 HSBC Bank Mexico 1.2 — 1.7 —
Total 1.9 0.7
16) Deposits include a sum of Rs. 80 million (Previous year Rs. 80 million) against use of premises on a Leave License basis, placed with Directors and their relatives, jointly and severally.
Schedule 14 - Notes forming part of financial statements (Contd.)

103
17) Future minimum lease rental in respect of assets (i) given on operating lease in the form of office premises after April 1, 2001 Minimum future lease
payments as on March 31, 2009:
(a) Receivable within one year - Rs. 0.1 million (Rs. 2.3 million)
(b) Receivable between one year and five years - Rs. Nil (Rs. 6.8 million)
(c) Receivable after five years - Rs. Nil (Rs. Nil)
(ii) taken on operating lease in the form of office premises after April 1, 2001 Minimum future lease payments as on March 31, 2009:
(a) Payable within one year- Rs. 58.6 million (Rs. 30.1 million)
(b) Payable between one year and five years- Rs. 123.3 million (Rs. 48.5 million)
(c) Payable after five years - Rs. 189.4 million (Rs. 113.9 million)
18) Disclosure of transactions with Related Parties, as required by Accounting Standard 18 ‘Related Party Disclosures’ has been set out in a separate statement annexed to this Schedule. Related parties as defined under clause 3 of the Accounting Standard have been identified based on representations made by key managerial personnel and information available with the company.
19) Segment Information based on the Consolidated Financial Statements attached to the Independent Financial Statements has been disclosed in the Statement annexed to this Schedule.
20) Considering the company has been extended credit period of 45 days by its vendors and payments being released on a timely basis, there is no liability towards interest on delayed payments under “The Micro, Small and Medium Enterprises Development Act 2006” during the year. There is also no amount of outstanding interest in this regard, brought forward from previous years. The above information is on basis of intimation received, on requests made by the company, with regards to vendors registration under the said Act.
21) Amounts less than Rs. 50,000 have been shown at actual against respective line items statutorily required to be disclosed.
22) Previous year figures have been regrouped, wherever necessary, to make them comparable with those of the current year.
Schedule 14 - Notes forming part of financial statements (Contd.)
Signature to Schedules “1” to “14”
As per our attached report of even date Rahul Bajaj Chairman
For and on behalf of Dalal and Shah Madhur Bajaj Vice ChairmanChartered Accountants Rajiv Bajaj Managing Director Sanjiv Bajaj Executive Director
D.S. Mehta Suman KirloskarAnish Amin Kantikumar R. Podar Naresh ChandraPartner Shekhar Bajaj Nanoo Pamnani Membership No. 40451 J. Sridhar D. J. Balaji Rao Manish Kejriwal Directors
Company Secretary S.H. Khan Niraj BajajMumbai: 21 May 2009
}
104
Annexure referred to in Note 9 in Schedule 14 to the Financial Statements for the year ended 31 March 2009
Statement of Significant Accounting Policies
1) System of Accounting
i) The company follows the mercantile system of accounting and recognises income and expenditure on an accrual basis except in case of significant uncertainties.
ii) Financial Statements are prepared under the Historical cost convention. These costs are not adjusted to reflect the impact of changing value in the purchasing power of money.
iii) Estimates and Assumptions used in the preparation of the financial statements are based upon management’s evaluation of the relevant facts and circumstances as of the date of the Financial Statements, which may differ from the actual results at a subsequent date.
2) Revenue recognition:
a) Sales:
i) Domestic Sales are accounted for on despatch from the point of sale.
ii) Export sales are recognised on the date of the Mate’s Receipt and initially recorded at the relevant exchange rates prevailing on the date of the transaction.
b) Income:
The company recognises income on accrual basis. However where the ultimate collection of the same lacks reasonable certainty, revenue recognition is postponed to the extent of uncertainty.
(1) Interest income is accrued over the period of the loan / investment and net of amortisation of premium / discount with respect to fixed income securities, thereby recognising the implicit yield to maturity.
(2) Dividend is accrued in the year in which it is declared whereby a right to receive is established.
(3) Profit / loss on sale of investments is recognised on the contract date.
(4) Benefit on account of entitlement to import goods free of duty under the “Duty Entitlement Pass Book Scheme” is accounted in the year of export if the same can be measured with reasonable accuracy.
3) Fixed Assets and Depreciation
(A) Fixed Assets
Fixed Assets except freehold land are carried at cost of acquisition, construction or at manufacturing cost, as the case may be, including pre-operative expenses in the case of self manufactured assets /plants / undertakings, less accumulated depreciation and amortisation.
(B) Depreciation and Amortisation:
(a) Leasehold land:
Premium on leasehold land is amortised over the period of lease.
(b) On Plant & Machinery given on Lease:
Depreciation on Plant & Machinery and Dies and Moulds given on lease is being provided at the rates worked out on Straight Line Method over the primary period of lease as stated in the Lease Agreement or at the rates specified in Schedule XIV to the Companies Act, 1956 whichever is higher, on pro-rata basis with reference to the month of commencement of lease period. These dies have been fully written off.
105
(c) On Pressure Die Casting (PDC) Dies:
Depreciation on certain PDC Dies is provided over the estimated economic life of the dies or at the rates specified in Schedule XIV to the Companies Act, 1956, whichever is higher, proportionate from the month they are put to use.
(d) On other Fixed Assets
Depreciation on all assets is provided on ‘ Straight Line basis ‘ in accordance with the provisions of Section 205 (2) (b) of the Companies Act 1956, in the manner and at the rates specified in Schedule XIV to the said Act.
i. Depreciation on additions is being provided on prorata basis from the month of such additions.
ii. Depreciation on assets sold, discarded or demolished during the year is being provided at their rates upto the month in which such assets are sold, discarded or demolished.
4) Intangible Assets
a) Technical know-how acquired
Expenditure on technical know-how acquired (including Income-tax and R& D cess) is being amortised equally over a period of six years.
b) Technical know-how developed by the company
i) Expenditure incurred on know-how developed by the company, post research stage, is recognised as an intangible asset, if and only if the future economic benefits attributable are probable to flow to the company and the costs can be measured reliably.
ii) The cost of Technical Know-how developed is amortised equally over its estimated life i.e. generally three years.
5) Investments
a) Investments transferred to and vested with the company consequent to the demerger of erstwhile Bajaj Auto Ltd. discussed in note 1 in Schedule 14 above, are carried at their fair market values with reference to the yield prevailing in the market for similar types of securities as at 1st April 2007 where the carrying cost of such investments were higher than the so arrived fair market value, less amortisation of premium / discount thereafter, as the case may be. The provision for such diminution had been debited to the General Reserve as per the said scheme.
b) Fixed income securities are carried at cost, less amortisation of premium / discount, as the case may be, and provision for diminution, if any, as considered necessary.
c) Investments other than fixed income securities are valued at cost of acquisition, less provision for diminution as necessary.
d) Investments made by the company are, generally, of a long-term nature, hence diminutions in value of quoted and unquoted Investments are not considered to be of a permanent nature. However, current investments, representing fixed income securities with a maturity less than 1 year and investment not intended to be held for a period more than 1 year, are stated at lower of cost or fair value.
e) The management has laid out guidelines for the purpose of assessing likely impairments in investments and for making provisions based on given criteria. Appropriate provisions are accordingly made, which in the opinion of the management are considered adequate.
6) Inventories
Cost of inventories have been computed to include all costs of purchases, cost of conversion and other costs incurred in bringing the inventories to their present location and condition.
Annexure referred to in Note 9 in Schedule 14 to the Financial Statements for the year ended 31 March 2009 (Contd.)
106
a) Finished stocks, Auto spare parts and Work-in-progress are valued at cost or net realisable value whichever is lower. Finished stocks lying in the factory premises, Branches, Depots are valued inclusive of excise duty.
b) Stores and Tools are valued at cost arrived at on weighted average basis However, obsolete and slow moving items are valued at cost or estimated realisable value whichever is lower.
c) Raw materials and components are valued at cost arrived at on weighted average basis or lower of cost and net realisable value, as circumstances demand. However, obsolete and slow moving items are valued at cost or estimated realisable value whichever is lower.
d) Machinery spares and Maintenance materials are charged out as expense in the year of purchase. However, Machinery spares forming key components specific to a machinery and held as insurance spares are capitalised along with the cost of the Asset.
e) Goods in transit are stated at actual cost incurred upto the date of Balance Sheet.
7) Foreign Currency Transactions
a) Current Assets and Liabilities in foreign currency outstanding at the close of financial year are revalorised at the appropriate exchange rates prevailing at the close of the year.
b) The gain or loss on decrease / increase in reporting currency due to fluctuations in foreign exchange rates, in case of current assets and liabilities in foreign currency, are recognised in the profit and loss account in the manner detailed in note 5 (d) in Schedule 14 to the accounts.
c) Fixed Assets purchased at Overseas Branches in foreign exchange are recorded at their historical cost computed with reference to the average rate of foreign exchange remitted to the Branch.
d) Foreign Exchange Contracts / Derivatives (as Hedging instruments):
i) Premium / Discounts are recognised over the life of the contract.
ii) Profits and losses arising from either cancellation or utilisation of contracts and on revalorising contracts to cover foreign exchange receivables and liabilities at the close of the year are recognised in the profit and loss account as detailed in note 5 (d) in Schedule 14 to the accounts.
iii) Losses & gains of outstanding foreign exchange contracts / derivatives to hedge highly probable forecast transactions are from this year, if determined effective, as per the principles of hedge accounting, recognised in the “Hedge Reserve” and to ultimately flow into the profit and loss account when the underlying transactions occur. Losses and gains on ineffective hedging instruments are recognised in the profit and loss account. Refer note 10(b) Schedule 14 to the accounts.
8) Research & Development Expenditure
Research & Development Expenditure is charged to revenue under the natural heads of account in the year in which it is incurred. Payments for R&D work by contracted agency are being expensed out upto the stage of completion. However, expenditure incurred at development phase, where it is reasonably certain that outcome of research will be commercially exploited to yield economic benefits to the company, is considered as an Intangible asset and accounted in the manner specified in clause 4 b) above.
9) Employee Benefits
a) Privilege Leave entitlements
Privilege leave entitlements are recognised as a liability, in the calendar year of rendering of service, as per the rules of the company. As accumulated leave can be availed and / or encashed at any time during the tenure of employment the liability is recognised at the actuarially determined value by an Appointed Actuary.
Annexure referred to in Note 9 in Schedule 14 to the Financial Statements for the year ended 31 March 2009 (Contd.)
107
b) Gratuity
Payment for present liability of future payment of gratuity is being made to approved Gratuity Fund, which fully covers the same under Cash Accumulation Policy of the Life Insurance Corporation of India. However, any deficit in Plan Assets managed by LIC as compared to the actuarial liability, determined by an appointed actuary, is recognised as a liability immediately.
c) Superannuation
Defined Contribution to Superannuation fund is being made as per the Scheme of the company.
d) Provident Fund Contributions are made to company’s Provident Fund Trust. Deficits, if any, of the fund as compared to aggregate liability is additionally contributed by the company and recognised as an expense.
e) Defined Contribution to Employees Pension Scheme 1995 is made to Government Provident Fund Authority.
10) Taxation
a) Provision for Taxation is made for the current accounting period (reporting period) on the basis of the taxable profits computed in accordance with the Income Tax Act, 1961.
b) Deferred Tax resulting from timing difference between book profits and taxable profits are accounted for to the extent deferred tax assets and liabilities are expected to crystalise with reasonable certainty. However, in case of deferred tax assets, representing unabsorbed depreciation or carried forward losses, are recognised, if and only if there is virtual certainty that there would be adequate future taxable income against which such deferred tax assets can be realised. Deferred tax is recognised on adjustments to revenue reserves to the extent the adjustments are allowable as deductions in determination of taxable income and they would reverse out in future periods.
11) Provisions
Necessary provisions are made for present obligations that arise out of events prior to the balance sheet date entailing future outflow of economic resources. Such provisions reflect best estimates based on available information.
Annexure referred to in Note 9 in Schedule 14 to the Financial Statements for the year ended 31 March 2009 (Contd.)
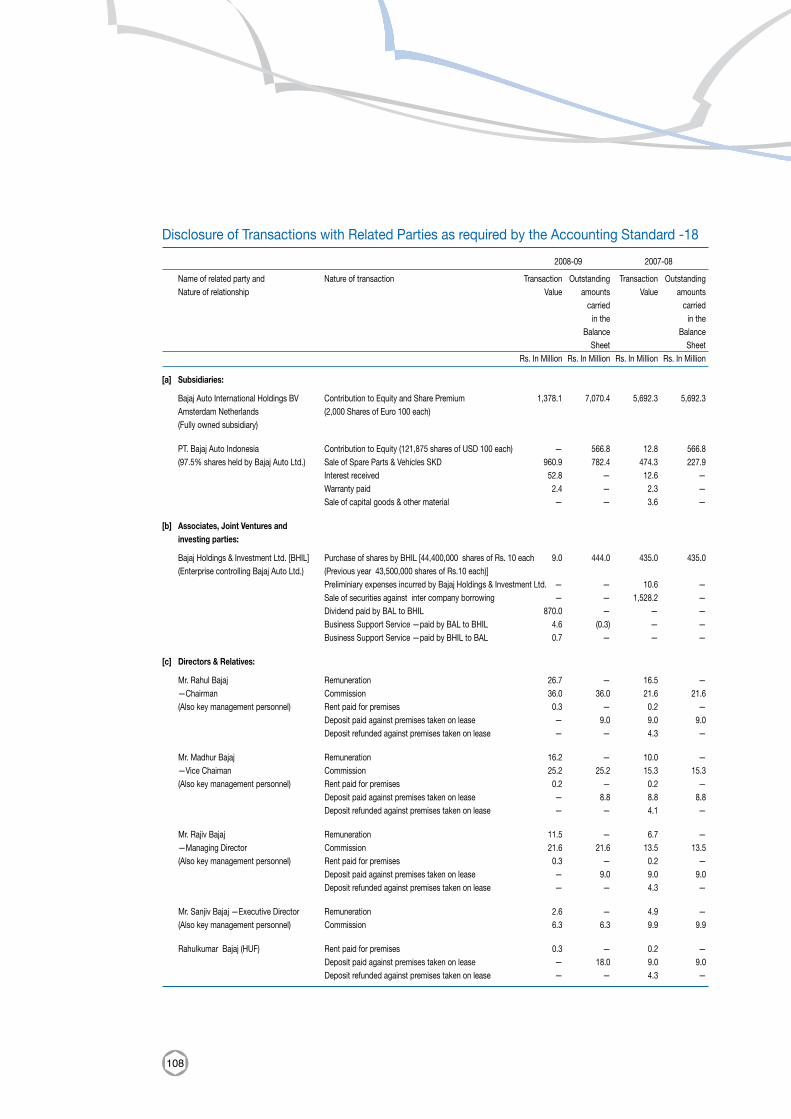
108
[a] Subsidiaries:
Bajaj Auto International Holdings BV Contribution to Equity and Share Premium 1,378.1 7,070.4 5,692.3 5,692.3 Amsterdam Netherlands (2,000 Shares of Euro 100 each) (Fully owned subsidiary) PT. Bajaj Auto Indonesia Contribution to Equity (121,875 shares of USD 100 each) — 566.8 12.8 566.8 (97.5% shares held by Bajaj Auto Ltd.) Sale of Spare Parts & Vehicles SKD 960.9 782.4 474.3 227.9 Interest received 52.8 — 12.6 — Warranty paid 2.4 — 2.3 — Sale of capital goods & other material — — 3.6 — [b] Associates, Joint Ventures and investing parties:
Bajaj Holdings & Investment Ltd. [BHIL] Purchase of shares by BHIL [44,400,000 shares of Rs. 10 each 9.0 444.0 435.0 435.0 (Enterprise controlling Bajaj Auto Ltd.) (Previous year 43,500,000 shares of Rs.10 each)] Preliminiary expenses incurred by Bajaj Holdings & Investment Ltd. — — 10.6 — Sale of securities against inter company borrowing — — 1,528.2 — Dividend paid by BAL to BHIL 870.0 — — — Business Support Service —paid by BAL to BHIL 4.6 (0.3) — — Business Support Service —paid by BHIL to BAL 0.7 — — — [c] Directors & Relatives: Mr. Rahul Bajaj Remuneration 26.7 — 16.5 — —Chairman Commission 36.0 36.0 21.6 21.6 (Also key management personnel) Rent paid for premises 0.3 — 0.2 — Deposit paid against premises taken on lease — 9.0 9.0 9.0 Deposit refunded against premises taken on lease — — 4.3 — Mr. Madhur Bajaj Remuneration 16.2 — 10.0 — —Vice Chaiman Commission 25.2 25.2 15.3 15.3 (Also key management personnel) Rent paid for premises 0.2 — 0.2 — Deposit paid against premises taken on lease — 8.8 8.8 8.8 Deposit refunded against premises taken on lease — — 4.1 — Mr. Rajiv Bajaj Remuneration 11.5 — 6.7 — —Managing Director Commission 21.6 21.6 13.5 13.5 (Also key management personnel) Rent paid for premises 0.3 — 0.2 — Deposit paid against premises taken on lease — 9.0 9.0 9.0 Deposit refunded against premises taken on lease — — 4.3 — Mr. Sanjiv Bajaj —Executive Director Remuneration 2.6 — 4.9 — (Also key management personnel) Commission 6.3 6.3 9.9 9.9 Rahulkumar Bajaj (HUF) Rent paid for premises 0.3 — 0.2 — Deposit paid against premises taken on lease — 18.0 9.0 9.0 Deposit refunded against premises taken on lease — — 4.3 —
Disclosure of Transactions with Related Parties as required by the Accounting Standard -18
2008-09 2007-08
Name of related party and Nature of transaction Transaction Outstanding Transaction Outstanding Nature of relationship Value amounts Value amounts carried carried in the in the Balance Balance Sheet Sheet Rs. In Million Rs. In Million Rs. In Million Rs. In Million
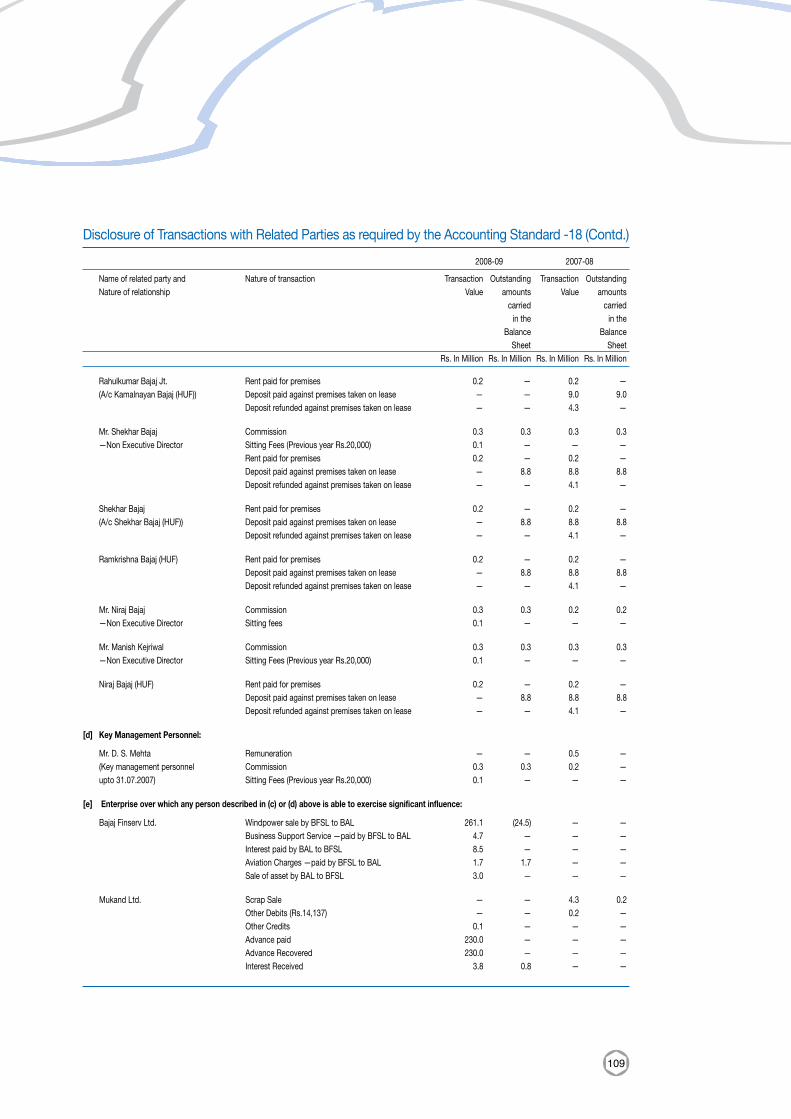
109
Disclosure of Transactions with Related Parties as required by the Accounting Standard -18 (Contd.)
2008-09 2007-08
Name of related party and Nature of transaction Transaction Outstanding Transaction Outstanding Nature of relationship Value amounts Value amounts carried carried in the in the Balance Balance Sheet Sheet Rs. In Million Rs. In Million Rs. In Million Rs. In Million
Rahulkumar Bajaj Jt. Rent paid for premises 0.2 — 0.2 — (A/c Kamalnayan Bajaj (HUF)) Deposit paid against premises taken on lease — — 9.0 9.0 Deposit refunded against premises taken on lease — — 4.3 — Mr. Shekhar Bajaj Commission 0.3 0.3 0.3 0.3 —Non Executive Director Sitting Fees (Previous year Rs.20,000) 0.1 — — — Rent paid for premises 0.2 — 0.2 — Deposit paid against premises taken on lease — 8.8 8.8 8.8 Deposit refunded against premises taken on lease — — 4.1 — Shekhar Bajaj Rent paid for premises 0.2 — 0.2 — (A/c Shekhar Bajaj (HUF)) Deposit paid against premises taken on lease — 8.8 8.8 8.8 Deposit refunded against premises taken on lease — — 4.1 — Ramkrishna Bajaj (HUF) Rent paid for premises 0.2 — 0.2 — Deposit paid against premises taken on lease — 8.8 8.8 8.8 Deposit refunded against premises taken on lease — — 4.1 — Mr. Niraj Bajaj Commission 0.3 0.3 0.2 0.2 —Non Executive Director Sitting fees 0.1 — — — Mr. Manish Kejriwal Commission 0.3 0.3 0.3 0.3 —Non Executive Director Sitting Fees (Previous year Rs.20,000) 0.1 — — — Niraj Bajaj (HUF) Rent paid for premises 0.2 — 0.2 — Deposit paid against premises taken on lease — 8.8 8.8 8.8 Deposit refunded against premises taken on lease — — 4.1 — [d] Key Management Personnel: Mr. D. S. Mehta Remuneration — — 0.5 — (Key management personnel Commission 0.3 0.3 0.2 — upto 31.07.2007) Sitting Fees (Previous year Rs.20,000) 0.1 — — — [e] Enterprise over which any person described in (c) or (d) above is able to exercise significant influence: Bajaj Finserv Ltd. Windpower sale by BFSL to BAL 261.1 (24.5) — — Business Support Service —paid by BFSL to BAL 4.7 — — — Interest paid by BAL to BFSL 8.5 — — — Aviation Charges —paid by BFSL to BAL 1.7 1.7 — — Sale of asset by BAL to BFSL 3.0 — — — Mukand Ltd. Scrap Sale — — 4.3 0.2 Other Debits (Rs.14,137) — — 0.2 — Other Credits 0.1 — — — Advance paid 230.0 — — — Advance Recovered 230.0 — — — Interest Received 3.8 0.8 — —
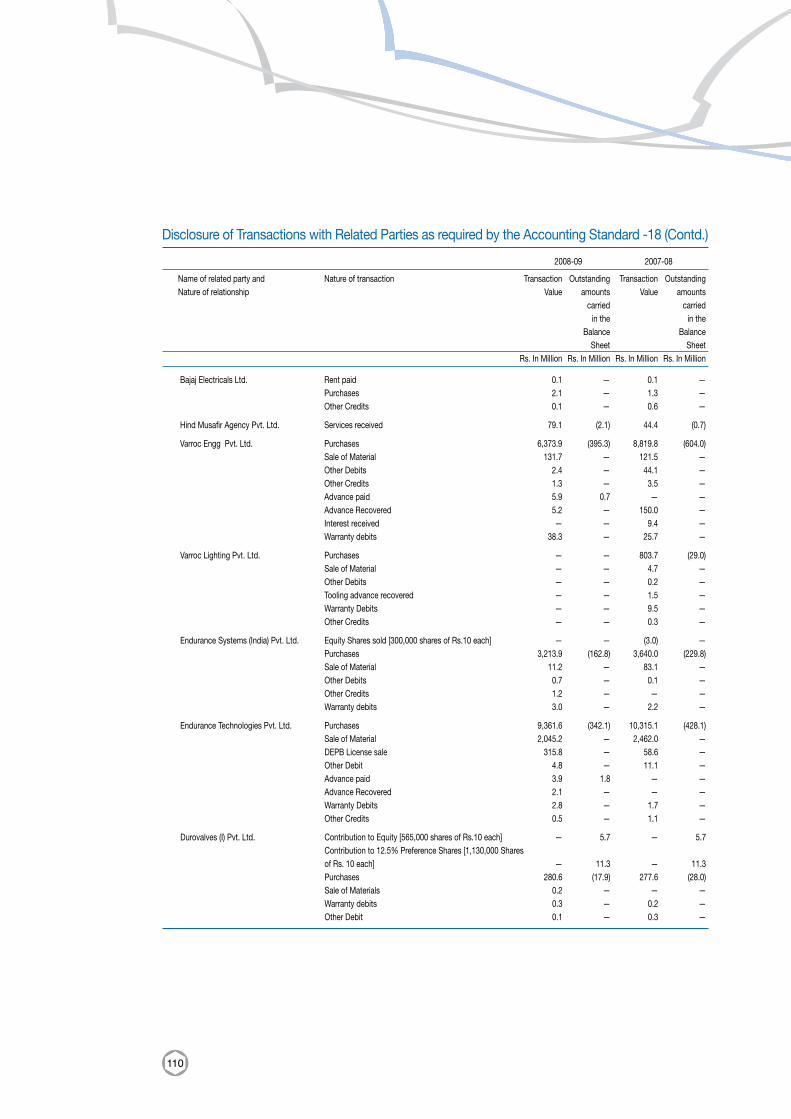
110
Bajaj Electricals Ltd. Rent paid 0.1 — 0.1 — Purchases 2.1 — 1.3 — Other Credits 0.1 — 0.6 — Hind Musafir Agency Pvt. Ltd. Services received 79.1 (2.1) 44.4 (0.7) Varroc Engg Pvt. Ltd. Purchases 6,373.9 (395.3) 8,819.8 (604.0) Sale of Material 131.7 — 121.5 — Other Debits 2.4 — 44.1 — Other Credits 1.3 — 3.5 — Advance paid 5.9 0.7 — — Advance Recovered 5.2 — 150.0 — Interest received — — 9.4 — Warranty debits 38.3 — 25.7 — Varroc Lighting Pvt. Ltd. Purchases — — 803.7 (29.0) Sale of Material — — 4.7 — Other Debits — — 0.2 — Tooling advance recovered — — 1.5 — Warranty Debits — — 9.5 — Other Credits — — 0.3 — Endurance Systems (India) Pvt. Ltd. Equity Shares sold [300,000 shares of Rs.10 each] — — (3.0) — Purchases 3,213.9 (162.8) 3,640.0 (229.8) Sale of Material 11.2 — 83.1 — Other Debits 0.7 — 0.1 — Other Credits 1.2 — — — Warranty debits 3.0 — 2.2 — Endurance Technologies Pvt. Ltd. Purchases 9,361.6 (342.1) 10,315.1 (428.1) Sale of Material 2,045.2 — 2,462.0 — DEPB License sale 315.8 — 58.6 — Other Debit 4.8 — 11.1 — Advance paid 3.9 1.8 — — Advance Recovered 2.1 — — — Warranty Debits 2.8 — 1.7 — Other Credits 0.5 — 1.1 — Durovalves (I) Pvt. Ltd. Contribution to Equity [565,000 shares of Rs.10 each] — 5.7 — 5.7 Contribution to 12.5% Preference Shares [1,130,000 Shares of Rs. 10 each] — 11.3 — 11.3 Purchases 280.6 (17.9) 277.6 (28.0) Sale of Materials 0.2 — — — Warranty debits 0.3 — 0.2 — Other Debit 0.1 — 0.3 —
Disclosure of Transactions with Related Parties as required by the Accounting Standard -18 (Contd.)
2008-09 2007-08
Name of related party and Nature of transaction Transaction Outstanding Transaction Outstanding Nature of relationship Value amounts Value amounts carried carried in the in the Balance Balance Sheet Sheet Rs. In Million Rs. In Million Rs. In Million Rs. In Million
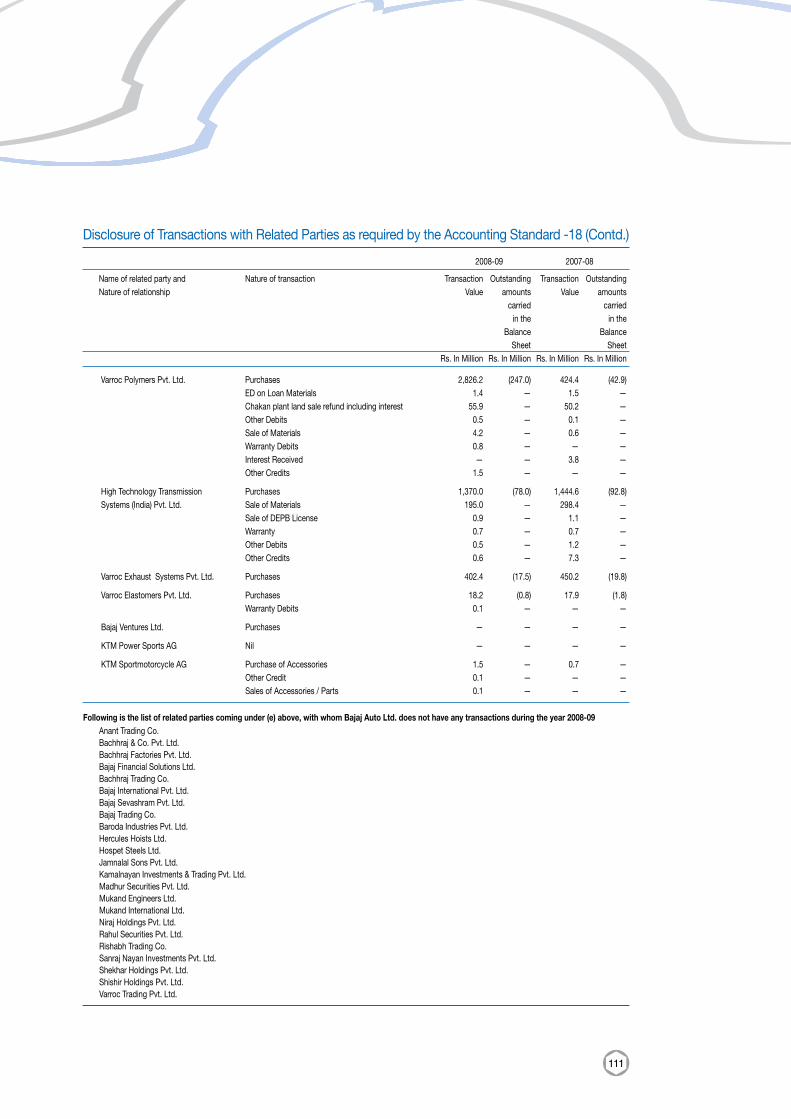
111
Varroc Polymers Pvt. Ltd. Purchases 2,826.2 (247.0) 424.4 (42.9) ED on Loan Materials 1.4 — 1.5 — Chakan plant land sale refund including interest 55.9 — 50.2 — Other Debits 0.5 — 0.1 — Sale of Materials 4.2 — 0.6 — Warranty Debits 0.8 — — — Interest Received — — 3.8 — Other Credits 1.5 — — — High Technology Transmission Purchases 1,370.0 (78.0) 1,444.6 (92.8) Systems (India) Pvt. Ltd. Sale of Materials 195.0 — 298.4 — Sale of DEPB License 0.9 — 1.1 — Warranty 0.7 — 0.7 — Other Debits 0.5 — 1.2 — Other Credits 0.6 — 7.3 — Varroc Exhaust Systems Pvt. Ltd. Purchases 402.4 (17.5) 450.2 (19.8) Varroc Elastomers Pvt. Ltd. Purchases 18.2 (0.8) 17.9 (1.8) Warranty Debits 0.1 — — — Bajaj Ventures Ltd. Purchases — — — — KTM Power Sports AG Nil — — — — KTM Sportmotorcycle AG Purchase of Accessories 1.5 — 0.7 — Other Credit 0.1 — — — Sales of Accessories / Parts 0.1 — — —
Following is the list of related parties coming under (e) above, with whom Bajaj Auto Ltd. does not have any transactions during the year 2008-09 Anant Trading Co. Bachhraj & Co. Pvt. Ltd. Bachhraj Factories Pvt. Ltd. Bajaj Financial Solutions Ltd. Bachhraj Trading Co. Bajaj International Pvt. Ltd. Bajaj Sevashram Pvt. Ltd. Bajaj Trading Co. Baroda Industries Pvt. Ltd. Hercules Hoists Ltd. Hospet Steels Ltd. Jamnalal Sons Pvt. Ltd. Kamalnayan Investments & Trading Pvt. Ltd. Madhur Securities Pvt. Ltd. Mukand Engineers Ltd. Mukand International Ltd. Niraj Holdings Pvt. Ltd. Rahul Securities Pvt. Ltd. Rishabh Trading Co. Sanraj Nayan Investments Pvt. Ltd. Shekhar Holdings Pvt. Ltd. Shishir Holdings Pvt. Ltd. Varroc Trading Pvt. Ltd.
Disclosure of Transactions with Related Parties as required by the Accounting Standard -18 (Contd.)
2008-09 2007-08
Name of related party and Nature of transaction Transaction Outstanding Transaction Outstanding Nature of relationship Value amounts Value amounts carried carried in the in the Balance Balance Sheet Sheet Rs. In Million Rs. In Million Rs. In Million Rs. In Million
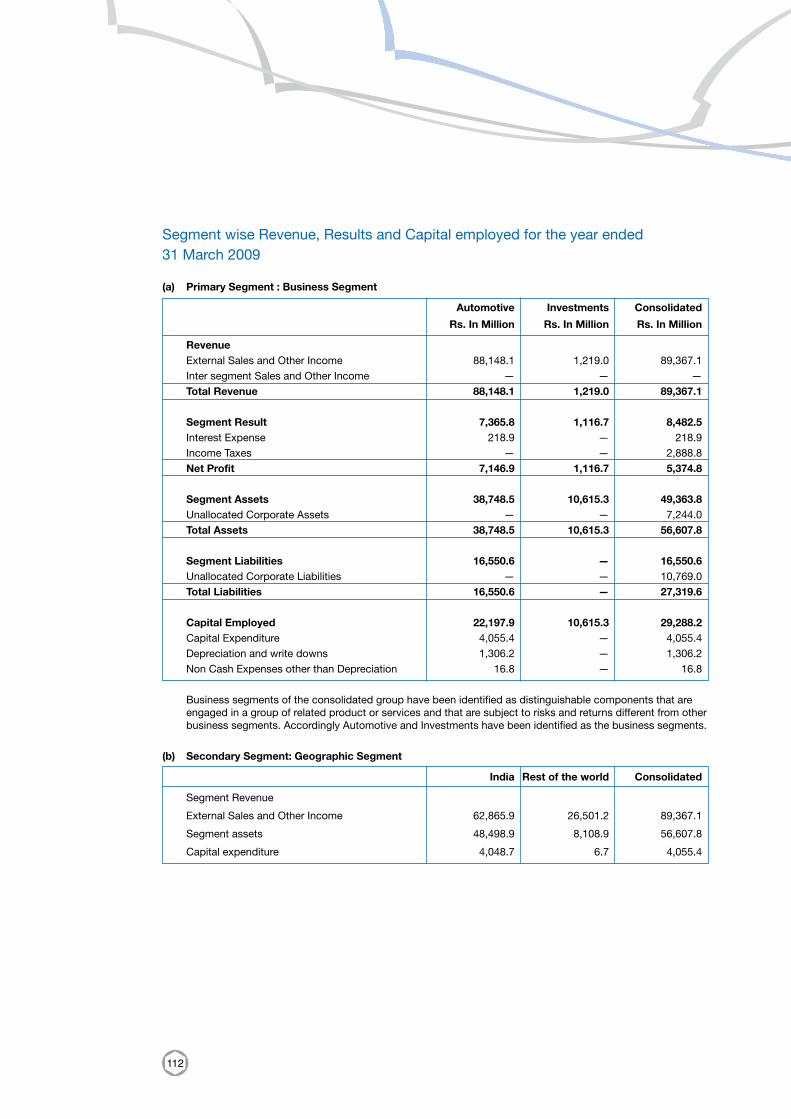
112
Segment wise Revenue, Results and Capital employed for the year ended 31 March 2009
(a) Primary Segment : Business Segment
Automotive Investments Consolidated
Rs. In Million Rs. In Million Rs. In Million
Revenue External Sales and Other Income 88,148.1 1,219.0 89,367.1 Inter segment Sales and Other Income — — — Total Revenue 88,148.1 1,219.0 89,367.1
Segment Result 7,365.8 1,116.7 8,482.5 Interest Expense 218.9 — 218.9 Income Taxes — — 2,888.8 Net Profit 7,146.9 1,116.7 5,374.8
Segment Assets 38,748.5 10,615.3 49,363.8 Unallocated Corporate Assets — — 7,244.0 Total Assets 38,748.5 10,615.3 56,607.8
Segment Liabilities 16,550.6 — 16,550.6 Unallocated Corporate Liabilities — — 10,769.0 Total Liabilities 16,550.6 — 27,319.6
Capital Employed 22,197.9 10,615.3 29,288.2 Capital Expenditure 4,055.4 — 4,055.4 Depreciation and write downs 1,306.2 — 1,306.2 Non Cash Expenses other than Depreciation 16.8 — 16.8
Business segments of the consolidated group have been identified as distinguishable components that are engaged in a group of related product or services and that are subject to risks and returns different from other business segments. Accordingly Automotive and Investments have been identified as the business segments.
(b) Secondary Segment: Geographic Segment
India Rest of the world Consolidated
Segment Revenue
External Sales and Other Income 62,865.9 26,501.2 89,367.1
Segment assets 48,498.9 8,108.9 56,607.8
Capital expenditure 4,048.7 6.7 4,055.4
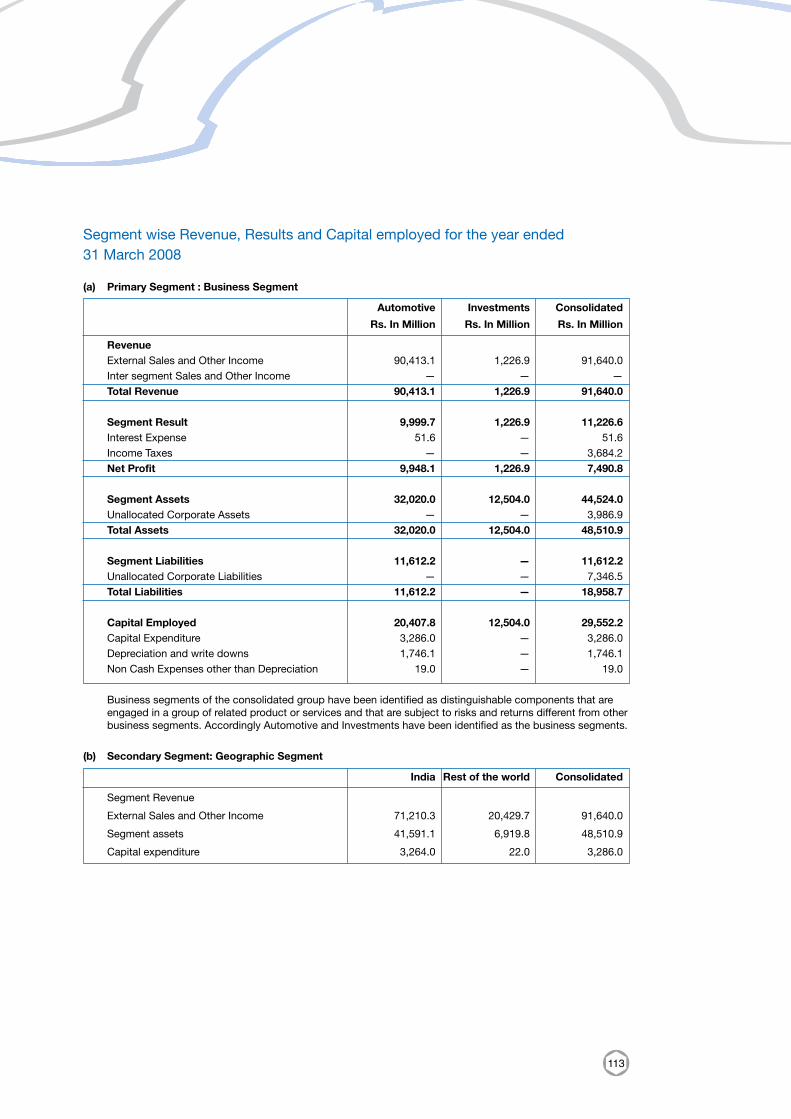
113
Segment wise Revenue, Results and Capital employed for the year ended 31 March 2008
(a) Primary Segment : Business Segment
Automotive Investments Consolidated
Rs. In Million Rs. In Million Rs. In Million
Revenue External Sales and Other Income 90,413.1 1,226.9 91,640.0 Inter segment Sales and Other Income — — — Total Revenue 90,413.1 1,226.9 91,640.0
Segment Result 9,999.7 1,226.9 11,226.6 Interest Expense 51.6 — 51.6 Income Taxes — — 3,684.2 Net Profit 9,948.1 1,226.9 7,490.8
Segment Assets 32,020.0 12,504.0 44,524.0 Unallocated Corporate Assets — — 3,986.9 Total Assets 32,020.0 12,504.0 48,510.9
Segment Liabilities 11,612.2 — 11,612.2 Unallocated Corporate Liabilities — — 7,346.5 Total Liabilities 11,612.2 — 18,958.7
Capital Employed 20,407.8 12,504.0 29,552.2 Capital Expenditure 3,286.0 — 3,286.0 Depreciation and write downs 1,746.1 — 1,746.1 Non Cash Expenses other than Depreciation 19.0 — 19.0 Business segments of the consolidated group have been identified as distinguishable components that are
engaged in a group of related product or services and that are subject to risks and returns different from other business segments. Accordingly Automotive and Investments have been identified as the business segments.
(b) Secondary Segment: Geographic Segment
India Rest of the world Consolidated
Segment Revenue
External Sales and Other Income 71,210.3 20,429.7 91,640.0
Segment assets 41,591.1 6,919.8 48,510.9
Capital expenditure 3,264.0 22.0 3,286.0
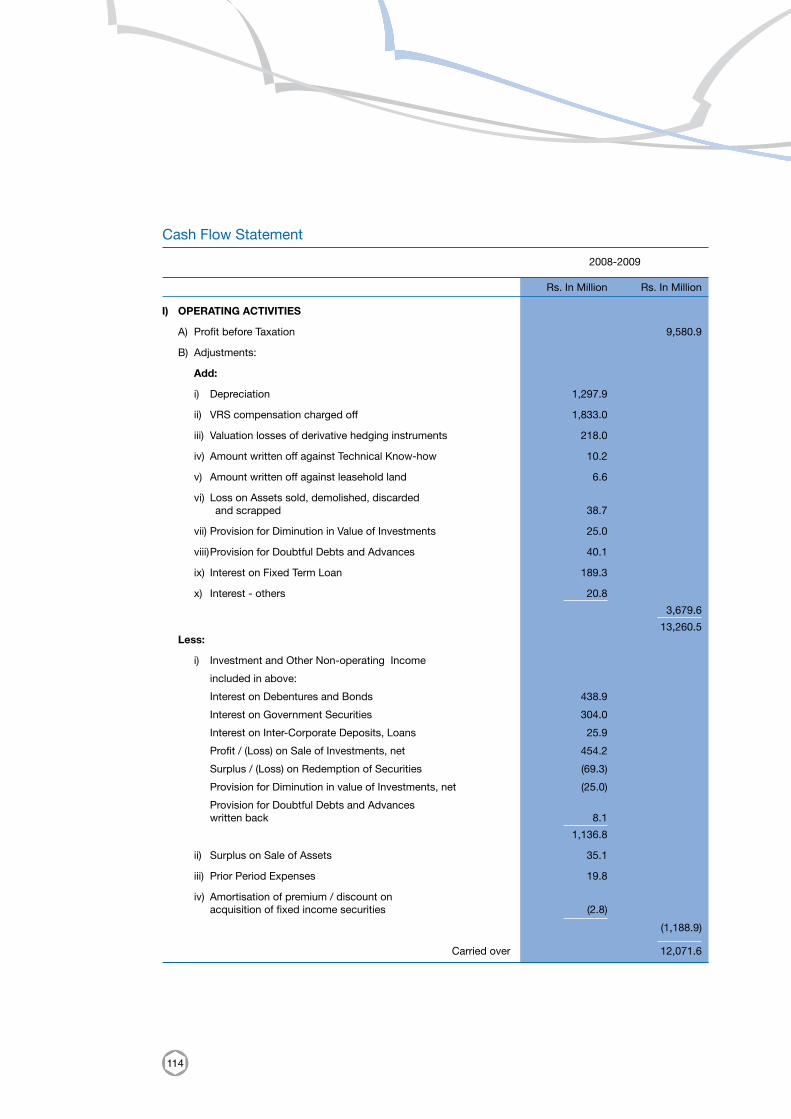
114
I) OPERATING ACTIVITIES
A) Profit before Taxation 9,580.9
B) Adjustments:
Add:
i) Depreciation 1,297.9
ii) VRS compensation charged off 1,833.0
iii) Valuation losses of derivative hedging instruments 218.0
iv) Amount written off against Technical Know-how 10.2
v) Amount written off against leasehold land 6.6
vi) Loss on Assets sold, demolished, discarded and scrapped 38.7
vii) Provision for Diminution in Value of Investments 25.0
viii) Provision for Doubtful Debts and Advances 40.1
ix) Interest on Fixed Term Loan 189.3
x) Interest - others 20.8 3,679.6 13,260.5 Less:
i) Investment and Other Non-operating Income
included in above:
Interest on Debentures and Bonds 438.9
Interest on Government Securities 304.0
Interest on Inter-Corporate Deposits, Loans 25.9
Profit / (Loss) on Sale of Investments, net 454.2
Surplus / (Loss) on Redemption of Securities (69.3)
Provision for Diminution in value of Investments, net (25.0)
Provision for Doubtful Debts and Advances written back 8.1 1,136.8
ii) Surplus on Sale of Assets 35.1
iii) Prior Period Expenses 19.8
iv) Amortisation of premium / discount on acquisition of fixed income securities (2.8) (1,188.9) Carried over 12,071.6
Cash Flow Statement
2008-2009
Rs. In Million Rs. In Million
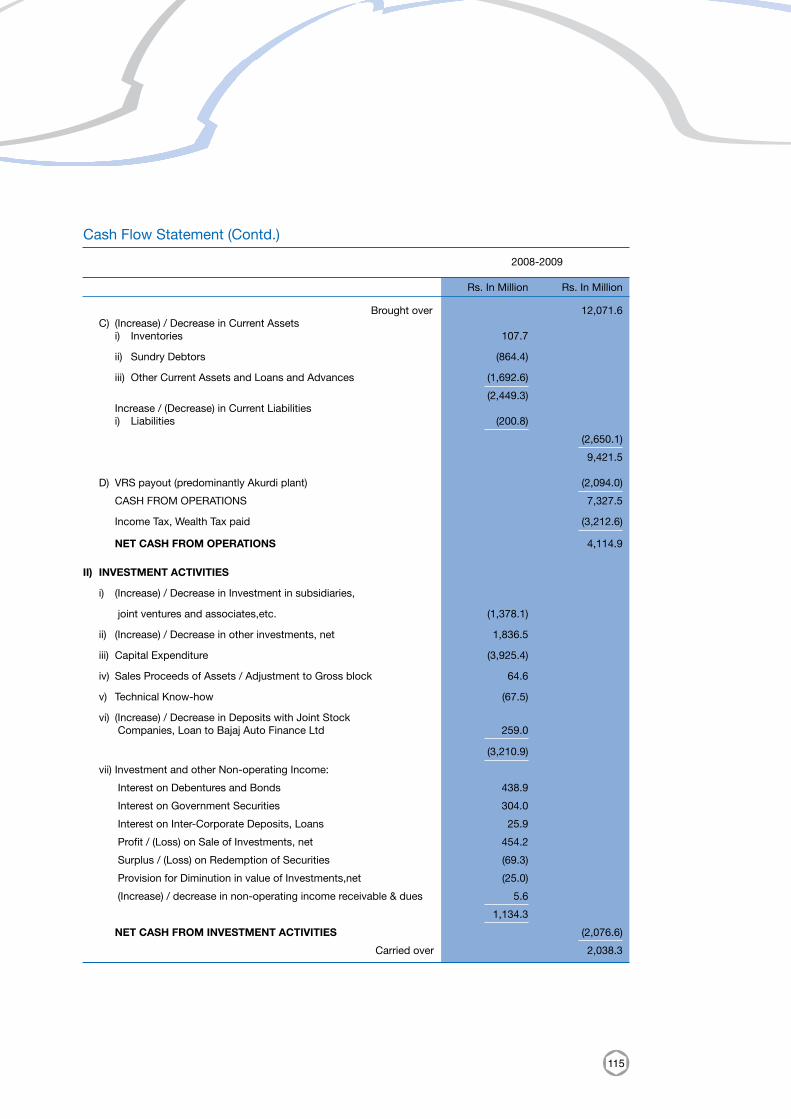
115
Brought over 12,071.6 C) (Increase) / Decrease in Current Assets i) Inventories 107.7
ii) Sundry Debtors (864.4)
iii) Other Current Assets and Loans and Advances (1,692.6) (2,449.3) Increase / (Decrease) in Current Liabilities i) Liabilities (200.8) (2,650.1) 9,421.5
D) VRS payout (predominantly Akurdi plant) (2,094.0) CASH FROM OPERATIONS 7,327.5
Income Tax, Wealth Tax paid (3,212.6)
NET CASH FROM OPERATIONS 4,114.9
II) INVESTMENT ACTIVITIES
i) (Increase) / Decrease in Investment in subsidiaries,
joint ventures and associates,etc. (1,378.1)
ii) (Increase) / Decrease in other investments, net 1,836.5
iii) Capital Expenditure (3,925.4)
iv) Sales Proceeds of Assets / Adjustment to Gross block 64.6
v) Technical Know-how (67.5)
vi) (Increase) / Decrease in Deposits with Joint Stock Companies, Loan to Bajaj Auto Finance Ltd 259.0
(3,210.9) vii) Investment and other Non-operating Income:
Interest on Debentures and Bonds 438.9
Interest on Government Securities 304.0
Interest on Inter-Corporate Deposits, Loans 25.9
Profit / (Loss) on Sale of Investments, net 454.2
Surplus / (Loss) on Redemption of Securities (69.3)
Provision for Diminution in value of Investments,net (25.0)
(Increase) / decrease in non-operating income receivable & dues 5.6 1,134.3 NET CASH FROM INVESTMENT ACTIVITIES (2,076.6) Carried over 2,038.3
Cash Flow Statement (Contd.)
2008-2009
Rs. In Million Rs. In Million
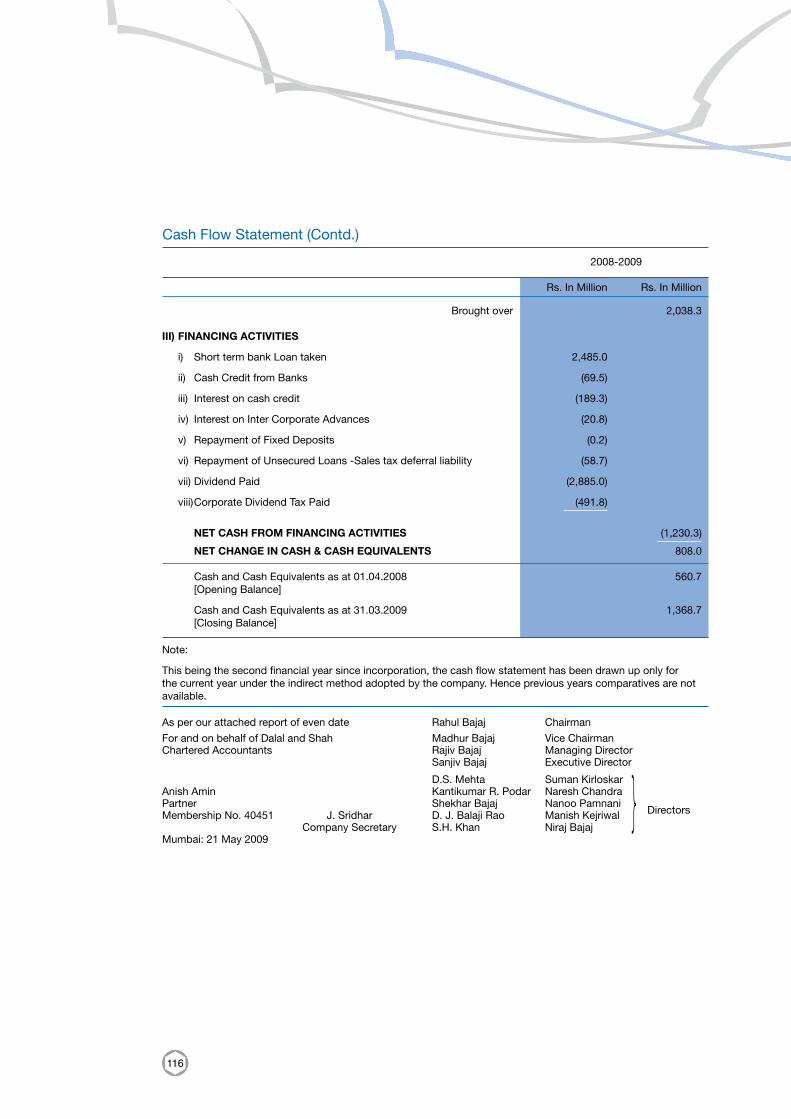
116
Brought over 2,038.3
III) FINANCING ACTIVITIES
i) Short term bank Loan taken 2,485.0
ii) Cash Credit from Banks (69.5)
iii) Interest on cash credit (189.3)
iv) Interest on Inter Corporate Advances (20.8)
v) Repayment of Fixed Deposits (0.2)
vi) Repayment of Unsecured Loans -Sales tax deferral liability (58.7)
vii) Dividend Paid (2,885.0)
viii) Corporate Dividend Tax Paid (491.8)
NET CASH FROM FINANCING ACTIVITIES (1,230.3) NET CHANGE IN CASH & CASH EQUIVALENTS 808.0
Cash and Cash Equivalents as at 01.04.2008 560.7 [Opening Balance]
Cash and Cash Equivalents as at 31.03.2009 1,368.7 [Closing Balance]
Note:
This being the second financial year since incorporation, the cash flow statement has been drawn up only for the current year under the indirect method adopted by the company. Hence previous years comparatives are not available.
Cash Flow Statement (Contd.)
2008-2009
Rs. In Million Rs. In Million
As per our attached report of even date Rahul Bajaj Chairman
For and on behalf of Dalal and Shah Madhur Bajaj Vice ChairmanChartered Accountants Rajiv Bajaj Managing Director Sanjiv Bajaj Executive Director
D.S. Mehta Suman KirloskarAnish Amin Kantikumar R. Podar Naresh ChandraPartner Shekhar Bajaj Nanoo Pamnani Membership No. 40451 J. Sridhar D. J. Balaji Rao Manish Kejriwal Directors
Company Secretary S.H. Khan Niraj BajajMumbai: 21 May 2009
}
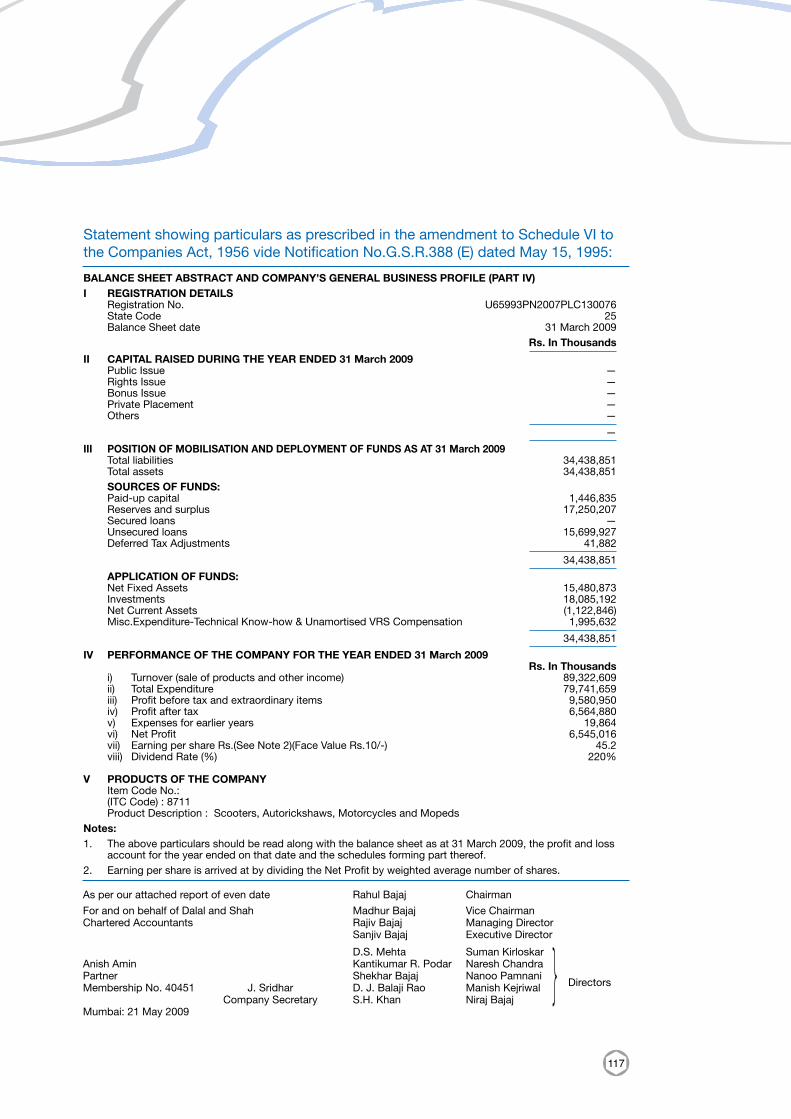
117
Statement showing particulars as prescribed in the amendment to Schedule VI to the Companies Act, 1956 vide Notification No.G.S.R.388 (E) dated May 15, 1995:
BALANCE SHEET ABSTRACT AND COMPANY’S GENERAL BUSINESS PROFILE (PART IV)I REGISTRATION DETAILS Registration No. U65993PN2007PLC130076 State Code 25 Balance Sheet date 31 March 2009 Rs. In Thousands II CAPITAL RAISED DURING THE YEAR ENDED 31 March 2009 Public Issue — Rights Issue — Bonus Issue — Private Placement — Others — — III POSITION OF MOBILISATION AND DEPLOYMENT OF FUNDS AS AT 31 March 2009 Total liabilities 34,438,851 Total assets 34,438,851 SOURCES OF FUNDS: Paid-up capital 1,446,835 Reserves and surplus 17,250,207 Secured loans — Unsecured loans 15,699,927 Deferred Tax Adjustments 41,882 34,438,851 APPLICATION OF FUNDS: Net Fixed Assets 15,480,873 Investments 18,085,192 Net Current Assets (1,122,846) Misc.Expenditure-Technical Know-how & Unamortised VRS Compensation 1,995,632 34,438,851 IV PERFORMANCE OF THE COMPANY FOR THE YEAR ENDED 31 March 2009 Rs. In Thousands i) Turnover (sale of products and other income) 89,322,609 ii) Total Expenditure 79,741,659 iii) Profit before tax and extraordinary items 9,580,950 iv) Profit after tax 6,564,880 v) Expenses for earlier years 19,864 vi) Net Profit 6,545,016 vii) Earning per share Rs.(See Note 2)(Face Value Rs.10/-) 45.2 viii) Dividend Rate (%) 220%
V PRODUCTS OF THE COMPANY Item Code No.: (ITC Code) : 8711 Product Description : Scooters, Autorickshaws, Motorcycles and MopedsNotes:1. The above particulars should be read along with the balance sheet as at 31 March 2009, the profit and loss
account for the year ended on that date and the schedules forming part thereof.2. Earning per share is arrived at by dividing the Net Profit by weighted average number of shares.
As per our attached report of even date Rahul Bajaj Chairman
For and on behalf of Dalal and Shah Madhur Bajaj Vice ChairmanChartered Accountants Rajiv Bajaj Managing Director Sanjiv Bajaj Executive Director
D.S. Mehta Suman KirloskarAnish Amin Kantikumar R. Podar Naresh ChandraPartner Shekhar Bajaj Nanoo Pamnani Membership No. 40451 J. Sridhar D. J. Balaji Rao Manish Kejriwal Directors
Company Secretary S.H. Khan Niraj BajajMumbai: 21 May 2009
}
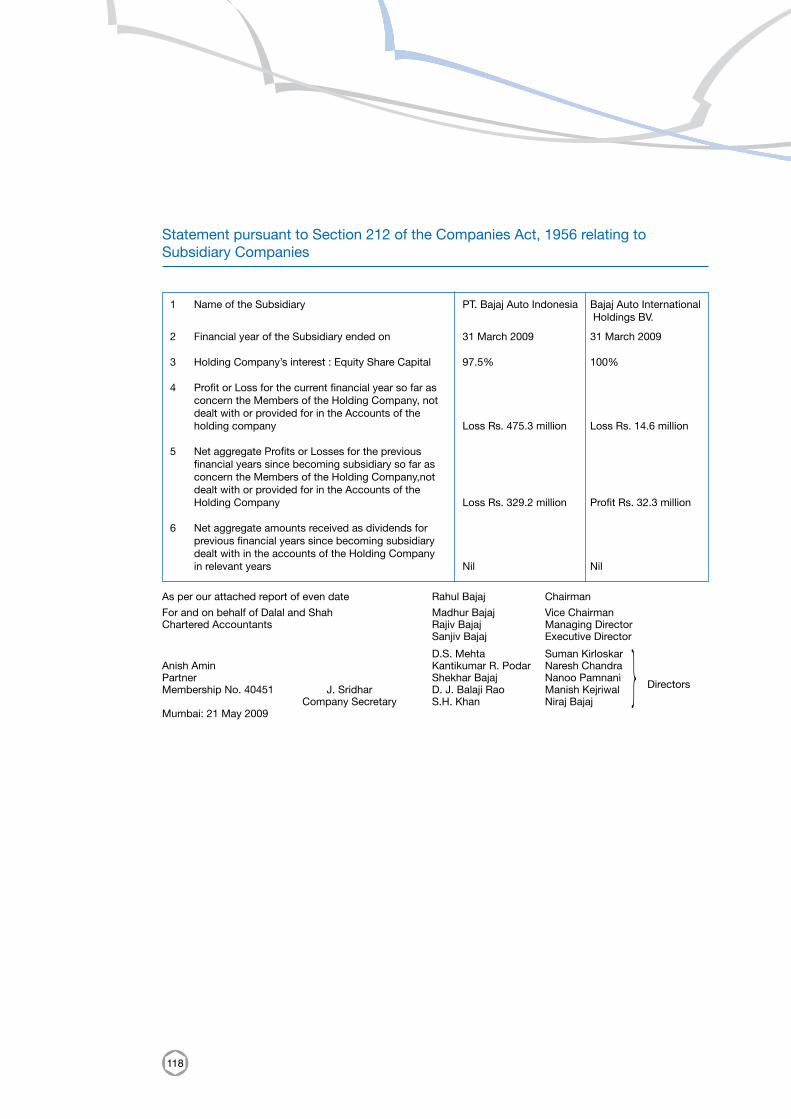
118
Statement pursuant to Section 212 of the Companies Act, 1956 relating to Subsidiary Companies
1 Name of the Subsidiary PT. Bajaj Auto Indonesia Bajaj Auto International Holdings BV.
2 Financial year of the Subsidiary ended on 31 March 2009 31 March 2009
3 Holding Company’s interest : Equity Share Capital 97.5% 100%
4 Profit or Loss for the current financial year so far as concern the Members of the Holding Company, not dealt with or provided for in the Accounts of the
holding company Loss Rs. 475.3 million Loss Rs. 14.6 million
5 Net aggregate Profits or Losses for the previous financial years since becoming subsidiary so far as concern the Members of the Holding Company,not dealt with or provided for in the Accounts of the
Holding Company Loss Rs. 329.2 million Profit Rs. 32.3 million
6 Net aggregate amounts received as dividends for previous financial years since becoming subsidiary dealt with in the accounts of the Holding Company
in relevant years Nil Nil
As per our attached report of even date Rahul Bajaj Chairman
For and on behalf of Dalal and Shah Madhur Bajaj Vice ChairmanChartered Accountants Rajiv Bajaj Managing Director Sanjiv Bajaj Executive Director
D.S. Mehta Suman KirloskarAnish Amin Kantikumar R. Podar Naresh ChandraPartner Shekhar Bajaj Nanoo Pamnani Membership No. 40451 J. Sridhar D. J. Balaji Rao Manish Kejriwal Directors
Company Secretary S.H. Khan Niraj BajajMumbai: 21 May 2009
}
119
Consolidated Financial Statements
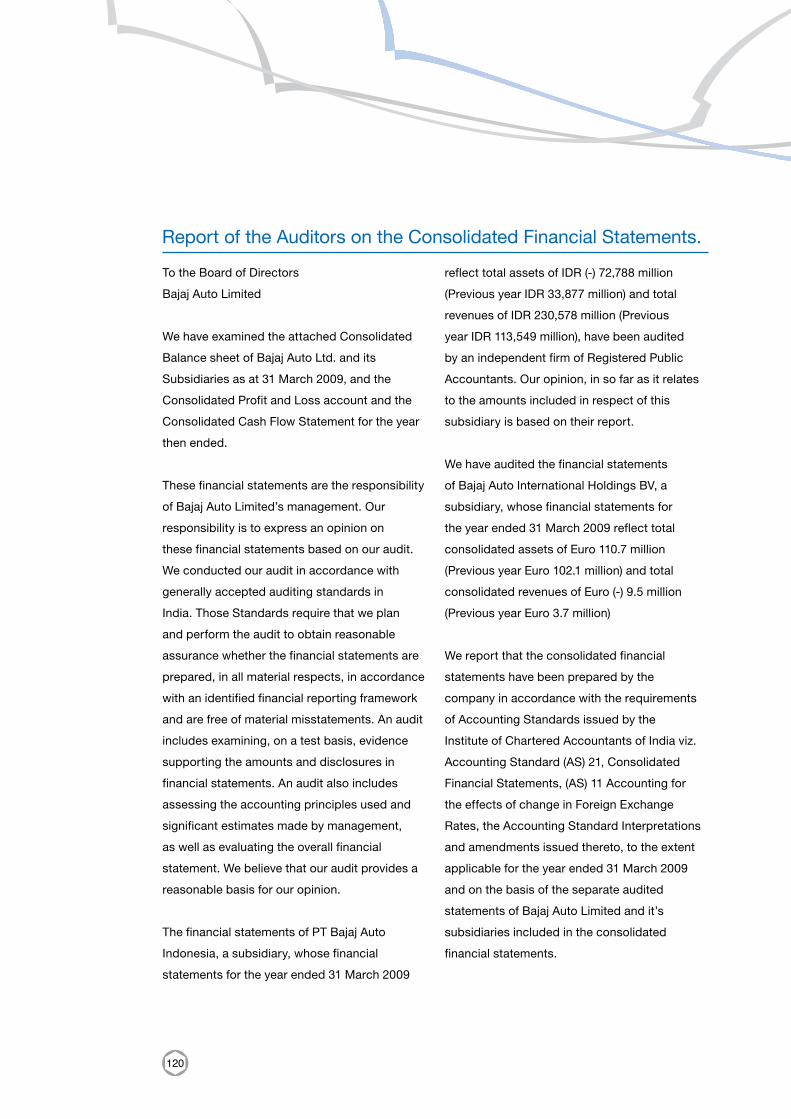
120
Report of the Auditors on the Consolidated Financial Statements.
To the Board of Directors
Bajaj Auto Limited
We have examined the attached Consolidated
Balance sheet of Bajaj Auto Ltd. and its
Subsidiaries as at 31 March 2009, and the
Consolidated Profit and Loss account and the
Consolidated Cash Flow Statement for the year
then ended.
These financial statements are the responsibility
of Bajaj Auto Limited’s management. Our
responsibility is to express an opinion on
these financial statements based on our audit.
We conducted our audit in accordance with
generally accepted auditing standards in
India. Those Standards require that we plan
and perform the audit to obtain reasonable
assurance whether the financial statements are
prepared, in all material respects, in accordance
with an identified financial reporting framework
and are free of material misstatements. An audit
includes examining, on a test basis, evidence
supporting the amounts and disclosures in
financial statements. An audit also includes
assessing the accounting principles used and
significant estimates made by management,
as well as evaluating the overall financial
statement. We believe that our audit provides a
reasonable basis for our opinion.
The financial statements of PT Bajaj Auto
Indonesia, a subsidiary, whose financial
statements for the year ended 31 March 2009
reflect total assets of IDR (-) 72,788 million
(Previous year IDR 33,877 million) and total
revenues of IDR 230,578 million (Previous
year IDR 113,549 million), have been audited
by an independent firm of Registered Public
Accountants. Our opinion, in so far as it relates
to the amounts included in respect of this
subsidiary is based on their report.
We have audited the financial statements
of Bajaj Auto International Holdings BV, a
subsidiary, whose financial statements for
the year ended 31 March 2009 reflect total
consolidated assets of Euro 110.7 million
(Previous year Euro 102.1 million) and total
consolidated revenues of Euro (-) 9.5 million
(Previous year Euro 3.7 million)
We report that the consolidated financial
statements have been prepared by the
company in accordance with the requirements
of Accounting Standards issued by the
Institute of Chartered Accountants of India viz.
Accounting Standard (AS) 21, Consolidated
Financial Statements, (AS) 11 Accounting for
the effects of change in Foreign Exchange
Rates, the Accounting Standard Interpretations
and amendments issued thereto, to the extent
applicable for the year ended 31 March 2009
and on the basis of the separate audited
statements of Bajaj Auto Limited and it’s
subsidiaries included in the consolidated
financial statements.
121
On the basis of the information and explanations
given to us and on the consideration of the
separate audit reports on individual audited
financial statements of Bajaj Auto Ltd. and it’s
aforesaid subsidiaries:
a) The Consolidated Balance sheet read
together with notes thereon, gives a
true and fair view of the consolidated
state of affairs of Bajaj Auto Ltd. and it’s
subsidiaries as at 31 March 2009
b) The Consolidated Profit & Loss account
read together with notes thereon, gives
a true and fair view of the consolidated
results of operations of Bajaj Auto Ltd. and
it’s subsidiaries for the year then ended and
c) The Consolidated Cash Flow Statement
read together with notes thereon, gives a
true and fair view of the consolidated cash
flows of Bajaj Auto Ltd. and it’s subsidiaries
for the year then ended.
For and on behalf of
Dalal & Shah
Chartered Accountants
Anish Amin
Partner
Membership No. 40451
Mumbai: 21 May 2009
Report of the Auditors on the Consolidated Financial Statements (Contd.)
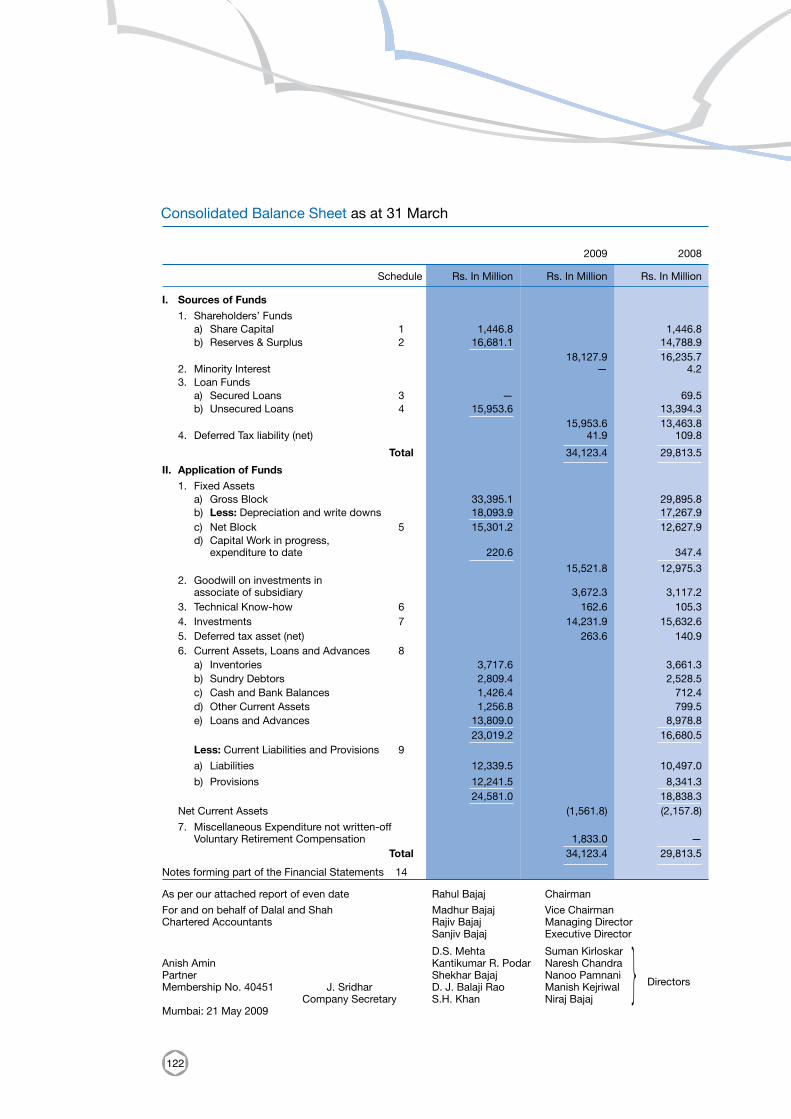
122
Consolidated Balance Sheet as at 31 March
Schedule Rs. In Million Rs. In Million Rs. In Million
2009 2008
I. Sources of Funds
1. Shareholders’ Funds a) Share Capital 1 1,446.8 1,446.8 b) Reserves & Surplus 2 16,681.1 14,788.9 18,127.9 16,235.7 2. Minority Interest — 4.2 3. Loan Funds a) Secured Loans 3 — 69.5 b) Unsecured Loans 4 15,953.6 13,394.3 15,953.6 13,463.8 4. Deferred Tax liability (net) 41.9 109.8 Total 34,123.4 29,813.5 II. Application of Funds
1. Fixed Assets a) Gross Block 33,395.1 29,895.8 b) Less: Depreciation and write downs 18,093.9 17,267.9 c) Net Block 5 15,301.2 12,627.9 d) Capital Work in progress, expenditure to date 220.6 347.4 15,521.8 12,975.3 2. Goodwill on investments in associate of subsidiary 3,672.3 3,117.2 3. Technical Know-how 6 162.6 105.3 4. Investments 7 14,231.9 15,632.6 5. Deferred tax asset (net) 263.6 140.9 6. Current Assets, Loans and Advances 8 a) Inventories 3,717.6 3,661.3 b) Sundry Debtors 2,809.4 2,528.5 c) Cash and Bank Balances 1,426.4 712.4 d) Other Current Assets 1,256.8 799.5 e) Loans and Advances 13,809.0 8,978.8 23,019.2 16,680.5 Less: Current Liabilities and Provisions 9
a) Liabilities 12,339.5 10,497.0
b) Provisions 12,241.5 8,341.3 24,581.0 18,838.3 Net Current Assets (1,561.8) (2,157.8)
7. Miscellaneous Expenditure not written-off Voluntary Retirement Compensation 1,833.0 — Total 34,123.4 29,813.5 Notes forming part of the Financial Statements 14
As per our attached report of even date Rahul Bajaj Chairman
For and on behalf of Dalal and Shah Madhur Bajaj Vice ChairmanChartered Accountants Rajiv Bajaj Managing Director Sanjiv Bajaj Executive Director
D.S. Mehta Suman KirloskarAnish Amin Kantikumar R. Podar Naresh ChandraPartner Shekhar Bajaj Nanoo Pamnani Membership No. 40451 J. Sridhar D. J. Balaji Rao Manish Kejriwal Directors
Company Secretary S.H. Khan Niraj BajajMumbai: 21 May 2009
}
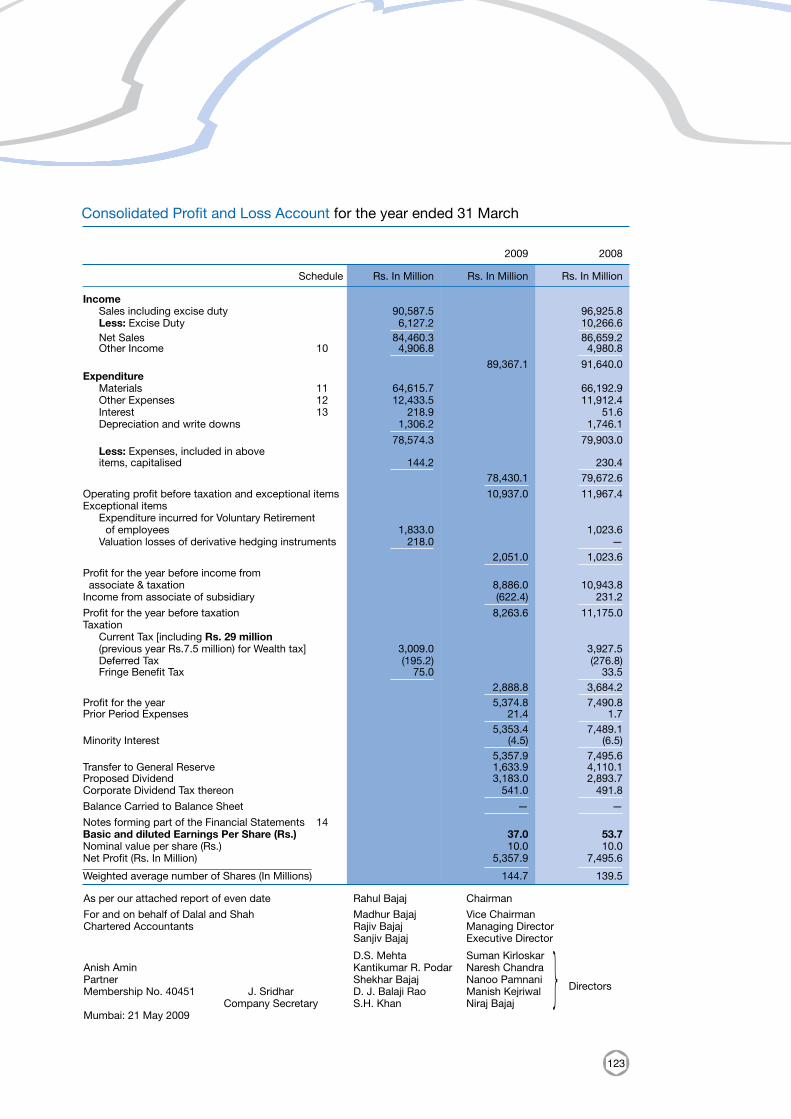
123
Consolidated Profit and Loss Account for the year ended 31 March
Schedule Rs. In Million Rs. In Million Rs. In Million
2009 2008
Income Sales including excise duty 90,587.5 96,925.8 Less: Excise Duty 6,127.2 10,266.6 Net Sales 84,460.3 86,659.2 Other Income 10 4,906.8 4,980.8 89,367.1 91,640.0 Expenditure Materials 11 64,615.7 66,192.9 Other Expenses 12 12,433.5 11,912.4 Interest 13 218.9 51.6 Depreciation and write downs 1,306.2 1,746.1 78,574.3 79,903.0 Less: Expenses, included in above items, capitalised 144.2 230.4 78,430.1 79,672.6 Operating profit before taxation and exceptional items 10,937.0 11,967.4 Exceptional items Expenditure incurred for Voluntary Retirement of employees 1,833.0 1,023.6 Valuation losses of derivative hedging instruments 218.0 — 2,051.0 1,023.6 Profit for the year before income from associate & taxation 8,886.0 10,943.8 Income from associate of subsidiary (622.4) 231.2 Profit for the year before taxation 8,263.6 11,175.0 Taxation Current Tax [including Rs. 29 million (previous year Rs.7.5 million) for Wealth tax] 3,009.0 3,927.5 Deferred Tax (195.2) (276.8) Fringe Benefit Tax 75.0 33.5 2,888.8 3,684.2 Profit for the year 5,374.8 7,490.8 Prior Period Expenses 21.4 1.7 5,353.4 7,489.1 Minority Interest (4.5) (6.5) 5,357.9 7,495.6 Transfer to General Reserve 1,633.9 4,110.1 Proposed Dividend 3,183.0 2,893.7 Corporate Dividend Tax thereon 541.0 491.8 Balance Carried to Balance Sheet — — Notes forming part of the Financial Statements 14Basic and diluted Earnings Per Share (Rs.) 37.0 53.7 Nominal value per share (Rs.) 10.0 10.0 Net Profit (Rs. In Million) 5,357.9 7,495.6 Weighted average number of Shares (In Millions) 144.7 139.5
As per our attached report of even date Rahul Bajaj Chairman
For and on behalf of Dalal and Shah Madhur Bajaj Vice ChairmanChartered Accountants Rajiv Bajaj Managing Director Sanjiv Bajaj Executive Director
D.S. Mehta Suman KirloskarAnish Amin Kantikumar R. Podar Naresh ChandraPartner Shekhar Bajaj Nanoo Pamnani Membership No. 40451 J. Sridhar D. J. Balaji Rao Manish Kejriwal Directors
Company Secretary S.H. Khan Niraj BajajMumbai: 21 May 2009
}
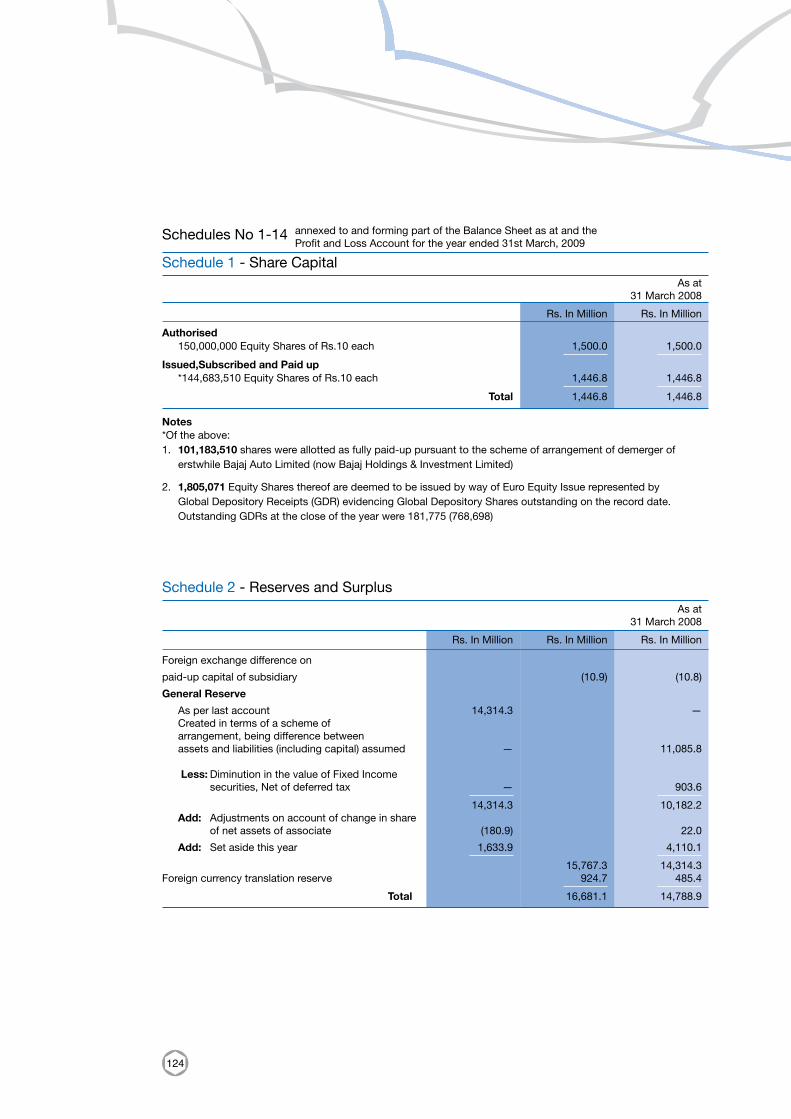
124
Foreign exchange difference on
paid-up capital of subsidiary (10.9) (10.8)
General Reserve
As per last account 14,314.3 — Created in terms of a scheme of arrangement, being difference between assets and liabilities (including capital) assumed — 11,085.8
Less: Diminution in the value of Fixed Income securities, Net of deferred tax — 903.6 14,314.3 10,182.2 Add: Adjustments on account of change in share of net assets of associate (180.9) 22.0
Add: Set aside this year 1,633.9 4,110.1 15,767.3 14,314.3 Foreign currency translation reserve 924.7 485.4 Total 16,681.1 14,788.9
Schedule 1 - Share Capital
Schedule 2 - Reserves and Surplus
As at 31 March 2008
Rs. In Million Rs. In Million
As at 31 March 2008
Rs. In Million Rs. In Million Rs. In Million
Schedules No 1-14 annexed to and forming part of the Balance Sheet as at and the Profit and Loss Account for the year ended 31st March, 2009
Authorised 150,000,000 Equity Shares of Rs.10 each 1,500.0 1,500.0 Issued,Subscribed and Paid up *144,683,510 Equity Shares of Rs.10 each 1,446.8 1,446.8 Total 1,446.8 1,446.8
Notes*Of the above: 1. 101,183,510 shares were allotted as fully paid-up pursuant to the scheme of arrangement of demerger of
erstwhile Bajaj Auto Limited (now Bajaj Holdings & Investment Limited)
2. 1,805,071 Equity Shares thereof are deemed to be issued by way of Euro Equity Issue represented by Global Depository Receipts (GDR) evidencing Global Depository Shares outstanding on the record date. Outstanding GDRs at the close of the year were 181,775 (768,698)
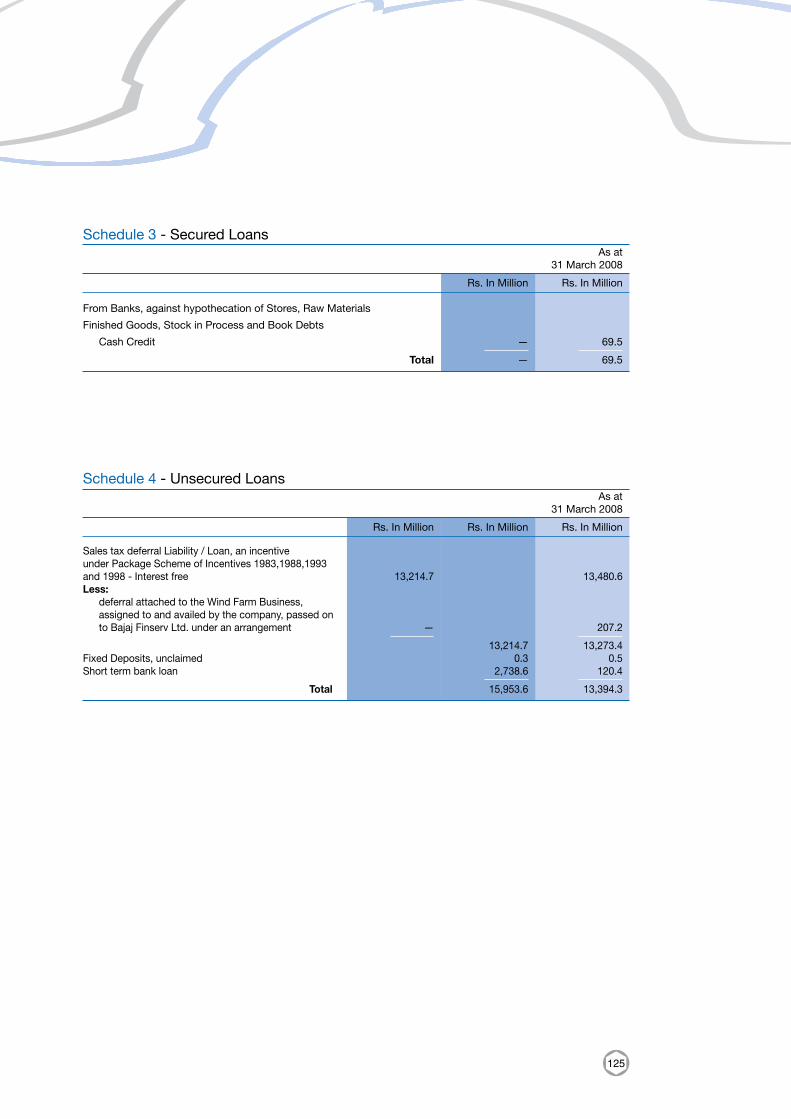
125
From Banks, against hypothecation of Stores, Raw Materials
Finished Goods, Stock in Process and Book Debts
Cash Credit — 69.5 Total — 69.5
Schedule 3 - Secured Loans
Schedule 4 - Unsecured Loans
As at 31 March 2008
Rs. In Million Rs. In Million
As at 31 March 2008
Rs. In Million Rs. In Million Rs. In Million
Sales tax deferral Liability / Loan, an incentive under Package Scheme of Incentives 1983,1988,1993 and 1998 - Interest free 13,214.7 13,480.6 Less: deferral attached to the Wind Farm Business, assigned to and availed by the company, passed on to Bajaj Finserv Ltd. under an arrangement — 207.2 13,214.7 13,273.4 Fixed Deposits, unclaimed 0.3 0.5 Short term bank loan 2,738.6 120.4 Total 15,953.6 13,394.3
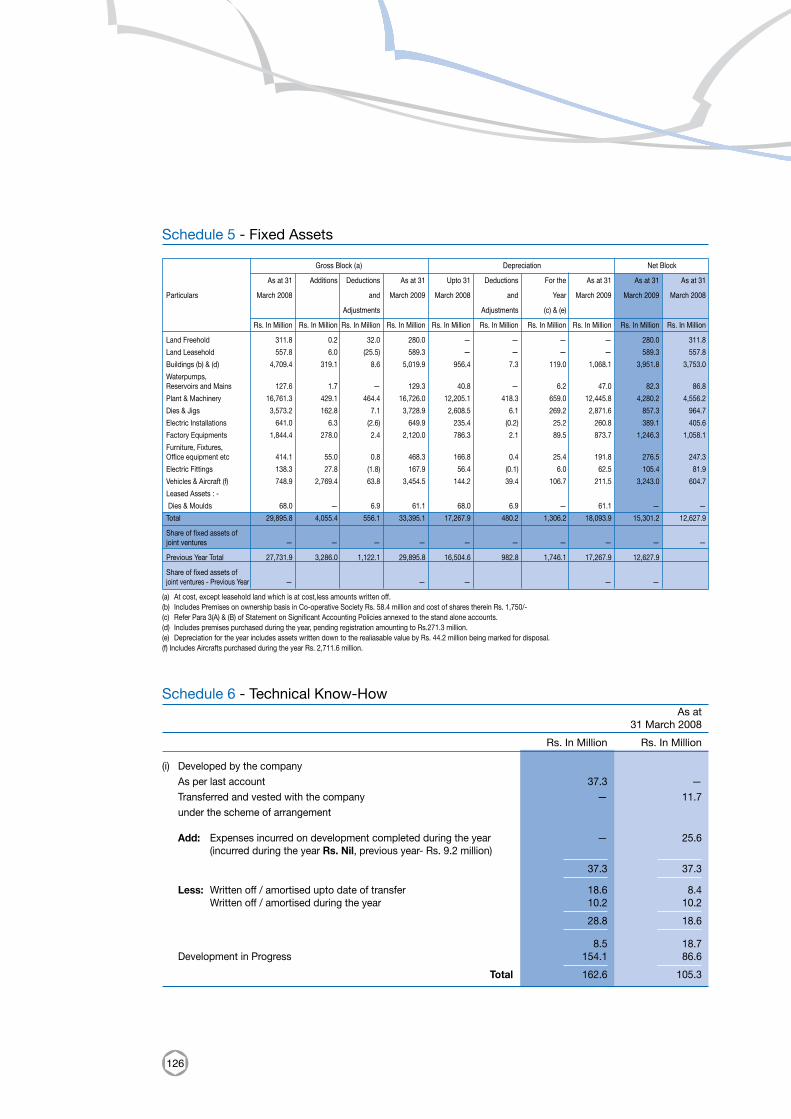
126
Schedule 5 - Fixed Assets
Schedule 6 - Technical Know-How As at 31 March 2008
Rs. In Million Rs. In Million
(i) Developed by the company As per last account 37.3 — Transferred and vested with the company — 11.7 under the scheme of arrangement
Add: Expenses incurred on development completed during the year — 25.6 (incurred during the year Rs. Nil, previous year- Rs. 9.2 million) 37.3 37.3
Less: Written off / amortised upto date of transfer 18.6 8.4 Written off / amortised during the year 10.2 10.2 28.8 18.6
8.5 18.7 Development in Progress 154.1 86.6 Total 162.6 105.3
Gross Block (a) Depreciation Net Block As at 31 Additions Deductions As at 31 Upto 31 Deductions For the As at 31 As at 31 As at 31 Particulars March 2008 and March 2009 March 2008 and Year March 2009 March 2009 March 2008 Adjustments Adjustments (c) & (e)
Rs. In Million Rs. In Million Rs. In Million Rs. In Million Rs. In Million Rs. In Million Rs. In Million Rs. In Million Rs. In Million Rs. In Million Land Freehold 311.8 0.2 32.0 280.0 — — — — 280.0 311.8
Land Leasehold 557.8 6.0 (25.5) 589.3 — — — — 589.3 557.8
Buildings (b) & (d) 4,709.4 319.1 8.6 5,019.9 956.4 7.3 119.0 1,068.1 3,951.8 3,753.0
Waterpumps, Reservoirs and Mains 127.6 1.7 — 129.3 40.8 — 6.2 47.0 82.3 86.8
Plant & Machinery 16,761.3 429.1 464.4 16,726.0 12,205.1 418.3 659.0 12,445.8 4,280.2 4,556.2
Dies & Jigs 3,573.2 162.8 7.1 3,728.9 2,608.5 6.1 269.2 2,871.6 857.3 964.7
Electric Installations 641.0 6.3 (2.6) 649.9 235.4 (0.2) 25.2 260.8 389.1 405.6
Factory Equipments 1,844.4 278.0 2.4 2,120.0 786.3 2.1 89.5 873.7 1,246.3 1,058.1
Furniture, Fixtures, Office equipment etc 414.1 55.0 0.8 468.3 166.8 0.4 25.4 191.8 276.5 247.3
Electric Fittings 138.3 27.8 (1.8) 167.9 56.4 (0.1) 6.0 62.5 105.4 81.9
Vehicles & Aircraft (f) 748.9 2,769.4 63.8 3,454.5 144.2 39.4 106.7 211.5 3,243.0 604.7
Leased Assets : -
Dies & Moulds 68.0 — 6.9 61.1 68.0 6.9 — 61.1 — —
Total 29,895.8 4,055.4 556.1 33,395.1 17,267.9 480.2 1,306.2 18,093.9 15,301.2 12,627.9
Share of fixed assets of joint ventures — — — — — — — — — —
Previous Year Total 27,731.9 3,286.0 1,122.1 29,895.8 16,504.6 982.8 1,746.1 17,267.9 12,627.9
Share of fixed assets of joint ventures - Previous Year — — — — —
(a) At cost, except leasehold land which is at cost,less amounts written off.(b) Includes Premises on ownership basis in Co-operative Society Rs. 58.4 million and cost of shares therein Rs. 1,750/-(c) Refer Para 3(A) & (B) of Statement on Significant Accounting Policies annexed to the stand alone accounts.(d) Includes premises purchased during the year, pending registration amounting to Rs.271.3 million.(e) Depreciation for the year includes assets written down to the realiasable value by Rs. 44.2 million being marked for disposal.(f) Includes Aircrafts purchased during the year Rs. 2,711.6 million.
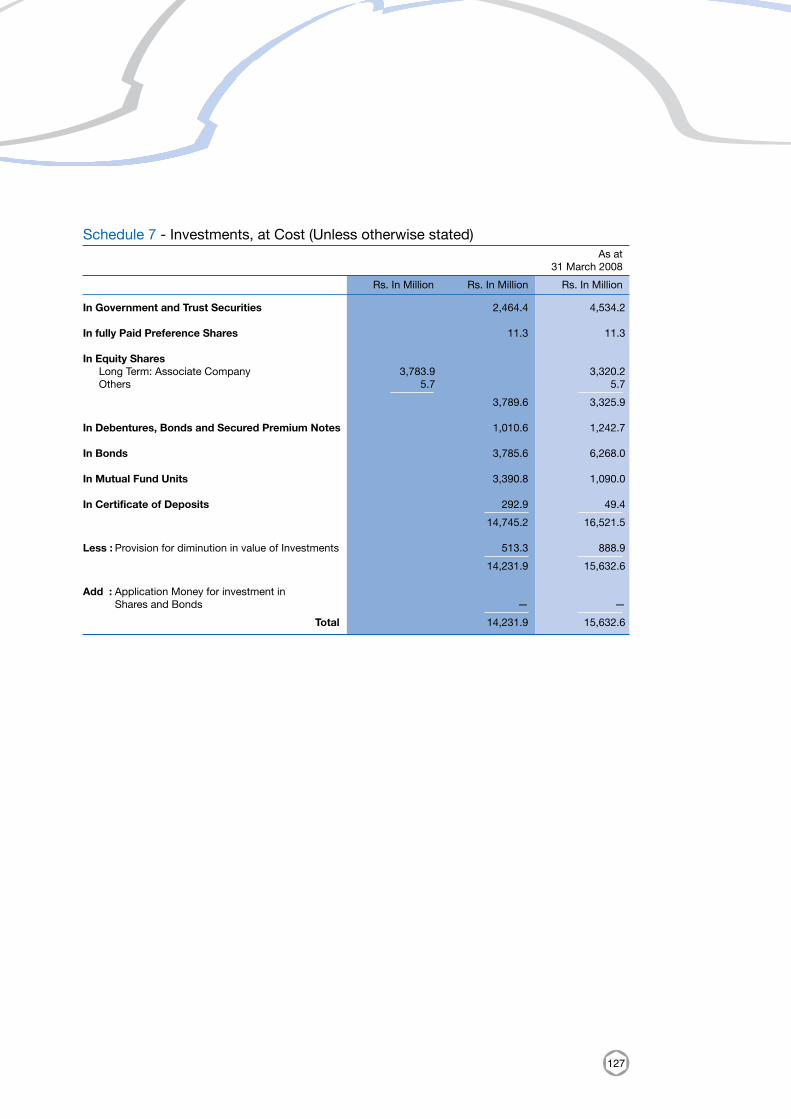
127
Schedule 7 - Investments, at Cost (Unless otherwise stated) As at 31 March 2008
Rs. In Million Rs. In Million Rs. In Million
In Government and Trust Securities 2,464.4 4,534.2 In fully Paid Preference Shares 11.3 11.3 In Equity Shares Long Term: Associate Company 3,783.9 3,320.2 Others 5.7 5.7 3,789.6 3,325.9 In Debentures, Bonds and Secured Premium Notes 1,010.6 1,242.7 In Bonds 3,785.6 6,268.0 In Mutual Fund Units 3,390.8 1,090.0 In Certificate of Deposits 292.9 49.4 14,745.2 16,521.5 Less : Provision for diminution in value of Investments 513.3 888.9 14,231.9 15,632.6 Add : Application Money for investment in Shares and Bonds — — Total 14,231.9 15,632.6
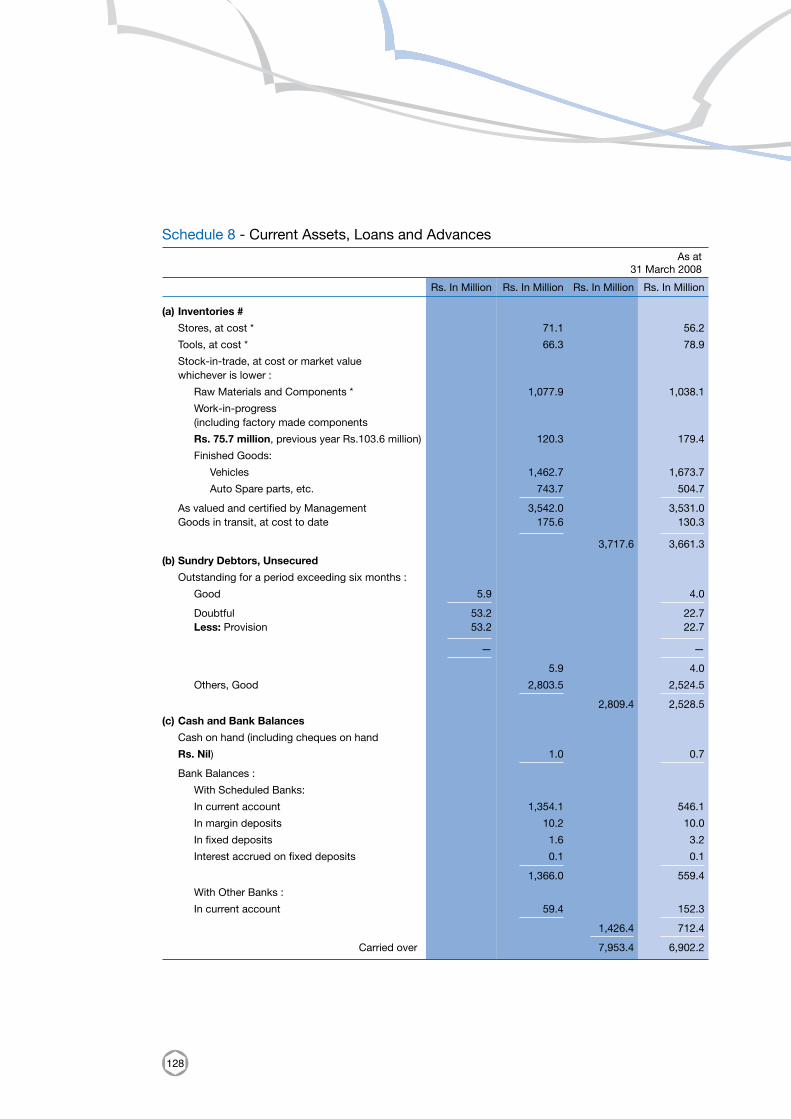
128
Schedule 8 - Current Assets, Loans and Advances As at 31 March 2008
Rs. In Million Rs. In Million Rs. In Million Rs. In Million
(a) Inventories #
Stores, at cost * 71.1 56.2
Tools, at cost * 66.3 78.9
Stock-in-trade, at cost or market value whichever is lower :
Raw Materials and Components * 1,077.9 1,038.1
Work-in-progress (including factory made components
Rs. 75.7 million, previous year Rs.103.6 million) 120.3 179.4
Finished Goods:
Vehicles 1,462.7 1,673.7
Auto Spare parts, etc. 743.7 504.7 As valued and certified by Management 3,542.0 3,531.0 Goods in transit, at cost to date 175.6 130.3 3,717.6 3,661.3
(b) Sundry Debtors, Unsecured
Outstanding for a period exceeding six months :
Good 5.9 4.0 Doubtful 53.2 22.7 Less: Provision 53.2 22.7 — — 5.9 4.0
Others, Good 2,803.5 2,524.5 2,809.4 2,528.5
(c) Cash and Bank Balances
Cash on hand (including cheques on hand
Rs. Nil) 1.0 0.7 Bank Balances :
With Scheduled Banks:
In current account 1,354.1 546.1
In margin deposits 10.2 10.0
In fixed deposits 1.6 3.2
Interest accrued on fixed deposits 0.1 0.1 1,366.0 559.4
With Other Banks :
In current account 59.4 152.3 1,426.4 712.4 Carried over 7,953.4 6,902.2
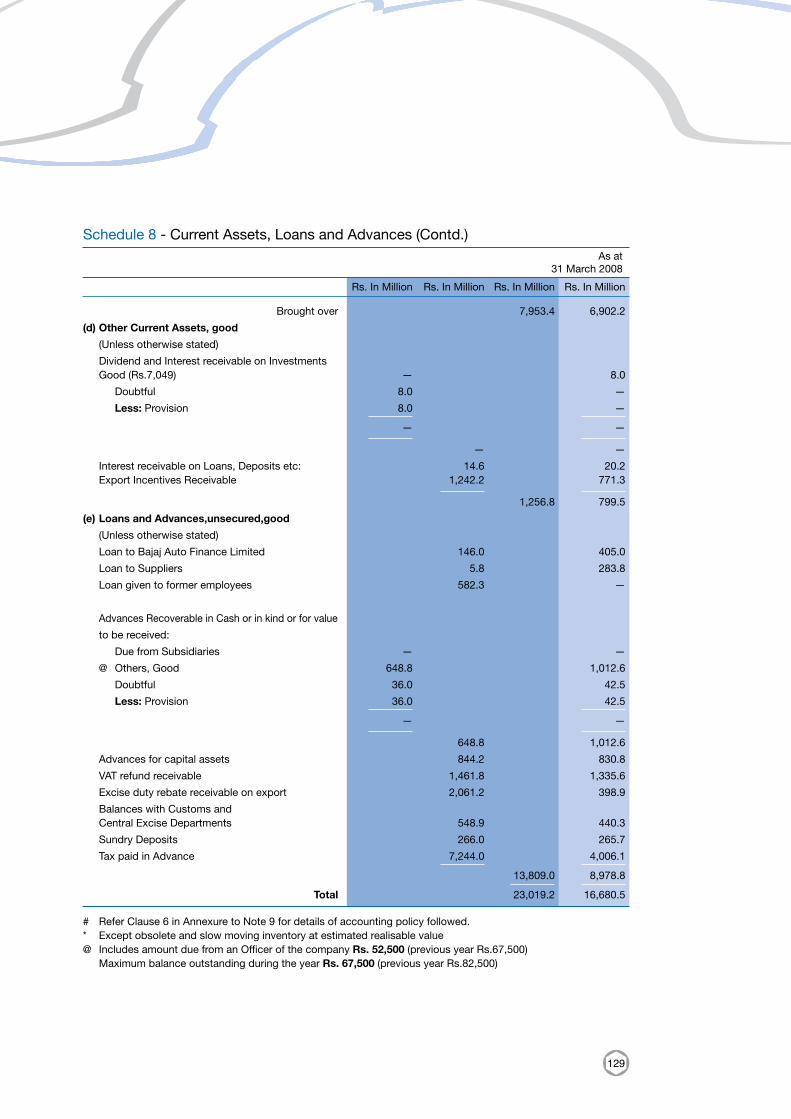
129
Schedule 8 - Current Assets, Loans and Advances (Contd.) As at 31 March 2008
Rs. In Million Rs. In Million Rs. In Million Rs. In Million
Brought over 7,953.4 6,902.2
(d) Other Current Assets, good
(Unless otherwise stated)
Dividend and Interest receivable on Investments Good (Rs.7,049) — 8.0
Doubtful 8.0 —
Less: Provision 8.0 — — — — —
Interest receivable on Loans, Deposits etc: 14.6 20.2 Export Incentives Receivable 1,242.2 771.3 1,256.8 799.5
(e) Loans and Advances,unsecured,good
(Unless otherwise stated)
Loan to Bajaj Auto Finance Limited 146.0 405.0
Loan to Suppliers 5.8 283.8
Loan given to former employees 582.3 —
Advances Recoverable in Cash or in kind or for value
to be received:
Due from Subsidiaries — —
@ Others, Good 648.8 1,012.6
Doubtful 36.0 42.5
Less: Provision 36.0 42.5 — — 648.8 1,012.6
Advances for capital assets 844.2 830.8
VAT refund receivable 1,461.8 1,335.6
Excise duty rebate receivable on export 2,061.2 398.9
Balances with Customs and Central Excise Departments 548.9 440.3
Sundry Deposits 266.0 265.7
Tax paid in Advance 7,244.0 4,006.1 13,809.0 8,978.8 Total 23,019.2 16,680.5
# Refer Clause 6 in Annexure to Note 9 for details of accounting policy followed.* Except obsolete and slow moving inventory at estimated realisable value@ Includes amount due from an Officer of the company Rs. 52,500 (previous year Rs.67,500) Maximum balance outstanding during the year Rs. 67,500 (previous year Rs.82,500)
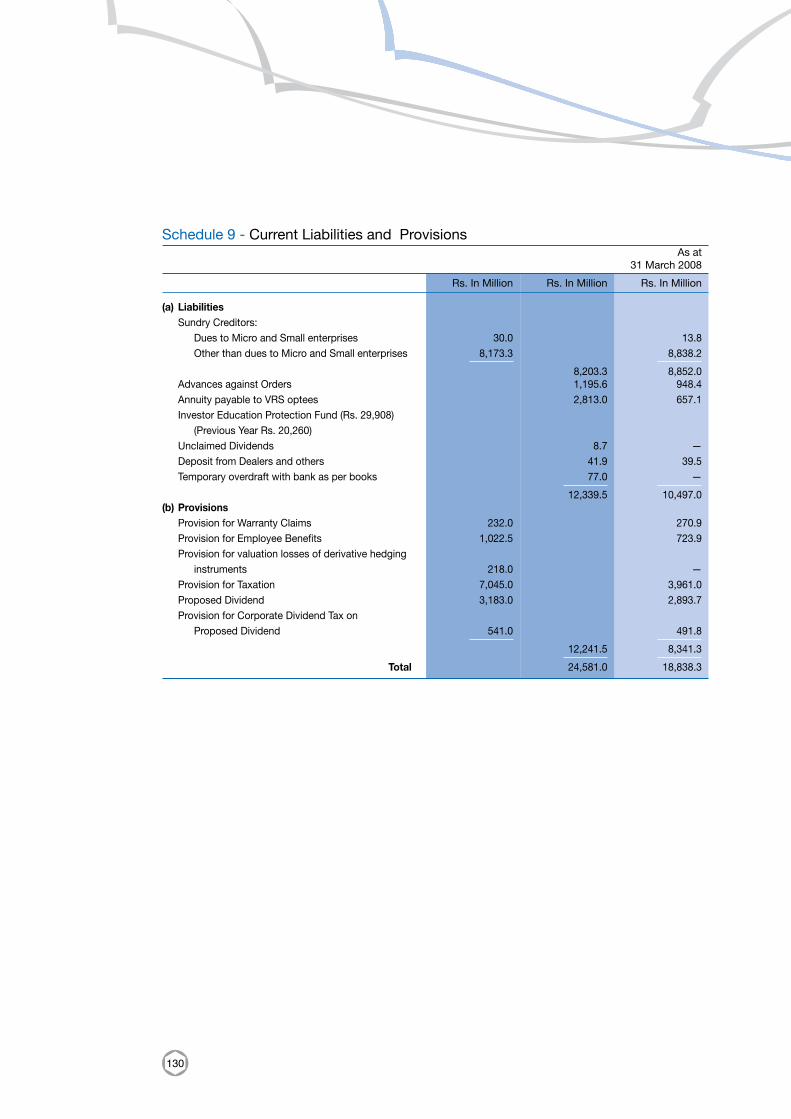
130
Schedule 9 - Current Liabilities and Provisions As at 31 March 2008
Rs. In Million Rs. In Million Rs. In Million
(a) Liabilities Sundry Creditors: Dues to Micro and Small enterprises 30.0 13.8 Other than dues to Micro and Small enterprises 8,173.3 8,838.2 8,203.3 8,852.0 Advances against Orders 1,195.6 948.4 Annuity payable to VRS optees 2,813.0 657.1 Investor Education Protection Fund (Rs. 29,908) (Previous Year Rs. 20,260) Unclaimed Dividends 8.7 — Deposit from Dealers and others 41.9 39.5 Temporary overdraft with bank as per books 77.0 — 12,339.5 10,497.0 (b) Provisions Provision for Warranty Claims 232.0 270.9 Provision for Employee Benefits 1,022.5 723.9 Provision for valuation losses of derivative hedging instruments 218.0 — Provision for Taxation 7,045.0 3,961.0 Proposed Dividend 3,183.0 2,893.7 Provision for Corporate Dividend Tax on Proposed Dividend 541.0 491.8 12,241.5 8,341.3 Total 24,581.0 18,838.3
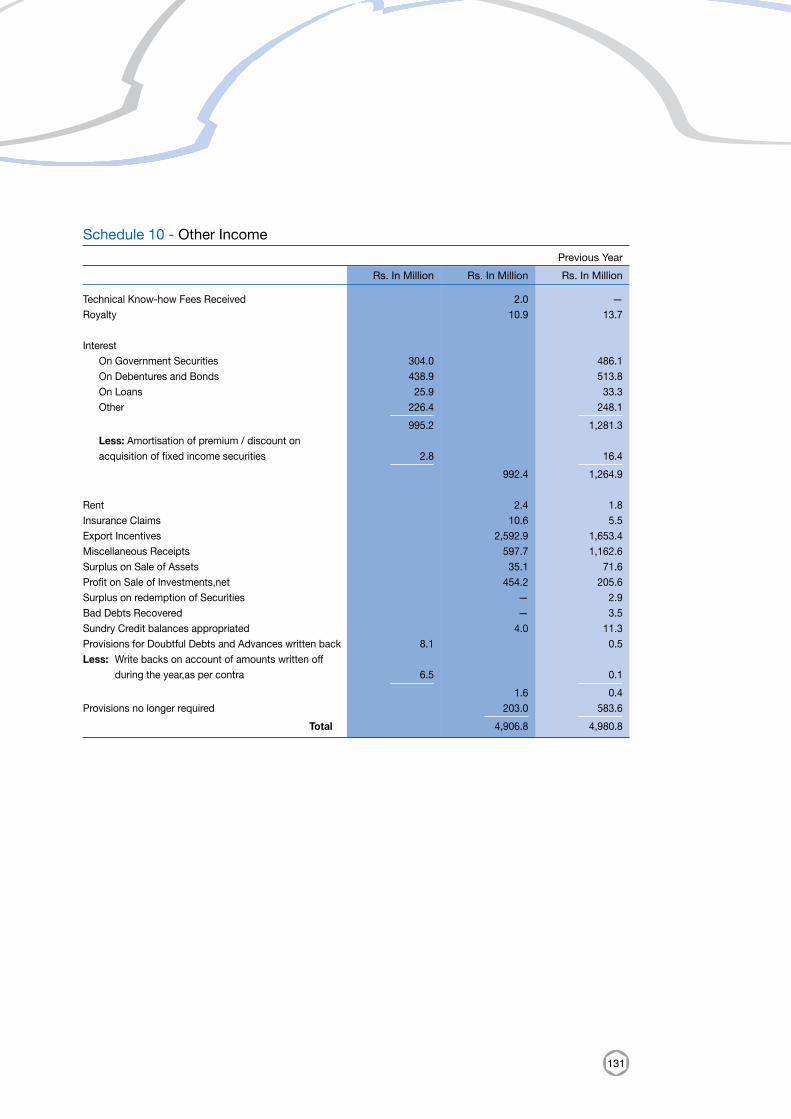
131
Schedule 10 - Other Income Previous Year
Rs. In Million Rs. In Million Rs. In Million
Technical Know-how Fees Received 2.0 — Royalty 10.9 13.7
Interest On Government Securities 304.0 486.1 On Debentures and Bonds 438.9 513.8 On Loans 25.9 33.3 Other 226.4 248.1 995.2 1,281.3 Less: Amortisation of premium / discount on acquisition of fixed income securities 2.8 16.4 992.4 1,264.9
Rent 2.4 1.8 Insurance Claims 10.6 5.5 Export Incentives 2,592.9 1,653.4 Miscellaneous Receipts 597.7 1,162.6 Surplus on Sale of Assets 35.1 71.6 Profit on Sale of Investments,net 454.2 205.6 Surplus on redemption of Securities — 2.9 Bad Debts Recovered — 3.5 Sundry Credit balances appropriated 4.0 11.3 Provisions for Doubtful Debts and Advances written back 8.1 0.5 Less: Write backs on account of amounts written off during the year,as per contra 6.5 0.1 1.6 0.4 Provisions no longer required 203.0 583.6 Total 4,906.8 4,980.8
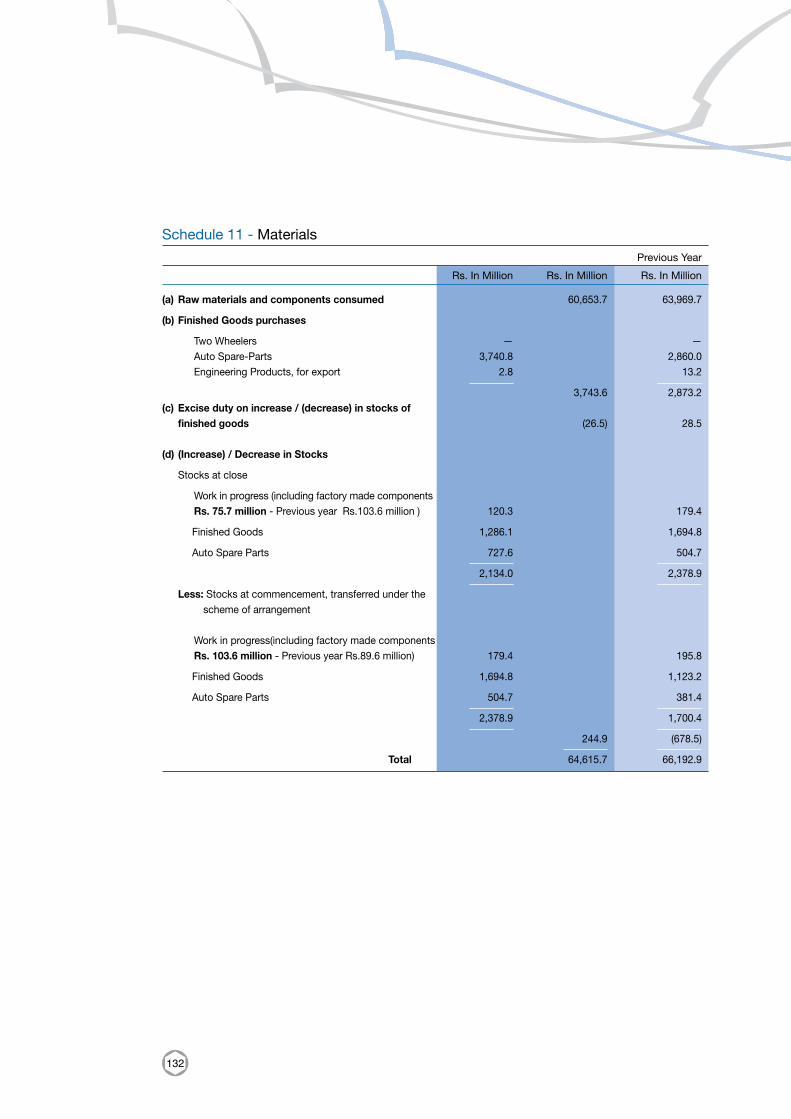
132
Schedule 11 - Materials Previous Year
Rs. In Million Rs. In Million Rs. In Million
(a) Raw materials and components consumed 60,653.7 63,969.7
(b) Finished Goods purchases
Two Wheelers — — Auto Spare-Parts 3,740.8 2,860.0 Engineering Products, for export 2.8 13.2 3,743.6 2,873.2 (c) Excise duty on increase / (decrease) in stocks of finished goods (26.5) 28.5 (d) (Increase) / Decrease in Stocks
Stocks at close
Work in progress (including factory made components Rs. 75.7 million - Previous year Rs.103.6 million ) 120.3 179.4
Finished Goods 1,286.1 1,694.8
Auto Spare Parts 727.6 504.7 2,134.0 2,378.9 Less: Stocks at commencement, transferred under the scheme of arrangement Work in progress(including factory made components Rs. 103.6 million - Previous year Rs.89.6 million) 179.4 195.8
Finished Goods 1,694.8 1,123.2
Auto Spare Parts 504.7 381.4 2,378.9 1,700.4 244.9 (678.5) Total 64,615.7 66,192.9
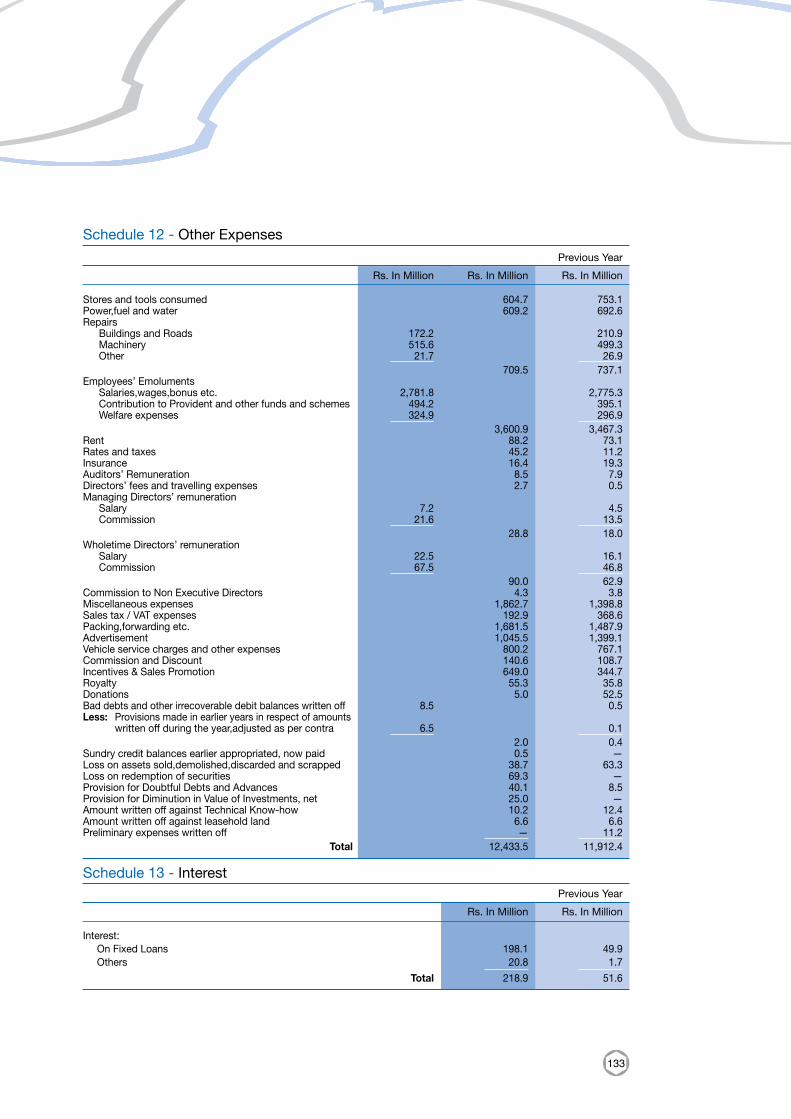
133
Schedule 12 - Other Expenses Previous Year
Rs. In Million Rs. In Million Rs. In Million
Stores and tools consumed 604.7 753.1 Power,fuel and water 609.2 692.6 Repairs Buildings and Roads 172.2 210.9 Machinery 515.6 499.3 Other 21.7 26.9 709.5 737.1 Employees’ Emoluments Salaries,wages,bonus etc. 2,781.8 2,775.3 Contribution to Provident and other funds and schemes 494.2 395.1 Welfare expenses 324.9 296.9 3,600.9 3,467.3 Rent 88.2 73.1 Rates and taxes 45.2 11.2 Insurance 16.4 19.3 Auditors’ Remuneration 8.5 7.9 Directors’ fees and travelling expenses 2.7 0.5 Managing Directors’ remuneration Salary 7.2 4.5 Commission 21.6 13.5 28.8 18.0 Wholetime Directors’ remuneration Salary 22.5 16.1 Commission 67.5 46.8 90.0 62.9 Commission to Non Executive Directors 4.3 3.8 Miscellaneous expenses 1,862.7 1,398.8 Sales tax / VAT expenses 192.9 368.6 Packing,forwarding etc. 1,681.5 1,487.9 Advertisement 1,045.5 1,399.1 Vehicle service charges and other expenses 800.2 767.1 Commission and Discount 140.6 108.7 Incentives & Sales Promotion 649.0 344.7 Royalty 55.3 35.8 Donations 5.0 52.5 Bad debts and other irrecoverable debit balances written off 8.5 0.5 Less: Provisions made in earlier years in respect of amounts written off during the year,adjusted as per contra 6.5 0.1 2.0 0.4 Sundry credit balances earlier appropriated, now paid 0.5 — Loss on assets sold,demolished,discarded and scrapped 38.7 63.3 Loss on redemption of securities 69.3 — Provision for Doubtful Debts and Advances 40.1 8.5 Provision for Diminution in Value of Investments, net 25.0 — Amount written off against Technical Know-how 10.2 12.4 Amount written off against leasehold land 6.6 6.6 Preliminary expenses written off — 11.2 Total 12,433.5 11,912.4
Schedule 13 - Interest Previous Year
Rs. In Million Rs. In Million
Interest: On Fixed Loans 198.1 49.9 Others 20.8 1.7 Total 218.9 51.6
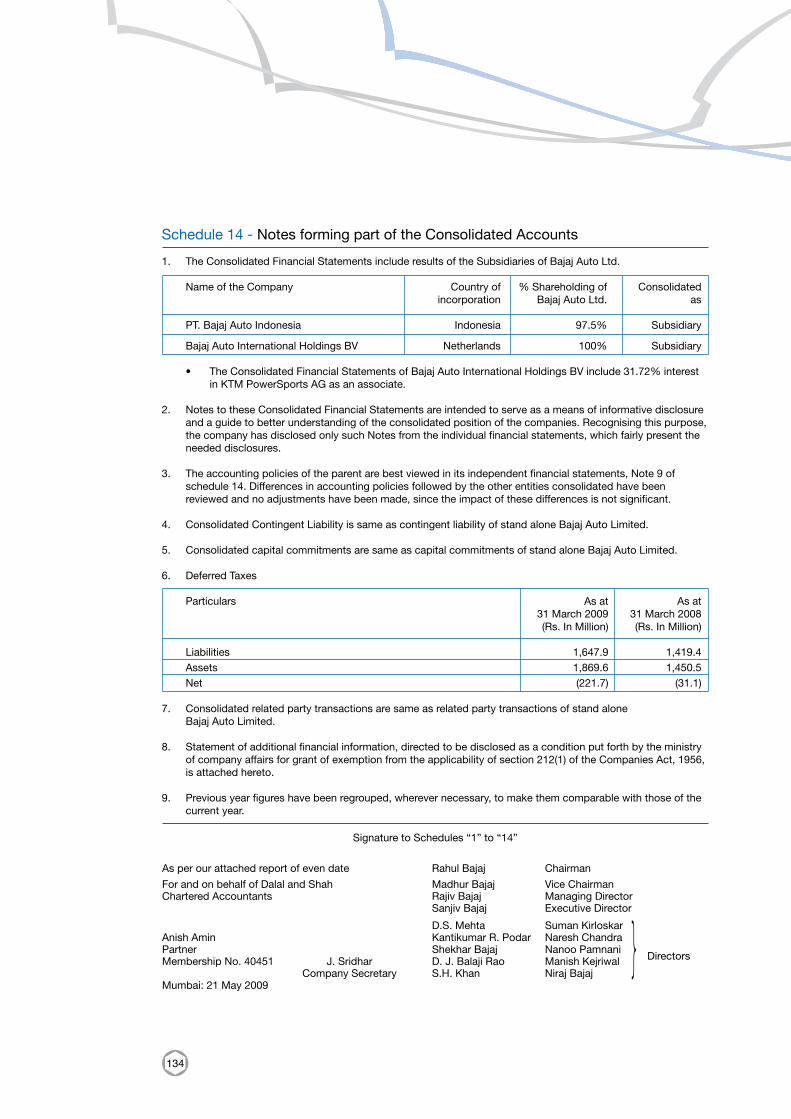
134
Schedule 14 - Notes forming part of the Consolidated Accounts
1. The Consolidated Financial Statements include results of the Subsidiaries of Bajaj Auto Ltd.
Name of the Company Country of % Shareholding of Consolidated incorporation Bajaj Auto Ltd. as
PT. Bajaj Auto Indonesia Indonesia 97.5% Subsidiary
Bajaj Auto International Holdings BV Netherlands 100% Subsidiary
• The Consolidated Financial Statements of Bajaj Auto International Holdings BV include 31.72% interest in KTM PowerSports AG as an associate.
2. Notes to these Consolidated Financial Statements are intended to serve as a means of informative disclosure
and a guide to better understanding of the consolidated position of the companies. Recognising this purpose, the company has disclosed only such Notes from the individual financial statements, which fairly present the needed disclosures.
3. The accounting policies of the parent are best viewed in its independent financial statements, Note 9 of schedule 14. Differences in accounting policies followed by the other entities consolidated have been reviewed and no adjustments have been made, since the impact of these differences is not significant.
4. Consolidated Contingent Liability is same as contingent liability of stand alone Bajaj Auto Limited.
5. Consolidated capital commitments are same as capital commitments of stand alone Bajaj Auto Limited.
6. Deferred Taxes
Particulars As at As at 31 March 2009 31 March 2008 (Rs. In Million) (Rs. In Million)
Liabilities 1,647.9 1,419.4 Assets 1,869.6 1,450.5 Net (221.7) (31.1)
7. Consolidated related party transactions are same as related party transactions of stand alone Bajaj Auto Limited.
8. Statement of additional financial information, directed to be disclosed as a condition put forth by the ministry of company affairs for grant of exemption from the applicability of section 212(1) of the Companies Act, 1956, is attached hereto.
9. Previous year figures have been regrouped, wherever necessary, to make them comparable with those of the current year.
Signature to Schedules “1” to “14”
As per our attached report of even date Rahul Bajaj Chairman
For and on behalf of Dalal and Shah Madhur Bajaj Vice ChairmanChartered Accountants Rajiv Bajaj Managing Director Sanjiv Bajaj Executive Director
D.S. Mehta Suman KirloskarAnish Amin Kantikumar R. Podar Naresh ChandraPartner Shekhar Bajaj Nanoo Pamnani Membership No. 40451 J. Sridhar D. J. Balaji Rao Manish Kejriwal Directors
Company Secretary S.H. Khan Niraj BajajMumbai: 21 May 2009
}
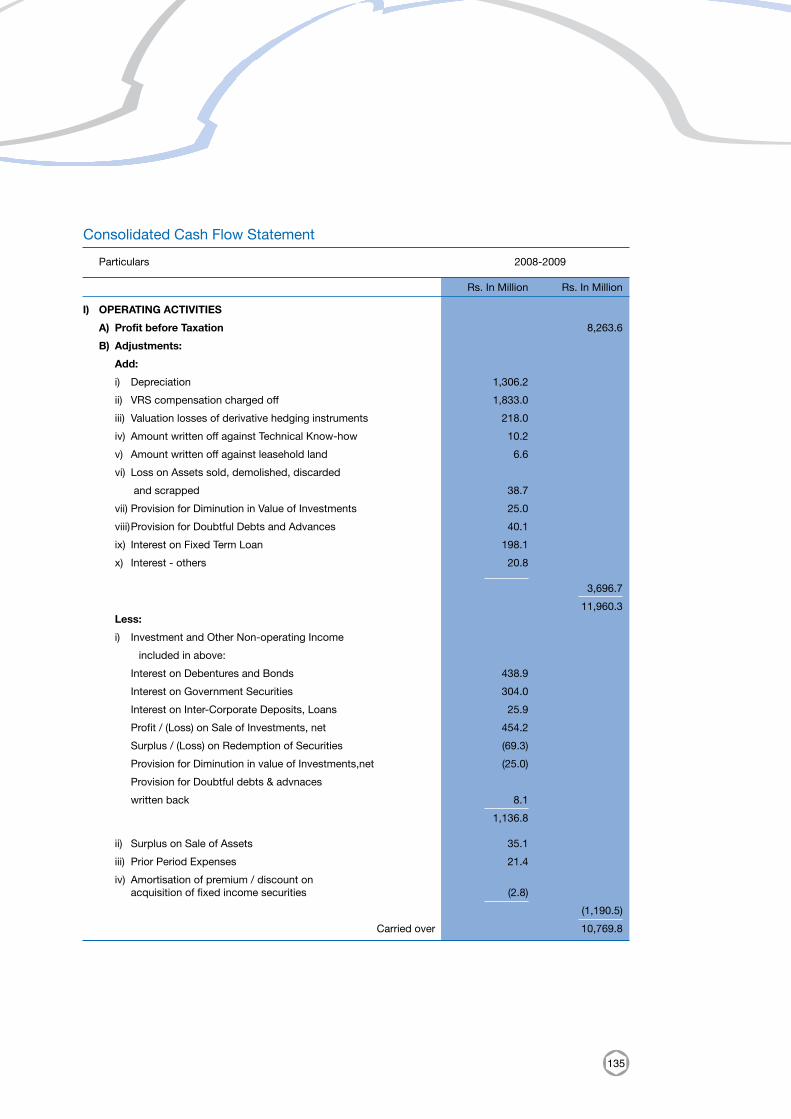
135
I) OPERATING ACTIVITIES
A) Profit before Taxation 8,263.6
B) Adjustments:
Add:
i) Depreciation 1,306.2
ii) VRS compensation charged off 1,833.0
iii) Valuation losses of derivative hedging instruments 218.0
iv) Amount written off against Technical Know-how 10.2
v) Amount written off against leasehold land 6.6
vi) Loss on Assets sold, demolished, discarded
and scrapped 38.7
vii) Provision for Diminution in Value of Investments 25.0
viii) Provision for Doubtful Debts and Advances 40.1
ix) Interest on Fixed Term Loan 198.1
x) Interest - others 20.8 3,696.7 11,960.3 Less:
i) Investment and Other Non-operating Income
included in above:
Interest on Debentures and Bonds 438.9
Interest on Government Securities 304.0
Interest on Inter-Corporate Deposits, Loans 25.9
Profit / (Loss) on Sale of Investments, net 454.2
Surplus / (Loss) on Redemption of Securities (69.3)
Provision for Diminution in value of Investments,net (25.0)
Provision for Doubtful debts & advnaces
written back 8.1 1,136.8
ii) Surplus on Sale of Assets 35.1
iii) Prior Period Expenses 21.4
iv) Amortisation of premium / discount on acquisition of fixed income securities (2.8) (1,190.5) Carried over 10,769.8
Consolidated Cash Flow Statement
Particulars 2008-2009
Rs. In Million Rs. In Million
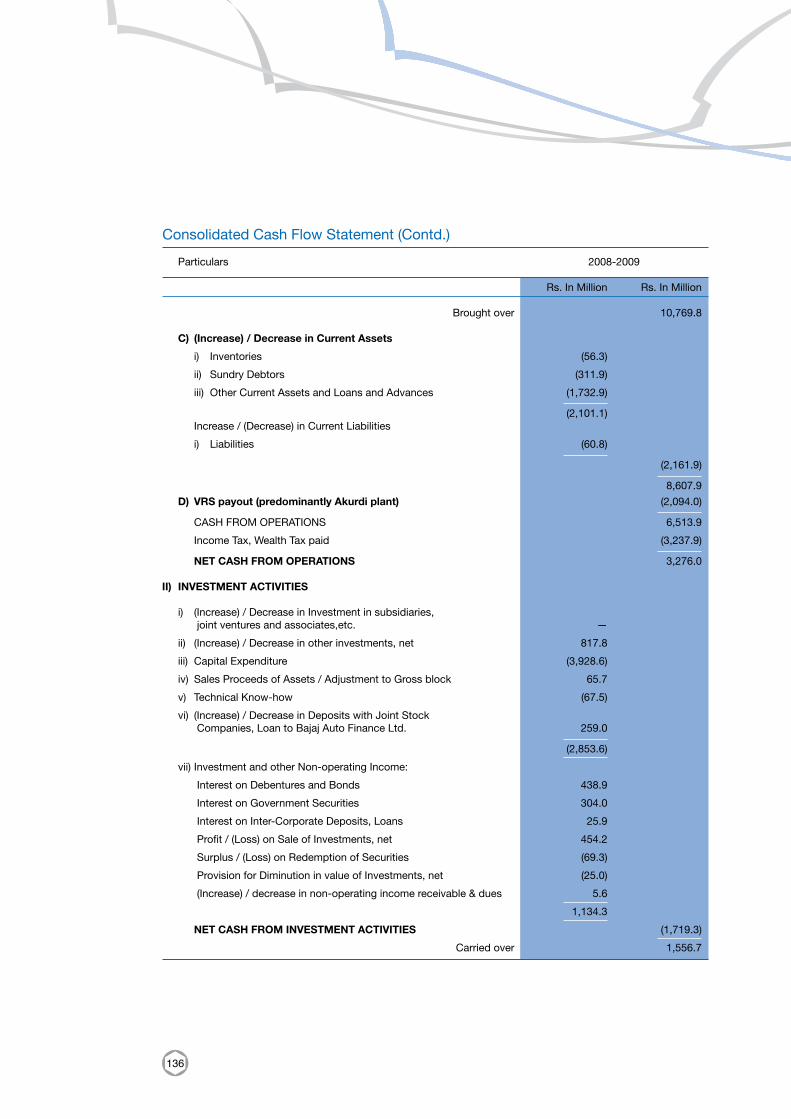
136
Brought over 10,769.8
C) (Increase) / Decrease in Current Assets
i) Inventories (56.3)
ii) Sundry Debtors (311.9)
iii) Other Current Assets and Loans and Advances (1,732.9) (2,101.1) Increase / (Decrease) in Current Liabilities
i) Liabilities (60.8) (2,161.9) 8,607.9
D) VRS payout (predominantly Akurdi plant) (2,094.0) CASH FROM OPERATIONS 6,513.9
Income Tax, Wealth Tax paid (3,237.9) NET CASH FROM OPERATIONS 3,276.0
II) INVESTMENT ACTIVITIES
i) (Increase) / Decrease in Investment in subsidiaries, joint ventures and associates,etc. —
ii) (Increase) / Decrease in other investments, net 817.8
iii) Capital Expenditure (3,928.6)
iv) Sales Proceeds of Assets / Adjustment to Gross block 65.7
v) Technical Know-how (67.5)
vi) (Increase) / Decrease in Deposits with Joint Stock Companies, Loan to Bajaj Auto Finance Ltd. 259.0 (2,853.6) vii) Investment and other Non-operating Income:
Interest on Debentures and Bonds 438.9
Interest on Government Securities 304.0
Interest on Inter-Corporate Deposits, Loans 25.9
Profit / (Loss) on Sale of Investments, net 454.2
Surplus / (Loss) on Redemption of Securities (69.3)
Provision for Diminution in value of Investments, net (25.0)
(Increase) / decrease in non-operating income receivable & dues 5.6 1,134.3 NET CASH FROM INVESTMENT ACTIVITIES (1,719.3) Carried over 1,556.7
Consolidated Cash Flow Statement (Contd.)
Particulars 2008-2009
Rs. In Million Rs. In Million
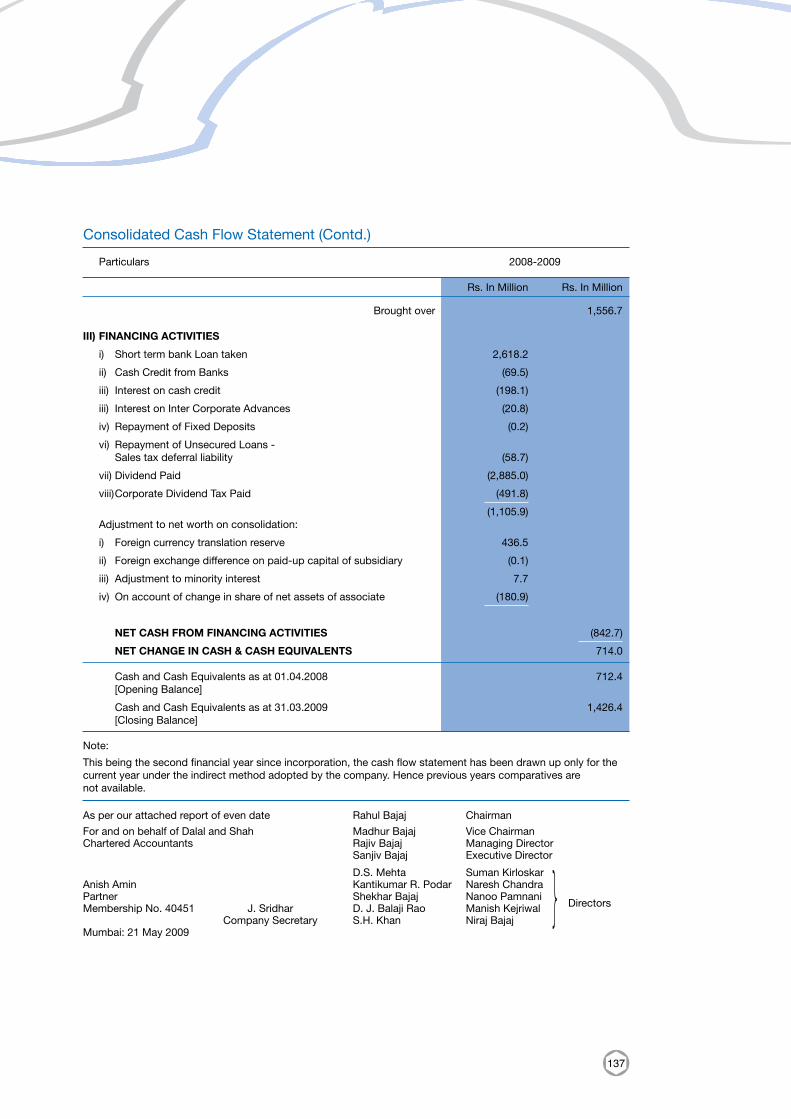
137
Brought over 1,556.7
III) FINANCING ACTIVITIES
i) Short term bank Loan taken 2,618.2
ii) Cash Credit from Banks (69.5)
iii) Interest on cash credit (198.1)
iii) Interest on Inter Corporate Advances (20.8)
iv) Repayment of Fixed Deposits (0.2)
vi) Repayment of Unsecured Loans - Sales tax deferral liability (58.7)
vii) Dividend Paid (2,885.0)
viii) Corporate Dividend Tax Paid (491.8) (1,105.9) Adjustment to net worth on consolidation:
i) Foreign currency translation reserve 436.5
ii) Foreign exchange difference on paid-up capital of subsidiary (0.1)
iii) Adjustment to minority interest 7.7
iv) On account of change in share of net assets of associate (180.9)
NET CASH FROM FINANCING ACTIVITIES (842.7) NET CHANGE IN CASH & CASH EQUIVALENTS 714.0
Cash and Cash Equivalents as at 01.04.2008 712.4 [Opening Balance]
Cash and Cash Equivalents as at 31.03.2009 1,426.4 [Closing Balance]
Note:
This being the second financial year since incorporation, the cash flow statement has been drawn up only for the current year under the indirect method adopted by the company. Hence previous years comparatives are not available.
Consolidated Cash Flow Statement (Contd.)
Particulars 2008-2009
Rs. In Million Rs. In Million
As per our attached report of even date Rahul Bajaj Chairman
For and on behalf of Dalal and Shah Madhur Bajaj Vice ChairmanChartered Accountants Rajiv Bajaj Managing Director Sanjiv Bajaj Executive Director
D.S. Mehta Suman KirloskarAnish Amin Kantikumar R. Podar Naresh ChandraPartner Shekhar Bajaj Nanoo Pamnani Membership No. 40451 J. Sridhar D. J. Balaji Rao Manish Kejriwal Directors
Company Secretary S.H. Khan Niraj BajajMumbai: 21 May 2009
}

138
Financial information of Subsidiaries for the year ended March 31, 2009
(Rs. In Million)
Particulars PT. Bajaj Auto Bajaj Auto Indonesia International Holdings BV. (a) Paid -Up Share Capital 512.4 13.5 (b) Share Premium — 8,038.8 Other reserves (821.0) 22.8 (c) Total Assets 901.4 8,075.1 (d) Total Liabilities 901.4 8,075.1 (e) Investments* — 8,067.1 (f) Turnover / Operating result 1,054.4 0.6 (g) Profit Before Taxation (614.8) (14.6) (h) Provision for Taxation (127.3) — (i) Profit After Taxation (487.5) (14.6) (j) Proposed Dividend — — Closing exchange rates
1 Euro = Rs. 67.44 1 USD = Indonesian Rupiah 11575
1 USD = Rs. 50.72 * For details of investments refer schedule 7 of the consolidated financial statements

139
NOTES

140
NOTES
Recommended