Containing Medicaid Costs: Moving Toward
Medicaid Managed Care
April 20, 2012
Overview: Medicaid managed
care & state trends.
Successful examples of
expanding managed care to
"new" populations
Q & A
Today’s webinar will cover:
Neva Kaye
Managing Director of Health Systems Performance,
National Academy for State Health Policy
Allan I. Bergman
President and Chief Executive Officer,
High Impact Mission-Based Consulting & Training
Moderator:
Raul Burciaga
Director, New Mexico Legislative Council Service
Presenters
Medicaid Managed Care:
Trends and Transformations
Containing Medicaid Costs: Moving Toward Managed Care
April 20, 2012
Neva Kaye
Managing Director for Health System Performance
National Academy for State Health Policy
4
5
Primary Sources of Data
• Original research and literature review (www.nashp.org)
• Seven point-in-time surveys of state Medicaid managed care policies
– NASHP: 1990, 1994, 1996, 1998, 2000, 2002
– CMS: 2010 data
Widespread Use and Proven
Savings
6
7
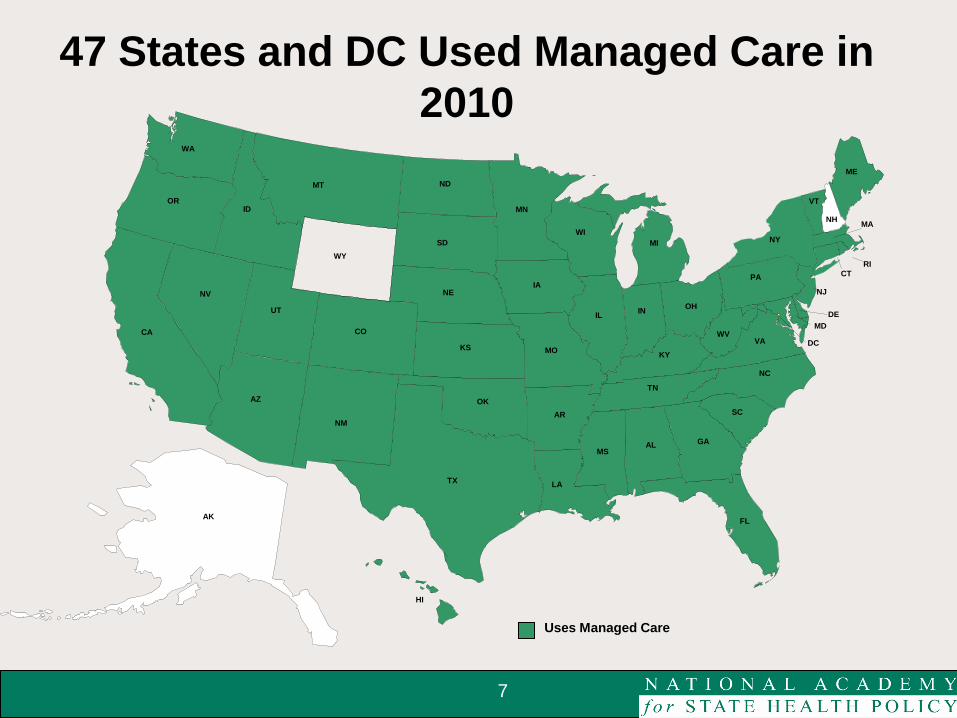
47 States and DC Used Managed Care in
2010
AK
NH MA
ME
NJ
CT
RI
DE
VT
NY
DC
MD
NC
PA
VA WV
FL
GA
SC
KY
IN OH
MI
TN
MS AL
MO
IL
IA
MN
WI
LA
AR
OK
TX
KS
NE
ND
SD
HI
MT
WY
UT
CO
AZ
NM
ID OR
WA
NV
CA
Uses Managed Care
8
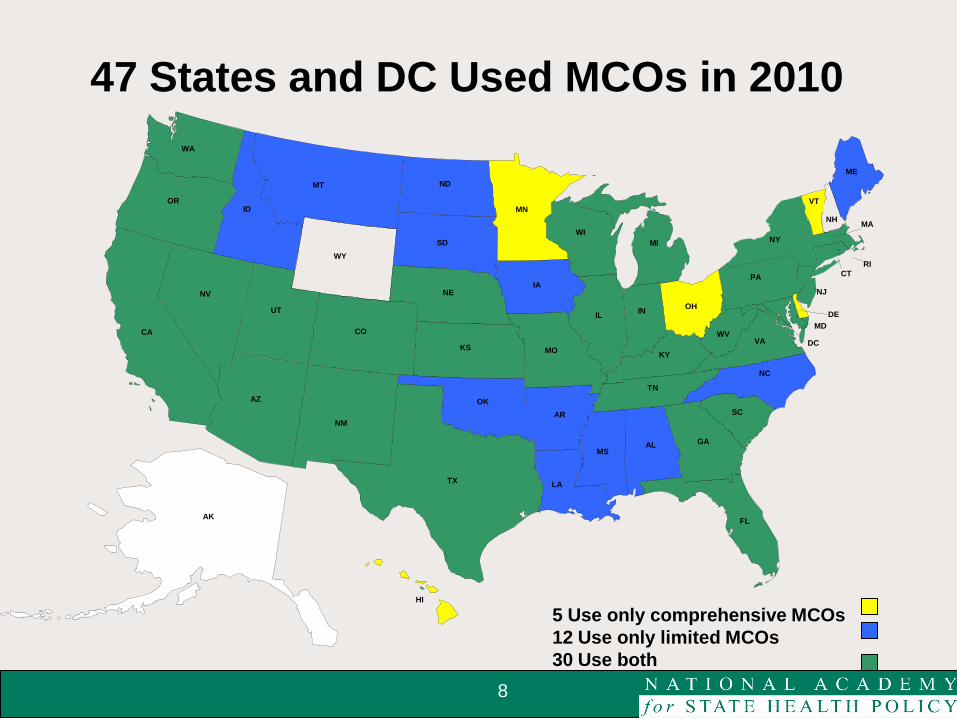
47 States and DC Used MCOs in 2010
AK
NH MA
ME
NJ
CT
RI
DE
VT
NY
DC
MD
NC
PA
VA WV
FL
GA
SC
KY
IN OH
MI
TN
MS AL
MO
IL
IA
MN
WI
LA
AR
OK
TX
KS
NE
ND
SD
HI
MT
WY
UT
CO
AZ
NM
ID OR
WA
NV
CA
5 Use only comprehensive MCOs
12 Use only limited MCOs
30 Use both
9
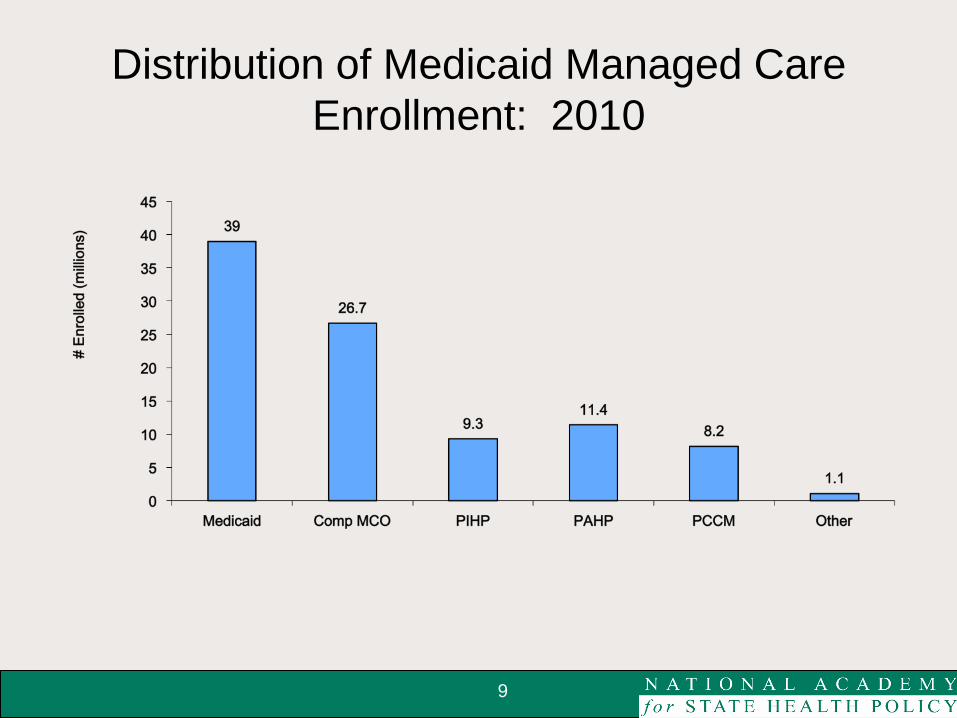
Distribution of Medicaid Managed Care
Enrollment: 2010
10
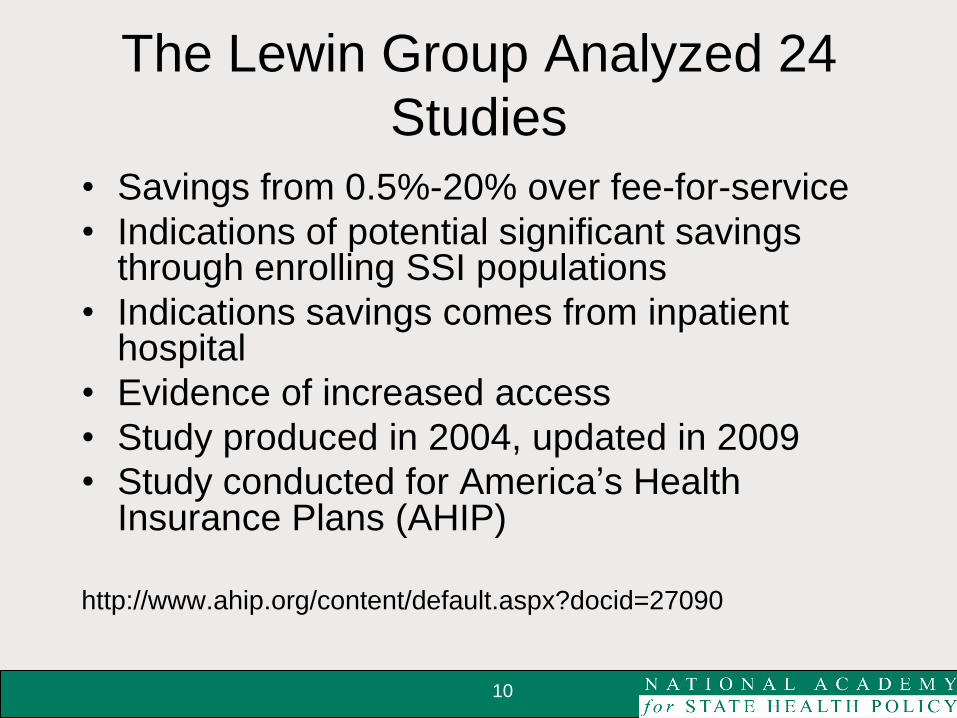
The Lewin Group Analyzed 24
Studies
• Savings from 0.5%-20% over fee-for-service
• Indications of potential significant savings through enrolling SSI populations
• Indications savings comes from inpatient hospital
• Evidence of increased access
• Study produced in 2004, updated in 2009
• Study conducted for America’s Health Insurance Plans (AHIP)
http://www.ahip.org/content/default.aspx?docid=27090
11
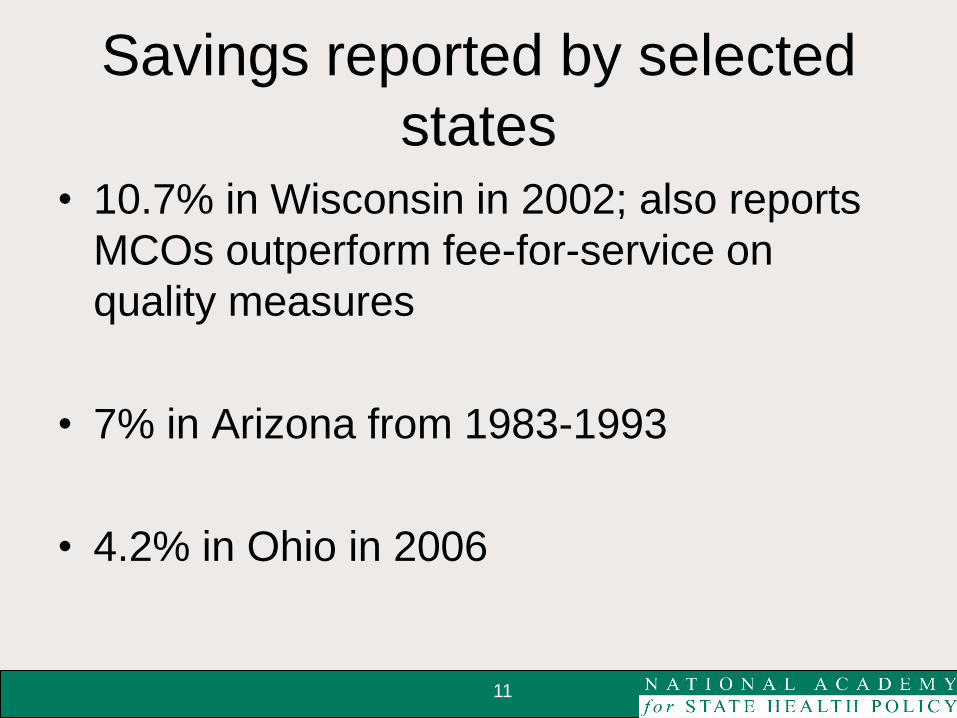
Savings reported by selected
states • 10.7% in Wisconsin in 2002; also reports
MCOs outperform fee-for-service on
quality measures
• 7% in Arizona from 1983-1993
• 4.2% in Ohio in 2006

On the Horizon
12
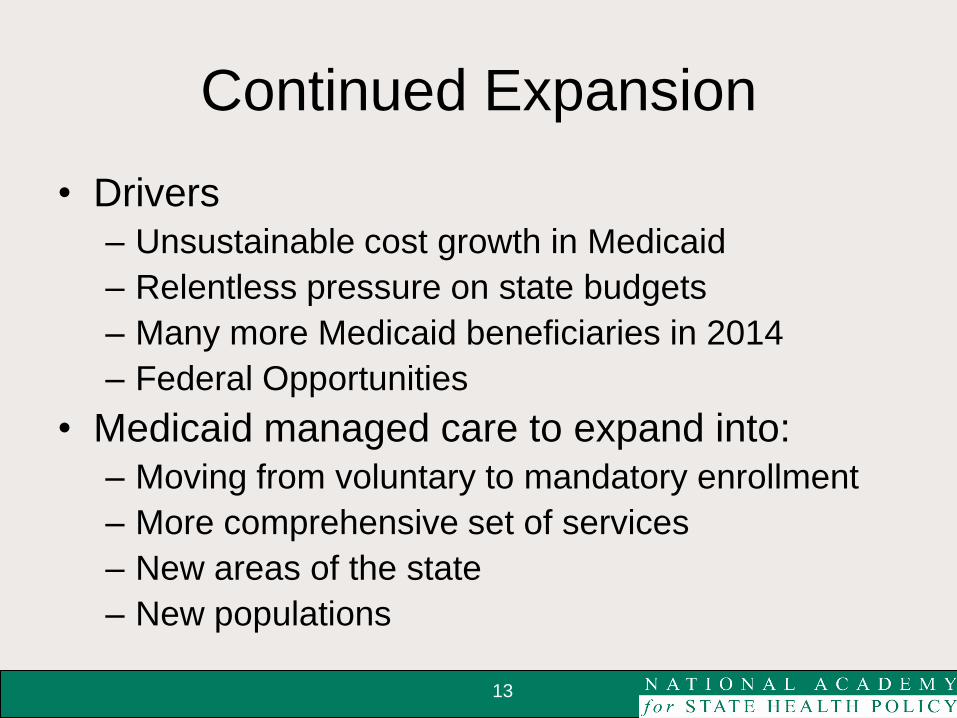
Continued Expansion
• Drivers
– Unsustainable cost growth in Medicaid
– Relentless pressure on state budgets
– Many more Medicaid beneficiaries in 2014
– Federal Opportunities
• Medicaid managed care to expand into:
– Moving from voluntary to mandatory enrollment
– More comprehensive set of services
– New areas of the state
– New populations
13
14
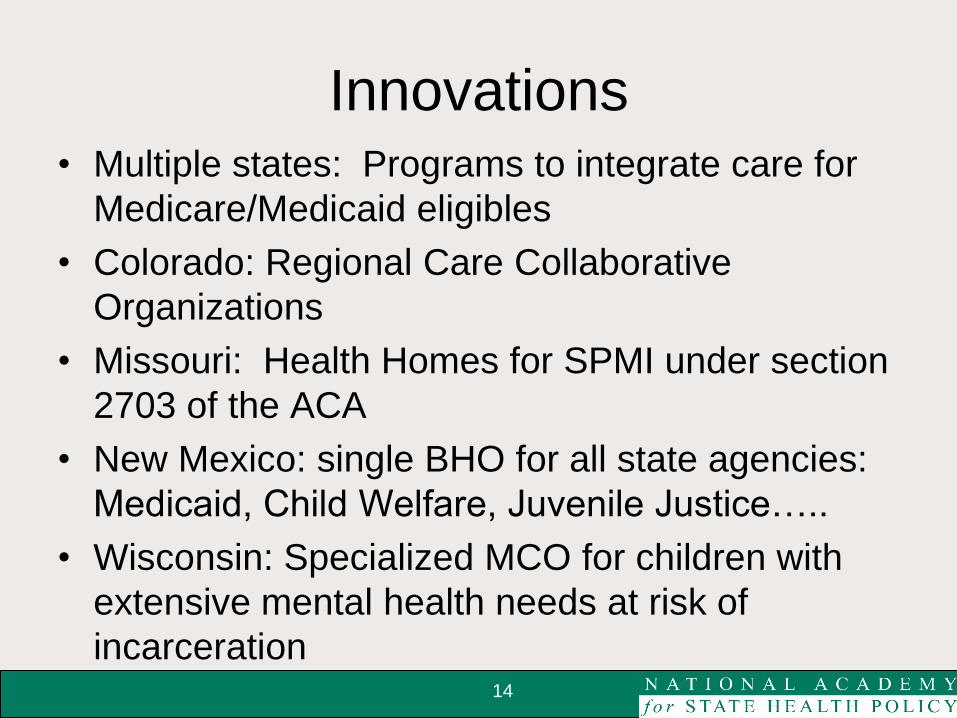
Innovations • Multiple states: Programs to integrate care for
Medicare/Medicaid eligibles
• Colorado: Regional Care Collaborative
Organizations
• Missouri: Health Homes for SPMI under section
2703 of the ACA
• New Mexico: single BHO for all state agencies:
Medicaid, Child Welfare, Juvenile Justice…..
• Wisconsin: Specialized MCO for children with
extensive mental health needs at risk of
incarceration
15
Success Factors
• Clear goals for the program
• Sufficient resources to build and oversee a
strong program
• Sufficient time for the program to produce
results

Welcome to the Complex
World of “Managed Care”,
Capitation & its permutations:
Is It The "Magic Bullet" for
Medicaid Cost Containment?
NCSL
Webinar
April 20, 2012 Allan I. Bergman
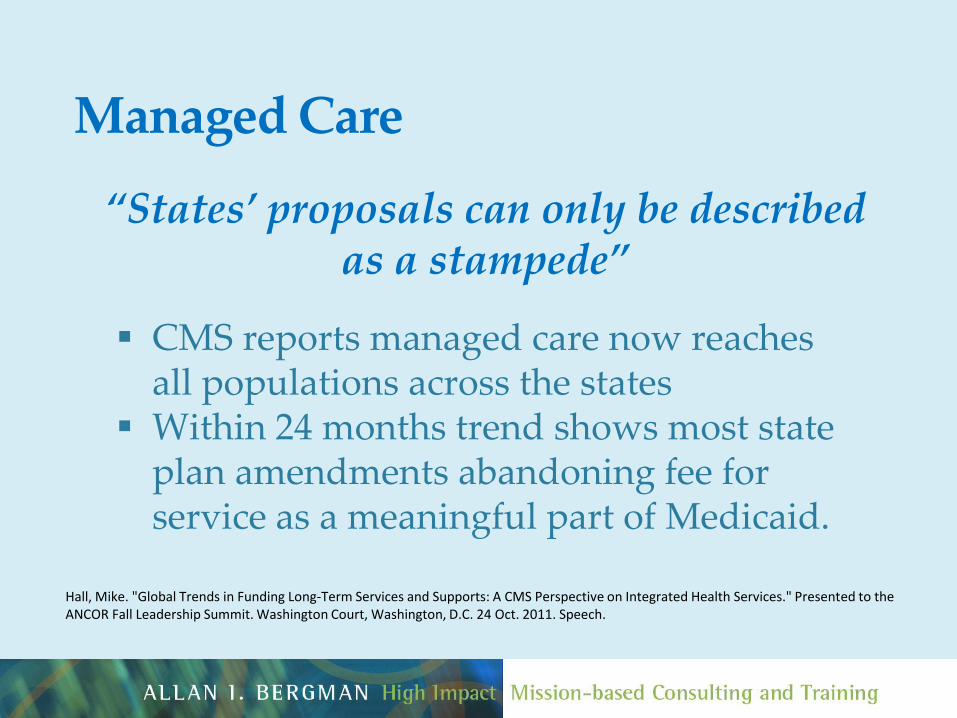
“States’ proposals can only be described as a stampede”
CMS reports managed care now reaches all populations across the states
Within 24 months trend shows most state plan amendments abandoning fee for service as a meaningful part of Medicaid.
Hall, Mike. "Global Trends in Funding Long-Term Services and Supports: A CMS Perspective on Integrated Health Services." Presented to the ANCOR Fall Leadership Summit. Washington Court, Washington, D.C. 24 Oct. 2011. Speech.
Managed Care
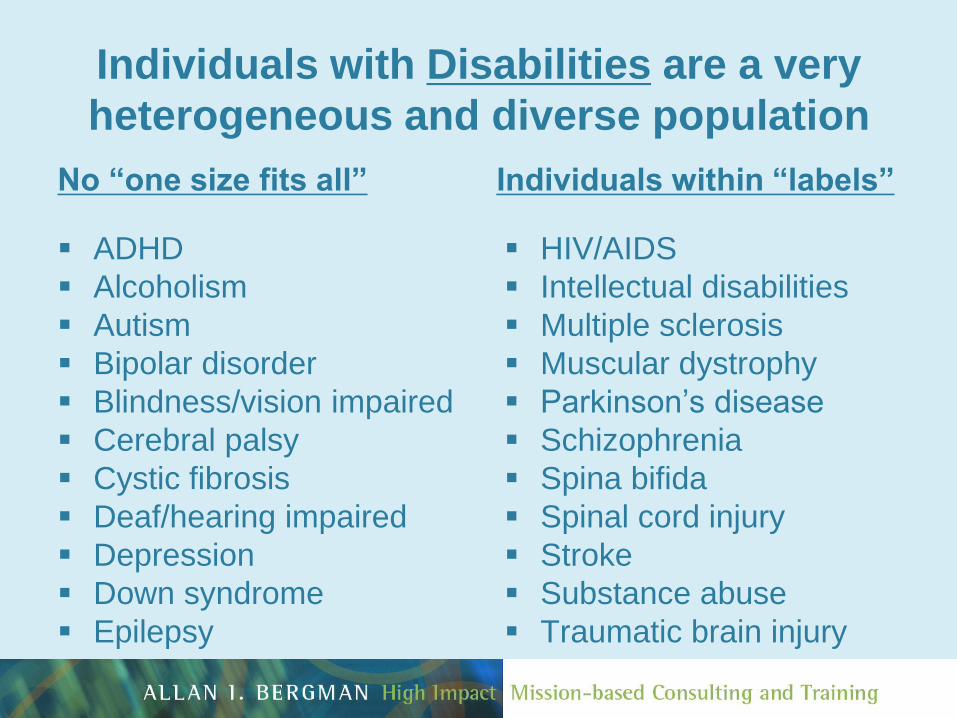
Individuals with Disabilities are a very
heterogeneous and diverse population
No “one size fits all”
ADHD
Alcoholism
Autism
Bipolar disorder
Blindness/vision impaired
Cerebral palsy
Cystic fibrosis
Deaf/hearing impaired
Depression
Down syndrome
Epilepsy
Individuals within “labels”
HIV/AIDS
Intellectual disabilities
Multiple sclerosis
Muscular dystrophy
Parkinson’s disease
Schizophrenia
Spina bifida
Spinal cord injury
Stroke
Substance abuse
Traumatic brain injury
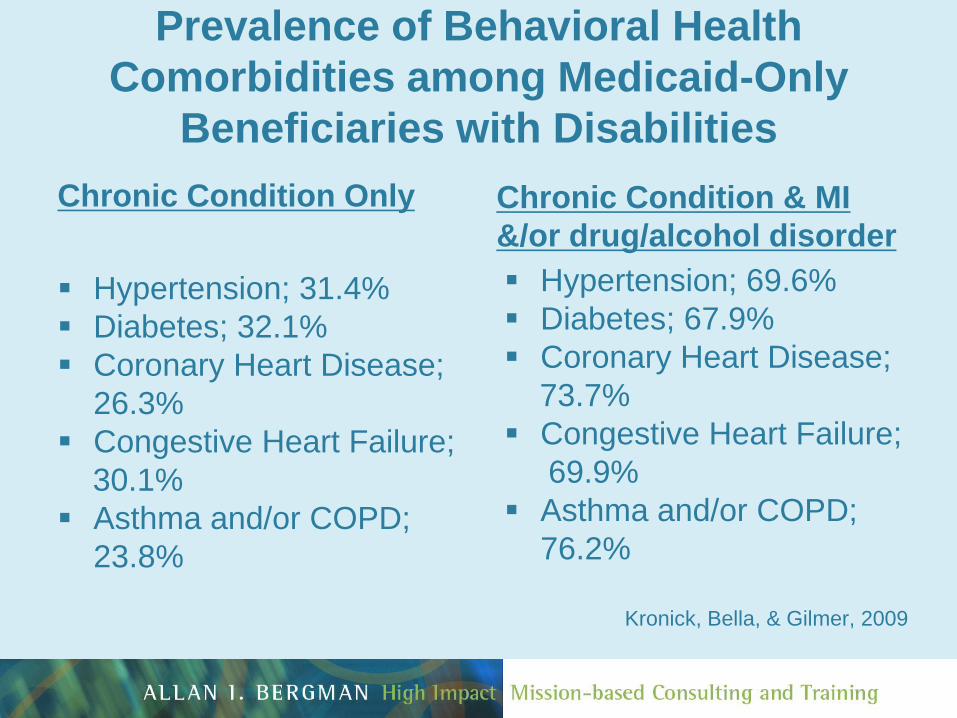
Prevalence of Behavioral Health
Comorbidities among Medicaid-Only
Beneficiaries with Disabilities
Chronic Condition Only
Hypertension; 31.4%
Diabetes; 32.1%
Coronary Heart Disease;
26.3%
Congestive Heart Failure;
30.1%
Asthma and/or COPD;
23.8%
Chronic Condition & MI
&/or drug/alcohol disorder
Hypertension; 69.6%
Diabetes; 67.9%
Coronary Heart Disease;
73.7%
Congestive Heart Failure;
69.9%
Asthma and/or COPD;
76.2%
Kronick, Bella, & Gilmer, 2009
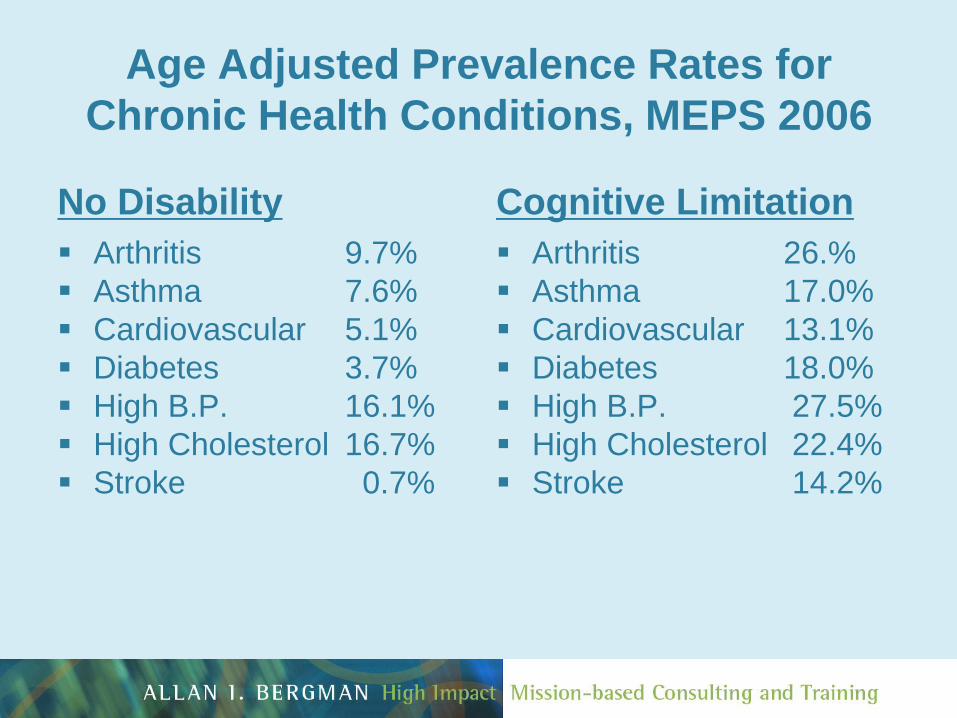
Age Adjusted Prevalence Rates for
Chronic Health Conditions, MEPS 2006
No Disability
Arthritis 9.7%
Asthma 7.6%
Cardiovascular 5.1%
Diabetes 3.7%
High B.P. 16.1%
High Cholesterol 16.7%
Stroke 0.7%
Cognitive Limitation
Arthritis 26.%
Asthma 17.0%
Cardiovascular 13.1%
Diabetes 18.0%
High B.P. 27.5%
High Cholesterol 22.4%
Stroke 14.2%
Summary Guidance on Medicaid
Managed Health Care for Individuals with
Disabilities
“The potential for savings lies in more
appropriate patterns of care over time,
especially reduced hospital use, which
may result from better prescription drug
management and advanced clinical
management and care coordination for
people with disabilities.” Kaiser Commission & the Uninsured, February 2012
People with Disabilities and Medicaid Managed Care
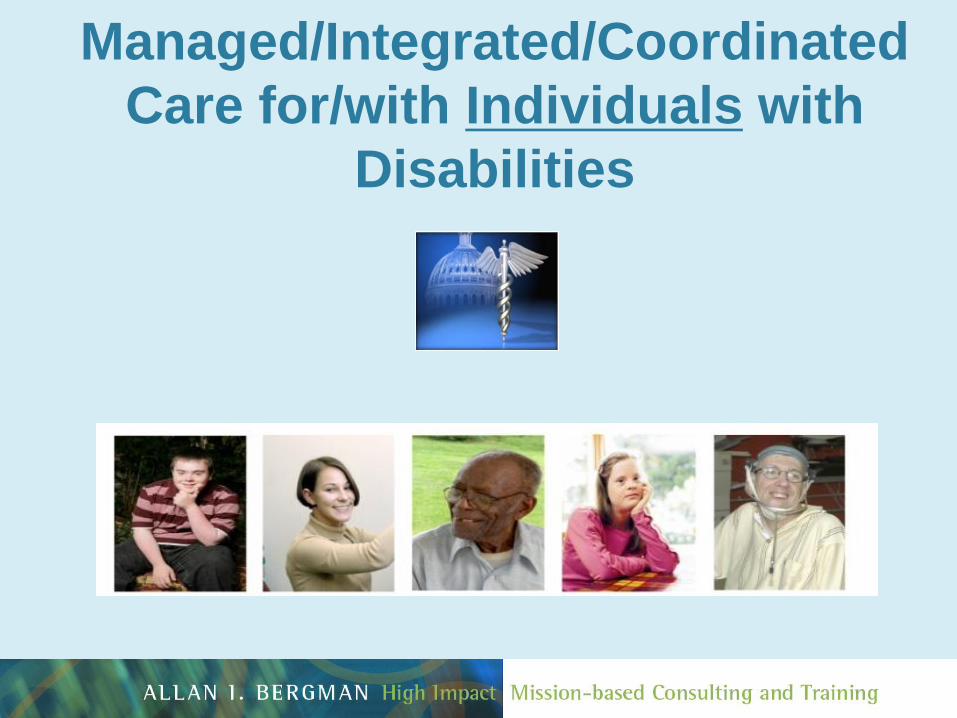
Managed/Integrated/Coordinated
Care for/with Individuals with
Disabilities
23
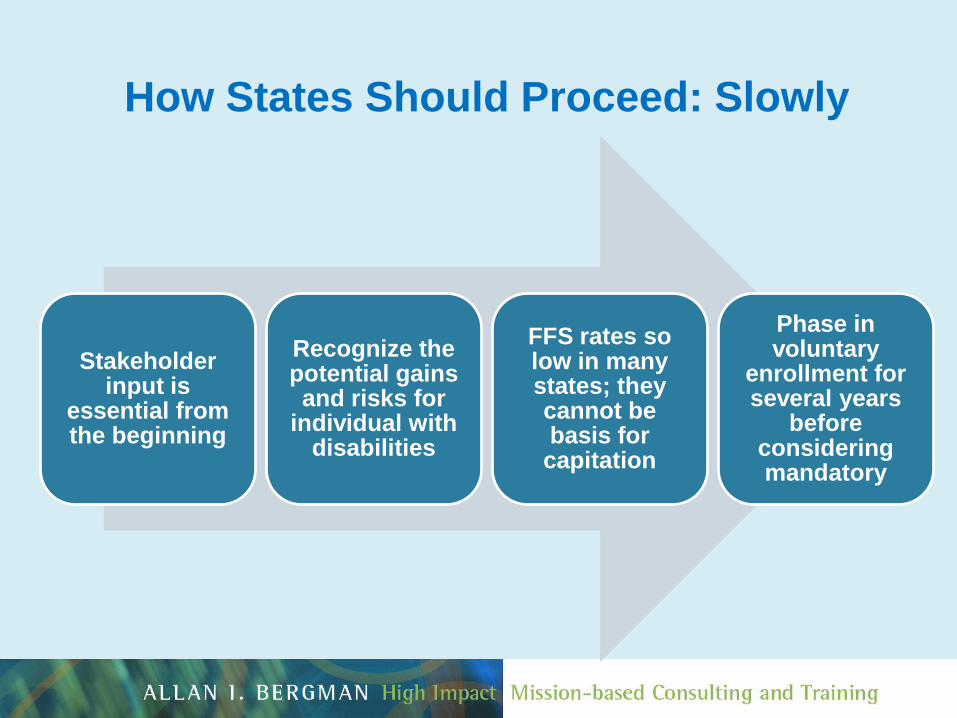
How States Should Proceed: Slowly
Stakeholder input is
essential from the beginning
Recognize the potential gains and risks for
individual with disabilities
FFS rates so low in many states; they cannot be basis for
capitation
Phase in voluntary
enrollment for several years
before considering mandatory
24
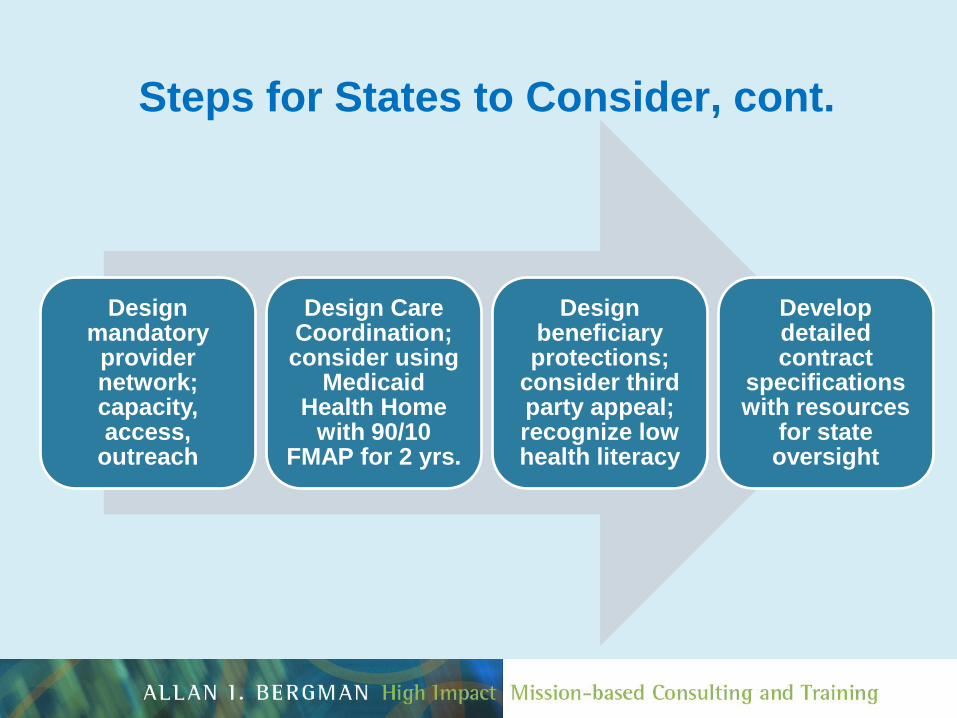
Steps for States to Consider, cont.
Design mandatory
provider network; capacity, access,
outreach
Design Care Coordination; consider using
Medicaid Health Home
with 90/10 FMAP for 2 yrs.
Design beneficiary protections;
consider third party appeal; recognize low health literacy
Develop detailed contract
specifications with resources
for state oversight
Purpose of Medicaid, Title XIX of the
Social Security Act:
The Foundation for LTSS
“…(2) rehabilitation and other services to
help such families and individuals attain or
retain capability for independence or self
care.”
42 U.S.C. Sec. 1396
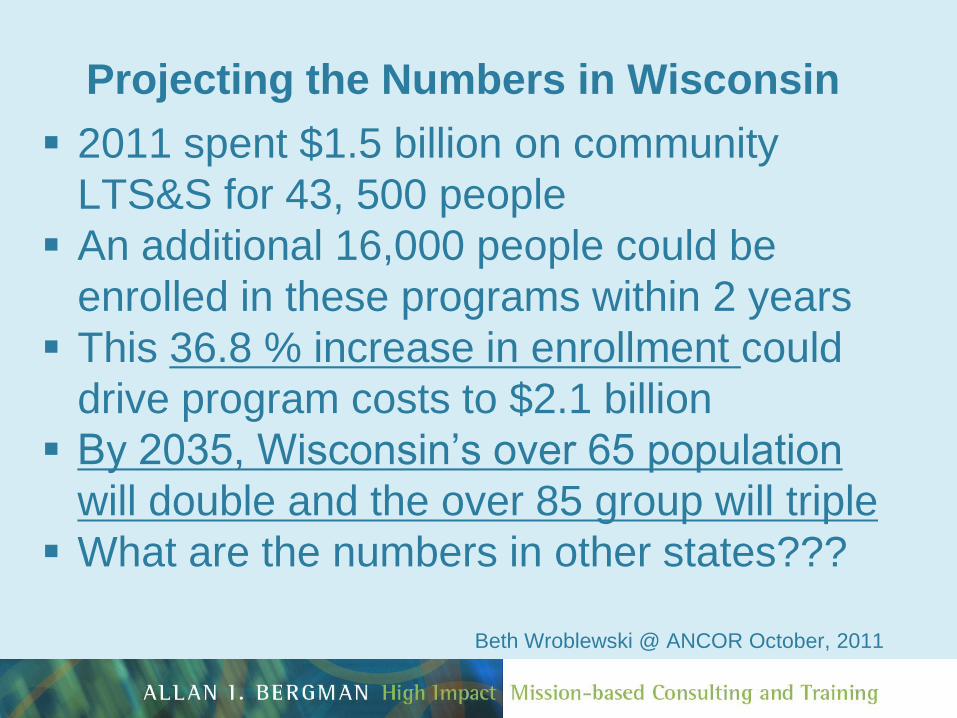
Projecting the Numbers in Wisconsin
2011 spent $1.5 billion on community
LTS&S for 43, 500 people
An additional 16,000 people could be
enrolled in these programs within 2 years
This 36.8 % increase in enrollment could
drive program costs to $2.1 billion
By 2035, Wisconsin’s over 65 population
will double and the over 85 group will triple
What are the numbers in other states???
Beth Wroblewski @ ANCOR October, 2011
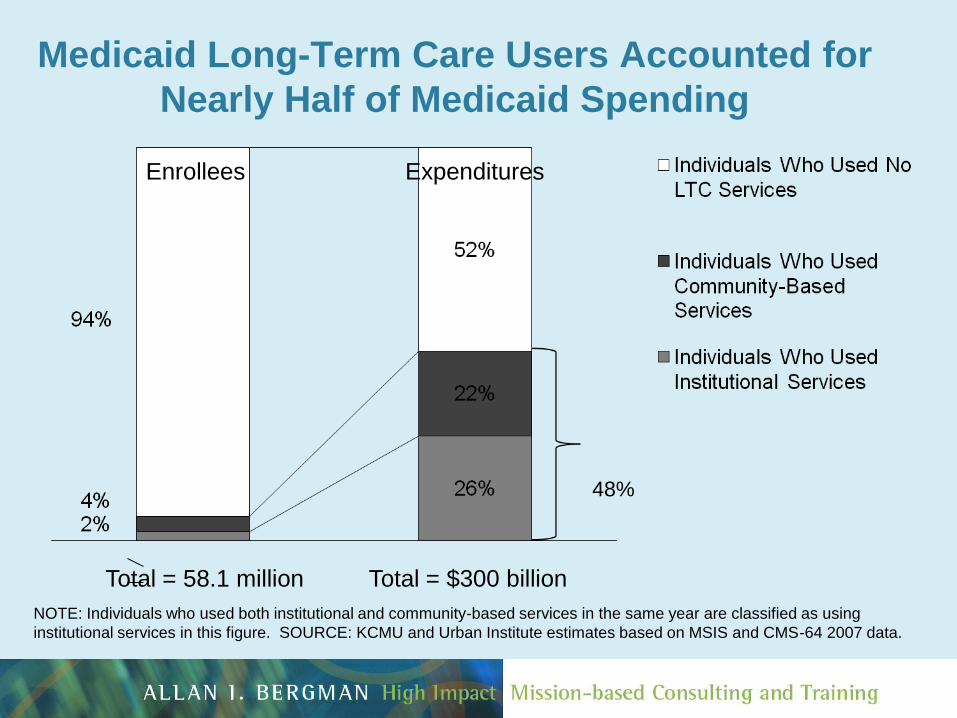
Medicaid Long-Term Care Users Accounted for
Nearly Half of Medicaid Spending
NOTE: Individuals who used both institutional and community-based services in the same year are classified as using
institutional services in this figure. SOURCE: KCMU and Urban Institute estimates based on MSIS and CMS-64 2007 data.
Total = 58.1 million Total = $300 billion
Enrollees Expenditures
48%

Distribution of Medicaid Elderly
by Long-Term Care Use
Total = 5.9 million Total = $74.2 billion
Enrollees Expenditures
87%
NOTE: Individuals who used both institutional and community-based services in the same year are classified as using
institutional services in this figure. SOURCE: KCMU and Urban Institute estimates based on MSIS and CMS-64 2007 data.
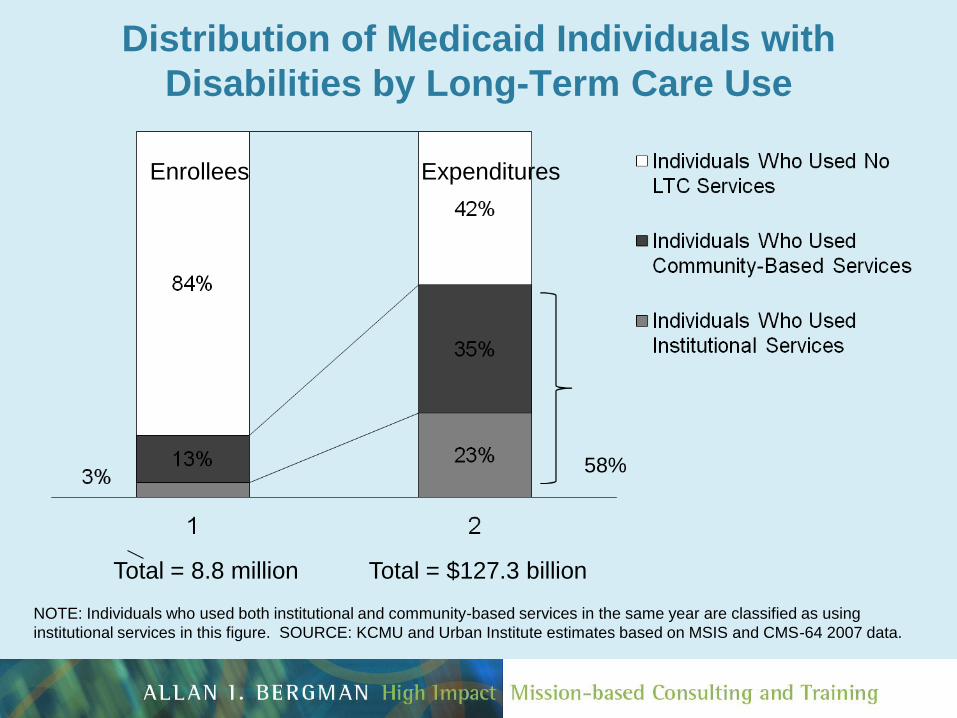
Distribution of Medicaid Individuals with
Disabilities by Long-Term Care Use
Total = 8.8 million Total = $127.3 billion
Enrollees Expenditures
58%
NOTE: Individuals who used both institutional and community-based services in the same year are classified as using
institutional services in this figure. SOURCE: KCMU and Urban Institute estimates based on MSIS and CMS-64 2007 data.
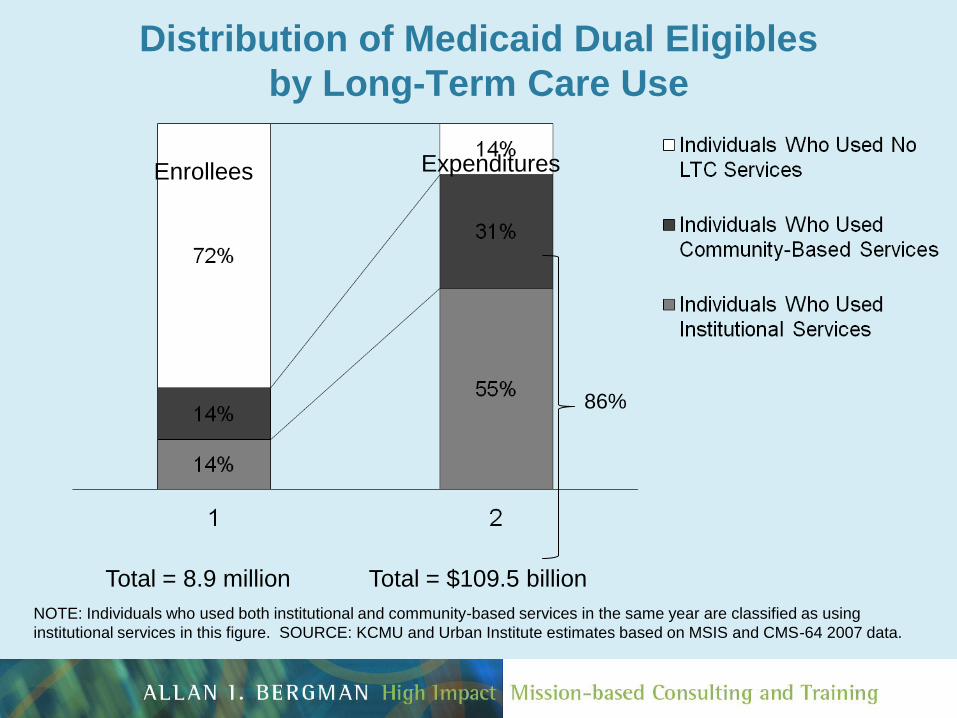
Distribution of Medicaid Dual Eligibles
by Long-Term Care Use
Total = 8.9 million Total = $109.5 billion
Enrollees Expenditures
86%
NOTE: Individuals who used both institutional and community-based services in the same year are classified as using
institutional services in this figure. SOURCE: KCMU and Urban Institute estimates based on MSIS and CMS-64 2007 data.
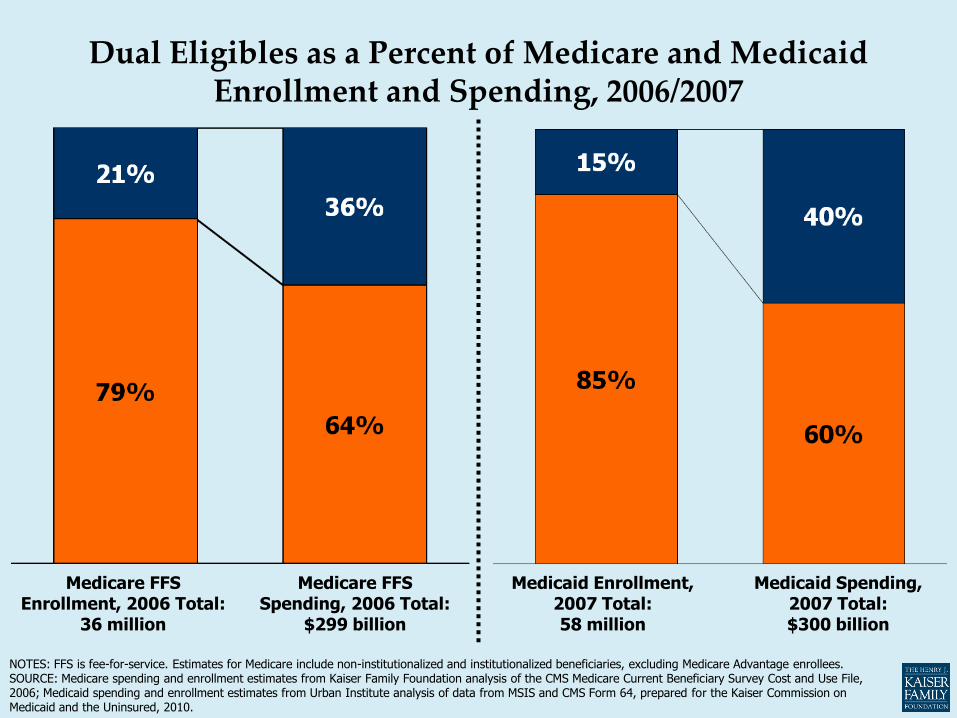
Dual Eligibles as a Percent of Medicare and Medicaid Enrollment and Spending, 2006/2007
NOTES: FFS is fee-for-service. Estimates for Medicare include non-institutionalized and institutionalized beneficiaries, excluding Medicare Advantage enrollees. SOURCE: Medicare spending and enrollment estimates from Kaiser Family Foundation analysis of the CMS Medicare Current Beneficiary Survey Cost and Use File, 2006; Medicaid spending and enrollment estimates from Urban Institute analysis of data from MSIS and CMS Form 64, prepared for the Kaiser Commission on Medicaid and the Uninsured, 2010.
Medicare FFS Enrollment, 2006 Total:
36 million
Medicare FFS Spending, 2006 Total:
$299 billion
Medicaid Enrollment, 2007 Total: 58 million
Medicaid Spending, 2007 Total: $300 billion
The “Dual Eligible Market”
“Dual patients are seen as a potential
$300 Billion opportunity for Managed
Care firms.”
Wall Street Journal
Market Watch
April 9, 2012
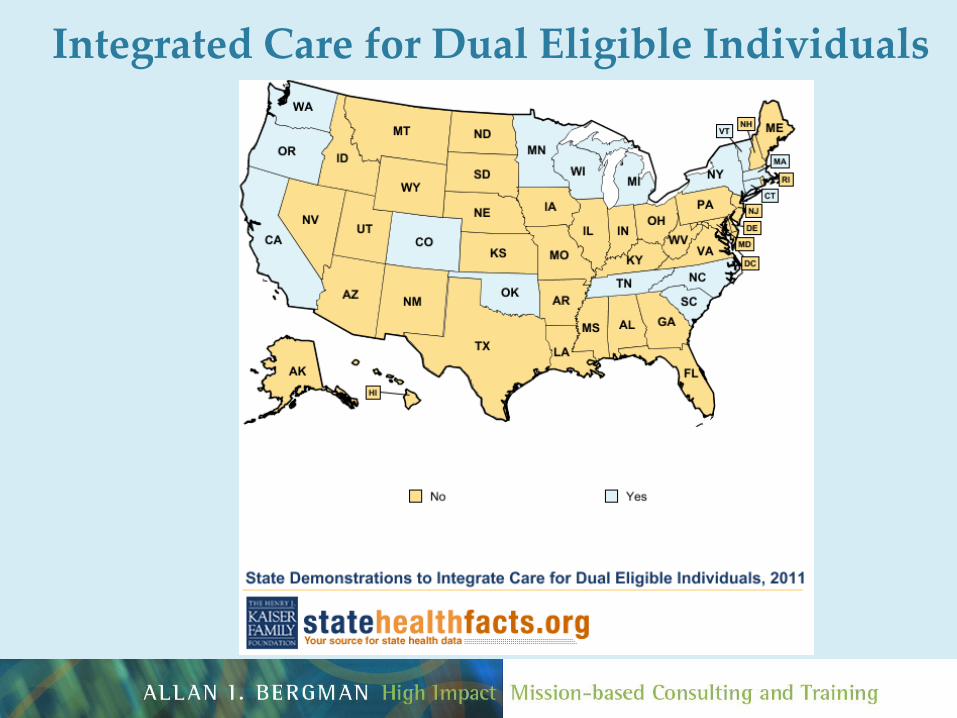
Integrated Care for Dual Eligible Individuals
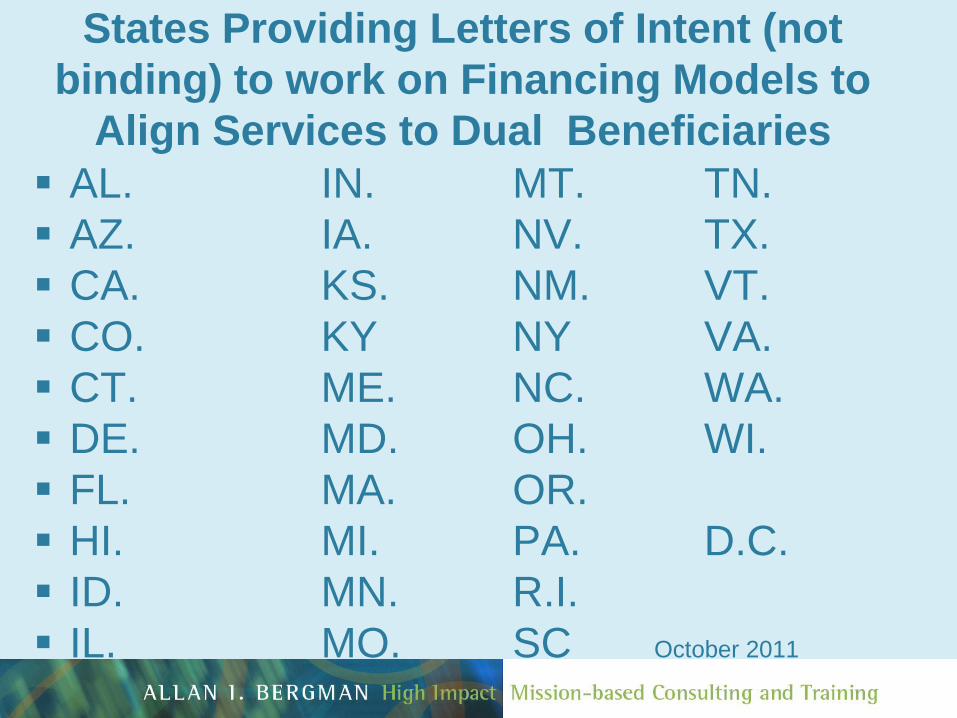
States Providing Letters of Intent (not
binding) to work on Financing Models to
Align Services to Dual Beneficiaries
AL. IN. MT. TN.
AZ. IA. NV. TX.
CA. KS. NM. VT.
CO. KY NY VA.
CT. ME. NC. WA.
DE. MD. OH. WI.
FL. MA. OR.
HI. MI. PA. D.C.
ID. MN. R.I.
IL. MO. SC October 2011
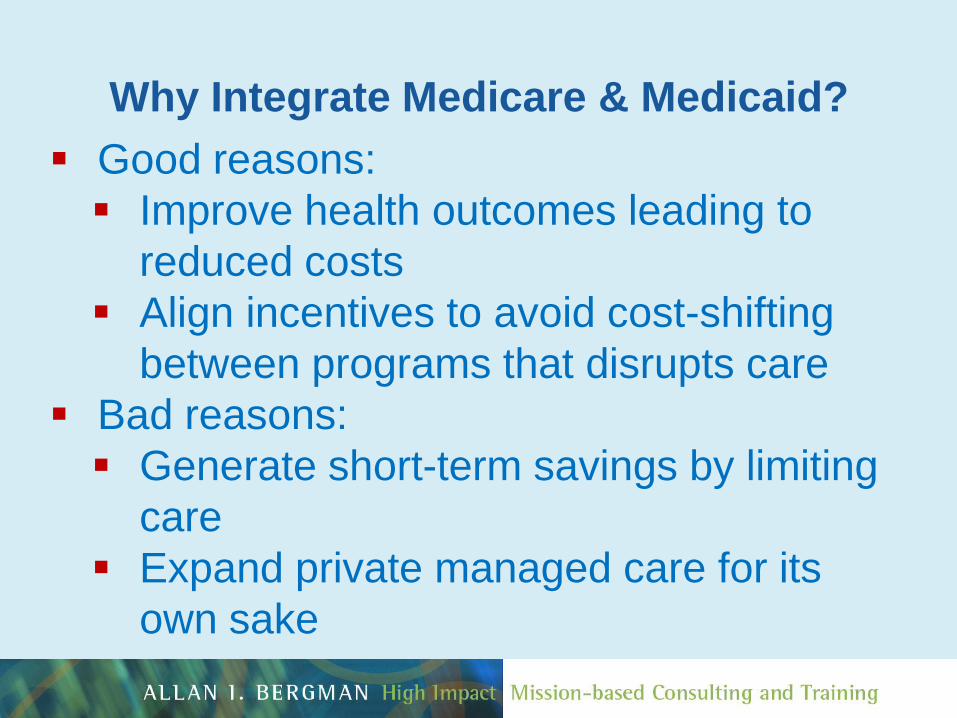
Why Integrate Medicare & Medicaid?
Good reasons:
Improve health outcomes leading to
reduced costs
Align incentives to avoid cost-shifting
between programs that disrupts care
Bad reasons:
Generate short-term savings by limiting
care
Expand private managed care for its
own sake
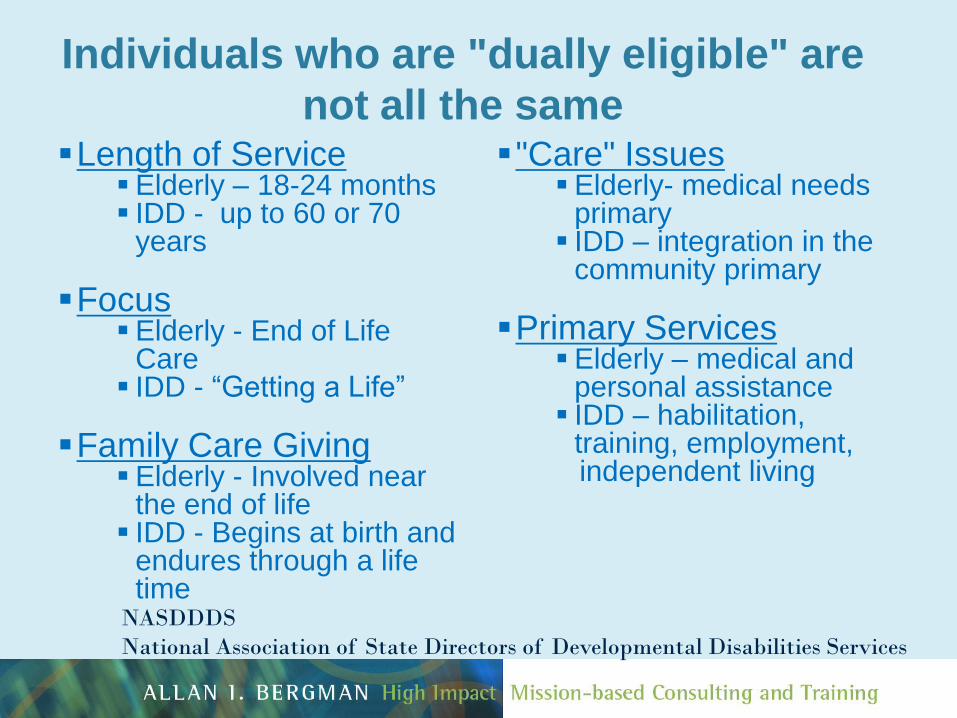
Individuals who are "dually eligible" are
not all the same Length of Service
Elderly – 18-24 months IDD - up to 60 or 70
years
Focus Elderly - End of Life
Care IDD - “Getting a Life”
Family Care Giving
Elderly - Involved near the end of life IDD - Begins at birth and
endures through a life time
"Care" Issues Elderly- medical needs
primary IDD – integration in the
community primary
Primary Services Elderly – medical and
personal assistance IDD – habilitation,
training, employment, independent living
NASDDDS
National Association of State Directors of Developmental Disabilities Services
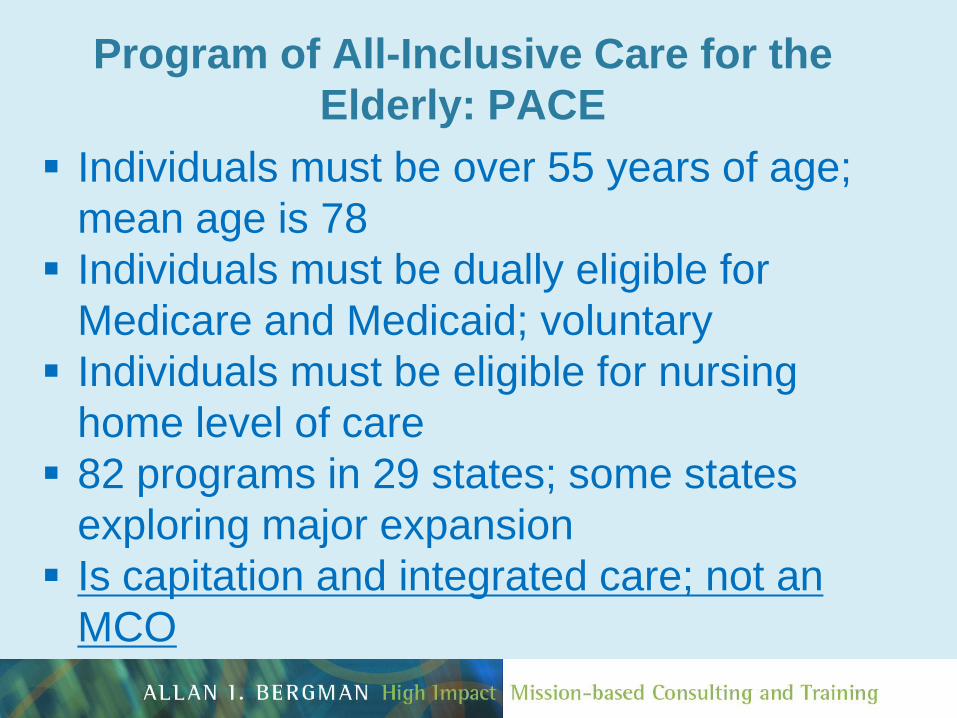
Program of All-Inclusive Care for the
Elderly: PACE
Individuals must be over 55 years of age;
mean age is 78
Individuals must be dually eligible for
Medicare and Medicaid; voluntary
Individuals must be eligible for nursing
home level of care
82 programs in 29 states; some states
exploring major expansion
Is capitation and integrated care; not an
MCO
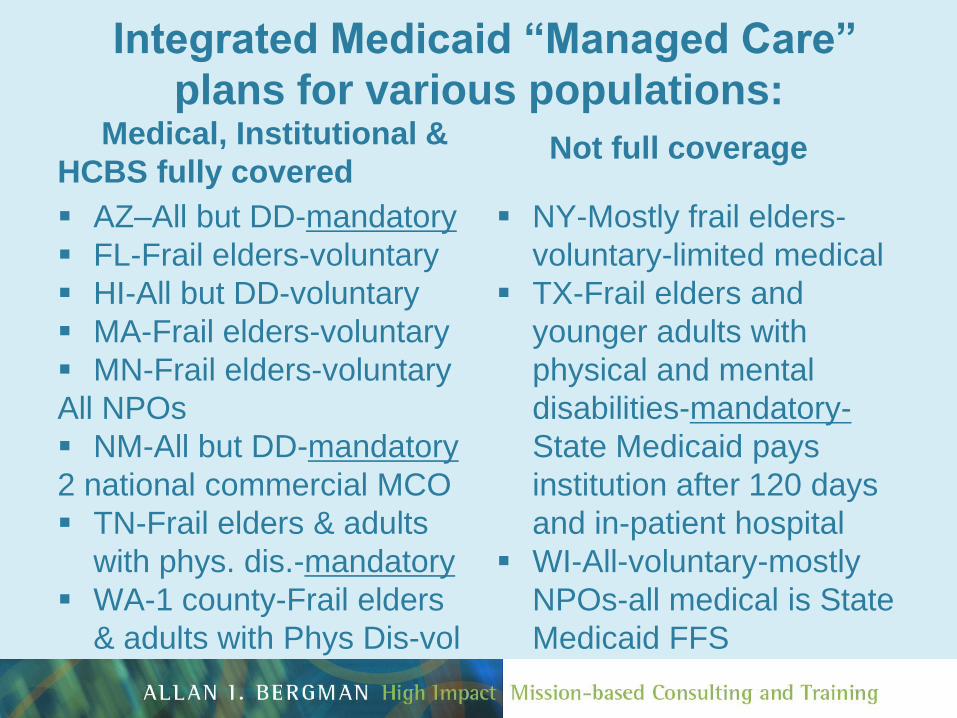
Integrated Medicaid “Managed Care”
plans for various populations:
Medical, Institutional &
HCBS fully covered
AZ–All but DD-mandatory
FL-Frail elders-voluntary
HI-All but DD-voluntary
MA-Frail elders-voluntary
MN-Frail elders-voluntary
All NPOs
NM-All but DD-mandatory
2 national commercial MCO
TN-Frail elders & adults
with phys. dis.-mandatory
WA-1 county-Frail elders
& adults with Phys Dis-vol
Not full coverage
NY-Mostly frail elders-
voluntary-limited medical
TX-Frail elders and
younger adults with
physical and mental
disabilities-mandatory-
State Medicaid pays
institution after 120 days
and in-patient hospital
WI-All-voluntary-mostly
NPOs-all medical is State
Medicaid FFS
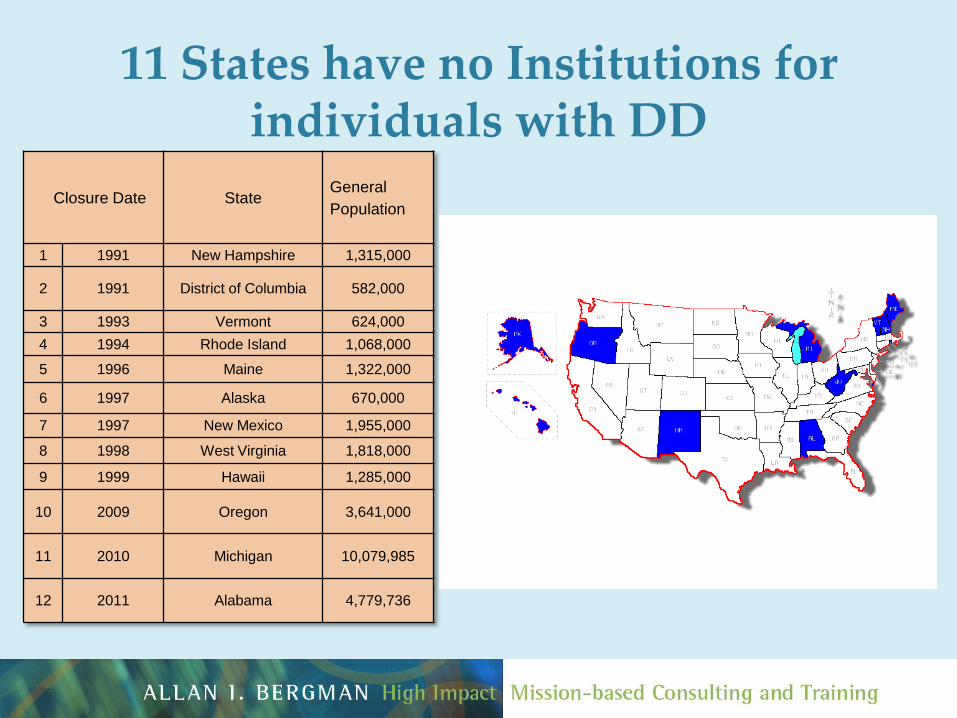
11 States have no Institutions for
individuals with DD
Closure Date State General
Population
1 1991 New Hampshire 1,315,000
2 1991 District of Columbia 582,000
3 1993 Vermont 624,000
4 1994 Rhode Island 1,068,000
5 1996 Maine 1,322,000
6 1997 Alaska 670,000
7 1997 New Mexico 1,955,000
8 1998 West Virginia 1,818,000
9 1999 Hawaii 1,285,000
10 2009 Oregon 3,641,000
11 2010 Michigan 10,079,985
12 2011 Alabama 4,779,736
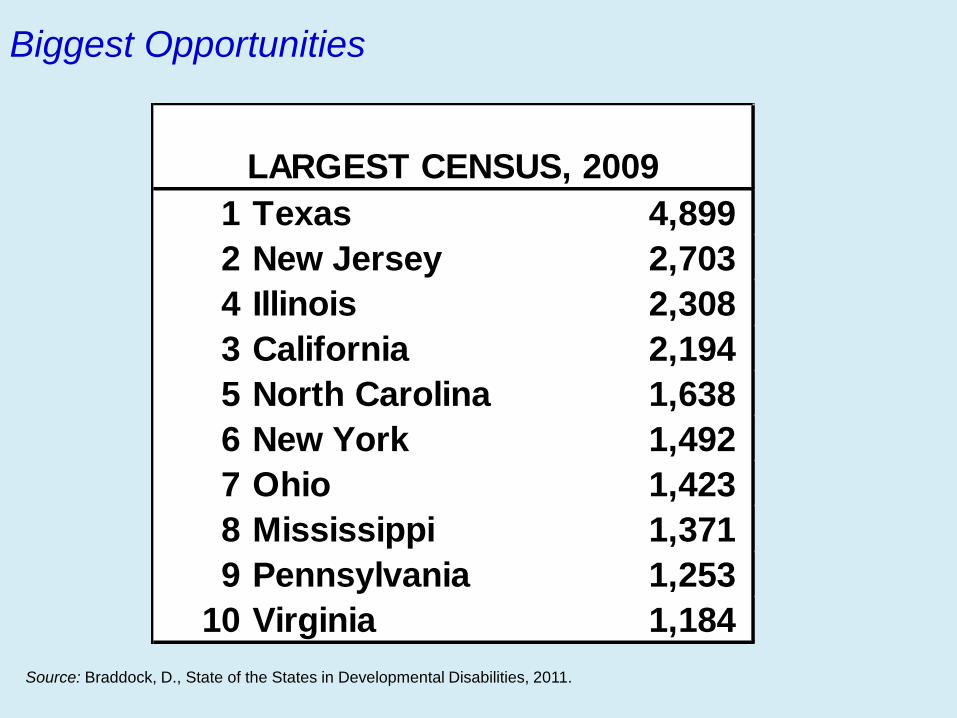
Biggest Opportunities
Source: Braddock, D., State of the States in Developmental Disabilities, 2011.
1 Texas 4,899
2 New Jersey 2,703
4 Illinois 2,308
3 California 2,194
5 North Carolina 1,638
6 New York 1,492
7 Ohio 1,423
8 Mississippi 1,371
9 Pennsylvania 1,253
10 Virginia 1,184
LARGEST CENSUS, 2009
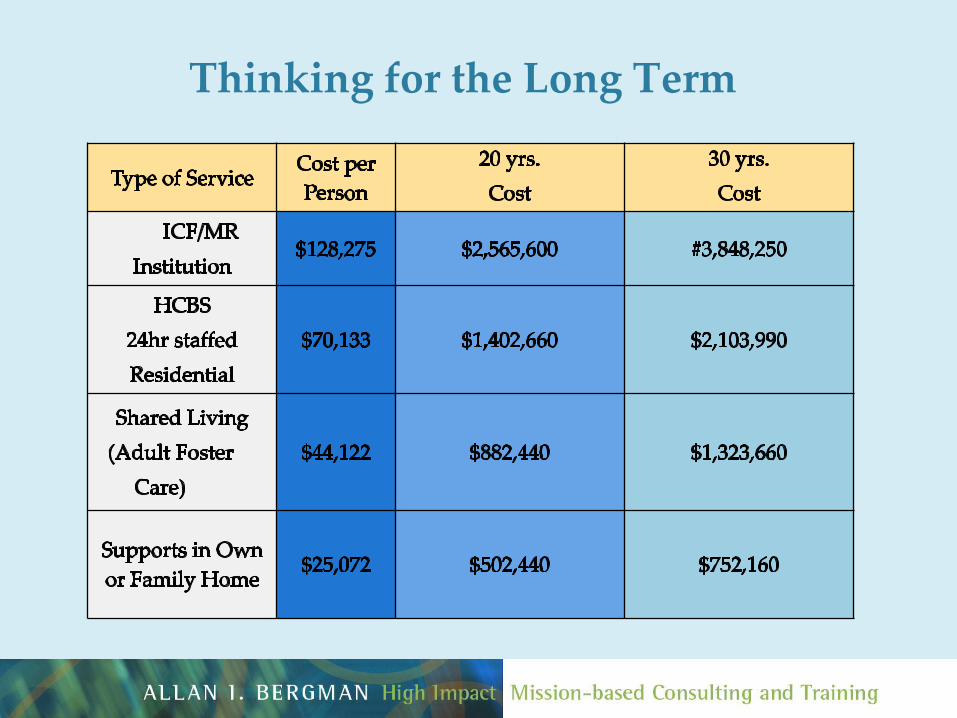
Thinking for the Long Term
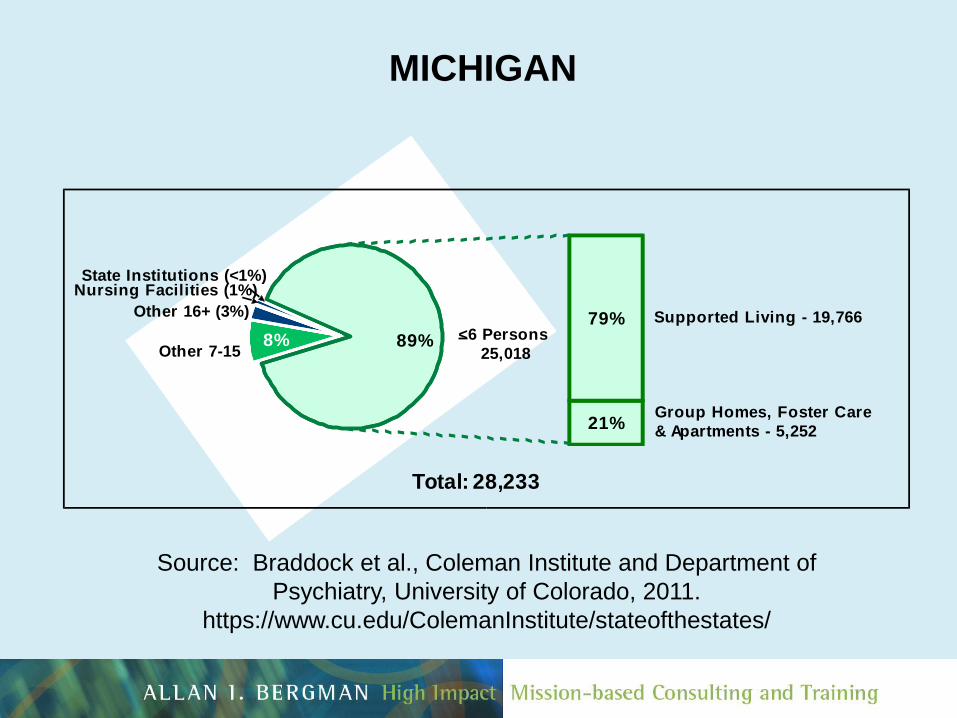
Source: Braddock et al., Coleman Institute and Department of
Psychiatry, University of Colorado, 2011.
https://www.cu.edu/ColemanInstitute/stateofthestates/
MICHIGAN
89%8%
21%
79%
Total: 28,233
<6 Persons
25,018
Group Homes, Foster Care
& Apartments - 5,252
Nursing Facilities (1%)State Institutions (<1%)
Supported Living - 19,766
Other 7-15
Other 16+ (3%)
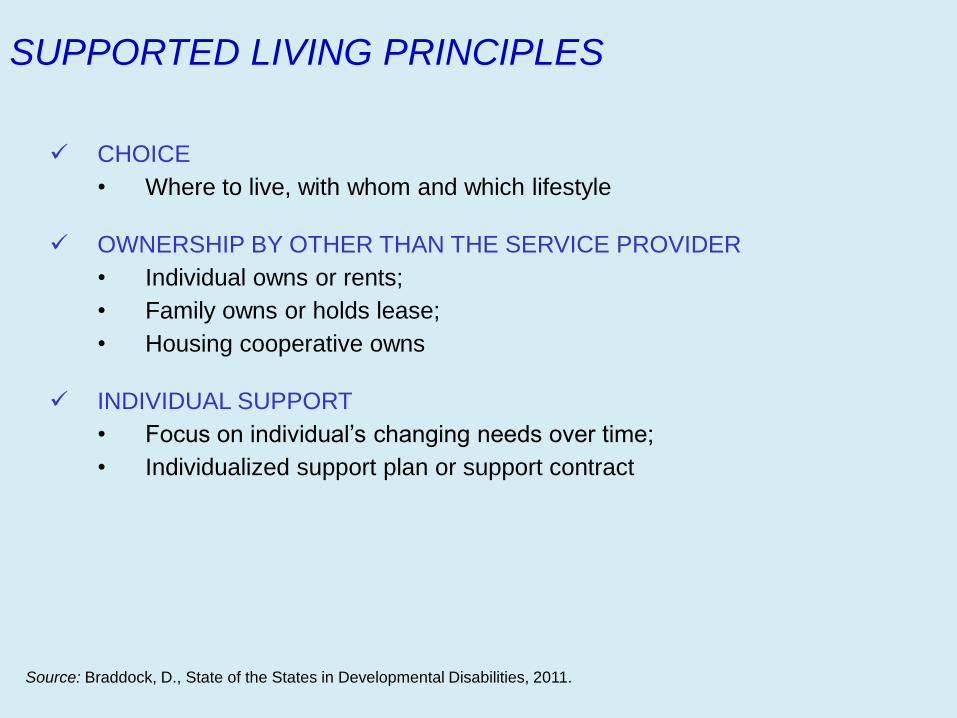
SUPPORTED LIVING PRINCIPLES
CHOICE
• Where to live, with whom and which lifestyle
OWNERSHIP BY OTHER THAN THE SERVICE PROVIDER
• Individual owns or rents;
• Family owns or holds lease;
• Housing cooperative owns
INDIVIDUAL SUPPORT
• Focus on individual’s changing needs over time;
• Individualized support plan or support contract
Source: Braddock, D., State of the States in Developmental Disabilities, 2011.
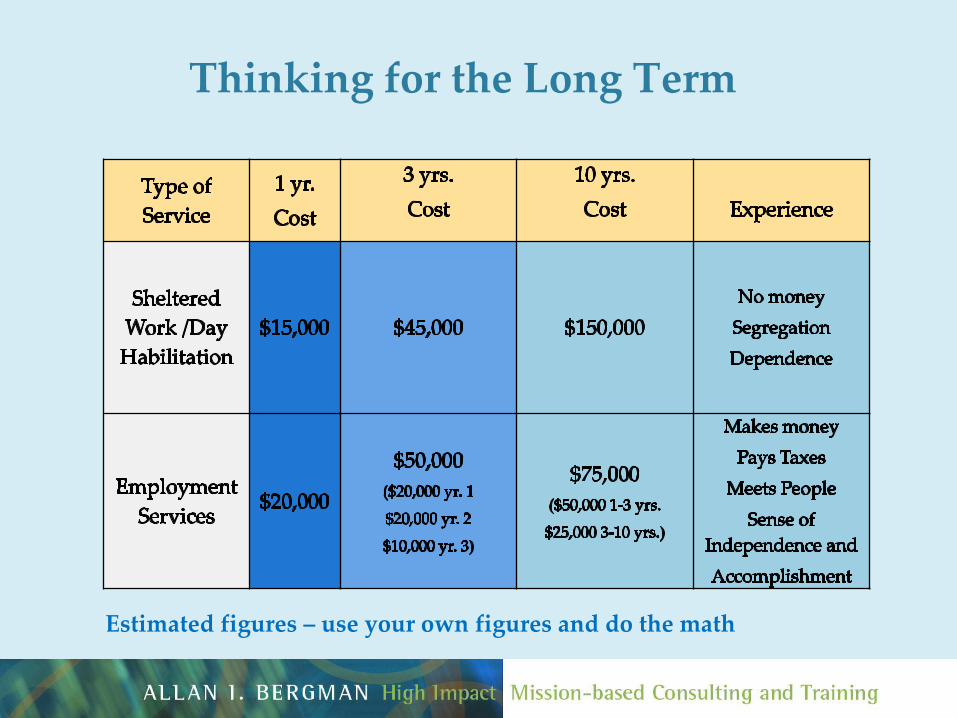
Thinking for the Long Term
Estimated figures – use your own figures and do the math
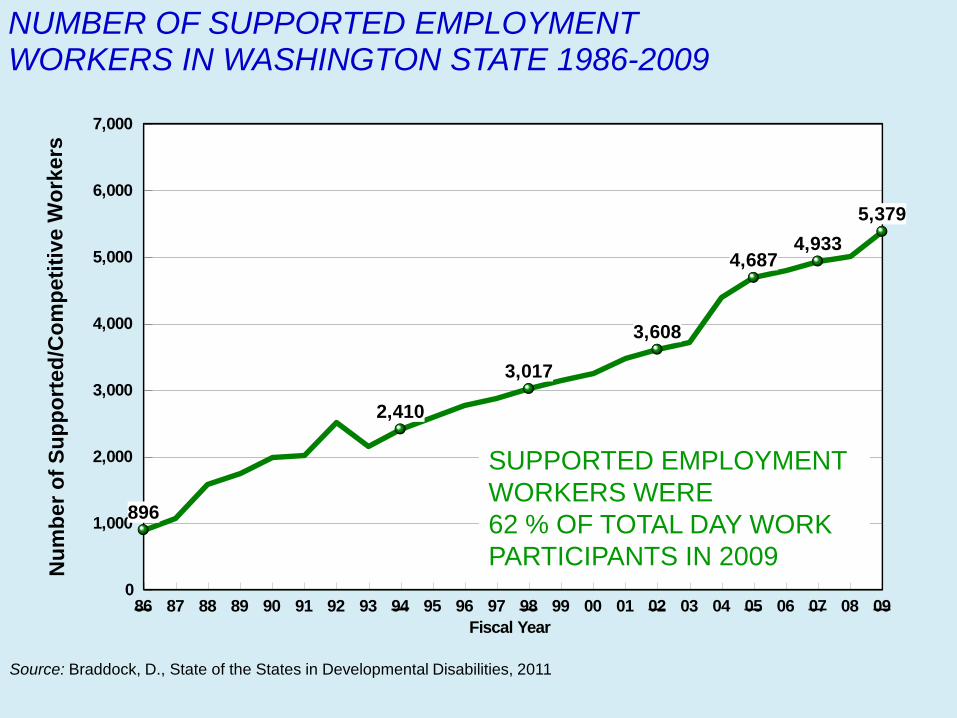
NUMBER OF SUPPORTED EMPLOYMENT WORKERS IN WASHINGTON STATE 1986-2009
Source: Braddock, D., State of the States in Developmental Disabilities, 2011
86 87 88 89 90 91 92 93 94 95 96 97 98 99 00 01 02 03 04 05 06 07 08 09
Fiscal Year
0
1,000
2,000
3,000
4,000
5,000
6,000
7,000
Nu
mb
er
of
Su
pp
ort
ed
/Co
mp
eti
tive W
ork
ers
896
2,410
3,017
3,608
4,6874,933
5,379
SUPPORTED EMPLOYMENT
WORKERS WERE
62 % OF TOTAL DAY WORK
PARTICIPANTS IN 2009
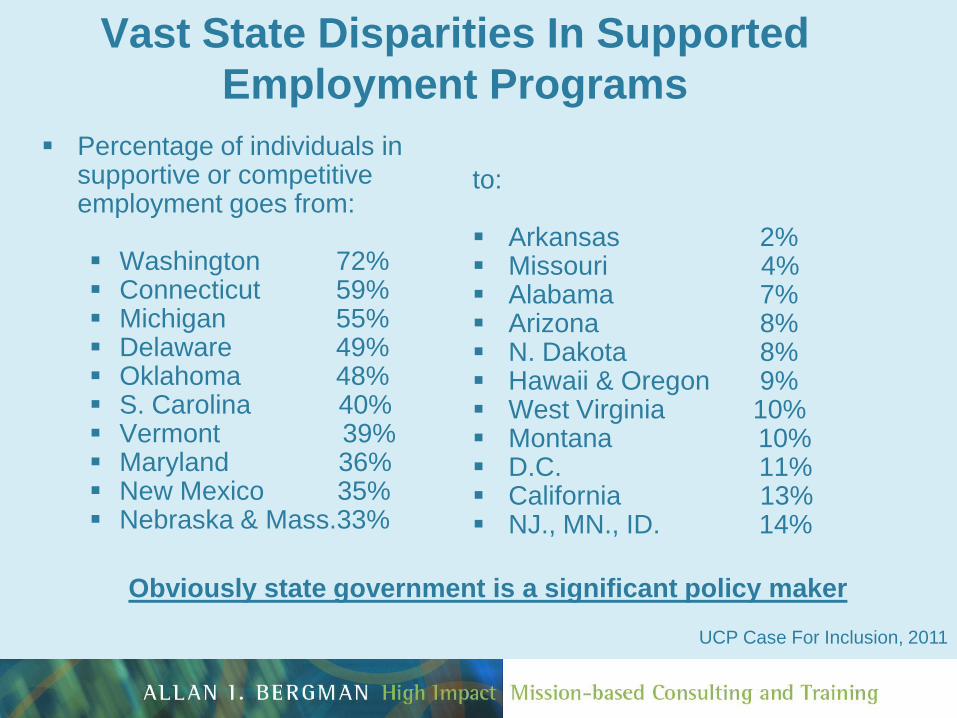
Vast State Disparities In Supported
Employment Programs
Percentage of individuals in supportive or competitive employment goes from: Washington 72% Connecticut 59% Michigan 55% Delaware 49% Oklahoma 48% S. Carolina 40% Vermont 39% Maryland 36% New Mexico 35% Nebraska & Mass.33%
to:
Arkansas 2% Missouri 4% Alabama 7% Arizona 8% N. Dakota 8% Hawaii & Oregon 9% West Virginia 10% Montana 10% D.C. 11% California 13% NJ., MN., ID. 14%
Obviously state government is a significant policy maker
UCP Case For Inclusion, 2011
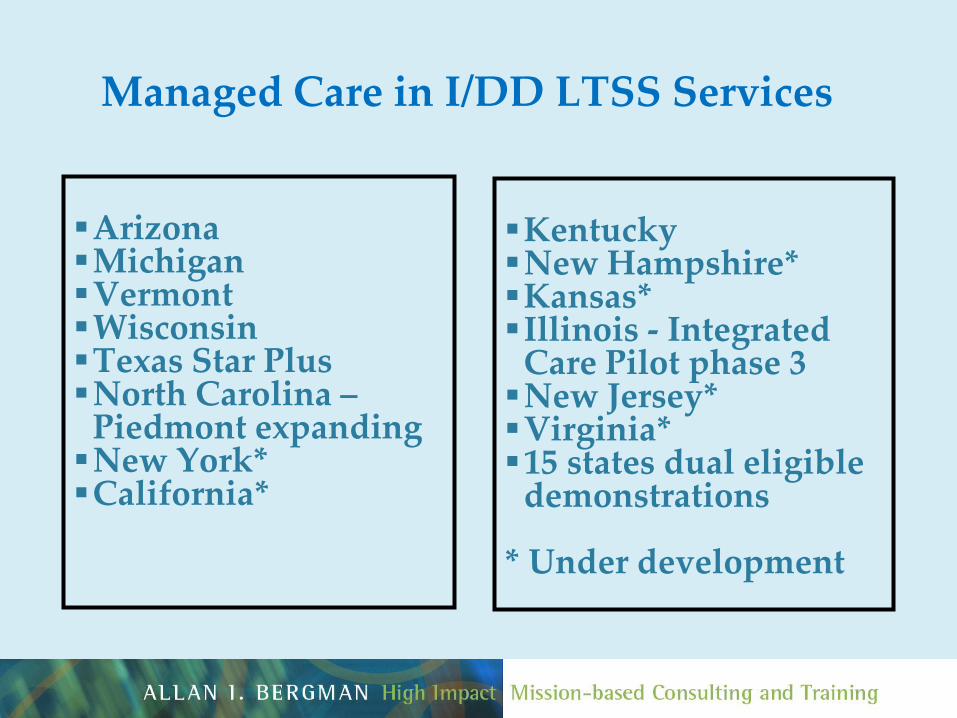
Managed Care in I/DD LTSS Services
Arizona Michigan Vermont Wisconsin Texas Star Plus North Carolina –
Piedmont expanding New York* California*
Kentucky New Hampshire* Kansas* Illinois - Integrated
Care Pilot phase 3 New Jersey* Virginia* 15 states dual eligible
demonstrations
* Under development
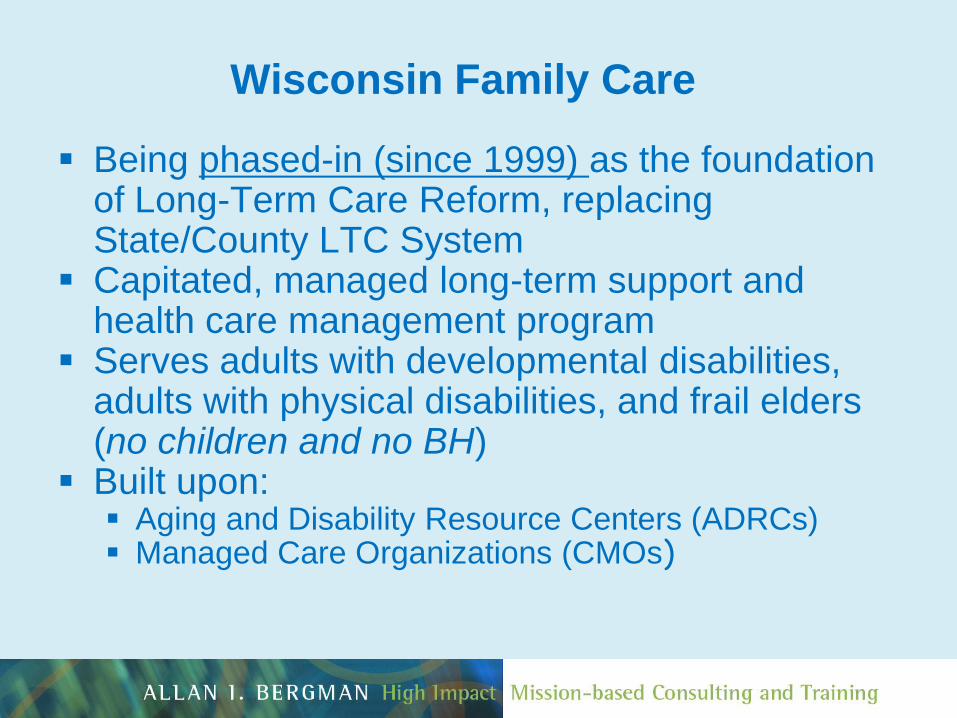
Wisconsin Family Care
Being phased-in (since 1999) as the foundation of Long-Term Care Reform, replacing State/County LTC System
Capitated, managed long-term support and health care management program
Serves adults with developmental disabilities, adults with physical disabilities, and frail elders (no children and no BH)
Built upon: Aging and Disability Resource Centers (ADRCs) Managed Care Organizations (CMOs)
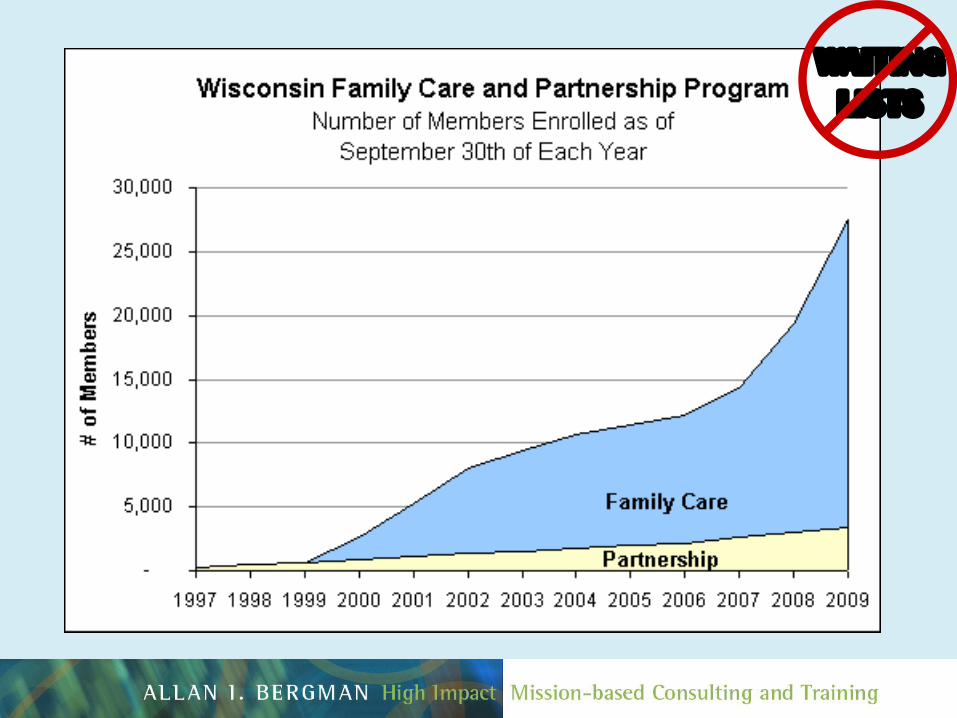
WAITING
LISTS
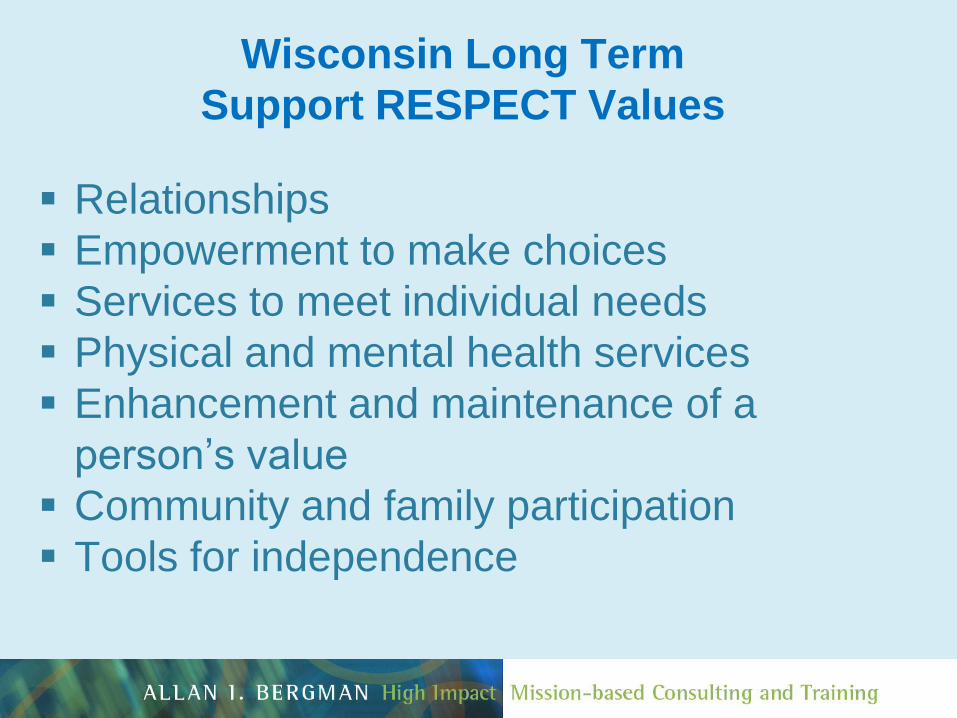
Wisconsin Long Term
Support RESPECT Values
Relationships
Empowerment to make choices
Services to meet individual needs
Physical and mental health services
Enhancement and maintenance of a
person’s value
Community and family participation
Tools for independence
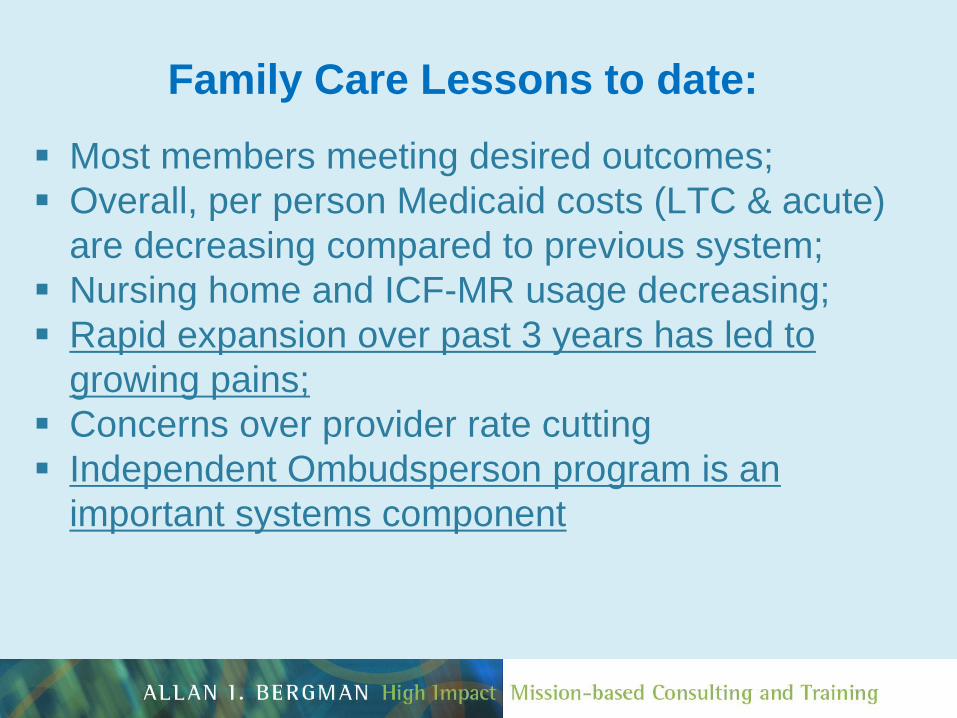
Family Care Lessons to date:
Most members meeting desired outcomes;
Overall, per person Medicaid costs (LTC & acute)
are decreasing compared to previous system;
Nursing home and ICF-MR usage decreasing;
Rapid expansion over past 3 years has led to
growing pains;
Concerns over provider rate cutting
Independent Ombudsperson program is an
important systems component
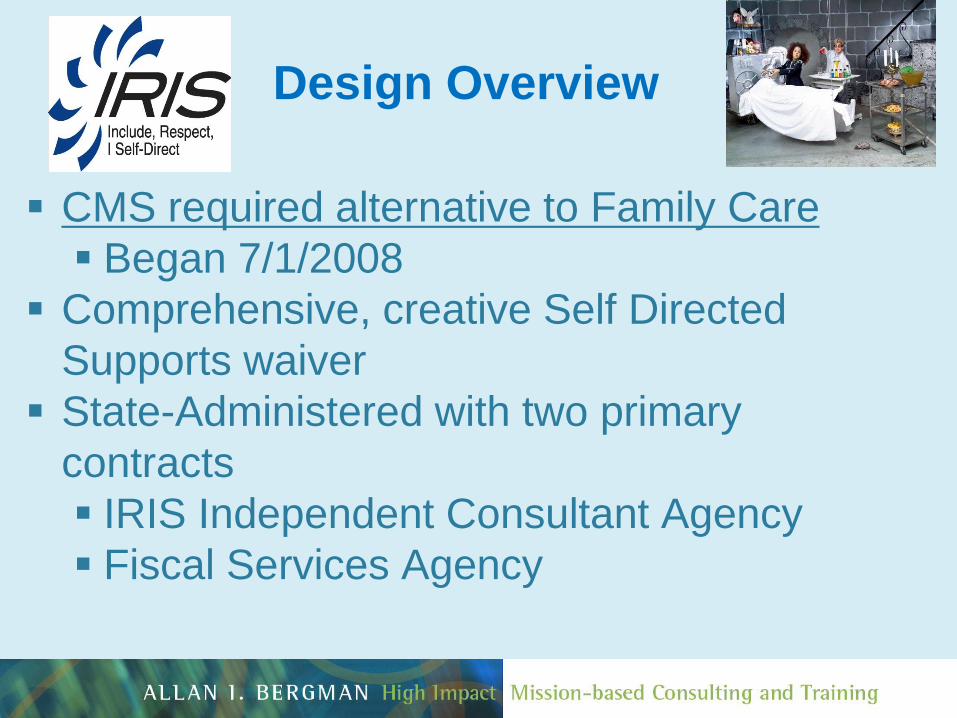
CMS required alternative to Family Care
Began 7/1/2008
Comprehensive, creative Self Directed
Supports waiver
State-Administered with two primary
contracts
IRIS Independent Consultant Agency
Fiscal Services Agency
Design Overview
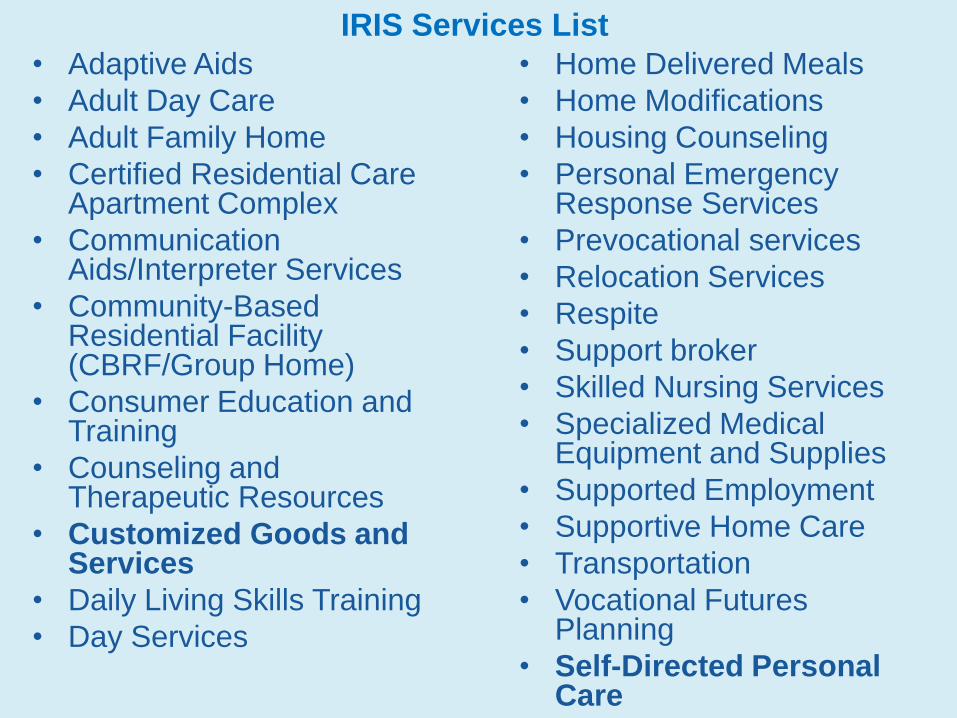
IRIS Services List
• Adaptive Aids
• Adult Day Care
• Adult Family Home
• Certified Residential Care Apartment Complex
• Communication Aids/Interpreter Services
• Community-Based Residential Facility (CBRF/Group Home)
• Consumer Education and Training
• Counseling and Therapeutic Resources
• Customized Goods and Services
• Daily Living Skills Training
• Day Services
• Home Delivered Meals
• Home Modifications
• Housing Counseling
• Personal Emergency Response Services
• Prevocational services
• Relocation Services
• Respite
• Support broker
• Skilled Nursing Services
• Specialized Medical Equipment and Supplies
• Supported Employment
• Supportive Home Care
• Transportation
• Vocational Futures Planning
• Self-Directed Personal Care
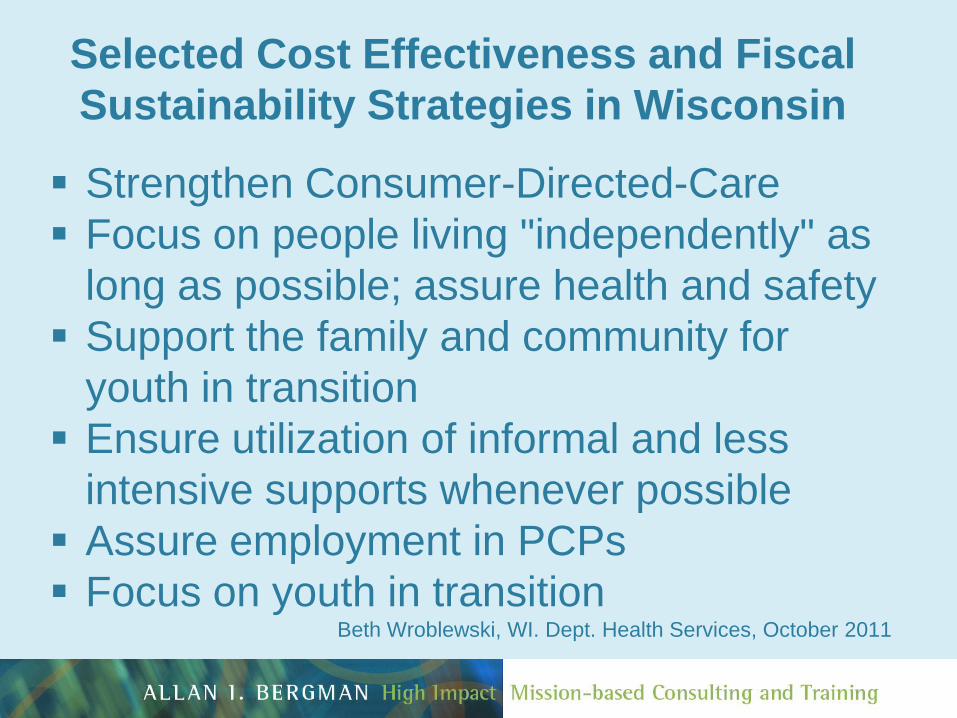
Selected Cost Effectiveness and Fiscal
Sustainability Strategies in Wisconsin
Strengthen Consumer-Directed-Care
Focus on people living "independently" as
long as possible; assure health and safety
Support the family and community for
youth in transition
Ensure utilization of informal and less
intensive supports whenever possible
Assure employment in PCPs
Focus on youth in transition Beth Wroblewski, WI. Dept. Health Services, October 2011
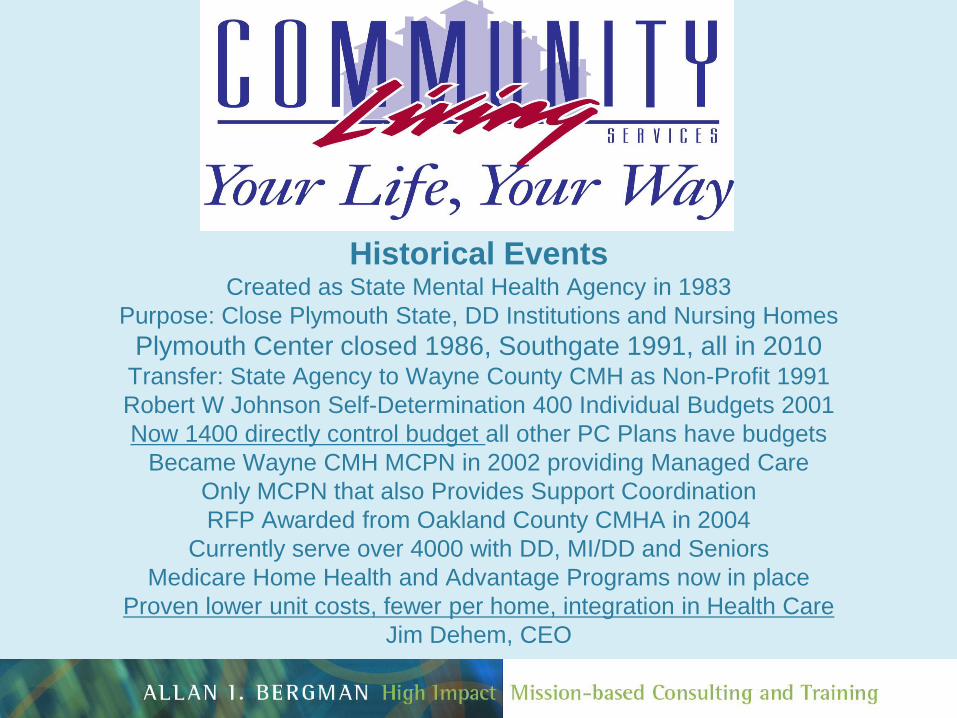
Historical Events Created as State Mental Health Agency in 1983
Purpose: Close Plymouth State, DD Institutions and Nursing Homes
Plymouth Center closed 1986, Southgate 1991, all in 2010 Transfer: State Agency to Wayne County CMH as Non-Profit 1991
Robert W Johnson Self-Determination 400 Individual Budgets 2001
Now 1400 directly control budget all other PC Plans have budgets
Became Wayne CMH MCPN in 2002 providing Managed Care
Only MCPN that also Provides Support Coordination
RFP Awarded from Oakland County CMHA in 2004
Currently serve over 4000 with DD, MI/DD and Seniors
Medicare Home Health and Advantage Programs now in place
Proven lower unit costs, fewer per home, integration in Health Care
Jim Dehem, CEO
56
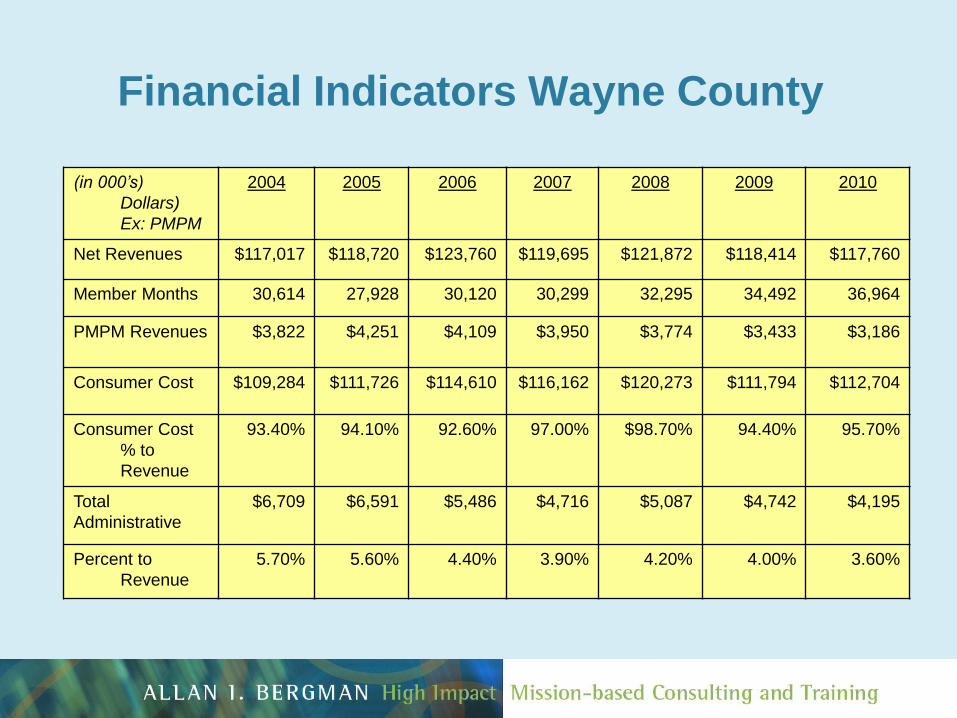
Financial Indicators Wayne County
(in 000’s)
Dollars)
Ex: PMPM
2004 2005 2006 2007 2008 2009 2010
Net Revenues $117,017 $118,720 $123,760 $119,695 $121,872 $118,414 $117,760
Member Months 30,614 27,928 30,120 30,299 32,295 34,492 36,964
PMPM Revenues $3,822 $4,251 $4,109 $3,950 $3,774 $3,433 $3,186
Consumer Cost $109,284 $111,726 $114,610 $116,162 $120,273 $111,794 $112,704
Consumer Cost
% to
Revenue
93.40% 94.10% 92.60% 97.00% $98.70% 94.40% 95.70%
Total
Administrative
$6,709 $6,591 $5,486 $4,716 $5,087 $4,742 $4,195
Percent to
Revenue
5.70% 5.60% 4.40% 3.90% 4.20% 4.00% 3.60%
57
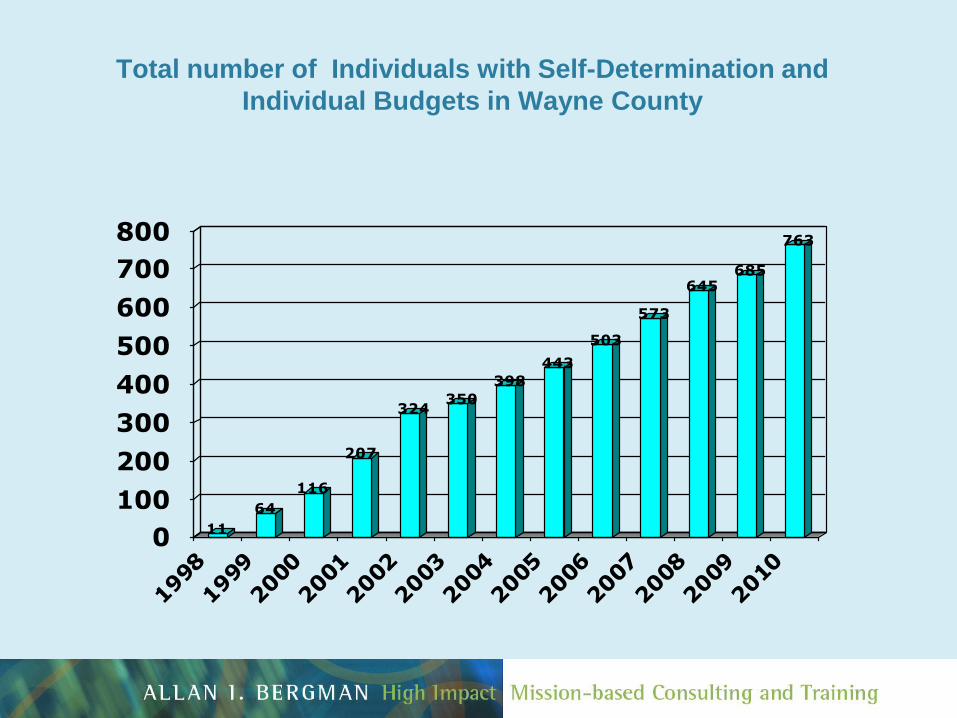
Total number of Individuals with Self-Determination and
Individual Budgets in Wayne County
11
64
116
207
324350
398
443
503
573
645685
763
0
100
200
300
400
500
600
700
800
1998
1999
2000
2001
2002
2003
2004
2005
2006
2007
2008
2009
2010
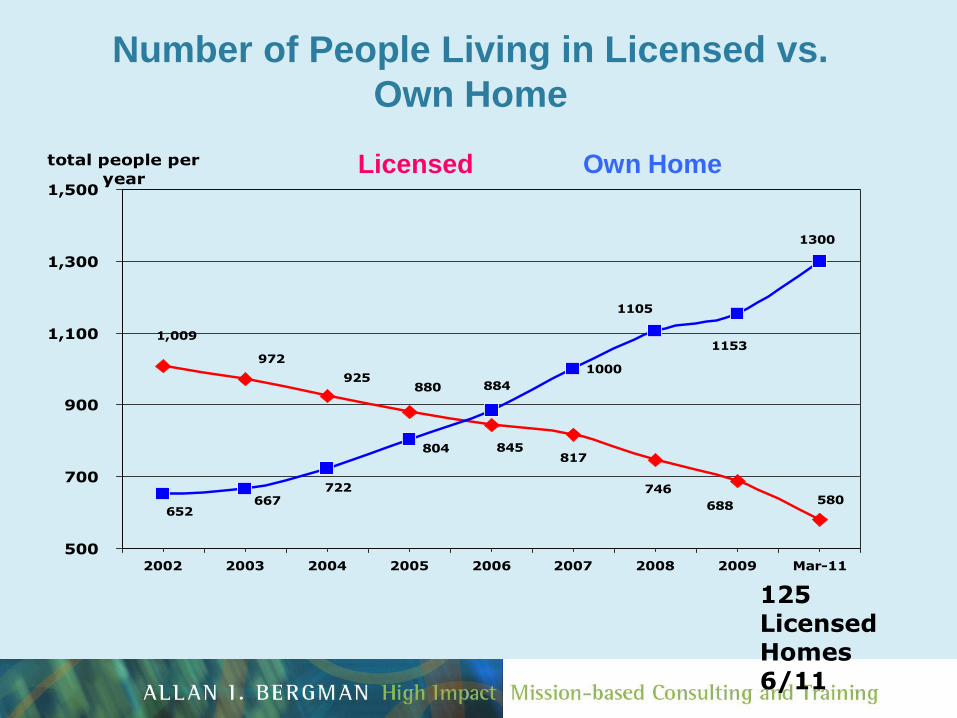
58
Number of People Living in Licensed vs.
Own Home
Licensed Own Home
1000
817
580688
972
925
845
880
746
1,009
722667
652
804
1300
1153
884
1105
500
700
900
1,100
1,300
1,500
2002 2003 2004 2005 2006 2007 2008 2009 Mar-11
total people per
year
125 Licensed Homes 6/11
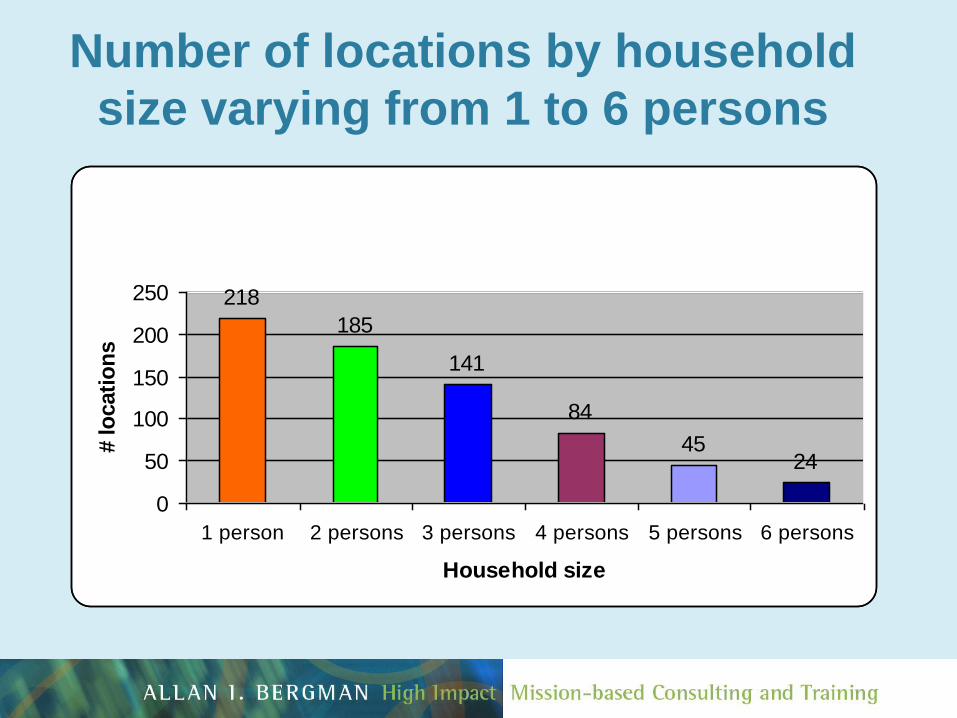
Number of locations by household
size varying from 1 to 6 persons
218
185
141
84
4524
0
50
100
150
200
250
1 person 2 persons 3 persons 4 persons 5 persons 6 persons
Household size
# lo
cati
on
s
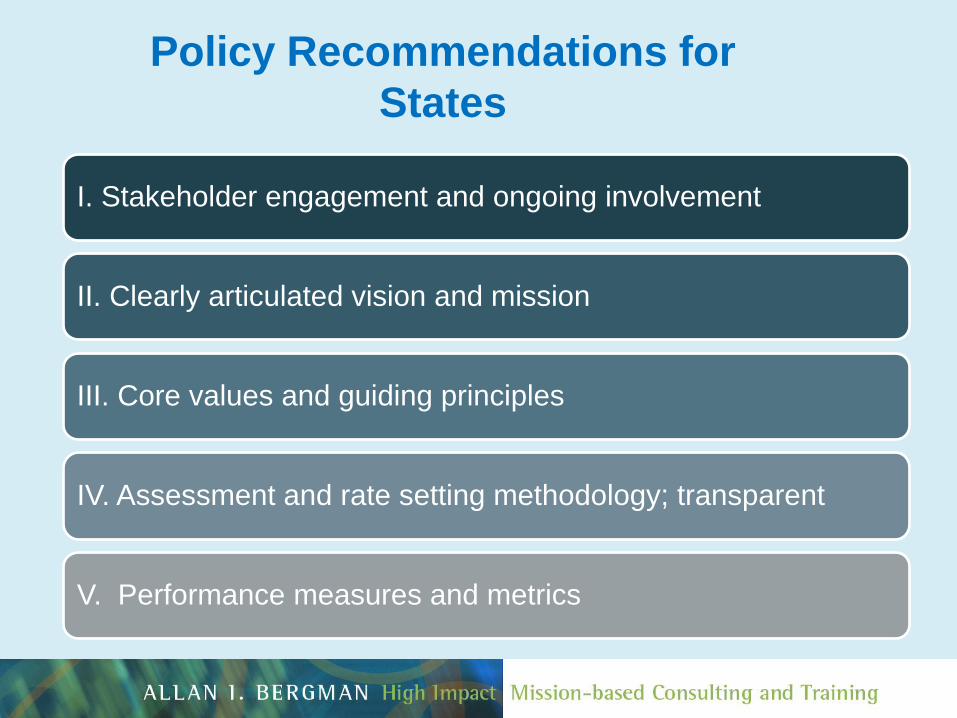
Policy Recommendations for
States
I. Stakeholder engagement and ongoing involvement
II. Clearly articulated vision and mission
III. Core values and guiding principles
IV. Assessment and rate setting methodology; transparent
V. Performance measures and metrics
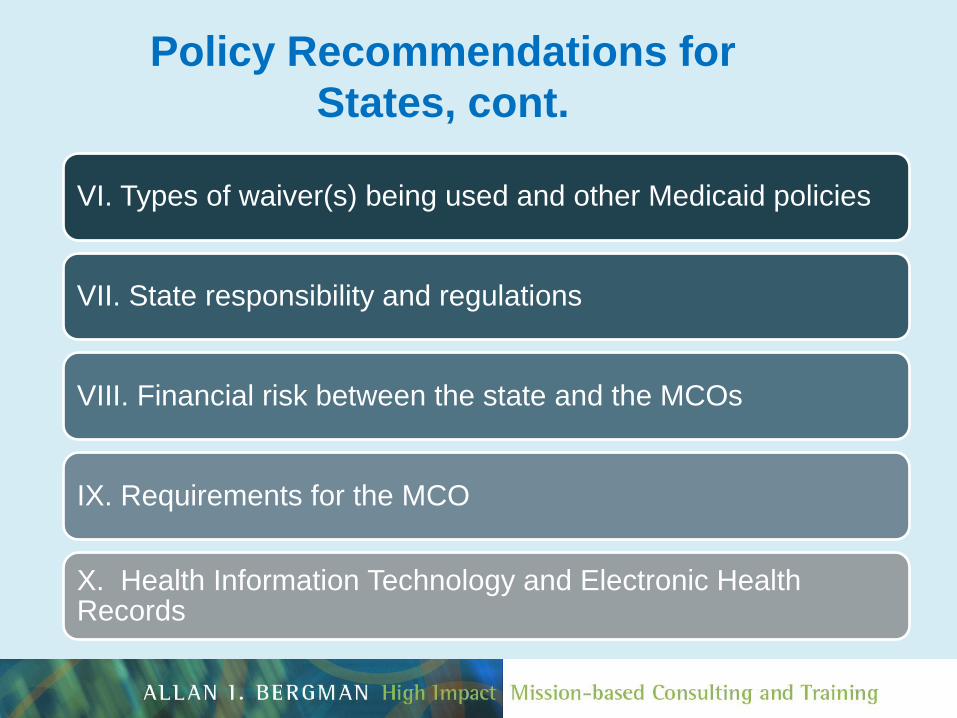
Policy Recommendations for
States, cont.
VI. Types of waiver(s) being used and other Medicaid policies
VII. State responsibility and regulations
VIII. Financial risk between the state and the MCOs
IX. Requirements for the MCO
X. Health Information Technology and Electronic Health Records
ADA INTEGRATION MANDATE
“A public entity shall administer
services, programs and activities in the
most integrated setting appropriate to
the needs of qualified individuals with
disabilities.”
28CFR section 35.130(D)

WORK
PLAY
FRIENDS
For Additional Information, contact
Allan I. Bergman
President
HIGH IMPACT
Mission-based Consulting and Training
757 Sarah Lane
Northbrook, IL. 60062
(773) 332-0871

Questions?
Type your question in the "Q&A" box on the
lower right corner of your screen.

Contact Information
The webinar archive and power points will be
available online next week. www.ncsl.org
Recommended