2018
February 2019

CONSUMER SENTINEL NETWORK DATA BOOK 2018_____________________________________________________________________________________________
_________________________________________________________________________________________________________________________________________FEDERAL TRADE COMMISSION · ftc.gov/data 1
Table of Contents
Report Subject
About the Sentinel Data Book Introduction ................................................................................................................................................... Inside the Numbers ....................................................................................................................................... Executive Summary ....................................................................................................................................... Visual Snapshot .............................................................................................................................................
National Statistics Number of Fraud, Identity Theft and Other Reports by Year ...................................................................... Report Categories ......................................................................................................................................... Report Types .................................................................................................................................................. Number of Reports by Type .......................................................................................................................... Fraud Reports by Amount Lost ................................................................................................................... Fraud Reports by Payment Method ............................................................................................................ Fraud Reports by Contact Method .............................................................................................................. Reported Frauds and Losses by Age ..........................................................................................................
Identity Theft Identity Theft Reports by Type .................................................................................................................... Top Three Identity Theft Reports by Year .................................................................................................. Identity Theft Reports and Types by Age ....................................................................................................
Military Consumers Report Types by Status, Branch, and Rank ............................................................................................... Top Reports by Category ............................................................................................................................. Identity Theft Reports by Type ....................................................................................................................
State and Local Statistics State Rankings: Fraud and Other Reports ................................................................................................ State Rankings: Identity Theft Reports ...................................................................................................... Individual State Pages Fifty States, District of Columbia (DC) and Puerto Rico .................................................................
Top 50 Metropolitan Areas: Fraud and Other Reports ............................................................................. Top 50 Metropolitan Areas: Identity Theft Reports ...................................................................................
Appendices A1: The Consumer Sentinel Network.......................................................................................................... A2: Major Data Contributors ....................................................................................................................... A3: Data Contributors ............................................................................................................................ A4: Better Business Bureau Data Contributors .........................................................................................
B1: Descriptions of Report Categories ................................................................................................. B2: Report Categories over Three Years .................................................................................................... B3: Detailed Report Categories over Three Years ..............................................................................
C: Fraud Reports and Amount Lost by State .............................................................................................
2345
678910111213
141516
171819
2021
22-73
7475
7677
78-7980
81-8384
85- 87
88

CONSUMER SENTINEL NETWORK DATA BOOK 2018_____________________________________________________________________________________________
_________________________________________________________________________________________________________________________________________FEDERAL TRADE COMMISSION · ftc.gov/data 2
Introduction
The FTC takes in reports from consumers about problems they experience in the marketplace. The reportsare stored in the Consumer Sentinel Network (Sentinel), a secure online database available only to lawenforcement. While the FTC does not intervene in individual consumer disputes, its law enforcementpartners – whether they are down the street, across the nation, or around the world – can use informationin the database to spot trends, identify questionable business practices and targets, and enforce the law.
Since 1997, Sentinel has collected tens of millions of consumer reports about fraud, identity theft, andother consumer protection topics. During 2018, Sentinel received nearly 3 million consumer reports, whichthe FTC has sorted into 29 top categories. The 2018 Consumer Sentinel Network Data Book (Sentinel DataBook) has aggregated information about what consumers told us last year on the full range of fraud,identity theft and other consumer protection topics. This year, Consumer Sentinel data is also availableonline in an interactive format, with updates provided quarterly. The Sentinel Data Book is based onunverified reports filed by consumers. The data is not based on a consumer survey. Sentinel has a five-yeardata retention policy, with reports older than five years purged biannually.
In addition to taking consumer reports directly from people who call the FTC’s call center or report online,Sentinel also includes reports filed with other federal, state, local, and international law enforcementagencies, as well as other organizations, like the Better Business Bureau and Publishers Clearing House.
In 2018, the FTC was pleased to welcome the data contributions of the Nebraska Attorney General, NewYork State Attorney General, AARP FraudWatch Network, and Microsoft Corporation Cyber Crime Center. Afull listing of data contributors is available in Appendix A3 and A4. Non-government organizations thatcontribute reports do not have access to Sentinel reports, as access is limited to law enforcement agencies.
For more information about the Consumer Sentinel Network, visit www.FTC.gov/Sentinel. Law enforcementpersonnel may join Sentinel at Register.ConsumerSentinel.gov.
CONSUMER SENTINEL NETWORK DATA BOOK 2018_____________________________________________________________________________________________
_________________________________________________________________________________________________________________________________________FEDERAL TRADE COMMISSION · ftc.gov/data 3
Inside the Numbers
Sentinel sorts consumer reports into 29 top categories. Appendices B1 – B3 describe the categories,providing details, and three year figures. To reflect marketplace changes, new categories orsubcategories are created or deleted over time.
The Consumer Sentinel Network Data Book excludes the National Do Not Call Registry. A separatereport about these complaint statistics is available at: https://www.ftc.gov/reports/national-do-not-call-registry-data-book-fiscal-year-2018. The Sentinel Data Book also excludes reports about unsolicitedcommercial email.
Consumers can report as much or as little detail as they wish when they file a report. For the SentinelData Book graphics, percentages are based on the total number of Sentinel fraud, identity theft, andother report types in 2018 in which consumers provided the information displayed on each chart.
Reports to Sentinel sometimes indicate money was lost, and sometimes indicate no money was lost.Often, people make these reports after they experience something problematic in the marketplace,avoid losing any money, and wish to alert others. Except where otherwise stated, numbers are based onreports both from people who indicated a loss and people who did not.
Calculations of dollar amounts lost are based on reports in which consumers indicated they lostbetween $1 and $999,999. Prior to 2017, reported “amount paid” included values of $0 to $999,999.
States and Metropolitan Areas are ranked based on the number of reports per 100,000 population.State rankings are based on 2017 U.S. Census population estimates (Annual Estimates of the ResidentPopulation: April 1, 2010 to July 1, 2017). Metropolitan Area rankings are based on 2016 U.S. Censuspopulation estimates (Annual Estimates of the Resident Population: April 1, 2010 to July 1, 2016).
This Sentinel Data Book identifies Metropolitan Areas (Metropolitan and Micropolitan Statistical Areas)with a population of 100,000 or more except where otherwise noted. Metropolitan areas are defined byOffice of Management and Budget Bulletin No. 15-01, “Revised Delineations of Metropolitan StatisticalAreas, Micropolitan Statistical Areas, and Combined Statistical Areas, and Guidance on Uses of theDelineations of These Areas” (July 15, 2015).
Numbers change over time. The Sentinel Data Book sorts consumer reports by year, based on the dateof the consumer’s report. Some data contributors transfer their complaints to Sentinel after the end ofthe calendar year, and new data providers often contribute reports from prior years. As a result, thetotal number of reports for 2018 will likely change during the next few months, and totals from previousyears may differ from prior Consumer Sentinel Network Data Books. The most up to date informationcan be found online at ftc.gov/data.

CONSUMER SENTINEL NETWORK DATA BOOK 2018_____________________________________________________________________________________________
_________________________________________________________________________________________________________________________________________FEDERAL TRADE COMMISSION · ftc.gov/data 4
Executive Summary
OverviewDuring 2018, the Consumer Sentinel Network took in nearly 3 million reports, an increase from 2017. - Fraud: 1.4 million (48% of all reports) - Identity theft: 444,602 (15%) - Other: 1.1 million (38%)
Imposter Scams are the top report category in 2018 (18% of all reports). Debt collection reportsdeclined by 24% percent in 2018 (16% of all reports) and moved to #2. Identity theft (15% of allreports) rounds out the top three reports to Sentinel.
FraudThere were over 535,000 imposter scam reports to Sentinel. Nearly one in five of those also reported adollar loss, totaling nearly $488 million lost to imposter scams. These scams include, for example,romance scams, people falsely claiming to be with the government, a relative in distress, a well-knownbusiness, or a technical support expert, to get a consumer’s money.
Of the 1.4 million fraud reports, 25% indicated money was lost. In 2018, people reported losing nearly$1.48 billion to fraud – an increase of $406 million over what consumers reported losing in 2017.
The median loss for all fraud reports in 2018 is $375. The median individual losses were highest inthese fraud categories: - Mortgage Foreclosure Relief and Debt Management ($1,377) - Business and Job Opportunities ($1,304) - Foreign Money Offers and Counterfeit Check Scams ($1,214)
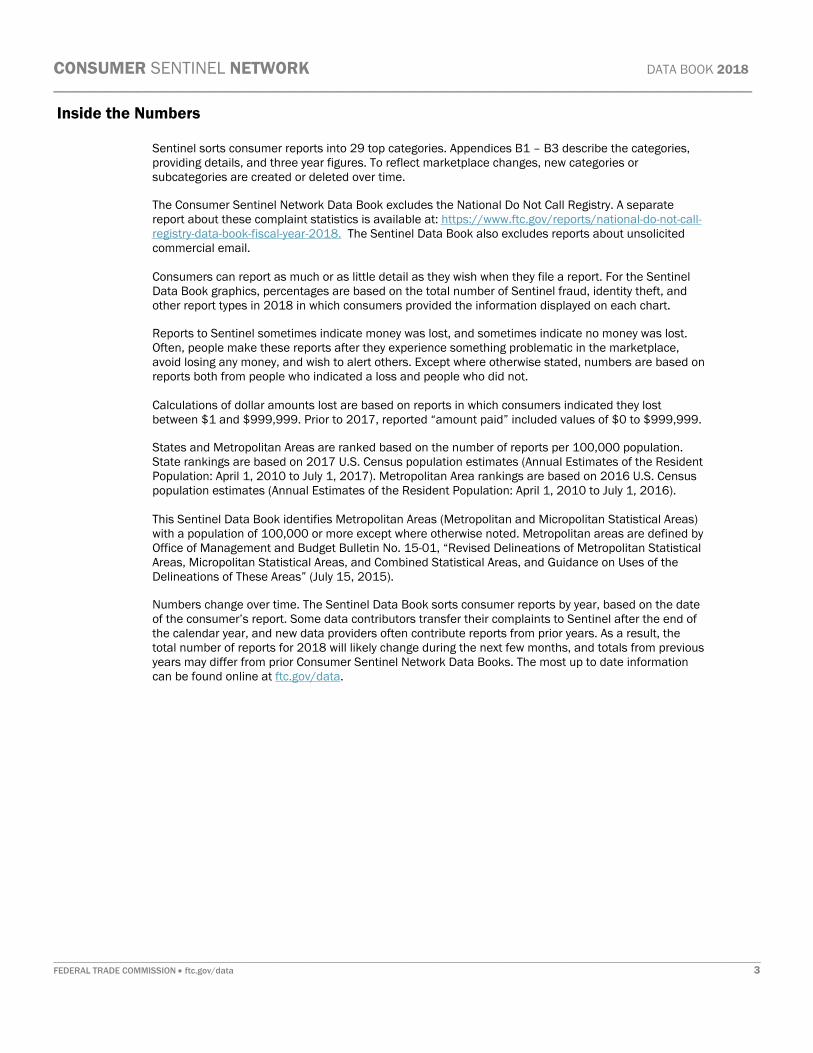
Telephone was the method of contact for 69% of fraud reports with a contact method identified. Onlyeight percent of those people reported losing money to the scammer – but that 8% reported anaggregate loss of $429 million, and an $840 median loss.
Wire transfers continue to be the most frequently reported payment method for fraud, with a reportedaggregate loss of $423 million.
Of people who reported their age, those aged 20-29 reported losing money to fraud in 43% of reportsfiled with the FTC, while people aged 70 – 79 reported losing money in 15% of their reports and people80 and over reported losing money in just 13% of their reports. But when they did experience a loss,people aged 70 and older reported much higher median losses than any other age group.
Identity TheftCredit card fraud tops the list of identity theft reports in 2018. The FTC received more than 167,000reports from people who said their information was misused on an existing account or to open a newcredit card account.
MilitaryMilitary consumers reported more than 59,000 fraud complaints, including over 36,000 imposterscams that cost them $34 million in 2018. Imposter scams were the largest single category of reportsfrom military consumers.
Top StatesThe states with the highest per capita rates of reported fraud in 2018 were Florida, Georgia, Nevada,Delaware, and Maryland. For reported identity theft, the top states in 2018 were Georgia, Nevada,California, Florida, and Texas.

$1.48 billion total fraud losses
$375 median loss
reported a loss25%1.4 million fraud reports
Identity Theft
Credit card new accountfraud
24%
Tax fraud38%
Imposter Scams
NEARLY 1 IN 5LOST MONEY
$488 million reported lost
$500 median loss
CONSUMER SENTINEL NETWORKDATA BOOK 2018
SNAPSHOT
TOP THREE CATEGORIES
1. Imposter scams2. Debt collection3. Identity theft
3 MILLION REPORTS
Younger people reported losing money to fraud more often than older people.
But when people aged 70+ had a loss, the median loss was much higher.
Age 20-29
43%
Age 70-79
15%
FEDERAL TRADE COMMISSION ● ftc.gov/data
PEOPLE
Age 20-29 70-79 80+
$750
$400
$1,700

_________________________________________________________________________________________________________________________________________FEDERAL TRADE COMMISSION · ftc.gov/data 6
The reported figures exclude National Do Not Call Registry complaints.
Year # of Reports2001
2002
2003
2004
2005
2006
2007
2008
2009
2010
2011
2012
2013
2014
2015
2016
20172018 2,994,483
2,875,0163,046,915
3,078,749
2,616,830
2,134,565
2,115,079
1,898,543
1,470,306
1,428,977
1,261,124
1,070,447
906,129
909,314
860,383
713,657
551,622
325,519
2001 2002 2003 2004 2005 2006 2007 2008 2009 2010 2011 2012 2013 2014 2015 2016 2017 2018
1.47M
1.90M
1.43M
1.26M
2.12M
2.13M
3.08M 3.05M
0.33M
2.99M
1.07M
2.88M
0.55M
0.91M
0.91M0.86M
0.71M
2.62M
CONSUMER SENTINEL NETWORK DATA BOOK 2018_____________________________________________________________________________________________
Number of Fraud, Identity Theft and Other Reports by Year

_________________________________________________________________________________________________________________________________________FEDERAL TRADE COMMISSION · ftc.gov/data 7
Percentages are based on the total number of 2018 Sentinel reports (2,994,483). 6% of the total were coded “Other (Note in Comments).” See Appendix B3.
RankCategory # of Reports %
1 Imposter Scams
2 Debt Collection
3 Identity Theft
4 Telephone and Mobile Services
5 Shop-at-Home and Catalog Sales
6 Banks and Lenders
7 Credit Bureaus, Information Furnishers and Report Users
8 Prizes, Sweepstakes and Lotteries
9 Auto Related
10 Internet Services
11 Credit Cards
12 Health Care
13 Television and Electronic Media
14 Travel, Vacations and Timeshare Plans
15 Foreign Money Offers and Counterfeit Check Scams
16 Business and Job Opportunities
17 Advance Payments for Credit Services
18 Computer Equipment and Software
19 Investment Related
20 Education
21 Home Repair, Improvement and Products
22 Mortgage Foreclosure Relief and Debt Management
23 Magazines and Books
24 Grants
25 Office Supplies and Services
26 Charitable Solicitations
27 Tax Preparers
28 Internet Auction
29 Funeral Services
17.88%535,417
15.88%475,517
14.85%444,602
5.51%164,876
4.78%143,072
4.61%138,134
4.57%136,748
4.42%132,470
3.49%104,604
2.10%62,942
1.71%51,129
1.58%47,410
1.28%38,336
0.95%28,353
0.92%27,443
0.84%25,068
0.65%19,575
0.61%18,350
0.50%14,884
0.48%14,242
0.38%11,331
0.34%10,039
0.21%6,309
0.21%6,274
0.18%5,350
0.15%4,350
0.14%4,103
0.06%1,699
0.03%964
Report Categories
CONSUMER SENTINEL NETWORK DATA BOOK 2018_____________________________________________________________________________________________

_________________________________________________________________________________________________________________________________________FEDERAL TRADE COMMISSION · ftc.gov/data 8
Certain Fraud categories are comprised of subcategories that fall in both Fraud and Other report types. See Appendix B3. The Fraud rankings exclude subcategories that are notfraud.
Rank Category # of Reports1 Debt Collection2 Banks and Lenders3 Credit Bureaus, Information Furnishers and Report Users4 Auto Related5 Credit Cards6 Television and Electronic Media7 Computer Equipment and Software8 Education9 Home Repair, Improvement and Products10 Funeral Services
475,517138,134136,748104,60451,12938,33618,35014,24211,331964
Other Categories
Rank Theft Type # of Reports1 Credit Card Fraud2 Other Identity Theft3 Employment or Tax-Related Fraud4 Phone or Utilities Fraud5 Bank Fraud6 Loan or Lease Fraud7 Government Documents or Benefits Fraud
157,688122,49967,37463,56352,52951,85624,854
Identity Theft Types
Rank Category # of Reports% Reporting $Loss Total $ Loss Median $Loss
1 Imposter Scams2 Telephone and Mobile Services3 Shop-at-Home and Catalog Sales4 Prizes, Sweepstakes and Lotteries5 Internet Services6 Travel, Vacations and Timeshare Plans7 Foreign Money Offers and Counterfeit Check Scams8 Business and Job Opportunities9 Advance Payments for Credit Services10 Health Care
$500$488M18%535,417$200$20M5%164,693$155$107M67%142,929$530$118M10%132,470$139$36M28%57,907$800$68M40%28,353$1,214$42M34%27,443$1,304$116M42%24,620$376$23M77%19,575$130$4M46%17,069
Top 10 Fraud Categories
Fraud
Identity Theft
Other
1,427,563 (47.7%)
1,125,354 (37.6%)
444,602 (14.8%)
Report Type
CONSUMER SENTINEL NETWORK DATA BOOK 2018_____________________________________________________________________________________________

_________________________________________________________________________________________________________________________________________FEDERAL TRADE COMMISSION · ftc.gov/data 9
The reported figures exclude National Do Not Call Registry complaints.
Year Fraud Identity Theft Other
2001
2002
2003
2004
2005
2006
2007
2008
2009
2010
2011
2012
2013
2014
2015
2016
2017
2018 1,125,354
1,215,464
1,423,823
1,427,784
762,021
685,352
632,428
577,835
399,160
441,836
325,705
305,570
236,243
216,042
203,176
167,051
146,862
101,963
444,602
371,034
398,952
490,112
332,545
290,098
369,958
279,191
251,074
278,360
314,587
259,314
246,214
255,687
246,909
215,240
161,977
86,250
1,427,563
1,290,636
1,226,402
1,165,625
1,526,365
1,159,115
1,112,693
1,041,517
820,072
708,781
620,832
505,563
423,672
437,585
410,298
331,366
242,783
137,306
Number of Reports by Type
2002 2004 2006 2008 2010 2012 2014 2016 2018
0K
200K
400K
600K
800K
1,000K
1,200K
1,400K
1,600K
# of Reports
Number of Reports by Type
Report TypeFraudIdentity TheftOther
CONSUMER SENTINEL NETWORK DATA BOOK 2018_____________________________________________________________________________________________

_________________________________________________________________________________________________________________________________________FEDERAL TRADE COMMISSION · ftc.gov/data 10
The amount lost is based on reports in which consumers indicated they lost between $1 and $999,999.
Amount Lost # of Reports
$1 - $1,000
$1,001 - $2,000
$2,001 - $3,000
$3,001 - $4,000
$4,001 - $5,000
$5,001 - $6,000
$6,001 - $7,000
$7,001 - $8,000
$8,001 - $9,000
$9,001 - $10,000
More than $10,000 18,085
2,278
1,521
2,126
2,334
3,209
5,741
7,645
14,786
34,595
266,435
Amount Lost
$1 - $100
$101 - $200
$201 - $300
$301 - $400
$401 - $500
$501 - $600
$601 - $700
$701 - $800
$801 - $900
$901 - $1,000
80,432
48,461
34,368
24,792
24,182
14,552
10,645
10,123
11,215
7,665
Reported Fraud Losses in $1 - $1,000 Range
Reported Fraud Losses in $1 - $10,000+ Range
$375
Median $ Loss
$1,484,650,267
Total $ Loss
358,755 (25%)
# of Reports with $ Loss
1,427,563
Number of Fraud Reports
Fraud Reports by Amount Lost
CONSUMER SENTINEL NETWORK DATA BOOK 2018_____________________________________________________________________________________________

_________________________________________________________________________________________________________________________________________FEDERAL TRADE COMMISSION · ftc.gov/data 11
Data contributors MoneyGram International and Western Union provided a significant number of reports, which may affect the distribution of the reported methods of payment.
# of Reports Total $ Loss
Wire Transfer
Credit Cards
Gift\Reload Cards
Bank Account Debit
Internet\Mobile
Cash\Cash Advance
Check
Money Order
Telephone Bill
101,434
50,413
41,046
33,037
14,392
10,822
9,133
3,714
1,106
$423M
$131M
$109M
$78M
$78M
$40M
$75M
$20M
$5M
265,097 (19%)
# of Reports with Payment Method
1,427,563
Number of Fraud Reports
Fraud Reports by Payment Method
CONSUMER SENTINEL NETWORK DATA BOOK 2018_____________________________________________________________________________________________
_________________________________________________________________________________________________________________________________________FEDERAL TRADE COMMISSION · ftc.gov/data 12
Contact Method # of Reports Total $ Lost Median $ Lost
Phone
Website\Others
Consumer Initiated Contact
Other $1,245
$1,000
$216
$306
$321
$840
$133M
$55M
$87M
$173M
$227M
$429M
17,069
30,577
43,322
92,210
111,057
647,310
Number of Reports and Amount Lost by Contact Method
Percentage of all Fraud Reports with a Contact Method identifiedOf those reports, the percentage with a dollar loss reported
Phone
Website\Others
Consumer Initiated Contact
Other
69%
8%
12%
41%
10%
30%
71%
5%
16%
3%
42%
2%
941,545 (66%)
# of Reports with Contact Method
1,427,563
Number of Fraud Reports
Fraud Reports by Contact Method
CONSUMER SENTINEL NETWORK DATA BOOK 2018_____________________________________________________________________________________________

_________________________________________________________________________________________________________________________________________FEDERAL TRADE COMMISSION · ftc.gov/data 13
Of the 1,427,563 total fraud reports in 2018, 46% included consumer age information.
19 and Under 20 - 29 30 - 39 40 - 49 50 - 59 60 - 69 70 - 79 80 and Over
$1,700
$188
$400 $380$450
$500
$600
$751
29%
24%
33%
46%
18%
43%
13%15%
Percentage Reporting a Fraud Loss and Median Loss by Age
Percentage Reporting a Fraud $ LossMedian $ Lost
Percentages are based on the total number of 2018 fraud reports in which consumers provided their age: 661,938.
# of Reports Total $ Lost
19 and Under
20 - 29
30 - 39
40 - 49
50 - 59
60 - 69
70 - 79
80 and Over
104,713 (16%)
107,471 (16%)
129,448 (20%)
77,471 (12%)
94,499 (14%)
85,929 (13%)
21,904 (3%)
40,503 (6%)
$138M
$158M
$168M
$184M
$128M
$15M
$83M
$79M
Reported Frauds and Losses by Age
CONSUMER SENTINEL NETWORK DATA BOOK 2018_____________________________________________________________________________________________

_________________________________________________________________________________________________________________________________________FEDERAL TRADE COMMISSION · ftc.gov/data 14
Theft Type Theft Subtype # of Reports % Difference fromPrevious Year
Credit Card Fraud New Accounts
Existing Accounts
Employment or Tax-RelatedFraud
Tax Fraud
Employment or Wage-Related Fraud
Phone or Utilities Fraud Mobile Telephone – New Accounts
Utilities – New Accounts
Landline Telephone – New Accounts
Mobile Telephone – Existing Accounts
Landline Telephone – Existing Accounts
Utilities – Existing Accounts
Bank Fraud Debit Cards, Electronic Funds Transfer, or ACH
New Accounts
Existing Accounts
Loan or Lease Fraud Business\Personal Loan
Auto Loan\Lease
Non-Federal Student Loan
Apartment or House Rented
Real Estate Loan
Federal Student Loan
Government Documents orBenefits Fraud
Government Benefits Applied For\Received
Other Government Documents Issued\Forged
Driver's License Issued\Forged
Passport Issued\Forged
Other Identity Theft Other
Medical Services
Online Shopping or Payment Account
Email or Social Media
Evading the Law
Insurance
Securities Accounts
-6%
+24%
32,329
130,928
+44%
-38%
30,592
38,967
+20%
+25%
+6%
+28%
+0%
+28%
1,322
1,453
4,983
7,738
21,994
33,466
+2%
+12%
+0%
12,990
19,639
23,219
+119%
+17%
+50%
+78%
+89%
+82%
5,082
5,178
5,439
6,327
18,815
20,328
+35%
+19%
+5%
-10%
703
4,493
5,645
16,021
+15%
+24%
+7%
+23%
+18%
+103%
+121%
1,877
3,675
4,439
9,439
10,294
13,833
87,765
Identity Theft Reports by Type
CONSUMER SENTINEL NETWORK DATA BOOK 2018_____________________________________________________________________________________________
Consumers can report multiple types of identity theft. In 2018, 17% of identity theft reports included more than one type of identity theft.
________________________________________________________________________________________________________________________________________FEDERAL TRADE COMMISSION · ftc.gov/data 15
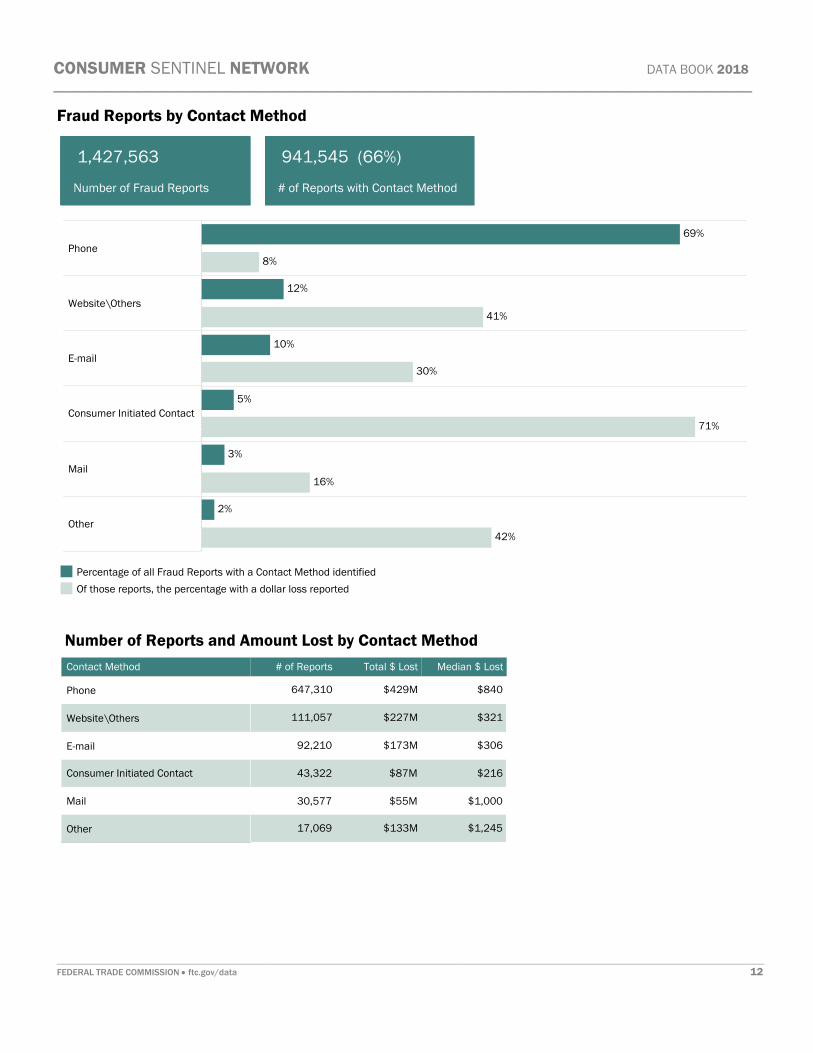
The top identity theft types can vary by year. This graph depicts the top three types of identity theft reported in 2018 and how those types changed over five years.
2014 2015 2016 2017 2018
124,794
133,131157,688
123,192
235,649
133,875
55,553
74,908
82,086 67,374
40,056 46,803 49,354 55,14163,563
Top Three Identity Theft Report Types by YearTheft TypeCredit Card FraudEmployment or Tax-Related FraudPhone or Utilities Fraud
CONSUMER SENTINEL NETWORK DATA BOOK 2018_____________________________________________________________________________________________

_________________________________________________________________________________________________________________________________________FEDERAL TRADE COMMISSION · ftc.gov/data 16
Theft Type 19 andUnder 20 - 29 30 - 39 40 - 49 50 - 59 60 - 69 70 - 79 80 and
Over
Bank Fraud
Credit Card Fraud
Employment or Tax-Related Fraud
Government Documents or BenefitsFraud
Loan or Lease Fraud
Other Identity Theft
Phone or Utilities Fraud 528
988
249
824
1,186
1,980
1,053
1,637
3,164
820
1,462
2,455
6,363
2,852
4,979
8,524
2,847
3,988
6,203
16,214
6,531
8,586
14,876
6,391
3,963
9,051
24,095
8,444
12,621
23,461
11,459
4,638
10,585
32,048
9,575
18,027
31,878
15,556
4,600
13,803
40,182
11,508
13,468
20,448
10,596
3,326
13,747
24,863
9,055
957
2,118
830
1,071
7,860
1,565
1,405
Identity Theft Types by Age
19 and Under
20 - 29
30 - 39
40 - 49
50 - 59
60 - 69
70 - 79
80 and Over
107,367
14,251
76,760
84,165
63,229
42,704
16,462
5,989
Identity Theft Reports by Age
CONSUMER SENTINEL NETWORK DATA BOOK 2018_____________________________________________________________________________________________
Of the 444,602 total identity theft reports in 2018, 92% included consumer age information.

Fraud, Identity Theft, and Other Reports by Military Consumers
CONSUMER SENTINEL NETWORK DATA BOOK 2018_____________________________________________________________________________________________
_________________________________________________________________________________________________________________________________________FEDERAL TRADE COMMISSION · ftc.gov/data 17
Status # of Reports # of FraudReports
% ReportingFraud Loss
Total FraudLoss
Median FraudLoss
Active Duty Service Member
Dependent Child\Other - Service Member
Dependent Spouse - Service Member
Inactive Reserve\National Guard
Military Retiree\Veteran $900
$555
$700
$500
$506
$55M
$3M
$12M
$4M
$6M
14%
18%
13%
29%
27%
38,620
2,328
9,057
750
2,919
84,216
5,895
13,280
2,206
9,047
Reports by Status
Of the 122,519 total reports from military consumers in 2018, 94% provided military status information.
Branch # of Reports # of FraudReports
% ReportingFraud Loss
Total FraudLoss
Median FraudLoss
U.S. Air Force
U.S. Army
U.S. Coast Guard
U.S. Marines
U.S. Navy $800
$869
$500
$800
$800
$14M
$8M
$3M
$31M
$18M
14%
16%
14%
15%
15%
11,514
4,775
926
24,752
10,051
42,338
9,036
1,595
42,102
17,084
Reports by Branch
Of the 122,519 total reports from military consumers in 2018, 92% provided military branch information.
Rank # of Reports # of FraudReports
% ReportingFraud Loss
Total FraudLoss
MedianFraud Loss
Enlisted
Officer $500
$599
$11M
$16M
22%
26%
2,625
9,160
8,979
40,843
Reports by Rank
Of the 122,519 total reports from military consumers in 2018, 41% provided information about rank.

Rank Category # of Reports1 Credit Bureaus, Information Furnishers and Report Users2 Debt Collection3 Banks and Lenders4 Credit Cards5 Auto Related6 Education7 Home Repair, Improvement and Products8 Television and Electronic Media9 Computer Equipment and Software10 Funeral Services
9,6626,4746,4362,3301,9191,1655593658513
Other Categories
Fraud
Identity Theft
Other
59,267
28,660
34,757
Reports by Military Consumers
Rank Theft Type # of Reports1 Credit Card Fraud2 Other Identity Theft3 Bank Fraud4 Phone or Utilities Fraud5 Employment or Tax-Related Fraud6 Loan or Lease Fraud7 Government Documents or Benefits Fraud
10,1395,9885,3804,5354,0222,8162,432
Identity Theft Types
Certain Fraud categories are comprised of subcategories that fall in both Fraud and Other report types. See Appendix B3. The Fraud rankings exclude subcategoriesthat are not fraud.
Rank Category # ofReports
%Reporting$ Loss
Total $Loss
Median $Loss
1 Imposter Scams2 Telephone and Mobile Services3 Shop-at-Home and Catalog Sales4 Prizes, Sweepstakes and Lotteries5 Foreign Money Offers and Counterfeit Check Scams6 Internet Services7 Business and Job Opportunities8 Mortgage Foreclosure Relief and Debt Management9 Advance Payments for Credit Services10 Grants
$900$34.0M11%36,090$234$2.2M10%3,786$154$2.1M70%2,665$3,150$10.4M24%1,660$2,000$3.7M25%1,450$200$1.8M20%1,326$6,150$6.7M41%714$1,766$0.9M46%501$777$0.9M39%435$1,000$0.6M19%419
Top 10 Fraud Categories
_________________________________________________________________________________________________________________________________________FEDERAL TRADE COMMISSION · ftc.gov/data 18
CONSUMER SENTINEL NETWORK DATA BOOK 2018_____________________________________________________________________________________________
59,267 # of Fraud Reports
$96M Total $ Loss
$798 Median $ Loss
9,784 (17%) # of Reports with $ Loss
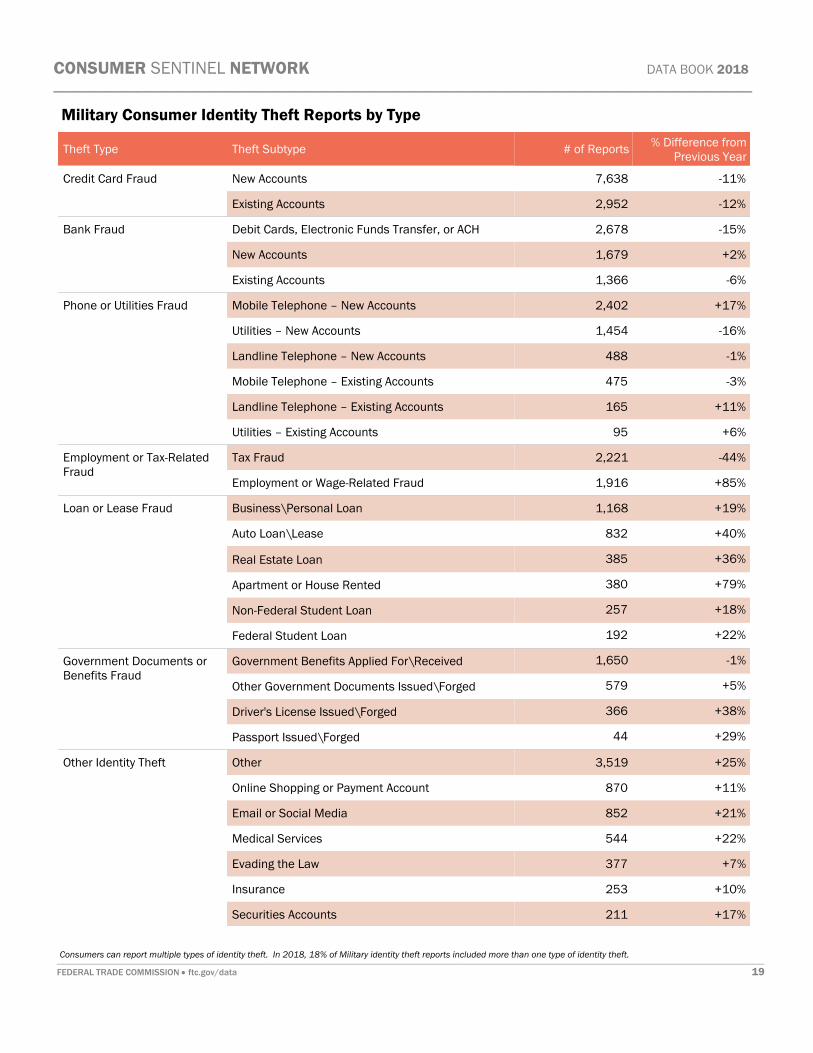
_________________________________________________________________________________________________________________________________________FEDERAL TRADE COMMISSION · ftc.gov/data 19
Theft Type Theft Subtype # of Reports % Difference fromPrevious Year
Credit Card Fraud New Accounts
Existing Accounts
Bank Fraud Debit Cards, Electronic Funds Transfer, or ACH
New Accounts
Existing Accounts
Phone or Utilities Fraud Mobile Telephone – New Accounts
Utilities – New Accounts
Landline Telephone – New Accounts
Mobile Telephone – Existing Accounts
Landline Telephone – Existing Accounts
Utilities – Existing Accounts
Employment or Tax-RelatedFraud
Tax Fraud
Employment or Wage-Related Fraud
Loan or Lease Fraud Business\Personal Loan
Auto Loan\Lease
Real Estate Loan
Apartment or House Rented
Non-Federal Student Loan
Federal Student Loan
Government Documents orBenefits Fraud
Government Benefits Applied For\Received
Other Government Documents Issued\Forged
Driver's License Issued\Forged
Passport Issued\Forged
Other Identity Theft Other
Online Shopping or Payment Account
Email or Social Media
Medical Services
Evading the Law
Insurance
Securities Accounts
-12%
-11%
2,952
7,638
-6%
+2%
-15%
1,366
1,679
2,678
+6%
+11%
-3%
-1%
-16%
+17%
95
165
475
488
1,454
2,402
+85%
-44%
1,916
2,221
+22%
+18%
+79%
+36%
+40%
+19%
192
257
380
385
832
1,168
+29%
+38%
+5%
-1%
44
366
579
1,650
+17%
+10%
+7%
+22%
+21%
+11%
+25%
211
253
377
544
852
870
3,519
Military Consumer Identity Theft Reports by Type
CONSUMER SENTINEL NETWORK DATA BOOK 2018_____________________________________________________________________________________________
Consumers can report multiple types of identity theft. In 2018, 18% of Military identity theft reports included more than one type of identity theft.

CONSUMER SENTINEL NETWORK DATA BOOK 2018_____________________________________________________________________________________________
_________________________________________________________________________________________________________________________________________FEDERAL TRADE COMMISSION · ftc.gov/data 20
State Rankings: Fraud and Other Reports
Rank State Reports per100K Population # of Reports
1 Florida2 Georgia3 Nevada4 Delaware5 Tennessee6 Maryland7 Arizona8 Texas9 South Carolina10 Michigan11 Alabama12 Colorado13 Virginia14 Missouri15 New Mexico16 North Carolina17 California18 Ohio19 New Jersey20 Pennsylvania21 Oregon22 New York23 Rhode Island24 Connecticut25 Washington26 Louisiana
210,1741,00293,24989426,0888707,74380553,01478945,29874851,816739204,53172336,06271871,33971633,53968837,68667256,13566340,16565713,57365066,486647250,50963473,21262856,43862777,71460725,120606117,5675926,21058621,02258643,11358227,236581
RankState Reports per100K Population # of Reports
27 Illinois28 New Hampshire29 Montana30 West Virginia31 Idaho32 Kansas33 Kentucky34 Indiana35 Mississippi36 Massachusetts37 Arkansas38 Minnesota39 Wisconsin40 Utah41 Oklahoma42 Alaska43 Maine44 Wyoming45 Hawaii46 Nebraska47 Vermont48 Iowa49 South Dakota50 North Dakota
73,0005707,6425695,94356610,1345589,56055715,99954923,70753235,36653015,79052935,86952315,69252228,47151128,95250015,35649519,3474923,5314776,3404752,6474576,5164568,4164382,69043113,3294243,0743532,549337
District of ColumbiaPuerto Rico 3,037
8,18291
1,179
The District of Columbia and Puerto Rico are included in the table but are not ranked. States are ranked based on the number of reports per 100,000 populations. Populationestimates are based on 2017 U.S. Census population estimates. Ranking excludes state-specific data contributor reports.

CONSUMER SENTINEL NETWORK DATA BOOK 2018_____________________________________________________________________________________________
_________________________________________________________________________________________________________________________________________FEDERAL TRADE COMMISSION · ftc.gov/data 21
State Rankings: Identity Theft Reports
RankState Reports per100K Population # of Reports
1 Georgia2 Nevada3 California4 Florida5 Texas6 Delaware7 Maryland8 Michigan9 Illinois10 Arizona11 South Carolina12 New Jersey13 New York14 New Hampshire15 North Carolina16 Louisiana17 Colorado18 Connecticut19 Alabama20 Pennsylvania21 Tennessee22 Oregon23 Washington24 Mississippi25 Virginia26 New Mexico
23,8712295,81619473,66818637,79718045,0301591,5171588,74714513,95214016,2961278,8531266,33912611,27312524,2481221,56511711,4811125,2021116,1511103,8641085,24110813,7251076,8081014,1791017,3801002,894978,196972,00096
RankState Reports per100K Population # of Reports
27 Utah28 Rhode Island29 Massachusetts30 Ohio31 Missouri32 Idaho33 Oklahoma34 Montana35 Indiana36 Kansas37 Arkansas38 Minnesota39 Hawaii40 Alaska41 Nebraska42 Wisconsin43 North Dakota44 Wyoming45 West Virginia46 Kentucky47 South Dakota48 Maine49 Iowa50 Vermont
2,91594990936,3879310,268885,222851,368803,10979799764,918742,142742,197734,070731,02172507691,281673,7316447463338581,051582,5225748656744561,6545331651
District of ColumbiaPuerto Rico 1,710
1,15651167
The District of Columbia and Puerto Rico are included in the table but are not ranked. States are ranked based on the number of reports per 100,000 populations. Populationestimates are based on 2017 U.S. Census population estimates.

CONSUMER SENTINEL NETWORK DATA BOOK 2018_____________________________________________________________________________________________
_________________________________________________________________________________________________________________________________________FEDERAL TRADE COMMISSION · ftc.gov/data 22
Alabama
Debt Collection
Imposter Scams
Identity Theft
Prizes, Sweepstakes andLotteries
Telephone and MobileServices
Credit Bureaus, InformationFurnishers and Report Users
Banks and Lenders
Shop-at-Home and CatalogSales
Auto Related
Internet Services
23%
16%
13%
7%
5%
5%
4%
4%
3%
1%
Top Ten Report Categories
Credit Card Fraud
Other Identity Theft
Phone or Utilities Fraud
Loan or Lease Fraud
Employment or Tax-Related Fraud
32%
29%
18%
17%
16%
Top Identity Theft Types
Fraud & Other Reports
33,539 Total Fraud & Other Reports
$9.9M Total Fraud Losses
$319 Median Fraud Losses
11th State Rank (Reports per 100K Population)
19th State Rank (Reports per 100K Population)
Fraud & Other Reports by Metropolitan Area
Identity Theft Reports
5,241 Identity Theft Reports
Percentages are based on the total number of relevant 2018 reports from Alabama consumers, as indicated in the chart title. Consumers can report multiple types of identity theft.
442
Reports per 100K Population
722
Fraud Losses

CONSUMER SENTINEL NETWORK DATA BOOK 2018_____________________________________________________________________________________________
_________________________________________________________________________________________________________________________________________FEDERAL TRADE COMMISSION · ftc.gov/data 23
Alaska
Imposter Scams
Identity Theft
Prizes, Sweepstakes andLotteries
Telephone and MobileServices
Shop-at-Home and CatalogSales
Banks and Lenders
Debt Collection
Credit Bureaus, InformationFurnishers and Report Users
Auto Related
Internet Services
20%
13%
11%
8%
6%
4%
4%
3%
3%
3%
Top Ten Report Categories
Credit Card Fraud
Other Identity Theft
Phone or Utilities Fraud
Employment or Tax-Related Fraud
Bank Fraud
38%
24%
19%
15%
15%
Top Identity Theft Types
Fraud & Other Reports
3,531 Total Fraud & Other Reports
$3.6M Total Fraud Losses
$471 Median Fraud Losses
42nd State Rank (Reports per 100K Population)
40th State Rank (Reports per 100K Population)
Fraud & Other Reports by Metropolitan Area
Identity Theft Reports
507 Identity Theft Reports
Percentages are based on the total number of relevant 2018 reports from Alaska consumers, as indicated in the chart title. This page excludes reports provided by the AlaskaAttorney General. Consumers can report multiple types of identity theft.
472
Reports per 100K Population
483
Fraud Losses

CONSUMER SENTINEL NETWORK DATA BOOK 2018_____________________________________________________________________________________________
_________________________________________________________________________________________________________________________________________FEDERAL TRADE COMMISSION · ftc.gov/data 24
Arizona
Imposter Scams
Identity Theft
Debt Collection
Telephone and MobileServices
Banks and Lenders
Prizes, Sweepstakes andLotteries
Credit Bureaus, InformationFurnishers and Report Users
Auto Related
Shop-at-Home and CatalogSales
Internet Services
19%
15%
13%
7%
5%
4%
4%
4%
4%
2%
Top Ten Report Categories
Credit Card Fraud
Other Identity Theft
Employment or Tax-Related Fraud
Phone or Utilities Fraud
Bank Fraud
30%
26%
24%
14%
13%
Top Identity Theft Types
Fraud & Other Reports
51,816 Total Fraud & Other Reports
$28.9M Total Fraud Losses
$400 Median Fraud Losses
7th State Rank (Reports per 100K Population)
10th State Rank (Reports per 100K Population)
Fraud & Other Reports by Metropolitan Area
Identity Theft Reports
8,853 Identity Theft Reports
Percentages are based on the total number of relevant 2018 reports from Arizona consumers, as indicated in the chart title. Consumers can report multiple types of identity theft.
304
Reports per 100K Population
809
Fraud Losses

CONSUMER SENTINEL NETWORK DATA BOOK 2018_____________________________________________________________________________________________
_________________________________________________________________________________________________________________________________________FEDERAL TRADE COMMISSION · ftc.gov/data 25
Arkansas
Imposter Scams
Debt Collection
Identity Theft
Prizes, Sweepstakes andLotteries
Credit Bureaus, InformationFurnishers and Report Users
Telephone and MobileServices
Shop-at-Home and CatalogSales
Banks and Lenders
Auto Related
Internet Services
19%
16%
12%
9%
5%
5%
5%
4%
3%
2%
Top Ten Report Categories
Credit Card Fraud
Other Identity Theft
Employment or Tax-Related Fraud
Phone or Utilities Fraud
Bank Fraud
30%
24%
19%
17%
14%
Top Identity Theft Types
Fraud & Other Reports
15,692 Total Fraud & Other Reports
$5.0M Total Fraud Losses
$385 Median Fraud Losses
37th State Rank (Reports per 100K Population)
37th State Rank (Reports per 100K Population)
Fraud & Other Reports by Metropolitan Area
Identity Theft Reports
2,197 Identity Theft Reports
Percentages are based on the total number of relevant 2018 reports from Arkansas consumers, as indicated in the chart title. Consumers can report multiple types of identitytheft.
374
Reports per 100K Population
663
Fraud Losses

CONSUMER SENTINEL NETWORK DATA BOOK 2018_____________________________________________________________________________________________
_________________________________________________________________________________________________________________________________________FEDERAL TRADE COMMISSION · ftc.gov/data 26
California
Identity Theft
Debt Collection
Imposter Scams
Credit Bureaus, InformationFurnishers and Report Users
Telephone and MobileServices
Banks and Lenders
Shop-at-Home and CatalogSales
Auto Related
Prizes, Sweepstakes andLotteries
Internet Services
23%
18%
14%
5%
5%
5%
4%
3%
3%
2%
Top Ten Report Categories
Credit Card Fraud
Other Identity Theft
Employment or Tax-Related Fraud
Phone or Utilities Fraud
Bank Fraud
41%
30%
15%
10%
10%
Top Identity Theft Types
Fraud & Other Reports
250,509 Total Fraud & Other Reports
$173.2M Total Fraud Losses
$400 Median Fraud Losses
17th State Rank (Reports per 100K Population)
3rd State Rank (Reports per 100K Population)
Fraud & Other Reports by Metropolitan Area
Identity Theft Reports
73,668 Identity Theft Reports
Percentages are based on the total number of relevant 2018 reports from California consumers, as indicated in the chart title. Consumers can report multiple types of identitytheft.
285
Reports per 100K Population
628
Fraud Losses

CONSUMER SENTINEL NETWORK DATA BOOK 2018_____________________________________________________________________________________________
_________________________________________________________________________________________________________________________________________FEDERAL TRADE COMMISSION · ftc.gov/data 27
Colorado
Imposter Scams
Identity Theft
Debt Collection
Telephone and MobileServices
Banks and Lenders
Shop-at-Home and CatalogSales
Auto Related
Prizes, Sweepstakes andLotteries
Credit Bureaus, InformationFurnishers and Report Users
Internet Services
20%
14%
11%
6%
5%
5%
4%
4%
4%
3%
Top Ten Report Categories
Credit Card Fraud
Employment or Tax-Related Fraud
Other Identity Theft
Phone or Utilities Fraud
Bank Fraud
34%
21%
21%
18%
15%
Top Identity Theft Types
Fraud & Other Reports
37,686 Total Fraud & Other Reports
$23.2M Total Fraud Losses
$365 Median Fraud Losses
12th State Rank (Reports per 100K Population)
17th State Rank (Reports per 100K Population)
Fraud & Other Reports by Metropolitan Area
Identity Theft Reports
6,151 Identity Theft Reports
Percentages are based on the total number of relevant 2018 reports from Colorado consumers, as indicated in the chart title. This page excludes reports provided by the ColoradoAttorney General. Consumers can report multiple types of identity theft.
501
Reports per 100K Population
643
Fraud Losses

CONSUMER SENTINEL NETWORK DATA BOOK 2018_____________________________________________________________________________________________
_________________________________________________________________________________________________________________________________________FEDERAL TRADE COMMISSION · ftc.gov/data 28
Connecticut
Imposter Scams
Identity Theft
Debt Collection
Banks and Lenders
Telephone and MobileServices
Shop-at-Home and CatalogSales
Auto Related
Credit Bureaus, InformationFurnishers and Report Users
Prizes, Sweepstakes andLotteries
Internet Services
18%
15%
12%
6%
5%
5%
5%
4%
3%
3%
Top Ten Report Categories
Credit Card Fraud
Phone or Utilities Fraud
Employment or Tax-Related Fraud
Other Identity Theft
Bank Fraud
40%
21%
18%
17%
13%
Top Identity Theft Types
Fraud & Other Reports
21,022 Total Fraud & Other Reports
$8.5M Total Fraud Losses
$311 Median Fraud Losses
24th State Rank (Reports per 100K Population)
18th State Rank (Reports per 100K Population)
Fraud & Other Reports by Metropolitan Area
Identity Theft Reports
3,864 Identity Theft Reports
Percentages are based on the total number of relevant 2018 reports from Connecticut consumers, as indicated in the chart title. Consumers can report multiple types of identitytheft.
462
Reports per 100K Population
554
Fraud Losses

CONSUMER SENTINEL NETWORK DATA BOOK 2018_____________________________________________________________________________________________
_________________________________________________________________________________________________________________________________________FEDERAL TRADE COMMISSION · ftc.gov/data 29
Delaware
Imposter Scams
Identity Theft
Debt Collection
Banks and Lenders
Credit Bureaus, InformationFurnishers and Report Users
Shop-at-Home and CatalogSales
Prizes, Sweepstakes andLotteries
Auto Related
Telephone and MobileServices
Credit Cards
17%
16%
16%
6%
6%
4%
4%
4%
4%
3%
Top Ten Report Categories
Credit Card Fraud
Phone or Utilities Fraud
Other Identity Theft
Loan or Lease Fraud
Bank Fraud
35%
30%
19%
14%
10%
Top Identity Theft Types
Fraud & Other Reports
7,743 Total Fraud & Other Reports
$2.6M Total Fraud Losses
$313 Median Fraud Losses
4th State Rank (Reports per 100K Population)
6th State Rank (Reports per 100K Population)
Fraud & Other Reports by Metropolitan Area
Identity Theft Reports
1,517 Identity Theft Reports
Percentages are based on the total number of relevant 2018 reports from Delaware consumers, as indicated in the chart title. Consumers can report multiple types of identitytheft.
513
Reports per 100K Population
696
Fraud Losses

CONSUMER SENTINEL NETWORK DATA BOOK 2018_____________________________________________________________________________________________
_________________________________________________________________________________________________________________________________________FEDERAL TRADE COMMISSION · ftc.gov/data 30
District of Columbia
Debt Collection
Imposter Scams
Identity Theft
Banks and Lenders
Credit Bureaus, InformationFurnishers and Report Users
Telephone and MobileServices
Shop-at-Home and CatalogSales
Auto Related
Credit Cards
Internet Services
21%
15%
12%
7%
6%
6%
4%
3%
3%
2%
Top Ten Report Categories
Credit Card Fraud
Other Identity Theft
Phone or Utilities Fraud
Employment or Tax-Related Fraud
Loan or Lease Fraud
34%
24%
18%
15%
13%
Top Identity Theft Types
Fraud & Other Reports
8,182 Total Fraud & Other Reports
$4.0M Total Fraud Losses
$379 Median Fraud Losses
Fraud & Other Reports by Metropolitan Area
Identity Theft Reports
1,156 Identity Theft Reports
Percentages are based on the total number of relevant 2018 reports from District of Columbia consumers, as indicated in the chart title. Consumers can report multiple types ofidentity theft.
558
Reports per 100K Population
558
Fraud Losses

CONSUMER SENTINEL NETWORK DATA BOOK 2018_____________________________________________________________________________________________
_________________________________________________________________________________________________________________________________________FEDERAL TRADE COMMISSION · ftc.gov/data 31
Florida
Debt Collection
Identity Theft
Imposter Scams
Credit Bureaus, InformationFurnishers and Report Users
Banks and Lenders
Telephone and MobileServices
Auto Related
Shop-at-Home and CatalogSales
Prizes, Sweepstakes andLotteries
Internet Services
29%
15%
13%
6%
5%
4%
3%
3%
3%
2%
Top Ten Report Categories
Credit Card Fraud
Other Identity Theft
Bank Fraud
Phone or Utilities Fraud
Employment or Tax-Related Fraud
42%
27%
14%
13%
12%
Top Identity Theft Types
Fraud & Other Reports
210,174 Total Fraud & Other Reports
$84.2M Total Fraud Losses
$400 Median Fraud Losses
1st State Rank (Reports per 100K Population)
4th State Rank (Reports per 100K Population)
Fraud & Other Reports by Metropolitan Area
Identity Theft Reports
37,797 Identity Theft Reports
Percentages are based on the total number of relevant 2018 reports from Florida consumers, as indicated in the chart title. Consumers can report multiple types of identity theft.
551
Reports per 100K Population
1,525
Fraud Losses

CONSUMER SENTINEL NETWORK DATA BOOK 2018_____________________________________________________________________________________________
_________________________________________________________________________________________________________________________________________FEDERAL TRADE COMMISSION · ftc.gov/data 32
Georgia
Debt Collection
Identity Theft
Imposter Scams
Credit Bureaus, InformationFurnishers and Report Users
Banks and Lenders
Telephone and MobileServices
Auto Related
Shop-at-Home and CatalogSales
Prizes, Sweepstakes andLotteries
Credit Cards
24%
20%
10%
8%
5%
4%
4%
3%
3%
2%
Top Ten Report Categories
Other Identity Theft
Credit Card Fraud
Loan or Lease Fraud
Phone or Utilities Fraud
Bank Fraud
40%
36%
20%
14%
8%
Top Identity Theft Types
Fraud & Other Reports
93,249 Total Fraud & Other Reports
$31.1M Total Fraud Losses
$326 Median Fraud Losses
2nd State Rank (Reports per 100K Population)
1st State Rank (Reports per 100K Population)
Fraud & Other Reports by Metropolitan Area
Identity Theft Reports
23,871 Identity Theft Reports
Percentages are based on the total number of relevant 2018 reports from Georgia consumers, as indicated in the chart title. Consumers can report multiple types of identity theft.
322
Reports per 100K Population
824
Fraud Losses
CONSUMER SENTINEL NETWORK DATA BOOK 2018_____________________________________________________________________________________________
_________________________________________________________________________________________________________________________________________FEDERAL TRADE COMMISSION · ftc.gov/data 33
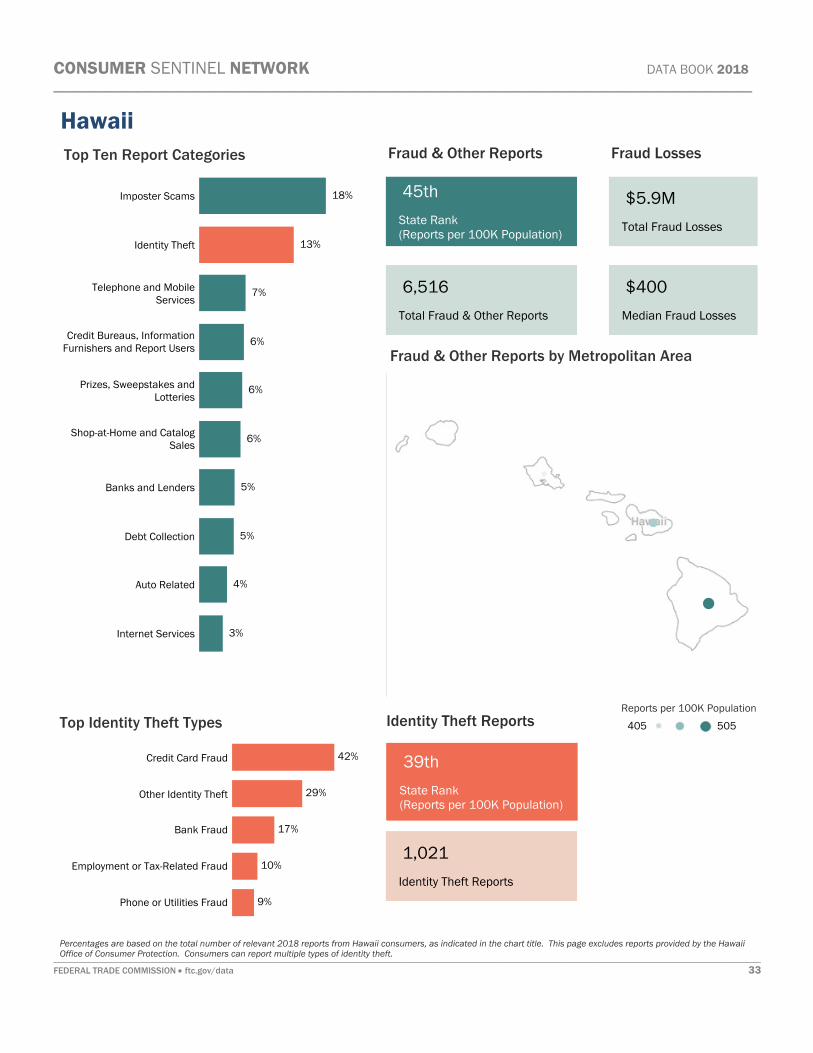
Hawaii
Imposter Scams
Identity Theft
Telephone and MobileServices
Credit Bureaus, InformationFurnishers and Report Users
Prizes, Sweepstakes andLotteries
Shop-at-Home and CatalogSales
Banks and Lenders
Debt Collection
Auto Related
Internet Services
18%
13%
7%
6%
6%
6%
5%
5%
4%
3%
Top Ten Report Categories
Credit Card Fraud
Other Identity Theft
Bank Fraud
Employment or Tax-Related Fraud
Phone or Utilities Fraud
42%
29%
17%
10%
9%
Top Identity Theft Types
Fraud & Other Reports
6,516 Total Fraud & Other Reports
$5.9M Total Fraud Losses
$400 Median Fraud Losses
45th State Rank (Reports per 100K Population)
39th State Rank (Reports per 100K Population)
Fraud & Other Reports by Metropolitan Area
Identity Theft Reports
1,021 Identity Theft Reports
Percentages are based on the total number of relevant 2018 reports from Hawaii consumers, as indicated in the chart title. This page excludes reports provided by the HawaiiOffice of Consumer Protection. Consumers can report multiple types of identity theft.
405
Reports per 100K Population
505
Fraud Losses

CONSUMER SENTINEL NETWORK DATA BOOK 2018_____________________________________________________________________________________________
_________________________________________________________________________________________________________________________________________FEDERAL TRADE COMMISSION · ftc.gov/data 34
Idaho
Imposter Scams
Identity Theft
Debt Collection
Telephone and MobileServices
Prizes, Sweepstakes andLotteries
Shop-at-Home and CatalogSales
Banks and Lenders
Auto Related
Internet Services
Credit Bureaus, InformationFurnishers and Report Users
24%
12%
11%
6%
6%
5%
4%
3%
3%
2%
Top Ten Report Categories
Credit Card Fraud
Other Identity Theft
Employment or Tax-Related Fraud
Loan or Lease Fraud
Bank Fraud
31%
25%
16%
14%
14%
Top Identity Theft Types
Fraud & Other Reports
9,560 Total Fraud & Other Reports
$4.8M Total Fraud Losses
$400 Median Fraud Losses
31st State Rank (Reports per 100K Population)
32nd State Rank (Reports per 100K Population)
Fraud & Other Reports by Metropolitan Area
Identity Theft Reports
1,368 Identity Theft Reports
Percentages are based on the total number of relevant 2018 reports from Idaho consumers, as indicated in the chart title. This page excludes reports provided by the IdahoAttorney General. Consumers can report multiple types of identity theft.
303
Reports per 100K Population
561
Fraud Losses

CONSUMER SENTINEL NETWORK DATA BOOK 2018_____________________________________________________________________________________________
_________________________________________________________________________________________________________________________________________FEDERAL TRADE COMMISSION · ftc.gov/data 35
Illinois
Identity Theft
Imposter Scams
Debt Collection
Credit Bureaus, InformationFurnishers and Report Users
Banks and Lenders
Telephone and MobileServices
Shop-at-Home and CatalogSales
Auto Related
Prizes, Sweepstakes andLotteries
Internet Services
18%
15%
12%
8%
6%
5%
5%
4%
4%
2%
Top Ten Report Categories
Credit Card Fraud
Other Identity Theft
Phone or Utilities Fraud
Employment or Tax-Related Fraud
Loan or Lease Fraud
37%
23%
19%
15%
12%
Top Identity Theft Types
Fraud & Other Reports
73,000 Total Fraud & Other Reports
$30.5M Total Fraud Losses
$300 Median Fraud Losses
27th State Rank (Reports per 100K Population)
9th State Rank (Reports per 100K Population)
Fraud & Other Reports by Metropolitan Area
Identity Theft Reports
16,296 Identity Theft Reports
Percentages are based on the total number of relevant 2018 reports from Illinois consumers, as indicated in the chart title. Consumers can report multiple types of identity theft.
358
Reports per 100K Population
716
Fraud Losses

CONSUMER SENTINEL NETWORK DATA BOOK 2018_____________________________________________________________________________________________
_________________________________________________________________________________________________________________________________________FEDERAL TRADE COMMISSION · ftc.gov/data 36
Indiana
Imposter Scams
Debt Collection
Identity Theft
Prizes, Sweepstakes andLotteries
Telephone and MobileServices
Shop-at-Home and CatalogSales
Banks and Lenders
Auto Related
Credit Bureaus, InformationFurnishers and Report Users
Internet Services
20%
14%
12%
6%
5%
5%
5%
4%
3%
2%
Top Ten Report Categories
Credit Card Fraud
Other Identity Theft
Phone or Utilities Fraud
Employment or Tax-Related Fraud
Bank Fraud
30%
26%
20%
16%
13%
Top Identity Theft Types
Fraud & Other Reports
35,366 Total Fraud & Other Reports
$16.9M Total Fraud Losses
$358 Median Fraud Losses
34th State Rank (Reports per 100K Population)
35th State Rank (Reports per 100K Population)
Fraud & Other Reports by Metropolitan Area
Identity Theft Reports
4,918 Identity Theft Reports
Percentages are based on the total number of relevant 2018 reports from Indiana consumers, as indicated in the chart title. This page excludes reports provided by the IndianaAttorney General. Consumers can report multiple types of identity theft.
322
Reports per 100K Population
563
Fraud Losses

CONSUMER SENTINEL NETWORK DATA BOOK 2018_____________________________________________________________________________________________
_________________________________________________________________________________________________________________________________________FEDERAL TRADE COMMISSION · ftc.gov/data 37
Iowa
Imposter Scams
Identity Theft
Telephone and MobileServices
Prizes, Sweepstakes andLotteries
Shop-at-Home and CatalogSales
Debt Collection
Banks and Lenders
Auto Related
Internet Services
Credit Bureaus, InformationFurnishers and Report Users
26%
11%
8%
7%
6%
5%
4%
3%
2%
2%
Top Ten Report Categories
Credit Card Fraud
Other Identity Theft
Employment or Tax-Related Fraud
Bank Fraud
Phone or Utilities Fraud
38%
20%
16%
16%
15%
Top Identity Theft Types
Fraud & Other Reports
13,329 Total Fraud & Other Reports
$7.4M Total Fraud Losses
$400 Median Fraud Losses
48th State Rank (Reports per 100K Population)
49th State Rank (Reports per 100K Population)
Fraud & Other Reports by Metropolitan Area
Identity Theft Reports
1,654 Identity Theft Reports
Percentages are based on the total number of relevant 2018 reports from Iowa consumers, as indicated in the chart title. This page excludes reports provided by the Iowa AttorneyGeneral. Consumers can report multiple types of identity theft.
299
Reports per 100K Population
506
Fraud Losses

CONSUMER SENTINEL NETWORK DATA BOOK 2018_____________________________________________________________________________________________
_________________________________________________________________________________________________________________________________________FEDERAL TRADE COMMISSION · ftc.gov/data 38
Kansas
Imposter Scams
Debt Collection
Identity Theft
Prizes, Sweepstakes andLotteries
Telephone and MobileServices
Shop-at-Home and CatalogSales
Banks and Lenders
Auto Related
Credit Bureaus, InformationFurnishers and Report Users
Internet Services
23%
12%
12%
8%
7%
4%
4%
4%
3%
2%
Top Ten Report Categories
Credit Card Fraud
Other Identity Theft
Bank Fraud
Employment or Tax-Related Fraud
Phone or Utilities Fraud
36%
21%
19%
17%
13%
Top Identity Theft Types
Fraud & Other Reports
15,999 Total Fraud & Other Reports
$9.8M Total Fraud Losses
$397 Median Fraud Losses
32nd State Rank (Reports per 100K Population)
36th State Rank (Reports per 100K Population)
Fraud & Other Reports by Metropolitan Area
Identity Theft Reports
2,142 Identity Theft Reports
Percentages are based on the total number of relevant 2018 reports from Kansas consumers, as indicated in the chart title. Consumers can report multiple types of identity theft.
367
Reports per 100K Population
592
Fraud Losses

CONSUMER SENTINEL NETWORK DATA BOOK 2018_____________________________________________________________________________________________
_________________________________________________________________________________________________________________________________________FEDERAL TRADE COMMISSION · ftc.gov/data 39
Kentucky
Imposter Scams
Debt Collection
Identity Theft
Telephone and MobileServices
Prizes, Sweepstakes andLotteries
Shop-at-Home and CatalogSales
Banks and Lenders
Auto Related
Credit Bureaus, InformationFurnishers and Report Users
Internet Services
20%
15%
10%
6%
6%
5%
4%
4%
3%
2%
Top Ten Report Categories
Credit Card Fraud
Other Identity Theft
Phone or Utilities Fraud
Employment or Tax-Related Fraud
Bank Fraud
35%
23%
17%
16%
15%
Top Identity Theft Types
Fraud & Other Reports
23,707 Total Fraud & Other Reports
$10.2M Total Fraud Losses
$318 Median Fraud Losses
33rd State Rank (Reports per 100K Population)
46th State Rank (Reports per 100K Population)
Fraud & Other Reports by Metropolitan Area
Identity Theft Reports
2,522 Identity Theft Reports
Percentages are based on the total number of relevant 2018 reports from Kentucky consumers, as indicated in the chart title. Consumers can report multiple types of identitytheft.
362
Reports per 100K Population
563
Fraud Losses

CONSUMER SENTINEL NETWORK DATA BOOK 2018_____________________________________________________________________________________________
_________________________________________________________________________________________________________________________________________FEDERAL TRADE COMMISSION · ftc.gov/data 40
Louisiana
Debt Collection
Identity Theft
Imposter Scams
Credit Bureaus, InformationFurnishers and Report Users
Telephone and MobileServices
Prizes, Sweepstakes andLotteries
Banks and Lenders
Shop-at-Home and CatalogSales
Auto Related
Credit Cards
18%
16%
16%
7%
5%
5%
5%
4%
3%
2%
Top Ten Report Categories
Other Identity Theft
Credit Card Fraud
Loan or Lease Fraud
Phone or Utilities Fraud
Employment or Tax-Related Fraud
34%
31%
20%
17%
13%
Top Identity Theft Types
Fraud & Other Reports
27,236 Total Fraud & Other Reports
$28.6M Total Fraud Losses
$391 Median Fraud Losses
26th State Rank (Reports per 100K Population)
16th State Rank (Reports per 100K Population)
Fraud & Other Reports by Metropolitan Area
Identity Theft Reports
5,202 Identity Theft Reports
Percentages are based on the total number of relevant 2018 reports from Louisiana consumers, as indicated in the chart title. This page excludes reports provided by theLouisiana Attorney General. Consumers can report multiple types of identity theft.
378
Reports per 100K Population
618
Fraud Losses

CONSUMER SENTINEL NETWORK DATA BOOK 2018_____________________________________________________________________________________________
_________________________________________________________________________________________________________________________________________FEDERAL TRADE COMMISSION · ftc.gov/data 41
Maine
Imposter Scams
Identity Theft
Telephone and MobileServices
Debt Collection
Prizes, Sweepstakes andLotteries
Shop-at-Home and CatalogSales
Banks and Lenders
Auto Related
Internet Services
Credit Cards
24%
10%
8%
7%
7%
5%
5%
3%
3%
2%
Top Ten Report Categories
Credit Card Fraud
Other Identity Theft
Government Documents or BenefitsFraud
Bank Fraud
Employment or Tax-Related Fraud
33%
19%
17%
15%
12%
Top Identity Theft Types
Fraud & Other Reports
6,340 Total Fraud & Other Reports
$2.5M Total Fraud Losses
$350 Median Fraud Losses
43rd State Rank (Reports per 100K Population)
48th State Rank (Reports per 100K Population)
Fraud & Other Reports by Metropolitan Area
Identity Theft Reports
744 Identity Theft Reports
Percentages are based on the total number of relevant 2018 reports from Maine consumers, as indicated in the chart title. This page excludes reports provided by the MaineAttorney General. Consumers can report multiple types of identity theft.
388
Reports per 100K Population
538
Fraud Losses

CONSUMER SENTINEL NETWORK DATA BOOK 2018_____________________________________________________________________________________________
_________________________________________________________________________________________________________________________________________FEDERAL TRADE COMMISSION · ftc.gov/data 42
Maryland
Identity Theft
Imposter Scams
Debt Collection
Banks and Lenders
Credit Bureaus, InformationFurnishers and Report Users
Telephone and MobileServices
Shop-at-Home and CatalogSales
Auto Related
Prizes, Sweepstakes andLotteries
Credit Cards
16%
16%
14%
7%
5%
5%
4%
4%
3%
2%
Top Ten Report Categories
Credit Card Fraud
Other Identity Theft
Phone or Utilities Fraud
Employment or Tax-Related Fraud
Bank Fraud
37%
29%
16%
14%
11%
Top Identity Theft Types
Fraud & Other Reports
45,298 Total Fraud & Other Reports
$18.2M Total Fraud Losses
$350 Median Fraud Losses
6th State Rank (Reports per 100K Population)
7th State Rank (Reports per 100K Population)
Fraud & Other Reports by Metropolitan Area
Identity Theft Reports
8,747 Identity Theft Reports
Percentages are based on the total number of relevant 2018 reports from Maryland consumers, as indicated in the chart title. Consumers can report multiple types of identitytheft.
466
Reports per 100K Population
581
Fraud Losses

CONSUMER SENTINEL NETWORK DATA BOOK 2018_____________________________________________________________________________________________
_________________________________________________________________________________________________________________________________________FEDERAL TRADE COMMISSION · ftc.gov/data 43
Massachusetts
Imposter Scams
Identity Theft
Debt Collection
Shop-at-Home and CatalogSales
Banks and Lenders
Telephone and MobileServices
Auto Related
Credit Bureaus, InformationFurnishers and Report Users
Prizes, Sweepstakes andLotteries
Internet Services
20%
15%
11%
6%
6%
6%
4%
4%
4%
3%
Top Ten Report Categories
Credit Card Fraud
Other Identity Theft
Phone or Utilities Fraud
Bank Fraud
Employment or Tax-Related Fraud
40%
23%
15%
14%
14%
Top Identity Theft Types
Fraud & Other Reports
35,869 Total Fraud & Other Reports
$19.5M Total Fraud Losses
$351 Median Fraud Losses
36th State Rank (Reports per 100K Population)
29th State Rank (Reports per 100K Population)
Fraud & Other Reports by Metropolitan Area
Identity Theft Reports
6,387 Identity Theft Reports
Percentages are based on the total number of relevant 2018 reports from Massachusetts consumers, as indicated in the chart title. Consumers can report multiple types ofidentity theft.
432
Reports per 100K Population
506
Fraud Losses

CONSUMER SENTINEL NETWORK DATA BOOK 2018_____________________________________________________________________________________________
_________________________________________________________________________________________________________________________________________FEDERAL TRADE COMMISSION · ftc.gov/data 44
Michigan
Debt Collection
Identity Theft
Imposter Scams
Telephone and MobileServices
Shop-at-Home and CatalogSales
Banks and Lenders
Prizes, Sweepstakes andLotteries
Credit Bureaus, InformationFurnishers and Report Users
Auto Related
Internet Services
30%
16%
14%
5%
4%
4%
4%
3%
2%
2%
Top Ten Report Categories
Government Documents or BenefitsFraud
Other Identity Theft
Credit Card Fraud
Phone or Utilities Fraud
Employment or Tax-Related Fraud
23%
23%
23%
17%
15%
Top Identity Theft Types
Fraud & Other Reports
71,339 Total Fraud & Other Reports
$23.6M Total Fraud Losses
$300 Median Fraud Losses
10th State Rank (Reports per 100K Population)
8th State Rank (Reports per 100K Population)
Fraud & Other Reports by Metropolitan Area
Identity Theft Reports
13,952 Identity Theft Reports
Percentages are based on the total number of relevant 2018 reports from Michigan consumers, as indicated in the chart title. This page excludes reports provided by the MichiganAttorney General. Consumers can report multiple types of identity theft.
318
Reports per 100K Population
827
Fraud Losses

CONSUMER SENTINEL NETWORK DATA BOOK 2018_____________________________________________________________________________________________
_________________________________________________________________________________________________________________________________________FEDERAL TRADE COMMISSION · ftc.gov/data 45
Minnesota
Imposter Scams
Identity Theft
Debt Collection
Telephone and MobileServices
Prizes, Sweepstakes andLotteries
Shop-at-Home and CatalogSales
Banks and Lenders
Auto Related
Credit Bureaus, InformationFurnishers and Report Users
Internet Services
23%
12%
9%
7%
6%
5%
5%
3%
3%
3%
Top Ten Report Categories
Credit Card Fraud
Other Identity Theft
Employment or Tax-Related Fraud
Bank Fraud
Phone or Utilities Fraud
40%
21%
16%
15%
13%
Top Identity Theft Types
Fraud & Other Reports
28,471 Total Fraud & Other Reports
$15.4M Total Fraud Losses
$387 Median Fraud Losses
38th State Rank (Reports per 100K Population)
38th State Rank (Reports per 100K Population)
Fraud & Other Reports by Metropolitan Area
Identity Theft Reports
4,070 Identity Theft Reports
Percentages are based on the total number of relevant 2018 reports from Minnesota consumers, as indicated in the chart title. Consumers can report multiple types of identitytheft.
250
Reports per 100K Population
502
Fraud Losses

CONSUMER SENTINEL NETWORK DATA BOOK 2018_____________________________________________________________________________________________
_________________________________________________________________________________________________________________________________________FEDERAL TRADE COMMISSION · ftc.gov/data 46
Mississippi
Imposter Scams
Identity Theft
Debt Collection
Credit Bureaus, InformationFurnishers and Report Users
Prizes, Sweepstakes andLotteries
Telephone and MobileServices
Banks and Lenders
Shop-at-Home and CatalogSales
Auto Related
Television and ElectronicMedia
18%
15%
12%
7%
6%
6%
4%
4%
4%
2%
Top Ten Report Categories
Other Identity Theft
Credit Card Fraud
Employment or Tax-Related Fraud
Loan or Lease Fraud
Phone or Utilities Fraud
32%
28%
21%
19%
13%
Top Identity Theft Types
Fraud & Other Reports
15,790 Total Fraud & Other Reports
$7.7M Total Fraud Losses
$338 Median Fraud Losses
35th State Rank (Reports per 100K Population)
24th State Rank (Reports per 100K Population)
Fraud & Other Reports by Metropolitan Area
Identity Theft Reports
2,894 Identity Theft Reports
Percentages are based on the total number of relevant 2018 reports from Mississippi consumers, as indicated in the chart title. This page excludes reports provided by theMississippi Attorney General. Consumers can report multiple types of identity theft.
458
Reports per 100K Population
663
Fraud Losses
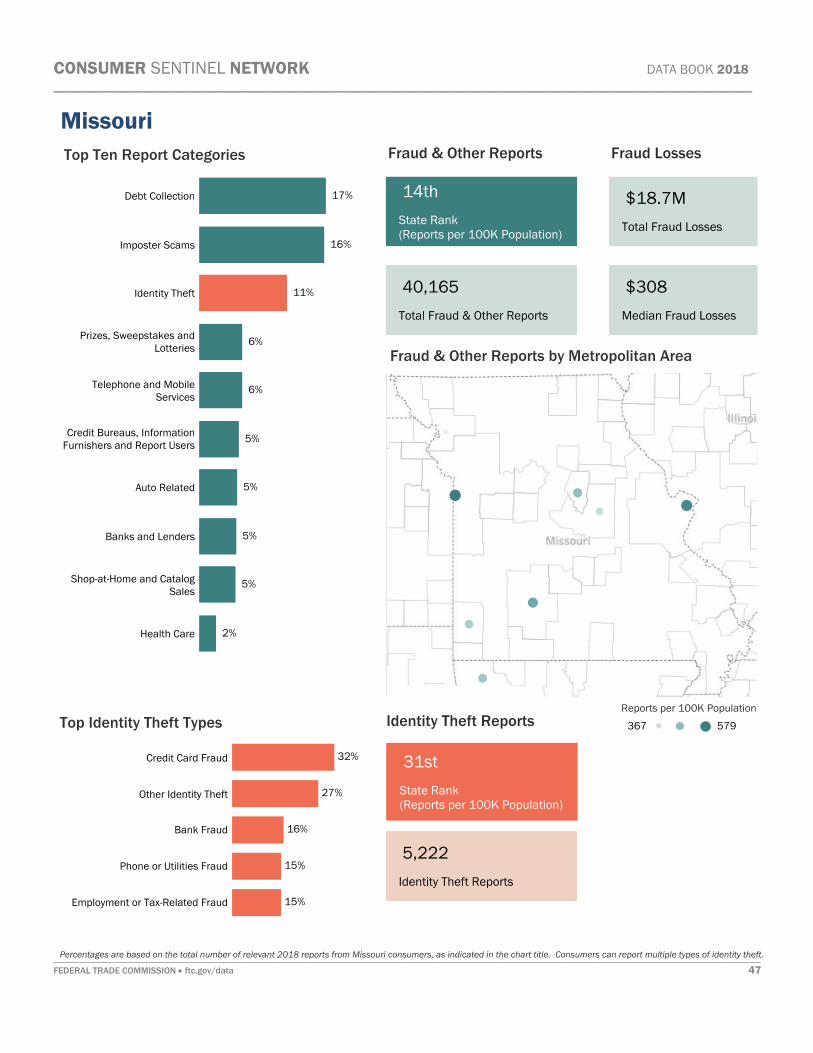
CONSUMER SENTINEL NETWORK DATA BOOK 2018_____________________________________________________________________________________________
_________________________________________________________________________________________________________________________________________FEDERAL TRADE COMMISSION · ftc.gov/data 47
Missouri
Debt Collection
Imposter Scams
Identity Theft
Prizes, Sweepstakes andLotteries
Telephone and MobileServices
Credit Bureaus, InformationFurnishers and Report Users
Auto Related
Banks and Lenders
Shop-at-Home and CatalogSales
Health Care
17%
16%
11%
6%
6%
5%
5%
5%
5%
2%
Top Ten Report Categories
Credit Card Fraud
Other Identity Theft
Bank Fraud
Phone or Utilities Fraud
Employment or Tax-Related Fraud
32%
27%
16%
15%
15%
Top Identity Theft Types
Fraud & Other Reports
40,165 Total Fraud & Other Reports
$18.7M Total Fraud Losses
$308 Median Fraud Losses
14th State Rank (Reports per 100K Population)
31st State Rank (Reports per 100K Population)
Fraud & Other Reports by Metropolitan Area
Identity Theft Reports
5,222 Identity Theft Reports
Percentages are based on the total number of relevant 2018 reports from Missouri consumers, as indicated in the chart title. Consumers can report multiple types of identity theft.
367
Reports per 100K Population
579
Fraud Losses
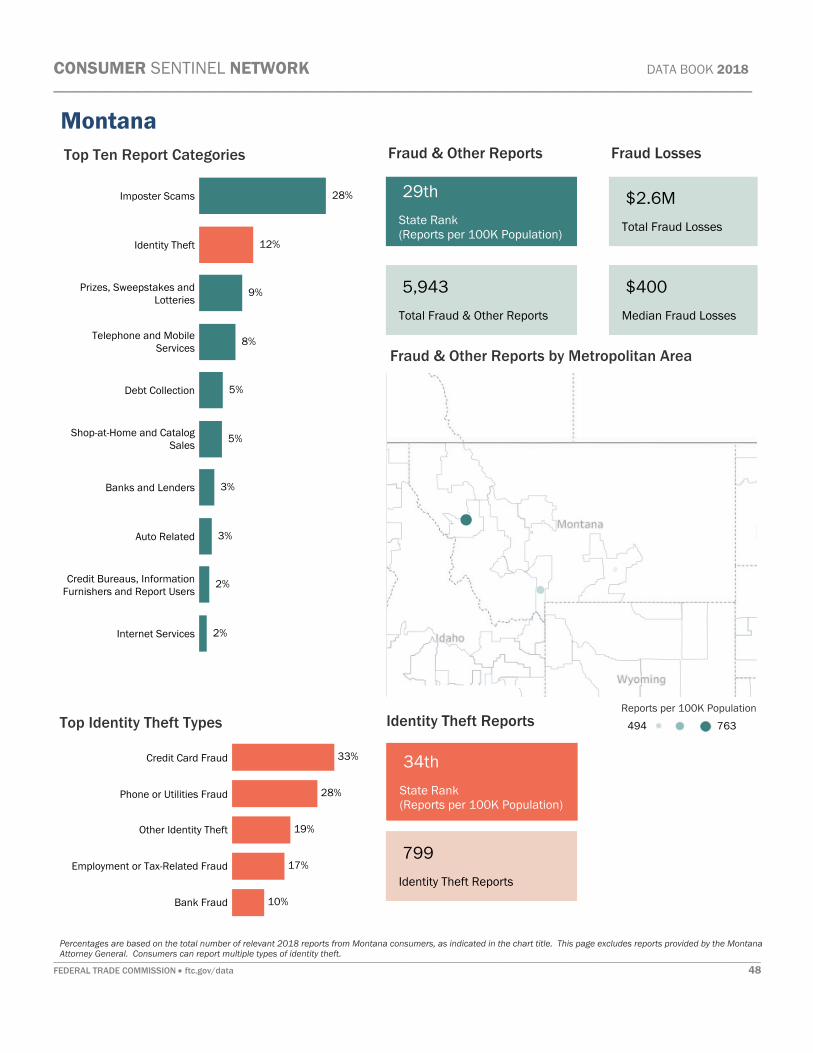
CONSUMER SENTINEL NETWORK DATA BOOK 2018_____________________________________________________________________________________________
_________________________________________________________________________________________________________________________________________FEDERAL TRADE COMMISSION · ftc.gov/data 48
Montana
Imposter Scams
Identity Theft
Prizes, Sweepstakes andLotteries
Telephone and MobileServices
Debt Collection
Shop-at-Home and CatalogSales
Banks and Lenders
Auto Related
Credit Bureaus, InformationFurnishers and Report Users
Internet Services
28%
12%
9%
8%
5%
5%
3%
3%
2%
2%
Top Ten Report Categories
Credit Card Fraud
Phone or Utilities Fraud
Other Identity Theft
Employment or Tax-Related Fraud
Bank Fraud
33%
28%
19%
17%
10%
Top Identity Theft Types
Fraud & Other Reports
5,943 Total Fraud & Other Reports
$2.6M Total Fraud Losses
$400 Median Fraud Losses
29th State Rank (Reports per 100K Population)
34th State Rank (Reports per 100K Population)
Fraud & Other Reports by Metropolitan Area
Identity Theft Reports
799 Identity Theft Reports
Percentages are based on the total number of relevant 2018 reports from Montana consumers, as indicated in the chart title. This page excludes reports provided by the MontanaAttorney General. Consumers can report multiple types of identity theft.
494
Reports per 100K Population
763
Fraud Losses
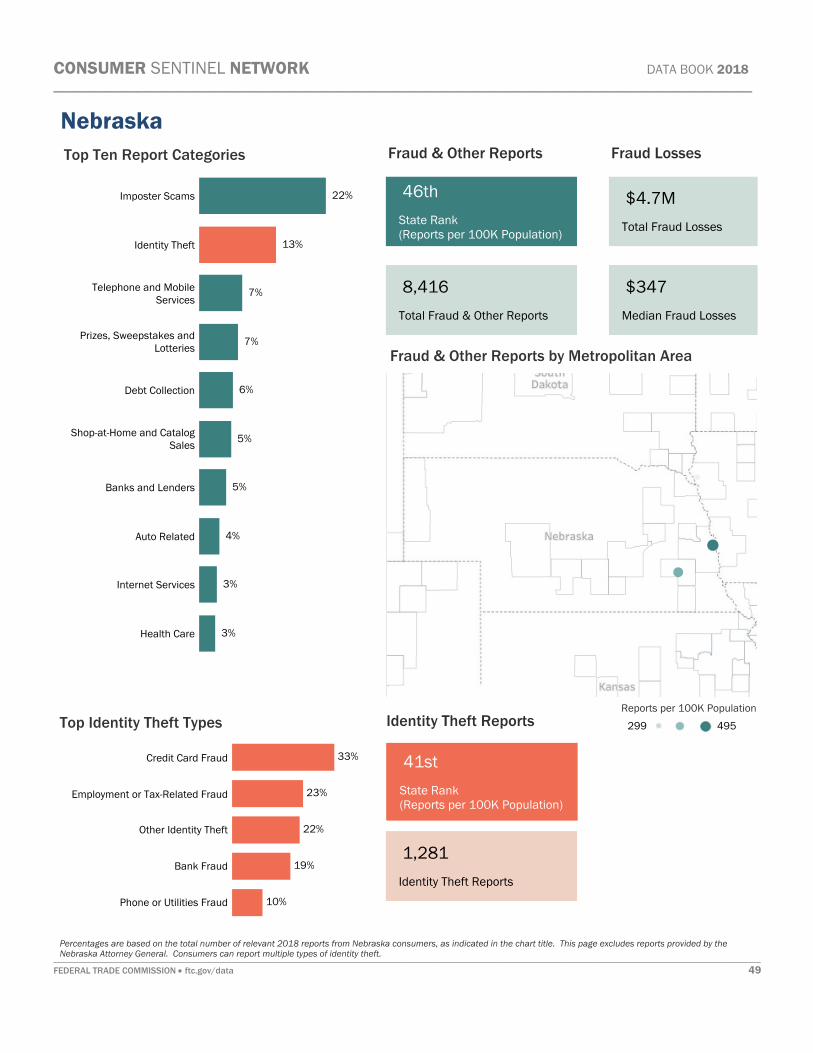
CONSUMER SENTINEL NETWORK DATA BOOK 2018_____________________________________________________________________________________________
_________________________________________________________________________________________________________________________________________FEDERAL TRADE COMMISSION · ftc.gov/data 49
Nebraska
Imposter Scams
Identity Theft
Telephone and MobileServices
Prizes, Sweepstakes andLotteries
Debt Collection
Shop-at-Home and CatalogSales
Banks and Lenders
Auto Related
Internet Services
Health Care
22%
13%
7%
7%
6%
5%
5%
4%
3%
3%
Top Ten Report Categories
Credit Card Fraud
Employment or Tax-Related Fraud
Other Identity Theft
Bank Fraud
Phone or Utilities Fraud
33%
23%
22%
19%
10%
Top Identity Theft Types
Fraud & Other Reports
8,416 Total Fraud & Other Reports
$4.7M Total Fraud Losses
$347 Median Fraud Losses
46th State Rank (Reports per 100K Population)
41st State Rank (Reports per 100K Population)
Fraud & Other Reports by Metropolitan Area
Identity Theft Reports
1,281 Identity Theft Reports
Percentages are based on the total number of relevant 2018 reports from Nebraska consumers, as indicated in the chart title. This page excludes reports provided by theNebraska Attorney General. Consumers can report multiple types of identity theft.
299
Reports per 100K Population
495
Fraud Losses

CONSUMER SENTINEL NETWORK DATA BOOK 2018_____________________________________________________________________________________________
_________________________________________________________________________________________________________________________________________FEDERAL TRADE COMMISSION · ftc.gov/data 50
Nevada
Identity Theft
Imposter Scams
Debt Collection
Telephone and MobileServices
Credit Bureaus, InformationFurnishers and Report Users
Banks and Lenders
Auto Related
Shop-at-Home and CatalogSales
Prizes, Sweepstakes andLotteries
Internet Services
18%
17%
17%
6%
5%
4%
4%
3%
3%
2%
Top Ten Report Categories
Other Identity Theft
Credit Card Fraud
Employment or Tax-Related Fraud
Bank Fraud
Phone or Utilities Fraud
41%
29%
14%
12%
11%
Top Identity Theft Types
Fraud & Other Reports
26,088 Total Fraud & Other Reports
$11.5M Total Fraud Losses
$462 Median Fraud Losses
3rd State Rank (Reports per 100K Population)
2nd State Rank (Reports per 100K Population)
Fraud & Other Reports by Metropolitan Area
Identity Theft Reports
5,816 Identity Theft Reports
Percentages are based on the total number of relevant 2018 reports from Nevada consumers, as indicated in the chart title. This page excludes reports provided by the NevadaAttorney General. Consumers can report multiple types of identity theft.
581
Reports per 100K Population
786
Fraud Losses

CONSUMER SENTINEL NETWORK DATA BOOK 2018_____________________________________________________________________________________________
_________________________________________________________________________________________________________________________________________FEDERAL TRADE COMMISSION · ftc.gov/data 51
New Hampshire
Imposter Scams
Identity Theft
Debt Collection
Banks and Lenders
Telephone and MobileServices
Shop-at-Home and CatalogSales
Auto Related
Prizes, Sweepstakes andLotteries
Internet Services
Credit Bureaus, InformationFurnishers and Report Users
19%
17%
9%
6%
6%
5%
5%
5%
3%
2%
Top Ten Report Categories
Credit Card Fraud
Phone or Utilities Fraud
Other Identity Theft
Bank Fraud
Employment or Tax-Related Fraud
42%
34%
16%
11%
7%
Top Identity Theft Types
Fraud & Other Reports
7,642 Total Fraud & Other Reports
$3.5M Total Fraud Losses
$300 Median Fraud Losses
28th State Rank (Reports per 100K Population)
14th State Rank (Reports per 100K Population)
Fraud & Other Reports by Metropolitan Area
Identity Theft Reports
1,565 Identity Theft Reports
Percentages are based on the total number of relevant 2018 reports from New Hampshire consumers, as indicated in the chart title. Consumers can report multiple types ofidentity theft.
461
Reports per 100K Population
528
Fraud Losses
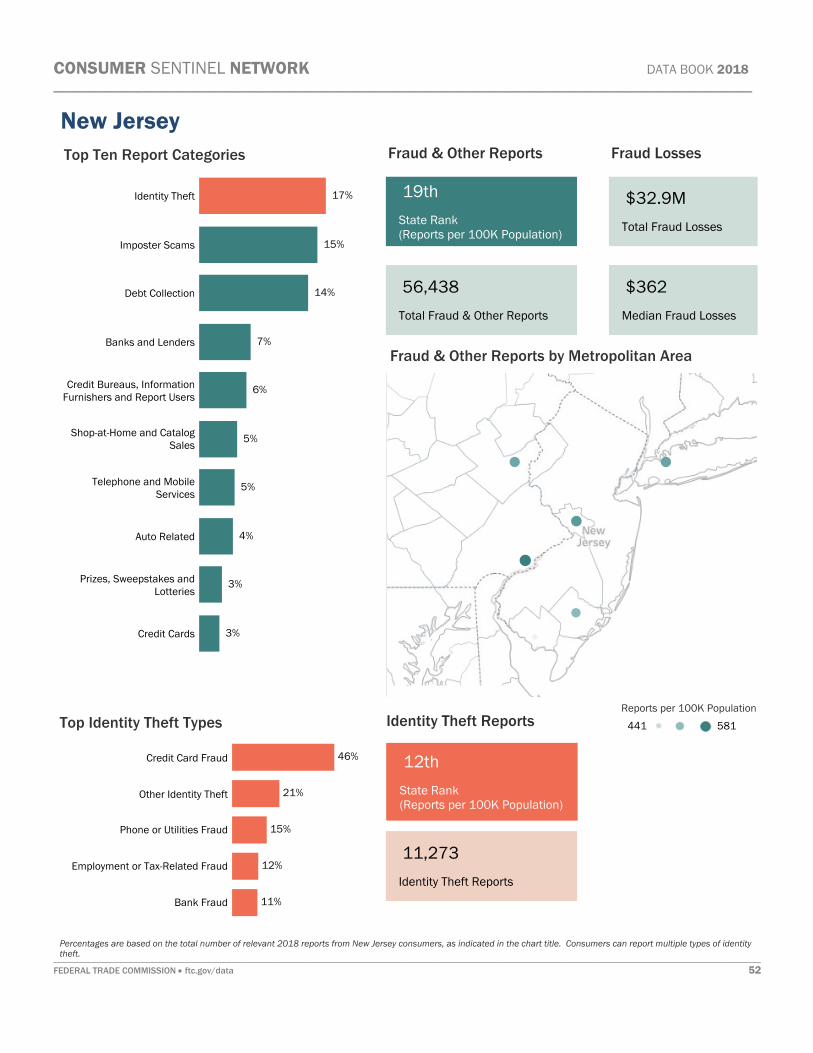
CONSUMER SENTINEL NETWORK DATA BOOK 2018_____________________________________________________________________________________________
_________________________________________________________________________________________________________________________________________FEDERAL TRADE COMMISSION · ftc.gov/data 52
New Jersey
Identity Theft
Imposter Scams
Debt Collection
Banks and Lenders
Credit Bureaus, InformationFurnishers and Report Users
Shop-at-Home and CatalogSales
Telephone and MobileServices
Auto Related
Prizes, Sweepstakes andLotteries
Credit Cards
17%
15%
14%
7%
6%
5%
5%
4%
3%
3%
Top Ten Report Categories
Credit Card Fraud
Other Identity Theft
Phone or Utilities Fraud
Employment or Tax-Related Fraud
Bank Fraud
46%
21%
15%
12%
11%
Top Identity Theft Types
Fraud & Other Reports
56,438 Total Fraud & Other Reports
$32.9M Total Fraud Losses
$362 Median Fraud Losses
19th State Rank (Reports per 100K Population)
12th State Rank (Reports per 100K Population)
Fraud & Other Reports by Metropolitan Area
Identity Theft Reports
11,273 Identity Theft Reports
Percentages are based on the total number of relevant 2018 reports from New Jersey consumers, as indicated in the chart title. Consumers can report multiple types of identitytheft.
441
Reports per 100K Population
581
Fraud Losses

CONSUMER SENTINEL NETWORK DATA BOOK 2018_____________________________________________________________________________________________
_________________________________________________________________________________________________________________________________________FEDERAL TRADE COMMISSION · ftc.gov/data 53
New Mexico
Imposter Scams
Debt Collection
Identity Theft
Prizes, Sweepstakes andLotteries
Telephone and MobileServices
Shop-at-Home and CatalogSales
Banks and Lenders
Credit Bureaus, InformationFurnishers and Report Users
Auto Related
Health Care
21%
18%
13%
6%
6%
4%
4%
4%
3%
2%
Top Ten Report Categories
Credit Card Fraud
Other Identity Theft
Employment or Tax-Related Fraud
Phone or Utilities Fraud
Bank Fraud
27%
24%
21%
18%
15%
Top Identity Theft Types
Fraud & Other Reports
13,573 Total Fraud & Other Reports
$10.0M Total Fraud Losses
$412 Median Fraud Losses
15th State Rank (Reports per 100K Population)
26th State Rank (Reports per 100K Population)
Fraud & Other Reports by Metropolitan Area
Identity Theft Reports
2,000 Identity Theft Reports
Percentages are based on the total number of relevant 2018 reports from New Mexico consumers, as indicated in the chart title. Consumers can report multiple types of identitytheft.
381
Reports per 100K Population
930
Fraud Losses

CONSUMER SENTINEL NETWORK DATA BOOK 2018_____________________________________________________________________________________________
_________________________________________________________________________________________________________________________________________FEDERAL TRADE COMMISSION · ftc.gov/data 54
New York
Identity Theft
Imposter Scams
Debt Collection
Credit Bureaus, InformationFurnishers and Report Users
Banks and Lenders
Telephone and MobileServices
Shop-at-Home and CatalogSales
Auto Related
Prizes, Sweepstakes andLotteries
Credit Cards
17%
16%
12%
6%
6%
5%
5%
4%
3%
3%
Top Ten Report Categories
Credit Card Fraud
Other Identity Theft
Phone or Utilities Fraud
Bank Fraud
Employment or Tax-Related Fraud
42%
23%
14%
13%
12%
Top Identity Theft Types
Fraud & Other Reports
117,567 Total Fraud & Other Reports
$65.7M Total Fraud Losses
$324 Median Fraud Losses
22nd State Rank (Reports per 100K Population)
13th State Rank (Reports per 100K Population)
Fraud & Other Reports by Metropolitan Area
Identity Theft Reports
24,248 Identity Theft Reports
Percentages are based on the total number of relevant 2018 reports from New York consumers, as indicated in the chart title. This page excludes reports provided by the New YorkAttorney General. Consumers can report multiple types of identity theft.
359
Reports per 100K Population
581
Fraud Losses

CONSUMER SENTINEL NETWORK DATA BOOK 2018_____________________________________________________________________________________________
_________________________________________________________________________________________________________________________________________FEDERAL TRADE COMMISSION · ftc.gov/data 55
North Carolina
Imposter Scams
Identity Theft
Debt Collection
Credit Bureaus, InformationFurnishers and Report Users
Prizes, Sweepstakes andLotteries
Telephone and MobileServices
Banks and Lenders
Shop-at-Home and CatalogSales
Auto Related
Internet Services
17%
15%
12%
8%
6%
5%
5%
4%
4%
2%
Top Ten Report Categories
Other Identity Theft
Credit Card Fraud
Phone or Utilities Fraud
Loan or Lease Fraud
Employment or Tax-Related Fraud
32%
31%
15%
14%
13%
Top Identity Theft Types
Fraud & Other Reports
66,486 Total Fraud & Other Reports
$29.6M Total Fraud Losses
$324 Median Fraud Losses
16th State Rank (Reports per 100K Population)
15th State Rank (Reports per 100K Population)
Fraud & Other Reports by Metropolitan Area
Identity Theft Reports
11,481 Identity Theft Reports
Percentages are based on the total number of relevant 2018 reports from North Carolina consumers, as indicated in the chart title. This page excludes reports provided by theNorth Carolina Department of Justice. Consumers can report multiple types of identity theft.
74
Reports per 100K Population
756
Fraud Losses
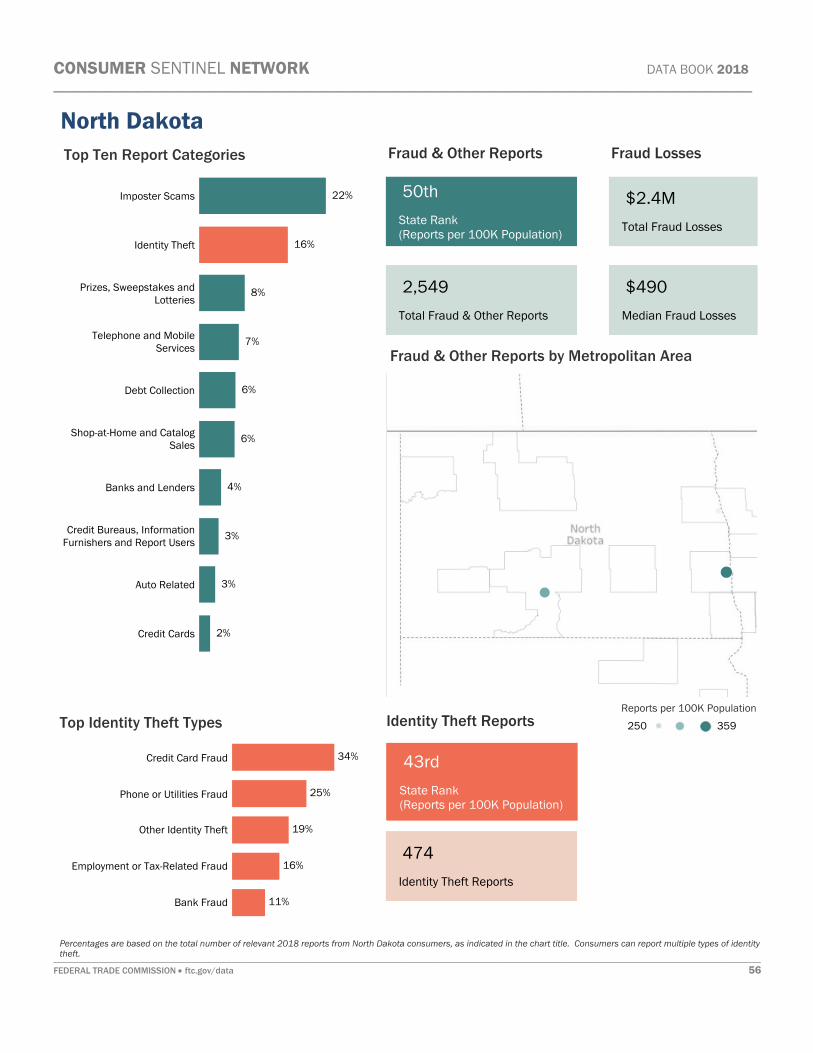
CONSUMER SENTINEL NETWORK DATA BOOK 2018_____________________________________________________________________________________________
_________________________________________________________________________________________________________________________________________FEDERAL TRADE COMMISSION · ftc.gov/data 56
North Dakota
Imposter Scams
Identity Theft
Prizes, Sweepstakes andLotteries
Telephone and MobileServices
Debt Collection
Shop-at-Home and CatalogSales
Banks and Lenders
Credit Bureaus, InformationFurnishers and Report Users
Auto Related
Credit Cards
22%
16%
8%
7%
6%
6%
4%
3%
3%
2%
Top Ten Report Categories
Credit Card Fraud
Phone or Utilities Fraud
Other Identity Theft
Employment or Tax-Related Fraud
Bank Fraud
34%
25%
19%
16%
11%
Top Identity Theft Types
Fraud & Other Reports
2,549 Total Fraud & Other Reports
$2.4M Total Fraud Losses
$490 Median Fraud Losses
50th State Rank (Reports per 100K Population)
43rd State Rank (Reports per 100K Population)
Fraud & Other Reports by Metropolitan Area
Identity Theft Reports
474 Identity Theft Reports
Percentages are based on the total number of relevant 2018 reports from North Dakota consumers, as indicated in the chart title. Consumers can report multiple types of identitytheft.
250
Reports per 100K Population
359
Fraud Losses

CONSUMER SENTINEL NETWORK DATA BOOK 2018_____________________________________________________________________________________________
_________________________________________________________________________________________________________________________________________FEDERAL TRADE COMMISSION · ftc.gov/data 57
Ohio
Debt Collection
Imposter Scams
Identity Theft
Telephone and MobileServices
Banks and Lenders
Prizes, Sweepstakes andLotteries
Auto Related
Shop-at-Home and CatalogSales
Credit Bureaus, InformationFurnishers and Report Users
Credit Cards
17%
16%
12%
5%
5%
5%
5%
4%
4%
2%
Top Ten Report Categories
Credit Card Fraud
Other Identity Theft
Phone or Utilities Fraud
Employment or Tax-Related Fraud
Bank Fraud
32%
25%
18%
14%
13%
Top Identity Theft Types
Fraud & Other Reports
73,212 Total Fraud & Other Reports
$27.1M Total Fraud Losses
$300 Median Fraud Losses
18th State Rank (Reports per 100K Population)
30th State Rank (Reports per 100K Population)
Fraud & Other Reports by Metropolitan Area
Identity Theft Reports
10,268 Identity Theft Reports
Percentages are based on the total number of relevant 2018 reports from Ohio consumers, as indicated in the chart title. This page excludes reports provided by the Ohio AttorneyGeneral. Consumers can report multiple types of identity theft.
424
Reports per 100K Population
631
Fraud Losses

CONSUMER SENTINEL NETWORK DATA BOOK 2018_____________________________________________________________________________________________
_________________________________________________________________________________________________________________________________________FEDERAL TRADE COMMISSION · ftc.gov/data 58
Oklahoma
Imposter Scams
Debt Collection
Identity Theft
Prizes, Sweepstakes andLotteries
Telephone and MobileServices
Shop-at-Home and CatalogSales
Banks and Lenders
Auto Related
Credit Bureaus, InformationFurnishers and Report Users
Internet Services
18%
16%
14%
8%
6%
4%
4%
4%
3%
2%
Top Ten Report Categories
Credit Card Fraud
Other Identity Theft
Employment or Tax-Related Fraud
Bank Fraud
Phone or Utilities Fraud
32%
25%
21%
15%
13%
Top Identity Theft Types
Fraud & Other Reports
19,347 Total Fraud & Other Reports
$11.0M Total Fraud Losses
$318 Median Fraud Losses
41st State Rank (Reports per 100K Population)
33rd State Rank (Reports per 100K Population)
Fraud & Other Reports by Metropolitan Area
Identity Theft Reports
3,109 Identity Theft Reports
Percentages are based on the total number of relevant 2018 reports from Oklahoma consumers, as indicated in the chart title. Consumers can report multiple types of identitytheft.
374
Reports per 100K Population
544
Fraud Losses
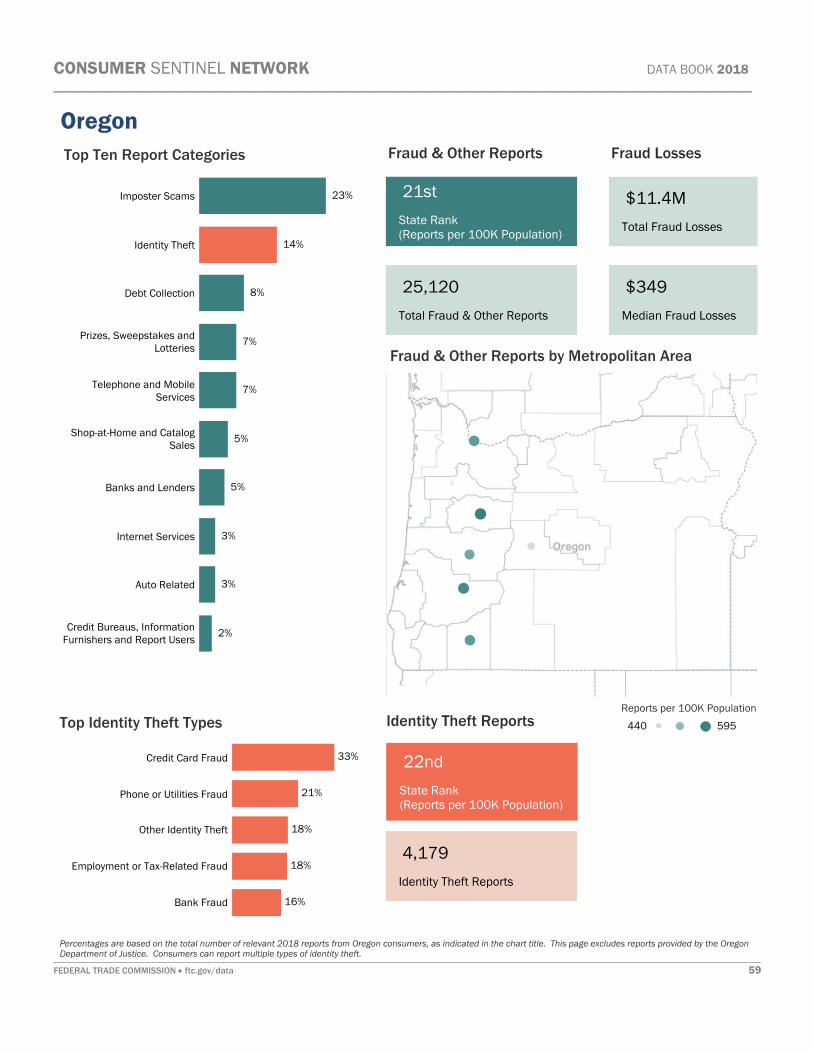
CONSUMER SENTINEL NETWORK DATA BOOK 2018_____________________________________________________________________________________________
_________________________________________________________________________________________________________________________________________FEDERAL TRADE COMMISSION · ftc.gov/data 59
Oregon
Imposter Scams
Identity Theft
Debt Collection
Prizes, Sweepstakes andLotteries
Telephone and MobileServices
Shop-at-Home and CatalogSales
Banks and Lenders
Internet Services
Auto Related
Credit Bureaus, InformationFurnishers and Report Users
23%
14%
8%
7%
7%
5%
5%
3%
3%
2%
Top Ten Report Categories
Credit Card Fraud
Phone or Utilities Fraud
Other Identity Theft
Employment or Tax-Related Fraud
Bank Fraud
33%
21%
18%
18%
16%
Top Identity Theft Types
Fraud & Other Reports
25,120 Total Fraud & Other Reports
$11.4M Total Fraud Losses
$349 Median Fraud Losses
21st State Rank (Reports per 100K Population)
22nd State Rank (Reports per 100K Population)
Fraud & Other Reports by Metropolitan Area
Identity Theft Reports
4,179 Identity Theft Reports
Percentages are based on the total number of relevant 2018 reports from Oregon consumers, as indicated in the chart title. This page excludes reports provided by the OregonDepartment of Justice. Consumers can report multiple types of identity theft.
440
Reports per 100K Population
595
Fraud Losses

CONSUMER SENTINEL NETWORK DATA BOOK 2018_____________________________________________________________________________________________
_________________________________________________________________________________________________________________________________________FEDERAL TRADE COMMISSION · ftc.gov/data 60
Pennsylvania
Debt Collection
Imposter Scams
Identity Theft
Telephone and MobileServices
Banks and Lenders
Shop-at-Home and CatalogSales
Prizes, Sweepstakes andLotteries
Credit Bureaus, InformationFurnishers and Report Users
Auto Related
Internet Services
16%
16%
15%
6%
5%
5%
5%
5%
4%
2%
Top Ten Report Categories
Credit Card Fraud
Other Identity Theft
Phone or Utilities Fraud
Bank Fraud
Employment or Tax-Related Fraud
37%
26%
21%
12%
12%
Top Identity Theft Types
Fraud & Other Reports
77,714 Total Fraud & Other Reports
$32.7M Total Fraud Losses
$300 Median Fraud Losses
20th State Rank (Reports per 100K Population)
20th State Rank (Reports per 100K Population)
Fraud & Other Reports by Metropolitan Area
Identity Theft Reports
13,725 Identity Theft Reports
Percentages are based on the total number of relevant 2018 reports from Pennsylvania consumers, as indicated in the chart title. This page excludes reports provided by thePennsylvania Attorney General. Consumers can report multiple types of identity theft.
323
Reports per 100K Population
658
Fraud Losses

CONSUMER SENTINEL NETWORK DATA BOOK 2018_____________________________________________________________________________________________
_________________________________________________________________________________________________________________________________________FEDERAL TRADE COMMISSION · ftc.gov/data 61
Puerto Rico
Identity Theft
Imposter Scams
Credit Bureaus, InformationFurnishers and Report Users
Banks and Lenders
Shop-at-Home and CatalogSales
Telephone and MobileServices
Debt Collection
Advance Payments for CreditServices
Credit Cards
Prizes, Sweepstakes andLotteries
36%
12%
6%
6%
5%
3%
3%
3%
2%
2%
Top Ten Report Categories
Employment or Tax-Related Fraud
Credit Card Fraud
Phone or Utilities Fraud
Other Identity Theft
Loan or Lease Fraud
37%
24%
19%
15%
7%
Top Identity Theft Types
Fraud & Other Reports
3,037 Total Fraud & Other Reports
$1.8M Total Fraud Losses
$361 Median Fraud Losses
Fraud & Other Reports by Metropolitan Area
Identity Theft Reports
1,710 Identity Theft Reports
Percentages are based on the total number of relevant 2018 reports from Puerto Rico consumers, as indicated in the chart title. Consumers can report multiple types of identitytheft.
68
Reports per 100K Population
92
Fraud Losses

CONSUMER SENTINEL NETWORK DATA BOOK 2018_____________________________________________________________________________________________
_________________________________________________________________________________________________________________________________________FEDERAL TRADE COMMISSION · ftc.gov/data 62
Rhode Island
Debt Collection
Imposter Scams
Identity Theft
Banks and Lenders
Shop-at-Home and CatalogSales
Telephone and MobileServices
Prizes, Sweepstakes andLotteries
Auto Related
Credit Bureaus, InformationFurnishers and Report Users
Credit Cards
21%
17%
14%
5%
5%
4%
4%
4%
4%
2%
Top Ten Report Categories
Credit Card Fraud
Other Identity Theft
Phone or Utilities Fraud
Bank Fraud
Loan or Lease Fraud
38%
24%
17%
14%
11%
Top Identity Theft Types
Fraud & Other Reports
6,210 Total Fraud & Other Reports
$3.3M Total Fraud Losses
$350 Median Fraud Losses
23rd State Rank (Reports per 100K Population)
28th State Rank (Reports per 100K Population)
Fraud & Other Reports by Metropolitan Area
Identity Theft Reports
990 Identity Theft Reports
Percentages are based on the total number of relevant 2018 reports from Rhode Island consumers, as indicated in the chart title. Consumers can report multiple types of identitytheft.
452
Reports per 100K Population
452
Fraud Losses

CONSUMER SENTINEL NETWORK DATA BOOK 2018_____________________________________________________________________________________________
_________________________________________________________________________________________________________________________________________FEDERAL TRADE COMMISSION · ftc.gov/data 63
South Carolina
Debt Collection
Imposter Scams
Identity Theft
Credit Bureaus, InformationFurnishers and Report Users
Prizes, Sweepstakes andLotteries
Banks and Lenders
Telephone and MobileServices
Auto Related
Shop-at-Home and CatalogSales
Health Care
19%
15%
15%
8%
5%
5%
4%
4%
4%
2%
Top Ten Report Categories
Other Identity Theft
Credit Card Fraud
Loan or Lease Fraud
Phone or Utilities Fraud
Bank Fraud
36%
30%
18%
17%
11%
Top Identity Theft Types
Fraud & Other Reports
36,062 Total Fraud & Other Reports
$13.8M Total Fraud Losses
$342 Median Fraud Losses
9th State Rank (Reports per 100K Population)
11th State Rank (Reports per 100K Population)
Fraud & Other Reports by Metropolitan Area
Identity Theft Reports
6,339 Identity Theft Reports
Percentages are based on the total number of relevant 2018 reports from South Carolina consumers, as indicated in the chart title. This page excludes reports provided by theSouth Carolina Department of Consumer Affairs. Consumers can report multiple types of identity theft.
473
Reports per 100K Population
765
Fraud Losses

CONSUMER SENTINEL NETWORK DATA BOOK 2018_____________________________________________________________________________________________
_________________________________________________________________________________________________________________________________________FEDERAL TRADE COMMISSION · ftc.gov/data 64
South Dakota
Imposter Scams
Identity Theft
Prizes, Sweepstakes andLotteries
Telephone and MobileServices
Shop-at-Home and CatalogSales
Debt Collection
Banks and Lenders
Auto Related
Internet Services
Credit Cards
21%
14%
9%
7%
6%
5%
5%
4%
2%
2%
Top Ten Report Categories
Credit Card Fraud
Phone or Utilities Fraud
Employment or Tax-Related Fraud
Other Identity Theft
Bank Fraud
32%
24%
16%
16%
15%
Top Identity Theft Types
Fraud & Other Reports
3,074 Total Fraud & Other Reports
$2.7M Total Fraud Losses
$445 Median Fraud Losses
49th State Rank (Reports per 100K Population)
47th State Rank (Reports per 100K Population)
Fraud & Other Reports by Metropolitan Area
Identity Theft Reports
486 Identity Theft Reports
Percentages are based on the total number of relevant 2018 reports from South Dakota consumers, as indicated in the chart title. Consumers can report multiple types of identitytheft.
299
Reports per 100K Population
448
Fraud Losses

CONSUMER SENTINEL NETWORK DATA BOOK 2018_____________________________________________________________________________________________
_________________________________________________________________________________________________________________________________________FEDERAL TRADE COMMISSION · ftc.gov/data 65
Tennessee
Debt Collection
Imposter Scams
Identity Theft
Prizes, Sweepstakes andLotteries
Credit Bureaus, InformationFurnishers and Report Users
Telephone and MobileServices
Banks and Lenders
Shop-at-Home and CatalogSales
Auto Related
Health Care
30%
14%
11%
5%
4%
4%
4%
4%
3%
2%
Top Ten Report Categories
Credit Card Fraud
Other Identity Theft
Employment or Tax-Related Fraud
Loan or Lease Fraud
Bank Fraud
33%
32%
14%
14%
13%
Top Identity Theft Types
Fraud & Other Reports
53,014 Total Fraud & Other Reports
$18.5M Total Fraud Losses
$345 Median Fraud Losses
5th State Rank (Reports per 100K Population)
21st State Rank (Reports per 100K Population)
Fraud & Other Reports by Metropolitan Area
Identity Theft Reports
6,808 Identity Theft Reports
Percentages are based on the total number of relevant 2018 reports from Tennessee consumers, as indicated in the chart title. This page excludes reports provided by theTennessee Department of Commerce and Insurance, Consumer Affairs Division. Consumers can report multiple types of identity theft.
413
Reports per 100K Population
663
Fraud Losses
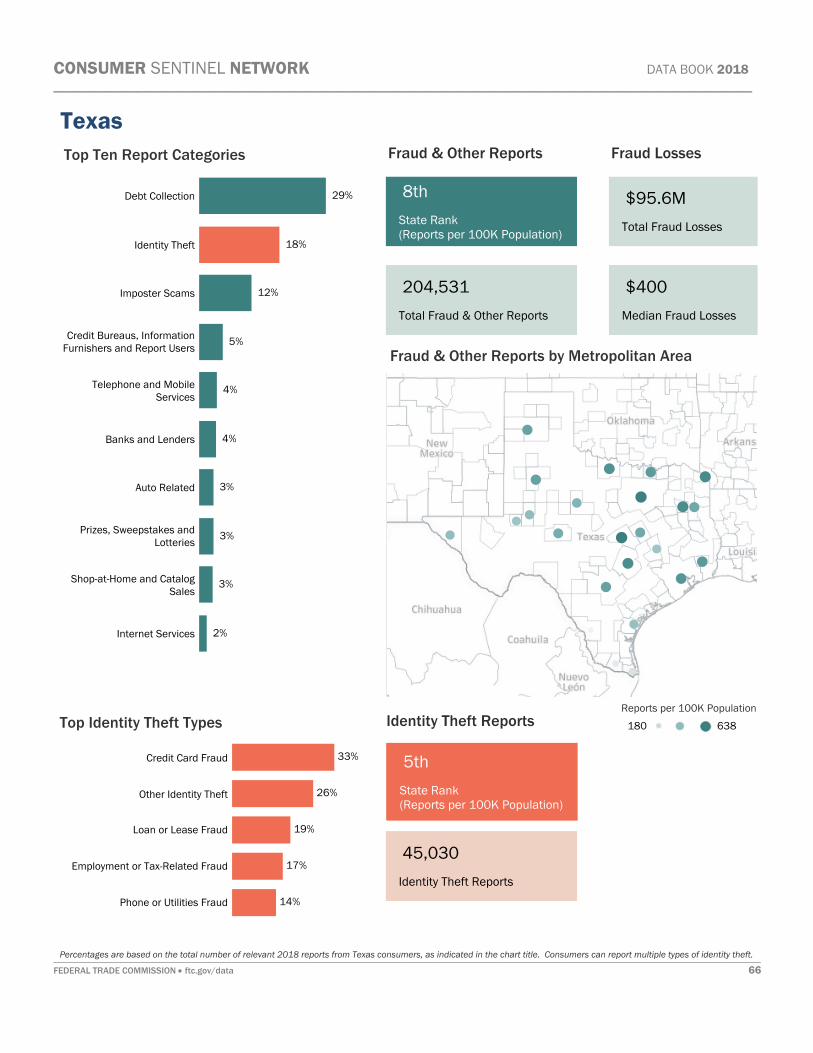
CONSUMER SENTINEL NETWORK DATA BOOK 2018_____________________________________________________________________________________________
_________________________________________________________________________________________________________________________________________FEDERAL TRADE COMMISSION · ftc.gov/data 66
Texas
Debt Collection
Identity Theft
Imposter Scams
Credit Bureaus, InformationFurnishers and Report Users
Telephone and MobileServices
Banks and Lenders
Auto Related
Prizes, Sweepstakes andLotteries
Shop-at-Home and CatalogSales
Internet Services
29%
18%
12%
5%
4%
4%
3%
3%
3%
2%
Top Ten Report Categories
Credit Card Fraud
Other Identity Theft
Loan or Lease Fraud
Employment or Tax-Related Fraud
Phone or Utilities Fraud
33%
26%
19%
17%
14%
Top Identity Theft Types
Fraud & Other Reports
204,531 Total Fraud & Other Reports
$95.6M Total Fraud Losses
$400 Median Fraud Losses
8th State Rank (Reports per 100K Population)
5th State Rank (Reports per 100K Population)
Fraud & Other Reports by Metropolitan Area
Identity Theft Reports
45,030 Identity Theft Reports
Percentages are based on the total number of relevant 2018 reports from Texas consumers, as indicated in the chart title. Consumers can report multiple types of identity theft.
180
Reports per 100K Population
638
Fraud Losses

CONSUMER SENTINEL NETWORK DATA BOOK 2018_____________________________________________________________________________________________
_________________________________________________________________________________________________________________________________________FEDERAL TRADE COMMISSION · ftc.gov/data 67
Utah
Imposter Scams
Identity Theft
Debt Collection
Telephone and MobileServices
Credit Bureaus, InformationFurnishers and Report Users
Shop-at-Home and CatalogSales
Prizes, Sweepstakes andLotteries
Banks and Lenders
Auto Related
Internet Services
20%
16%
10%
7%
6%
5%
4%
4%
3%
3%
Top Ten Report Categories
Credit Card Fraud
Other Identity Theft
Employment or Tax-Related Fraud
Loan or Lease Fraud
Bank Fraud
32%
25%
21%
15%
12%
Top Identity Theft Types
Fraud & Other Reports
15,356 Total Fraud & Other Reports
$13.2M Total Fraud Losses
$399 Median Fraud Losses
40th State Rank (Reports per 100K Population)
27th State Rank (Reports per 100K Population)
Fraud & Other Reports by Metropolitan Area
Identity Theft Reports
2,915 Identity Theft Reports
Percentages are based on the total number of relevant 2018 reports from Utah consumers, as indicated in the chart title. Consumers can report multiple types of identity theft.
303
Reports per 100K Population
502
Fraud Losses

CONSUMER SENTINEL NETWORK DATA BOOK 2018_____________________________________________________________________________________________
_________________________________________________________________________________________________________________________________________FEDERAL TRADE COMMISSION · ftc.gov/data 68
Vermont
Imposter Scams
Identity Theft
Shop-at-Home and CatalogSales
Prizes, Sweepstakes andLotteries
Banks and Lenders
Telephone and MobileServices
Auto Related
Internet Services
Debt Collection
Credit Cards
24%
10%
7%
6%
6%
6%
5%
3%
3%
2%
Top Ten Report Categories
Credit Card Fraud
Other Identity Theft
Bank Fraud
Phone or Utilities Fraud
Employment or Tax-Related Fraud
39%
19%
17%
16%
13%
Top Identity Theft Types
Fraud & Other Reports
2,690 Total Fraud & Other Reports
$2.2M Total Fraud Losses
$350 Median Fraud Losses
47th State Rank (Reports per 100K Population)
50th State Rank (Reports per 100K Population)
Fraud & Other Reports by Metropolitan Area
Identity Theft Reports
316 Identity Theft Reports
Percentages are based on the total number of relevant 2018 reports from Vermont consumers, as indicated in the chart title. Consumers can report multiple types of identity theft.
392
Reports per 100K Population
461
Fraud Losses

CONSUMER SENTINEL NETWORK DATA BOOK 2018_____________________________________________________________________________________________
_________________________________________________________________________________________________________________________________________FEDERAL TRADE COMMISSION · ftc.gov/data 69
Virginia
Imposter Scams
Debt Collection
Identity Theft
Telephone and MobileServices
Banks and Lenders
Shop-at-Home and CatalogSales
Auto Related
Prizes, Sweepstakes andLotteries
Credit Bureaus, InformationFurnishers and Report Users
Internet Services
17%
13%
13%
6%
6%
5%
4%
4%
4%
2%
Top Ten Report Categories
Credit Card Fraud
Other Identity Theft
Phone or Utilities Fraud
Bank Fraud
Employment or Tax-Related Fraud
36%
28%
14%
14%
13%
Top Identity Theft Types
Fraud & Other Reports
56,135 Total Fraud & Other Reports
$28.0M Total Fraud Losses
$368 Median Fraud Losses
13th State Rank (Reports per 100K Population)
25th State Rank (Reports per 100K Population)
Fraud & Other Reports by Metropolitan Area
Identity Theft Reports
8,196 Identity Theft Reports
Percentages are based on the total number of relevant 2018 reports from Virginia consumers, as indicated in the chart title. Consumers can report multiple types of identity theft.
74
Reports per 100K Population
558
Fraud Losses

CONSUMER SENTINEL NETWORK DATA BOOK 2018_____________________________________________________________________________________________
_________________________________________________________________________________________________________________________________________FEDERAL TRADE COMMISSION · ftc.gov/data 70
Washington
Imposter Scams
Identity Theft
Debt Collection
Telephone and MobileServices
Banks and Lenders
Shop-at-Home and CatalogSales
Prizes, Sweepstakes andLotteries
Auto Related
Credit Bureaus, InformationFurnishers and Report Users
Internet Services
22%
15%
10%
6%
5%
5%
4%
3%
3%
3%
Top Ten Report Categories
Credit Card Fraud
Other Identity Theft
Bank Fraud
Employment or Tax-Related Fraud
Phone or Utilities Fraud
37%
21%
20%
17%
12%
Top Identity Theft Types
Fraud & Other Reports
43,113 Total Fraud & Other Reports
$28.3M Total Fraud Losses
$350 Median Fraud Losses
25th State Rank (Reports per 100K Population)
23rd State Rank (Reports per 100K Population)
Fraud & Other Reports by Metropolitan Area
Identity Theft Reports
7,380 Identity Theft Reports
Percentages are based on the total number of relevant 2018 reports from Washington consumers, as indicated in the chart title. This page excludes reports provided by theWashington Attorney General. Consumers can report multiple types of identity theft.
343
Reports per 100K Population
626
Fraud Losses

CONSUMER SENTINEL NETWORK DATA BOOK 2018_____________________________________________________________________________________________
_________________________________________________________________________________________________________________________________________FEDERAL TRADE COMMISSION · ftc.gov/data 71
West Virginia
Imposter Scams
Prizes, Sweepstakes andLotteries
Identity Theft
Telephone and MobileServices
Shop-at-Home and CatalogSales
Auto Related
Internet Services
Banks and Lenders
Debt Collection
Television and ElectronicMedia
27%
11%
9%
5%
5%
4%
4%
3%
3%
3%
Top Ten Report Categories
Credit Card Fraud
Other Identity Theft
Phone or Utilities Fraud
Employment or Tax-Related Fraud
Bank Fraud
33%
22%
19%
16%
15%
Top Identity Theft Types
Fraud & Other Reports
10,134 Total Fraud & Other Reports
$4.3M Total Fraud Losses
$300 Median Fraud Losses
30th State Rank (Reports per 100K Population)
45th State Rank (Reports per 100K Population)
Fraud & Other Reports by Metropolitan Area
Identity Theft Reports
1,051 Identity Theft Reports
Percentages are based on the total number of relevant 2018 reports from West Virginia consumers, as indicated in the chart title. Consumers can report multiple types of identitytheft.
428
Reports per 100K Population
622
Fraud Losses

CONSUMER SENTINEL NETWORK DATA BOOK 2018_____________________________________________________________________________________________
_________________________________________________________________________________________________________________________________________FEDERAL TRADE COMMISSION · ftc.gov/data 72
Wisconsin
Imposter Scams
Identity Theft
Debt Collection
Telephone and MobileServices
Prizes, Sweepstakes andLotteries
Shop-at-Home and CatalogSales
Banks and Lenders
Auto Related
Credit Bureaus, InformationFurnishers and Report Users
Internet Services
21%
11%
9%
7%
6%
6%
5%
4%
3%
3%
Top Ten Report Categories
Credit Card Fraud
Other Identity Theft
Employment or Tax-Related Fraud
Bank Fraud
Phone or Utilities Fraud
32%
24%
20%
13%
13%
Top Identity Theft Types
Fraud & Other Reports
28,952 Total Fraud & Other Reports
$13.0M Total Fraud Losses
$300 Median Fraud Losses
39th State Rank (Reports per 100K Population)
42nd State Rank (Reports per 100K Population)
Fraud & Other Reports by Metropolitan Area
Identity Theft Reports
3,731 Identity Theft Reports
Percentages are based on the total number of relevant 2018 reports from Wisconsin consumers, as indicated in the chart title. This page excludes reports provided by theWisconsin Department of Agriculture, Trade, and Consumer Protection. Consumers can report multiple types of identity theft.
367
Reports per 100K Population
538
Fraud Losses

CONSUMER SENTINEL NETWORK DATA BOOK 2018_____________________________________________________________________________________________
_________________________________________________________________________________________________________________________________________FEDERAL TRADE COMMISSION · ftc.gov/data 73
Wyoming
Imposter Scams
Identity Theft
Prizes, Sweepstakes andLotteries
Telephone and MobileServices
Shop-at-Home and CatalogSales
Banks and Lenders
Debt Collection
Auto Related
Internet Services
Health Care
24%
11%
10%
8%
6%
6%
5%
4%
2%
2%
Top Ten Report Categories
Credit Card Fraud
Other Identity Theft
Employment or Tax-Related Fraud
Bank Fraud
Phone or Utilities Fraud
32%
24%
20%
13%
13%
Top Identity Theft Types
Fraud & Other Reports
2,647 Total Fraud & Other Reports
$1.8M Total Fraud Losses
$400 Median Fraud Losses
44th State Rank (Reports per 100K Population)
44th State Rank (Reports per 100K Population)
Fraud & Other Reports by Metropolitan Area
Identity Theft Reports
338 Identity Theft Reports
Percentages are based on the total number of relevant 2018 reports from Wyoming consumers, as indicated in the chart title. Consumers can report multiple types of identity theft.The identified Metropolitan Areas in Wyoming have a population of 81,000 or more.
431
Reports per 100K Population
606
Fraud Losses

Rank Metropolitan Area Reports per 100KPopulation # of Reports
1 Homosassa Springs, FL Metropolitan Statistical Area2 Santa Fe, NM Metropolitan Statistical Area3 Jacksonville, FL Metropolitan Statistical Area4 Jackson, MI Metropolitan Statistical Area5 Atlanta-Sandy Springs-Roswell, GA Metropolitan Statistical Area6 Prescott, AZ Metropolitan Statistical Area7 Las Vegas-Henderson-Paradise, NV Metropolitan Statistical Area8 Columbia, SC Metropolitan Statistical Area9 Missoula, MT Metropolitan Statistical Area10 Deltona-Daytona Beach-Ormond Beach, FL Metropolitan Statistical Area11 Charlotte-Concord-Gastonia, NC-SC Metropolitan Statistical Area12 Palm Bay-Melbourne-Titusville, FL Metropolitan Statistical Area13 Gainesville, FL Metropolitan Statistical Area14 Tampa-St. Petersburg-Clearwater, FL Metropolitan Statistical Area15 Miami-Fort Lauderdale-West Palm Beach, FL Metropolitan Statistical Area16 Myrtle Beach-Conway-North Myrtle Beach, SC-NC Metropolitan Statistical Area17 Columbus, GA-AL Metropolitan Statistical Area18 Carbondale-Marion, IL Metropolitan Statistical Area19 Orlando-Kissimmee-Sanford, FL Metropolitan Statistical Area20 Macon-Bibb County, GA Metropolitan Statistical Area21 Ocala, FL Metropolitan Statistical Area22 Port St. Lucie, FL Metropolitan Statistical Area23 Lake Havasu City-Kingman, AZ Metropolitan Statistical Area24 Sebastian-Vero Beach, FL Metropolitan Statistical Area25 Dover, DE Metropolitan Statistical Area26 Punta Gorda, FL Metropolitan Statistical Area27 Pensacola-Ferry Pass-Brent, FL Metropolitan Statistical Area28 Phoenix-Mesa-Scottsdale, AZ Metropolitan Statistical Area29 Lakeland-Winter Haven, FL Metropolitan Statistical Area30 Sierra Vista-Douglas, AZ Metropolitan Statistical Area31 Montgomery, AL Metropolitan Statistical Area32 Memphis, TN-MS-AR Metropolitan Statistical Area33 Asheville, NC Metropolitan Statistical Area34 North Port-Sarasota-Bradenton, FL Metropolitan Statistical Area35 Cape Coral-Fort Myers, FL Metropolitan Statistical Area36 East Stroudsburg, PA Metropolitan Statistical Area37 The Villages, FL Metropolitan Statistical Area38 Denver-Aurora-Lakewood, CO Metropolitan Statistical Area39 Tallahassee, FL Metropolitan Statistical Area40 Killeen-Temple, TX Metropolitan Statistical Area41 Rocky Mount, NC Metropolitan Statistical Area42 Dallas-Fort Worth-Arlington, TX Metropolitan Statistical Area43 Tucson, AZ Metropolitan Statistical Area44 Colorado Springs, CO Metropolitan Statistical Area45 Savannah, GA Metropolitan Statistical Area46 Cleveland-Elyria, OH Metropolitan Statistical Area47 Sacramento--Roseville--Arden-Arcade, CA Metropolitan Statistical Area48 Spokane-Spokane Valley, WA Metropolitan Statistical Area49 Charleston, WV Metropolitan Statistical Area50 Fayetteville, NC Metropolitan Statistical Area
2,1901,5251,38293012,5028461,31182747,7078241,82580916,9377866,2557658867634,82375618,6957564,3567522,10174822,68374844,5557343,2697282,228722905716
17,4037131,6257092,4697073,2717031,4367001,0566971,2166961,2386943,31268231,7446814,4826738446712,5016698,9036632,9916615,2086614,7686601,093658803648
18,3526432,4286402,781638939637
45,9016356,4406344,5046322,42463112,96363114,4146283,4876261,3556222,359620
Top 50 Metropolitan Areas: Fraud and Other Reports
CONSUMER SENTINEL NETWORK DATA BOOK 2018_____________________________________________________________________________________________
Metropolitan Areas are defined by the Office of Management and Budget, and population estimates are based on 2016 U.S. Census figures. Metropolitan Areas are ranked basedon the number of reports per 100,000 population. Reports exclude state-specific data contributor reports._________________________________________________________________________________________________________________________________________FEDERAL TRADE COMMISSION · ftc.gov/data 74

Rank Metropolitan Area Reports per 100KPopulation # of Reports
1 Macon-Bibb County, GA Metropolitan Statistical Area2 Columbus, GA-AL Metropolitan Statistical Area3 Atlanta-Sandy Springs-Roswell, GA Metropolitan Statistical Area4 Warner Robins, GA Metropolitan Statistical Area5 Miami-Fort Lauderdale-West Palm Beach, FL Metropolitan Statistical Area6 Los Angeles-Long Beach-Anaheim, CA Metropolitan Statistical Area7 Las Vegas-Henderson-Paradise, NV Metropolitan Statistical Area8 Dallas-Fort Worth-Arlington, TX Metropolitan Statistical Area9 Memphis, TN-MS-AR Metropolitan Statistical Area10 Bakersfield, CA Metropolitan Statistical Area11 Houston-The Woodlands-Sugar Land, TX Metropolitan Statistical Area12 Detroit-Warren-Dearborn, MI Metropolitan Statistical Area13 Orlando-Kissimmee-Sanford, FL Metropolitan Statistical Area14 Brownsville-Harlingen, TX Metropolitan Statistical Area15 Fresno, CA Metropolitan Statistical Area16 Sumter, SC Metropolitan Statistical Area17 Columbia, SC Metropolitan Statistical Area18 Ann Arbor, MI Metropolitan Statistical Area19 Wichita Falls, TX Metropolitan Statistical Area20 Stockton-Lodi, CA Metropolitan Statistical Area21 San Jose-Sunnyvale-Santa Clara, CA Metropolitan Statistical Area22 San Francisco-Oakland-Hayward, CA Metropolitan Statistical Area23 Vallejo-Fairfield, CA Metropolitan Statistical Area24 Riverside-San Bernardino-Ontario, CA Metropolitan Statistical Area25 Lakeland-Winter Haven, FL Metropolitan Statistical Area26 Tampa-St. Petersburg-Clearwater, FL Metropolitan Statistical Area27 New Orleans-Metairie, LA Metropolitan Statistical Area28 Sebastian-Vero Beach, FL Metropolitan Statistical Area29 Montgomery, AL Metropolitan Statistical Area30 Savannah, GA Metropolitan Statistical Area31 Tallahassee, FL Metropolitan Statistical Area32 Sacramento--Roseville--Arden-Arcade, CA Metropolitan Statistical Area33 Charlotte-Concord-Gastonia, NC-SC Metropolitan Statistical Area34 Jacksonville, FL Metropolitan Statistical Area35 Philadelphia-Camden-Wilmington, PA-NJ-DE-MD Metropolitan Statistical Area36 Killeen-Temple, TX Metropolitan Statistical Area37 San Diego-Carlsbad, CA Metropolitan Statistical Area38 Chicago-Naperville-Elgin, IL-IN-WI Metropolitan Statistical Area39 Fayetteville, NC Metropolitan Statistical Area40 New York-Newark-Jersey City, NY-NJ-PA Metropolitan Statistical Area41 Waco, TX Metropolitan Statistical Area42 Port St. Lucie, FL Metropolitan Statistical Area43 Dover, DE Metropolitan Statistical Area44 Hilton Head Island-Bluffton-Beaufort, SC Metropolitan Statistical Area45 Modesto, CA Metropolitan Statistical Area46 Phoenix-Mesa-Scottsdale, AZ Metropolitan Statistical Area47 Raleigh, NC Metropolitan Statistical Area48 Austin-Round Rock, TX Metropolitan Statistical Area49 Charleston-North Charleston, SC Metropolitan Statistical Area50 Naples-Immokalee-Marco Island, FL Metropolitan Statistical Area
736321950308
16,902292532280
16,61727434,3342585,00523216,3422262,9292181,84120813,3001968,3951954,7071937931881,8231861991851,4971836501782681781,2971773,4841767,8631687371677,3071611,0551584,7701571,9621552331545691525821525701503,4301493,6911492,2041499,0331496481494,91114813,949147551145
29,0861443811446641432471412971407601406,5091401,8021382,8271371,038136496136
Top 50 Metropolitan Areas: Identity Theft Reports
CONSUMER SENTINEL NETWORK DATA BOOK 2018_____________________________________________________________________________________________
Metropolitan Areas are defined by the Office of Management and Budget, and population estimates are based on 2016 U.S. Census figures. Metropolitan Areas are ranked basedon the number of reports per 100,000 population._________________________________________________________________________________________________________________________________________FEDERAL TRADE COMMISSION · ftc.gov/data 75

CONSUMER SENTINEL NETWORK DATA BOOK 2018_____________________________________________________________________________________________
_________________________________________________________________________________________________________________________________________FEDERAL TRADE COMMISSION · ftc.gov/data 76
Consumer Sentinel Network
The Consumer Sentinel Network is a free, online database of consumer reports available only to lawenforcement. It includes reports about identity theft, fraud, financial transactions, debt collection, andcredit reports, among other subjects. The Consumer Sentinel Network is based on the premise thatsharing information can make law enforcement even more effective. To that end, the Consumer SentinelNetwork provides law enforcement members with access to consumer reports provided directly to theFTC, as well as to reports shared by other data contributors.
IdentityTheft.gov
IdentityTheft.gov is the federal government’s one-stop resource for identity theft victims. People can useIdentityTheft.gov to report identity theft to the Federal Trade Commission and get a step-by-step personalrecovery plan. The site will also create an Identity Theft Report victims can use to clear their credit files offraudulent information resulting from the identity theft. IdentityTheft.gov has detailed advice for morethan 30 types of identity theft, and also is available in Spanish at RobodeIdentidad.gov. When people useIdentityTheft.gov, their report becomes part of the Consumer Sentinel Network database and is availableto the Network’s law enforcement members.
Econsumer.gov
Econsumer.gov was created in April 2001 to gather and share cross-border e-commerce reports, torespond to the challenges of multinational internet fraud, and to improve consumer confidence ine-commerce. Today, consumer protection agencies in 36 countries participate in econsumer.gov. Througheconsumer.gov, consumers can file cross-border consumer reports online and learn other steps to take tocombat fraud. The website is available in English, French, German, Japanese, Korean, Polish, Spanish,and Turkish. The reports into econsumer.gov are accessible to Consumer Sentinel members and certifiedforeign law enforcement agencies.
Appendix A1: The Consumer Sentinel Network

CONSUMER SENTINEL NETWORK DATA BOOK 2018_____________________________________________________________________________________________
_________________________________________________________________________________________________________________________________________FEDERAL TRADE COMMISSION · ftc.gov/data 77
FTC - "877 FTC HELP" (Fraud & Other)
FTC - Web Reports (Fraud & Other)
FTC - Web Reports (IDT)
FTC - Mobile Reports (Fraud & Other)
FTC - "877 ID THEFT"
FTC - Mobile Reports (IDT)
Better Business Bureau
PrivacyStar
Consumer Financial Protection Bureau
Other Data Contributors
Publishers Clearing House
Microsoft Corporation Cyber Crime Center
State Law Enforcement Agencies
353,375 (11.80%)
340,357 (11.37%)
273,440 (9.13%)
193,328 (6.46%)
89,628 (2.99%)
81,534 (2.72%)
503,222 (16.80%)
368,172 (12.30%)
332,504 (11.10%)
170,344 (5.69%)
107,805 (3.60%)
105,676 (3.53%)
76,942 (2.57%)
Appendix A2: Major Data Contributors
FTCOther Data Contributors
Percentages are based on the total number of 2018 Sentinel reports (2,994,483). Where appropriate, the type of report provided by the organization is indicated in parenthesis.

CONSUMER SENTINEL NETWORK DATA BOOK 2018_____________________________________________________________________________________________
_________________________________________________________________________________________________________________________________________FEDERAL TRADE COMMISSION · ftc.gov/data 78
Appendix A3: Data Contributors
Data Contributor
2016# ofReports %
2017# ofReports %
2018# ofReports %
FTC - "877 FTC HELP" (Fraud & Other)
FTC - Web Reports (Fraud & Other)
FTC - Web Reports (IDT)
FTC - Mobile Reports (Fraud & Other)
FTC - "877 ID THEFT"
FTC - Mobile Reports (IDT) 1.47%
3.91%
3.80%
7.70%
10.67%
9.43%
44,892
119,179
115,845
234,596
325,256
287,363
2.14%
3.59%
4.59%
7.18%
10.63%
10.47%
61,487
103,200
132,043
206,347
305,616
301,091
2.72%
2.99%
6.46%
9.13%
11.37%
11.80%
81,534
89,628
193,328
273,440
340,357
353,375
FTC
Data Contributor
2016# ofReports %
2017# ofReports %
2018# ofReports %
Better Business Bureau
PrivacyStar
Consumer Financial Protection Bureau
Publishers Clearing House
Microsoft Corporation Cyber Crime Center
4.14%
8.04%
24.82%
15.44%
126,080
244,873
756,382
470,434
3.88%
4.09%
10.46%
18.03%
15.73%
111,610
117,729
300,779
518,481
452,261
3.53%
3.60%
11.10%
12.30%
16.80%
105,676
107,805
332,504
368,172
503,222
Top Data Contributors
Data Contributor
2016# ofReports %
2017# ofReports %
2018# ofReports %
MoneyGram International & Western Union Money Transfer
U.S. Department of Education
U.S. Department of the Treasury, Internal Revenue Service
U.S. Postal Inspection Service
Green Dot
AARP Fraud Watch Network
National Consumer League
Others
Scam Detector
Canada, Competition Bureau 0.01%
0.11%
0.18%
0.22%
0.06%
1.03%
1.56%
0.26%
3.62%
350
3,288
5,543
6,632
1,943
31,442
47,480
7,804
110,189
0.01%
0.16%
0.16%
0.13%
0.20%
1.04%
0.78%
0.76%
2.96%
269
4,556
4,478
3,634
5,645
29,880
22,435
21,747
84,970
0.05%
0.11%
0.12%
0.14%
0.19%
0.22%
0.57%
0.82%
0.92%
2.55%
1,594
3,364
3,458
4,203
5,638
6,486
16,930
24,585
27,683
76,403
Other Data Contributors
Percentages are based on the total number of Sentinel reports in 2016 (3,046,915), 2017 (2,875,016), and 2018 (2,994,483).

CONSUMER SENTINEL NETWORK DATA BOOK 2018_____________________________________________________________________________________________
_________________________________________________________________________________________________________________________________________FEDERAL TRADE COMMISSION · ftc.gov/data 79
Data Contributor
2016# ofReports %
2017# ofReports %
2018# ofReports %
Ohio, Attorney General
Pennsylvania, Attorney General
North Carolina, Department of Justice
Washington, Attorney General
Maine, Attorney General
Wisconsin, Department of Agriculture, Trade, and Consumer Protection
Indiana, Attorney General
Nebraska, Attorney General
New York, Attorney General
South Carolina, Department of Consumer Affairs
Michigan, Attorney General
Louisiana, Attorney General
Oregon, Department of Justice
Tennessee, Department of Commerce and Insurance, Consumer AffairsDivision
Colorado, Attorney General
Idaho, Attorney General
Alaska, Attorney General
Hawaii, Office of Consumer Protection
Iowa, Attorney General
Montana, Attorney General
Nevada, Attorney General
Mississippi, Attorney General 0.00%
0.01%
0.01%
0.07%
0.01%
0.01%
0.01%
0.03%
0.05%
0.09%
0.07%
0.11%
0.06%
0.32%
0.14%
0.16%
0.19%
0.24%
0.34%
0.42%
0.21%
0.53%
122
343
312
2,030
225
329
429
868
1,585
2,767
2,037
3,271
1,762
9,847
4,128
4,800
5,737
7,385
10,220
12,773
6,516
16,230
0.00%
0.01%
0.01%
0.04%
0.01%
0.01%
0.02%
0.02%
0.05%
0.07%
0.05%
0.11%
0.06%
0.39%
0.15%
0.12%
0.21%
0.21%
0.36%
0.30%
0.32%
0.45%
90
386
429
1,025
169
299
602
700
1,553
1,979
1,554
3,201
1,808
11,142
4,229
3,552
6,098
5,936
10,485
8,533
9,284
12,995
0.00%
0.00%
0.01%
0.01%
0.01%
0.01%
0.02%
0.02%
0.05%
0.05%
0.05%
0.08%
0.09%
0.09%
0.10%
0.11%
0.13%
0.15%
0.29%
0.33%
0.33%
0.65%
46
148
184
196
223
306
497
676
1,411
1,426
1,471
2,282
2,550
2,803
3,130
3,413
3,855
4,519
8,549
9,917
9,953
19,387
State Law Enforcement Agencies
Appendix A3: Data Contributors
Percentages are based on the total number of Sentinel reports in 2016 (3,046,915), 2017 (2,875,016), and 2018 (2,994,483).

CONSUMER SENTINEL NETWORK DATA BOOK 2018_____________________________________________________________________________________________
_________________________________________________________________________________________________________________________________________FEDERAL TRADE COMMISSION · ftc.gov/data 80
Appendix A4: Better Business Bureau Data Contributors
BBB serving... Akron Abilene Amarillo Arkansas Acadiana Canton Region & Greater West Virginia Central & Eastern Kentucky Central & South Alabama Central and Western MA and Northeastern CT Central California and Inland Empire Counties Central East Texas Central Florida Central Illinois Central Indiana Central and Northwest North Carolina Central Ohio Central Oklahoma Central South Carolina & Charleston Central Virginia Chicago & Northern Illinois Cincinnati Area, Southern Ohio, Northern Kentucky, SE Indiana Coastal Carolina Concho Valley Connecticut Dayton and Miami Valley Delaware Denver and Boulder Detroit & Eastern Michigan E. & SW Missouri & S. Illinois Eastern MA, ME, RI & VT Eastern North Carolina Eastern Oklahoma El Paso Fall Line Corridor Greater Cleveland Greater East Tennessee Greater Hampton Roads Greater Houston and South Texas Greater Iowa, Quad Cities and Siouxland Region Greater Kansas City Greater Maryland Greater New Orleans Area Heart of Texas Los Angeles and Silicon Valley Louisville, Southern Indiana & Western Kentucky Mahoning Valley Metro Atlanta, Athens & NE Georgia Metro Washington DC & Eastern Pennsylvania Metropolitan New York Middle Tennessee Mid-South Minnesota and North Dakota Mississippi Nebraska, South Dakota, Kansas Plains & SW Iowa New Hampshire New Jersey New Mexico and Southwest Colorado North Alabama North Central Texas
BBB serving... Northeast & Central Louisiana & the Ark-La-Tex Northeast California Northeast Florida and the Southeast Atlantic Northern Colorado and Wyoming Northern Indiana Northern Nevada and Utah Northwest + Pacific Northwest Florida Northwest and West Central Ohio and SE Michigan Pacific Southwest San Francisco Bay Area and Northern Coastal California South Central Louisiana South Plains Southeast Florida & the Caribbean Southeast Tennessee & Northwest Georgia Southeast Texas Southern Arizona Southern Colorado Southern Nevada Southern Piedmont and Western North Carolina Southwest Louisiana Tri-Counties Tri-State Upstate New York Upstate South Carolina West Florida Western Michigan Western Pennsylvania Western Virginia Wisconsin
Canada
Atlantic ProvincesCentral & Northern AlbertaCentral OntarioEastern & Northern Ontario & the OutaouaisMainland B.C.Manitoba & N.W. OntarioSaskatchewanSouthern Alberta and East KootenayVancouver IslandWestern Ontario
Mexico
BBB Mexico
United States

CONSUMER SENTINEL NETWORK DATA BOOK 2018_____________________________________________________________________________________________
_________________________________________________________________________________________________________________________________________FEDERAL TRADE COMMISSION · ftc.gov/data 81
Appendix B1: Descriptions of Report Categories
Fraud Report Categories
Advance Payments for Credit Services:The promise of a loan or credit card that requires you to pay a fee first; worthless credit card loss protection and insuranceprograms; the promise that accurate negative information can be removed from your credit file for a fee; services offering torecover government refunds or unclaimed funds; etc.
Books and Magazines:Pitches for "free," "pre-paid," or "special" magazine or book subscription deals; etc.
Business and Job Opportunities:Franchise or business opportunities (e.g., offers to start a new business); work-at-home plans, (e.g., stuffing envelopes orprocessing medical claims); multi-level marketing schemes, employment agencies or job counseling, overseas work,inventions or idea promotions.
Charitable Solicitations:Misleading pitches for donations to benefit a charity; solicitations for bogus charity or relief organizations; etc.
Foreign Money Offers and Counterfeit Check Scams:Letters or e-mails promising a percentage of millions of dollars that from a foreign country in return for money, bank accountnumbers or other identifying information from the victim; fraudulent schemes involving foreign lotteries, mystery shoppers orinternet purchases\classified ads in which someone is overpaid with a counterfeit check and asked to wire back thedifference immediately after check deposit, leaving the victim responsible for the funds withdrawn; etc.
Grants:Businesses or individuals marketing either government grant opportunities or financial aid assistance services; problems withstudent loan processors, debt collectors collecting on defaulted student loans, diploma mills and other unaccreditededucational institutions; etc.
Health Care:Fraudulent, misleading or deceptive claims for: vision correction procedures; dietary supplements; weight loss products orservices; impotency treatments; health spas and equipments; infertility services; sunscreens; HIV test kits; medical discountplans; as well as complaints about over-the-counter or prescription drugs; other medical products, supplies or treatments;fitness monitors and devices that can connect to the internet and use a processor or sensors to collect consumer information;etc.
Imposter Scams:Someone pretends to be a trusted person to get consumers to send money or give personal information. Examples includescammers claiming to work for or be affiliated with a government agency; scammers posing as a friend or relative with anemergency need for money; scammers posing as a romantic interest; scammers claiming to be a computer technicianoffering technical support; and scammers claiming to be affiliated with a private entity (e.g., a charity or company).
Internet Auction:Non-delivery or late delivery of goods; delivery of goods that are less valuable than advertised; failure to disclose all therelevant information about the product or terms of the sale; etc.
Internet Services:Problems with websites that offer content for a fee or advertise products and services; difficulty canceling an ISP or onlineaccount; malware and computer exploits; issues with online payment services, social networking services, internet gaming,and virtual reality; undisclosed charges; website design and promotion services; and problems with broadband internetservices and content, including the truthfulness of cost, access, and speed disclosures.
Investment Related:Investment opportunities in day trading; gold and gems; art; rare coins; other investment products; reports about companiesthat offer advice or seminars on investments; etc.Certain Fraud categories are comprised of subcategories that fall in both Fraud and Other report types. See Appendix B3. The Fraud rankings exclude subcategories that are notfraud.

CONSUMER SENTINEL NETWORK DATA BOOK 2018_____________________________________________________________________________________________
_________________________________________________________________________________________________________________________________________FEDERAL TRADE COMMISSION · ftc.gov/data 82
Appendix B1: Descriptions of Report Categories
Mortgage Foreclosure Relief and Debt Management:Mortgage lenders, brokers and other entities making false promises to save consumers’ homes from foreclosure; mortgagerefinancing, mortgage term modifications and debt management issues; credit organizations charging excessive fees, makingfalse promises to provide free services, pay creditors or reduce interest rates.
Office Supplies and Services:Fraudulent or deceptive offers for toner, copier paper, maintenance supplies, equipment maintenance contracts; classifiedadvertising and yellow page invoice scams; website cramming schemes; etc.
Prizes, Sweepstakes, and Lotteries:Promotions for "free" prizes for a fee; foreign lotteries and sweepstakes offered through the phone, fax, e-mail or mail; etc.
Shop-at-Home and Catalog Sales:Undisclosed costs, failure to deliver on time, non-delivery and refusal to honor a guarantee, purchases made online (notincluding auction sales), telephone or mail.
Tax Preparers:Companies that engage in "skimming" consumer tax refunds or charging inflated fees while promising substantial refunds;companies aiding consumers in willfully and intentionally falsifying information on a tax return to limit the amount of taxliability; entities pretending to be tax preparers or the IRS to obtain funds or information from consumers.
Telephone and Mobile Services:Advertising related to mobile plans, rates or coverage areas; unsolicited mobile text messages; problems with mobileapplications or downloads; other mobile device problems; charges for calls to "toll-free" numbers; unauthorized charges, suchas charges for calls consumers did not make; unauthorized switching of consumers’ phone service provider; misleadingpre-paid phone card offers; VoIP service problems; unsolicited faxes; electronic consumer products such as smart watchesand connected-home devices that can connect to the internet and use a processor or sensors to collect consumerinformation; etc.
Travel, Vacations and Timeshare Plans:Deceptive offers for "free" or low-cost vacations; cut-rate student travel packages; misleading timeshare offers; etc.
Identity Theft
Identity Theft:Someone appropriates your personal identifying information (like your Social Security number or credit card account number)to commit fraud or theft.
Other Report Categories
Auto Related:Misleading or deceptive claims regarding auto prices, financing, leasing or warranties; repair\maintenance issues with newlypurchased used or new cars, including dissatisfaction with service provided by auto mechanics; price fixing and price gougingconcerns against gas stations and oil companies; etc.
Banks and Lenders:Deceptive or predatory mortgage lending practices; problems with modification of mortgage terms; miscellaneous customerservice and account issues with bank or credit union products, including payday loans, student loans, auto title loans, feesand overdraft charges; other finance company lending products, services and practices; etc.
Certain Fraud categories are comprised of subcategories that fall in both Fraud and Other report types. See Appendix B3. The Fraud rankings exclude subcategories that are notfraud.

CONSUMER SENTINEL NETWORK DATA BOOK 2018_____________________________________________________________________________________________
_________________________________________________________________________________________________________________________________________FEDERAL TRADE COMMISSION · ftc.gov/data 83
Appendix B1: Descriptions of Report Categories
Computer Equipment and Software:Problems with computer software, hardware and computer equipment purchases; unwanted or unauthorized softwareinstallations and downloads; etc.
Credit Bureaus, Information Furnishers and Report Users:Credit Reporting Agency (CRA) or furnisher provides inaccurate information or fails to reinvestigate disputed information; CRAprovides inadequate phone help; difficulties ordering free annual credit reports; impermissible access to\inquiry on creditreports; etc.
Credit Cards:Account or billing issues, including interest rate changes, late fees, credit disputes and overcharges; fraudulent credit cardoffers\phishing attempts; etc.
Debt Collection:Debt collector calls repeatedly or continuously, falsely represents the amount or status of debt, fails to send written notice ofdebt, falsely threatens suit, uses profane language, fails to identify self as debt collector and\or violates other provisions ofthe Fair Debt Collection Practices Act.
Education:Problems with trade or vocational school services, including issues related to accreditation, billing and collection, orinstitutional advertising claims related to usefulness of the degree or job prospects after graduation. Also, reports abouttraditional colleges and universities.
Funeral Services:Quality, services, price, or price disclosures of funeral service providers.
Home Repair, Improvement and Products:Defective furniture or appliances; service or warranty-related issues; furniture or appliance delivery problems, includingreceiving wrong or incomplete products; problems with home repair services and contractors; issues with home protectiondevices or services; reports about general housing-related issues; etc.
Television and Electronic Media:Reports about television programming and advertisements; miscellaneous problems with digital entertainment, includingDVDs, CDs, MP3s, satellite music services, online streaming, and video on demand; issues with TV reception, installation,billing, and promotions of satellite and cable television providers.
Certain Fraud categories are comprised of subcategories that fall in both Fraud and Other report types. See Appendix B3. The Fraud rankings exclude subcategories that are notfraud.

________________________________________________________________________________________________________________________________________FEDERAL TRADE COMMISSION · ftc.gov/data 84
Category
2016
# Reports %
2017
# Reports %
2018
# Reports %
Advance Payments for Credit Services
Auto Related
Banks and Lenders
Business and Job Opportunities
Charitable Solicitations
Computer Equipment and Software
Credit Bureaus, Information Furnishers and Report Users
Credit Cards
Debt Collection
Education
Foreign Money Offers and Counterfeit Check Scams
Funeral Services
Grants
Health Care
Home Repair, Improvement and Products
Identity Theft
Imposter Scams
Internet Auction
Internet Services
Investment Related
Magazines and Books
Miscellaneous Reports
Mortgage Foreclosure Relief and Debt Management
Office Supplies and Services
Prizes, Sweepstakes and Lotteries
Shop-at-Home and Catalog Sales
Tax Preparers
Telephone and Mobile Services
Television and Electronic Media
Travel, Vacations and Timeshare Plans
Unspecified Reports 9.38%
0.69%
1.81%
3.83%
0.15%
3.94%
5.22%
0.31%
0.33%
0.40%
0.27%
0.75%
1.53%
0.08%
13.59%
13.09%
0.22%
1.07%
0.20%
0.04%
1.05%
0.31%
28.44%
1.46%
1.71%
0.66%
0.12%
0.64%
4.96%
3.43%
0.64%
285,712
21,052
55,293
116,604
4,432
120,079
159,111
9,572
10,120
12,073
8,228
22,938
46,592
2,445
414,061
398,952
6,692
32,661
6,197
1,302
31,864
9,367
866,465
44,629
52,241
20,206
3,588
19,543
151,197
104,567
19,620
9.54%
0.83%
1.61%
5.25%
0.13%
4.62%
4.98%
0.26%
0.34%
0.44%
0.20%
0.55%
1.73%
0.08%
16.05%
12.91%
0.22%
1.14%
0.21%
0.04%
1.12%
0.28%
21.74%
1.64%
3.81%
0.68%
0.13%
0.70%
5.32%
3.22%
0.63%
274,258
24,003
46,427
150,948
3,629
132,709
143,121
7,357
9,755
12,708
5,809
15,923
49,622
2,309
461,305
371,034
6,458
32,866
5,917
1,144
32,136
8,126
625,136
47,058
109,498
19,426
3,864
20,114
152,909
92,478
17,975
10.18%
0.95%
1.28%
5.51%
0.14%
4.78%
4.42%
0.18%
0.34%
0.89%
0.21%
0.50%
2.10%
0.06%
17.88%
14.85%
0.38%
1.58%
0.21%
0.03%
0.92%
0.48%
15.88%
1.71%
4.57%
0.61%
0.15%
0.84%
4.61%
3.49%
0.65%
304,948
28,353
38,336
164,876
4,103
143,072
132,470
5,350
10,039
26,552
6,309
14,884
62,942
1,699
535,417
444,602
11,331
47,410
6,274
964
27,443
14,242
475,517
51,129
136,748
18,350
4,350
25,068
138,134
104,604
19,575
Appendix B2: Report Categories over Three Years
CONSUMER SENTINEL NETWORK DATA BOOK 2018_____________________________________________________________________________________________
Percentages are based on the total number of Sentinel reports in 2016 (3,046,915), 2017 (2,875,016), and 2018 (2,994,483). Consumers can report more than one category orsubcategory.

________________________________________________________________________________________________________________________________________FEDERAL TRADE COMMISSION · ftc.gov/data 85
Category Subcategory
2016
# ofReports
% ofReports
2017
# ofReports
% ofReports
2018
# ofReports
% ofReports
Advance Payments for CreditServices
Advance-Fee Loans, Credit Arrangers
Credit Card Loss Protection
Credit Repair
Recovery\Refund Companies
Auto Related Auto: Financing
Auto: Gas
Auto: Parts & Repairs
Auto: Renting & Leasing
Auto: Sales – New
Auto: Sales – Used
Auto: Warranty Plans & Services
Banks and Lenders Banks, Savings & Loans, and Credit Unions
Lending: Auto Title Loans
Lending: Banks & Credit Unions
Lending: Finance Company
Lending: Mortgage
Lending: Other Institutions
Lending: Payday Loans
Lending: Student Loans
Business and Job Opportunities Business Opportunities\Work-At-Home Plans
Employ Agencies\Job Counsel\Overseas Work
Franchises\Distributorships*
Inventions\Idea Promotions
Multi-Level Mktg\Pyramids\Chain Letters
Charitable Solicitations Charitable Solicitations
Computer Equipment and Software Computers: Equipment\Software
Credit Bureaus, InformationFurnishers and Report Users
Credit Bureaus
Credit Information Furnishers
Credit Report Users
Credit Cards Credit Cards
Debt Collection Creditor Debt Collection
Third Party Debt Collection
Education Education: Colleges and Universities
Education: Trade\Vocational Schools
Foreign Money Offers andCounterfeit Check Scams
Counterfeit Check Scams
Nigerian\Other Foreign Money Offers (not prizes)
Funeral Services Funeral Services
Grants Grants: Non-Educational
Scholarships\Educational Grants
0.05%
0.07%
0.01%
0.51%
1,556
2,214
238
15,614
0.02%
0.08%
0.01%
0.52%
525
2,384
189
14,877
0.02%
0.10%
0.00%
0.54%
547
2,928
73
16,027
0.19%
1.00%
1.35%
0.45%
0.22%
0.01%
0.27%
5,832
30,545
41,270
13,632
6,585
165
8,233
0.19%
0.94%
1.25%
0.38%
0.20%
0.00%
0.31%
5,331
27,087
35,968
10,986
5,808
138
8,919
0.23%
0.91%
1.15%
0.31%
0.61%
0.01%
0.33%
6,946
27,357
34,323
9,199
18,338
152
9,839
0.55%
0.23%
0.42%
1.82%
0.31%
0.02%
0.02%
1.59%
16,729
7,117
12,734
55,405
9,333
677
711
48,585
1.38%
0.24%
0.34%
1.49%
0.26%
0.01%
0.03%
1.57%
39,786
7,023
9,709
42,804
7,445
268
841
45,113
0.98%
0.25%
0.28%
1.24%
0.24%
0.01%
0.03%
1.59%
29,346
7,441
8,409
37,149
7,198
255
959
47,469
0.06%
0.02%
0.01%
0.24%
0.32%
1,693
595
451
7,387
9,702
0.05%
0.03%
0.01%
0.28%
0.32%
1,563
981
389
8,165
9,176
0.05%
0.02%
0.02%
0.33%
0.42%
1,568
740
450
9,765
12,657
0.12%3,588 0.13%3,864 0.15%4,350
0.66%20,206 0.68%19,426 0.61%18,350
0.01%
0.03%
1.70%
206
979
51,689
0.01%
0.03%
3.79%
160
728
109,067
0.01%
0.02%
4.55%
272
717
136,147
1.46%44,629 1.64%47,058 1.71%51,129
28.36%
0.08%
864,230
2,400
20.85%
0.92%
599,427
26,322
14.61%
1.28%
437,456
38,197
0.09%
0.22%
2,873
6,612
0.09%
0.20%
2,451
5,794
0.07%
0.40%
2,241
12,087
0.36%
0.69%
10,935
20,940
0.26%
0.85%
7,578
24,565
0.17%
0.75%
5,100
22,388
0.04%1,302 0.04%1,144 0.03%964
0.03%
0.17%
972
5,226
0.03%
0.18%
770
5,157
0.02%
0.19%
725
5,569
Appendix B3: Detailed Report Categories over Three Years
CONSUMER SENTINEL NETWORK DATA BOOK 2018_____________________________________________________________________________________________
Percentages are based on the total number of Sentinel reports in 2016 (3,046,915), 2017 (2,875,016), and 2018 (2,994,483). Consumers can report more than one category orsubcategory.*These subcategories are counted as Other report types even though the broader category assigned is Fraud.

________________________________________________________________________________________________________________________________________FEDERAL TRADE COMMISSION · ftc.gov/data 86
Category Subcategory
2016
# ofReports
% ofReports
2017
# ofReports
% ofReports
2018
# ofReports
% ofReports
Health Care Connected Consumer Devices: Activity\Healthcare Trackers*
Health Care: Diet Products\Centers\Plans
Health Care: Dietary Supplements\Herbal Remedies
Health Care: Drugs-OTC\Prescription
Health Care: Eye Care*
Health Care: Medical Discount Plans\Cards\Insurance
Health Care: Other Medical Treatments*
Health Care: Other Products\Supplies*
Home Repair,Improvement andProducts
Home Appliances
Home Furnishings
Home Protection Devices
Home Repair
Housing
Identity Theft Identity Theft
Imposter Scams Imposter: Business
Imposter: Family\Friend
Imposter: Government
Romance Scams
Tech Support Scams
Internet Auction Internet Auction
Internet Services Broadband Internet Services and Content: Cost*
Broadband Internet Services and Content: Internet Access*
Broadband Internet Services and Content: Internet Speed*
Internet Access Services
Internet Information Services
Internet Web Site Design\Promotion
Malware and Computer Exploits
Online Payment Services
Social Networking Service
Video and Internet Gaming\Virtual Reality*
Investment Related Invest: Advice, Seminars
Invest: Art\Gems\Rare Coins
Invest: Other (note in comments)
Invest: Stocks\Commodity Futures Trading
Magazines and Books Books and Magazines
0.26%
0.13%
0.13%
0.09%
0.03%
0.09%
0.36%
0.00%
7,934
3,914
3,895
2,696
915
2,751
10,837
8
0.30%
0.15%
0.13%
0.12%
0.03%
0.10%
0.34%
0.00%
8,550
4,221
3,671
3,394
794
2,889
9,670
11
0.37%
0.35%
0.17%
0.14%
0.06%
0.08%
0.43%
0.00%
10,966
10,414
5,186
4,053
1,860
2,305
12,909
44
0.06%
0.06%
0.02%
0.03%
0.05%
1,738
1,887
688
842
1,545
0.06%
0.06%
0.02%
0.03%
0.05%
1,646
1,867
590
849
1,508
0.15%
0.10%
0.02%
0.03%
0.07%
4,469
3,026
738
1,044
2,059
13.09%398,952 12.91%371,034 14.85%444,602
1.52%
0.37%
9.12%
0.49%
2.20%
46,343
11,242
277,811
15,077
67,090
5.38%
0.59%
6.62%
0.66%
2.89%
154,732
16,913
190,205
18,930
83,179
4.77%
0.72%
8.50%
0.71%
3.26%
142,904
21,538
254,626
21,286
97,505
0.08%2,445 0.08%2,309 0.06%1,699
0.18%
0.13%
0.06%
0.12%
0.80%
0.24%
5,509
4,042
1,691
3,508
24,513
7,346
0.14%
0.24%
0.14%
0.06%
0.12%
0.80%
0.22%
0.00%
0.00%
4,161
7,026
3,975
1,843
3,375
22,980
6,276
1
1
0.12%
0.28%
0.26%
0.08%
0.11%
1.06%
0.14%
0.01%
0.01%
0.03%
3,736
8,308
7,826
2,444
3,347
31,826
4,169
419
397
824
0.03%
0.44%
0.02%
0.26%
1,024
13,490
578
7,846
0.05%
0.24%
0.02%
0.24%
1,319
7,028
597
6,982
0.04%
0.20%
0.02%
0.24%
1,166
6,087
480
7,151
0.27%8,228 0.20%5,809 0.21%6,309
Appendix B3: Detailed Report Categories over Three Years
CONSUMER SENTINEL NETWORK DATA BOOK 2018_____________________________________________________________________________________________
Percentages are based on the total number of Sentinel reports in 2016 (3,046,915), 2017 (2,875,016), and 2018 (2,994,483). Consumers can report more than one category orsubcategory.*These subcategories are counted as Other report types even though the broader category assigned is Fraud.

________________________________________________________________________________________________________________________________________FEDERAL TRADE COMMISSION · ftc.gov/data 87
Category Subcategory
2016
# ofReports
% ofReports
2017
# ofReports
% ofReports
2018
# ofReports
% ofReports
Miscellaneous Reports Children's Products
Food
Garments, Wool, Leather Goods & Textiles
Health Care Provider Billing
Immigration Services
Insurance (Other than Medical)
Jewelry\Watches
Leasing: Business
Modeling Agencies\Services
Personal Care Products
Property\Inheritance Tracers
Real Estate (not Timeshares)
Tobacco Products
Utilities
Mortgage Foreclosure Relief andDebt Management
Debt Management\Credit Counseling
Mortgage Modification\Foreclosure Relief
Office Supplies and Services Office Supplies and Services
Office: Ad Space\Directory Listings
Prizes, Sweepstakes and Lotteries Prizes\Sweepstakes\Lotteries
Shop-at-Home and Catalog Sales Negative Online Reviews*
Shop-at-Home\Catalog Sales
Tax Preparers Tax Preparers
Telephone and Mobile Services Connected Consumer Devices: General*
Mobile: Accessories, Devices, and Services
Mobile: Applications\Other Downloads
Mobile: Carrier Rates\Plans
Mobile: Text Messages
Mobile: Unauthorized Charges or Debits
Telephone: Carrier Switching
Telephone: Other
Telephone: Prepaid Phone Cards
Telephone: Rates\Advertising
Telephone: Unauthorized Charges or Debits
Telephone: VoIP Services
Television and Electronic Media Digital Media\Streaming
Television (Programming and Advertisements)
Television: Satellite & Cable
Travel, Vacations and TimesharePlans
Timeshare Resales
Timeshare Sales
Travel\Vacations
Unspecified Reports Other (Note in Comments)
Telemarketing Practices
Unauthorized Debits or Charges for Unknown Products
Unsolicited Email
0.04%0.01%0.06%0.00%0.02%0.01%0.01%0.03%0.06%0.04%0.04%0.02%0.02%0.04%
1,3094241,716936333483088181,7031,1651,2255405661,227
0.04%0.02%0.09%0.01%0.03%0.01%0.01%0.05%0.05%0.05%0.04%0.01%0.02%0.04%
1,0074992,5381768242322801,3311,3311,3081,0123396331,201
0.08%0.02%0.28%0.01%0.05%0.01%0.01%0.11%0.10%0.04%0.04%0.02%0.07%0.06%
2,2745598,4112851,4521922643,4073,0311,2921,0895072,0571,736
0.11%0.22%
3,4006,720
0.08%0.26%
2,2837,479
0.04%0.29%
1,2098,830
0.20%0.11%
6,2113,362
0.18%0.08%
5,0522,305
0.11%0.07%
3,2662,084
5.22%159,111 4.98%143,121 4.42%132,470
3.94%120,079 4.62%132,709 4.77%0.01%
142,929228
0.15%4,432 0.13%3,629 0.14%4,103
0.03%0.02%0.00%0.06%0.42%0.01%0.04%1.63%0.17%0.05%1.51%
79964259
1,78512,8443731,23549,5485,0871,40145,935
0.02%0.02%0.00%0.05%0.74%0.01%0.05%2.50%0.17%0.06%1.75%
66946248
1,44121,3864001,35471,7764,9861,60650,443
0.02%0.01%0.00%0.04%0.72%0.02%0.04%3.12%0.17%0.06%1.41%0.01%
56836332
1,12221,6815181,30493,3184,9551,94242,345183
1.76%0.05%0.01%
53,4801,516341
1.55%0.06%0.01%
44,4591,753259
1.20%0.06%0.03%
35,8601,671847
0.38%0.23%0.08%
11,7197,1072,521
0.53%0.23%0.09%
15,2656,5142,448
0.66%0.21%0.08%
19,8066,3962,325
0.49%0.04%2.46%6.38%
15,0331,25875,101194,526
0.57%0.04%2.84%6.10%
16,3181,17081,558175,388
0.75%0.04%2.94%6.46%
22,5771,25387,905193,417
Appendix B3: Detailed Report Categories over Three Years
CONSUMER SENTINEL NETWORK DATA BOOK 2018_____________________________________________________________________________________________
Percentages are based on the total number of Sentinel reports in 2016 (3,046,915), 2017 (2,875,016), and 2018 (2,994,483). Consumers can report more than one category orsubcategory.*These subcategories are counted as Other report types even though the broader category assigned is Fraud.
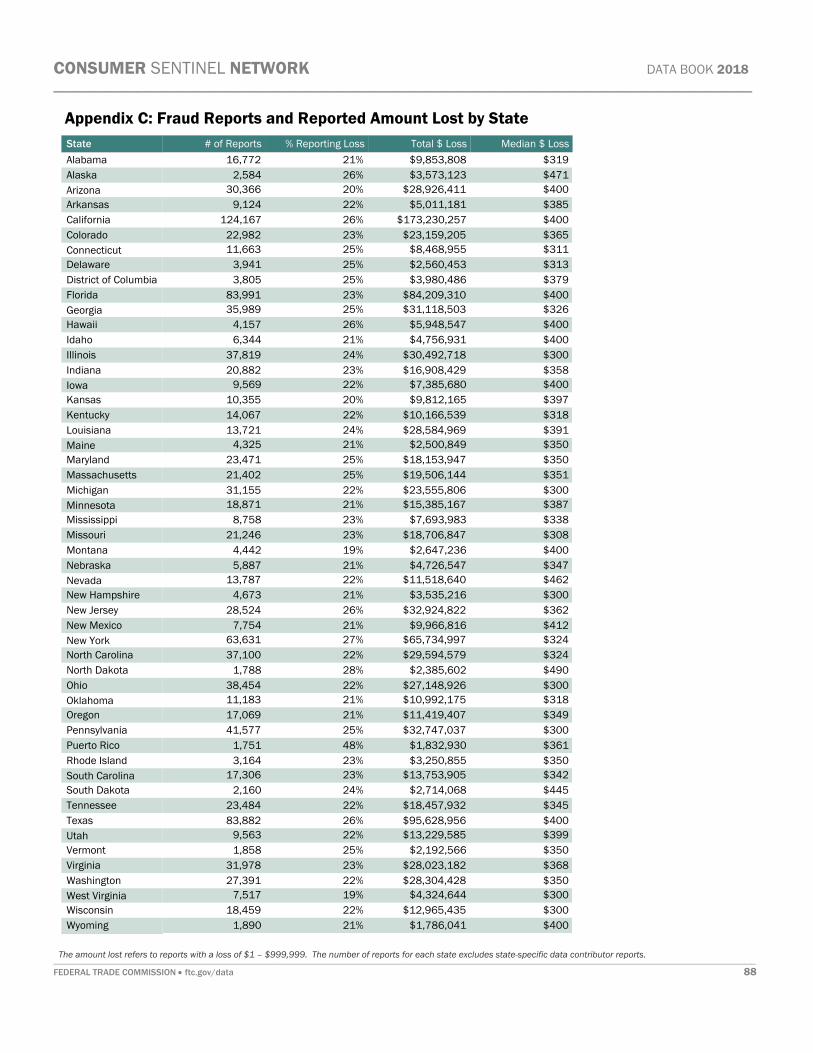
________________________________________________________________________________________________________________________________________FEDERAL TRADE COMMISSION · ftc.gov/data 88
State # of Reports % Reporting Loss Total $ Loss Median $ LossAlabamaAlaskaArizonaArkansasCaliforniaColoradoConnecticutDelawareDistrict of ColumbiaFloridaGeorgiaHawaiiIdahoIllinoisIndianaIowaKansasKentuckyLouisianaMaineMarylandMassachusettsMichiganMinnesotaMississippiMissouriMontanaNebraskaNevadaNew HampshireNew JerseyNew MexicoNew YorkNorth CarolinaNorth DakotaOhioOklahomaOregonPennsylvaniaPuerto RicoRhode IslandSouth CarolinaSouth DakotaTennesseeTexasUtahVermontVirginiaWashingtonWest VirginiaWisconsinWyoming $400
$300$300$350$368$350$399$400$345$445$342$350$361$300$349$318$300$490$324$324$412$362$300$462$347$400$308$338$387$300$351$350$350$391$318$397$400$358$300$400$400$326$400$379$313$311$365$400$385$400$471$319
$1,786,041$12,965,435$4,324,644$28,304,428$28,023,182$2,192,566$13,229,585$95,628,956$18,457,932$2,714,068$13,753,905$3,250,855$1,832,930$32,747,037$11,419,407$10,992,175$27,148,926$2,385,602$29,594,579$65,734,997$9,966,816$32,924,822$3,535,216$11,518,640$4,726,547$2,647,236$18,706,847$7,693,983$15,385,167$23,555,806$19,506,144$18,153,947$2,500,849$28,584,969$10,166,539$9,812,165$7,385,680$16,908,429$30,492,718$4,756,931$5,948,547$31,118,503$84,209,310$3,980,486$2,560,453$8,468,955$23,159,205$173,230,257$5,011,181$28,926,411$3,573,123$9,853,808
21%22%19%22%23%25%22%26%22%24%23%23%48%25%21%21%22%28%22%27%21%26%21%22%21%19%23%23%21%22%25%25%21%24%22%20%22%23%24%21%26%25%23%25%25%25%23%26%22%20%26%21%
1,89018,4597,51727,39131,9781,8589,56383,88223,4842,16017,3063,1641,75141,57717,06911,18338,4541,78837,10063,6317,75428,5244,67313,7875,8874,44221,2468,75818,87131,15521,40223,4714,32513,72114,06710,3559,56920,88237,8196,3444,15735,98983,9913,8053,94111,66322,982124,1679,12430,3662,58416,772
Appendix C: Fraud Reports and Reported Amount Lost by State
CONSUMER SENTINEL NETWORK DATA BOOK 2018_____________________________________________________________________________________________
The amount lost refers to reports with a loss of $1 – $999,999. The number of reports for each state excludes state-specific data contributor reports.

FEDERAL TRADE COMMISSION ▪ ftc.gov/data
Recommended

![Suitability of sentinel abattoirs for syndromic ... · syndromic surveillance and utilize data from sentinel vet-erinarians or veterinary practices [6,7]. Animal health data including](https://img.pdfslide.us/doc/110x75/5ffc14bdb3970b5ab33cdf7b/suitability-of-sentinel-abattoirs-for-syndromic-syndromic-surveillance-and-utilize.jpg)