ThyssenKrupp�Steel�EuropeThyssenKrupp�Steel�EuropeThyssenKrupp�Steel�EuropeThyssenKrupp�Steel�Europe
Considerations�for�the�Development�of�New�Ultra-High�Strength�Steels
Experiences from Experiments�and Simulations ofHydrogen�Embrittlement
Dr.�R.G.�Thiessen,�Dr.�O.�Rott08.10.2014

HE�– Multi-Scale Modelling and Measurement�:�NPL,�UK
08.10.2014
Dr.�R.G.�Thiessen
2222 ThyssenKrupp�Steel�EuropeThyssenKrupp�Steel�EuropeThyssenKrupp�Steel�EuropeThyssenKrupp�Steel�Europe
Considerations�for�the�Development�of�New�UHSSOutline
• Introduction
• Material�characterization
− Mechanical properties
− Microstructural features &�Hydrogen�Management
• Modelling to Understand Test�Results
− Model�Construction,�Constraints and Assumptions
− Stresses�and Strain Distribution�at�Critical�Stages
• Summary,�Conclusions,�&�Remarks

HE�– Multi-Scale Modelling and Measurement�:�NPL,�UK
08.10.2014
Dr.�R.G.�Thiessen
3333 ThyssenKrupp�Steel�EuropeThyssenKrupp�Steel�EuropeThyssenKrupp�Steel�EuropeThyssenKrupp�Steel�Europe
Introduction:�High�Demands on�High-Strength Steels
• High�demands on�strength,�but�also�deformation
− Improved efficiency/performance
− Higher�safety
• In�many cases,�only materials that canundergo complex forming steps can yield theadvantage of higher strength � structuralstiffness
• No single material�can satisfy all�demands(not�to mention cost considerations)��various materials developed for specificapplications
Ductility and Formability required
hole-expansionbending +�stretching
strength

HE�– Multi-Scale Modelling and Measurement�:�NPL,�UK
08.10.2014
Dr.�R.G.�Thiessen
4444 ThyssenKrupp�Steel�EuropeThyssenKrupp�Steel�EuropeThyssenKrupp�Steel�EuropeThyssenKrupp�Steel�Europe
Introduction:�High�Demands on�High-Strength Steels
• High�demands on�strength,�but�also�deformation
− Improved efficiency/performance
− Higher�safety
• In�many cases,�only complex forming stepscan take advantage of higher strength �
structural stiffness
• No single material�can satisfy all�demands(not�to mention cost considerations)��various materials developed for specificapplications
Ductility and Formability requiredPlastic strain - Membrane
Major�Stress�– Outer Layer

HE�– Multi-Scale Modelling and Measurement�:�NPL,�UK
08.10.2014
Dr.�R.G.�Thiessen
5555 ThyssenKrupp�Steel�EuropeThyssenKrupp�Steel�EuropeThyssenKrupp�Steel�EuropeThyssenKrupp�Steel�Europe
Introduction:�Some Typical Testing Methods for Susceptibility to HEVarious demands cannot be combined into a�single test
Cup�test�(uncoated)
• 10�cups�����������(ß�=�2,0�/�ßmax)
• 5%�NaCl
• Visual�control
no�cracks
(4�weeks)
Constant�load testwith RSW�under corrosion
(uncoated /�EG)
no�cracks
(240�hrs�at�70%shear�strength)
• 5�samples
• RSW�according�to�SEP�1220/2
• Joining�Imax
• Cataphoretic painting
• Corrosion�exposure�by�INKA*-spray
*Audi:�Ingolstädter Korrosions- und�Alterungstest
Test�with RSW-stress�under corrosion(uncoated /�EG)
• 3 samples
• RSW-stress�by�distance-plates
• Corrosion�exposure�by�5%�NaClor�climate�change�(DIN�EN�ISO�11997/1B)
no cracks
(4�weeks NaCl����or 6�weeks cycliccorrosion test)

HE�– Multi-Scale Modelling and Measurement�:�NPL,�UK
08.10.2014
Dr.�R.G.�Thiessen
6666 ThyssenKrupp�Steel�EuropeThyssenKrupp�Steel�EuropeThyssenKrupp�Steel�EuropeThyssenKrupp�Steel�Europe
Considerations�for�the�Development�of�New�UHSSOutline
• Introduction
• Material�characterization
− Mechanical properties
− Microstructural features &�Hydrogen�Management
• Modelling to Understand Test�Results
− Model�Construction,�Constraints and Assumptions
− Stresses�and Strain Distribution�at�Critical�Stages
• Summary,�Conclusions,�&�Remarks

HE�– Multi-Scale Modelling and Measurement�:�NPL,�UK
08.10.2014
Dr.�R.G.�Thiessen
7777 ThyssenKrupp�Steel�EuropeThyssenKrupp�Steel�EuropeThyssenKrupp�Steel�EuropeThyssenKrupp�Steel�Europe
Material�Characterisation
Au�Au�Au�Au�
[%][%][%][%]
A50�A50�A50�A50�
[%][%][%][%]
Rp02�Rp02�Rp02�Rp02�
[MPa][MPa][MPa][MPa]
RmRmRmRm
[MPa][MPa][MPa][MPa]
DP�Steel�(T) 7.9 12.3 602 1185
TDP�Steel�(T) 1.7 5.2 1230 1250
• Both�materials�have�identical�chemistry�(C-Mn w�Ti)�and�a�UTS�of�1200�MPa (±50�MPa)
• DP-Steel�has�a�much�lower�yield�stress
• Uniform�elongation�is�much�lower�in�TDP-Steel�(elongation�after�necking�only�slightly�lower�:�3.5�to�4.4%)
DP-Steel�(T)DP-Steel�(L)TDP-Steel�(T)TDP-Steel�(L)
Mechanical Properties�– Tensile Properties�

HE�– Multi-Scale Modelling and Measurement�:�NPL,�UK
08.10.2014
Dr.�R.G.�Thiessen
8888 ThyssenKrupp�Steel�EuropeThyssenKrupp�Steel�EuropeThyssenKrupp�Steel�EuropeThyssenKrupp�Steel�Europe
Material�Characterisation
• Higher�bending�angle�achieved�with�TDP-Steel��(α (Fmax) for TDP=94°,�for DP=82°)
• Hole�expansion�more�than�5-times�higher�for�TDP-Steel�(λ(ISO-TS) [%]�for TDP=54%,�for DP=10%)
Mechanical Properties�– Forming Properties�
DP
TDP
0 20 40 60 80 1000
1000
2000
3000
4000
5000
6000
7000
172602L1
172602L2
172602Q1
172602Q2
F, N
α, °
172603L1
172603L2
172603Q1
172603Q2
DP-Steel�(T,�L)
TDP-Steel�(T,L)

HE�– Multi-Scale Modelling and Measurement�:�NPL,�UK
08.10.2014
Dr.�R.G.�Thiessen
9999 ThyssenKrupp�Steel�EuropeThyssenKrupp�Steel�EuropeThyssenKrupp�Steel�EuropeThyssenKrupp�Steel�Europe
Material�Characterisation
TDP-Steel
DP-SteelMicrostructural Features�- SEM
• DP-Steel�consists�of�martensite�with�a�fine�sub-structure�and�ferrite
• Fine�carbides�are�visible�in�ferrite
• TDP-Steel�is�comprised�of�tempered�(visibly�decomposed�with�large�carbides)�and�smaller�ferritic grains
• Fine�carbides�are�also�visible�in�ferrite

Steel�&�Hydrogen�2014
05.05.2014
Dr.�R.G.�Thiessen
10101010 ThyssenKrupp�Steel�EuropeThyssenKrupp�Steel�EuropeThyssenKrupp�Steel�EuropeThyssenKrupp�Steel�Europe
Material�CharacterisationSTE�Microscopy (metal-foil)�:�DP-Steel�and TDP-Steel
602 603
1301_011444
• overview of ferrite and martensite�in�both microstructures
• martensite�distinguished by highly faceted,�darker appearance
DP-Steel TDP-Steel
Steel�&�Hydrogen�2014
05.05.2014
Dr.�R.G.�Thiessen
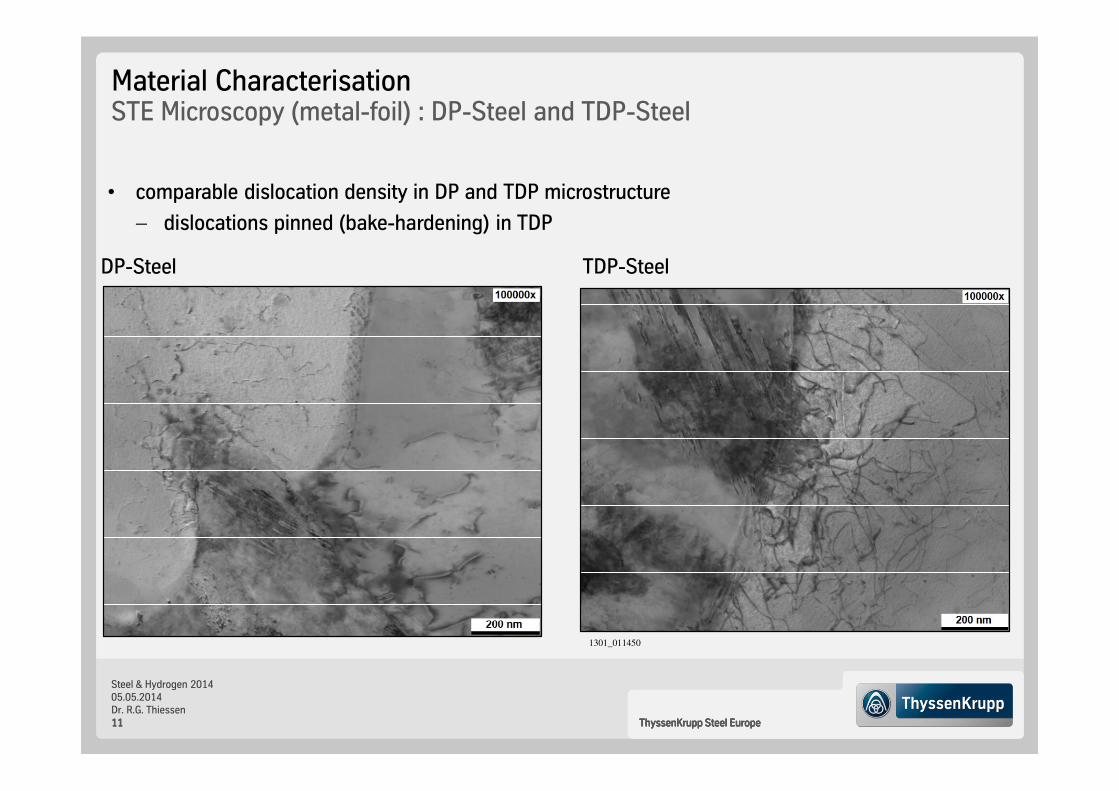
11111111 ThyssenKrupp�Steel�EuropeThyssenKrupp�Steel�EuropeThyssenKrupp�Steel�EuropeThyssenKrupp�Steel�Europe
Material�CharacterisationSTE�Microscopy (metal-foil)�:�DP-Steel�and TDP-Steel
602
0
603
1301_011450
• comparable dislocation density in�DP�and TDP�microstructure
− dislocations pinned (bake-hardening)�in�TDP
DP-Steel TDP-Steel

Steel�&�Hydrogen�2014
05.05.2014
Dr.�R.G.�Thiessen
12121212 ThyssenKrupp�Steel�EuropeThyssenKrupp�Steel�EuropeThyssenKrupp�Steel�EuropeThyssenKrupp�Steel�Europe
Material�Characterisation
TDP-Steel
DP-SteelHydrogen�Management:�Solubility and Binding
• TDA�with�increasing�heating�rate�allowed�estimation�of�effective�binding�energy�(Choo &�Lee�Model)
− DP�and�TDP�have�comparable�binding�energies
• Permeation�experiments�provided�indication�of�effective�coefficient�of�diffusion
− higher�diffusion�in�TDP�than�in�DP
• Diffusible�(RT�upto 350°C)�is�comparable�in�DP�and�TDP
Binding�Energy
- 33�- 36kJ/mol
Diffusion
- instat.:1.47E-7�cm2/s�
- stat:�6.61E-7�cm2/s
Diff.�H:�0.63�ppm
Binding�Energy
- 34�- 35kJ/mol
Diffusion
- instat.:2.20E-7�cm2/s�
- stat:�9.16E-7�cm2/s
Diff.�H:�0.65�ppm
TDA
TDA

Steel�&�Hydrogen�2014
05.05.2014
Dr.�R.G.�Thiessen
13131313 ThyssenKrupp�Steel�EuropeThyssenKrupp�Steel�EuropeThyssenKrupp�Steel�EuropeThyssenKrupp�Steel�Europe
Mini-Summary�of Mechanical/Microstructure CharacterisationMechanical Properties�relevant�for Hydrogen�Embrittlement?
• Inhomogeneity�between�mechanical�properties�of�phases�is�significantly�higher�in�DP�than�TDP�
− DP:�50/50�Ferrite/Martensite
− TDP:�10/90�bake-hardened�Ferrite/tempered�Martensite
• Excellent�uniform�elongation�in�DP�based�on�localized�plastic�flow�in�ferrite
− Micro-localisation of�strain�can�be�deleterious�in�forming�operations�that�superpose�a�macro-localisation of�the�material�deformation�� exaggerated�localisation leads�to�overloading�of�ferrite�and�crack�initiation
• Improved�bending�and�hole-expansion�properties�in�TDP�due�to�reduced�disparity�between�mechanical�properties�of�phases
• Dislocations�in�TDP�pinned�by�carbon�(bake-hardening�effect)

HE�– Multi-Scale Modelling and Measurement�:�NPL,�UK
08.10.2014
Dr.�R.G.�Thiessen
14141414 ThyssenKrupp�Steel�EuropeThyssenKrupp�Steel�EuropeThyssenKrupp�Steel�EuropeThyssenKrupp�Steel�Europe
Considerations�for�the�Development�of�New�UHSSOutline
• Introduction
• Material�characterization
− Mechanical properties
− Microstructural features &�Hydrogen�Management
• Modelling to Understand Test�Results
− Model�Construction,�Constraints and Assumptions
− Stresses�and Strain Distribution�at�Critical�Stages
• Summary,�Conclusions,�&�Remarks

Steel�&�Hydrogen�2014
05.05.2014
Dr.�R.G.�Thiessen
15151515 ThyssenKrupp�Steel�EuropeThyssenKrupp�Steel�EuropeThyssenKrupp�Steel�EuropeThyssenKrupp�Steel�Europe
0,5�mm
Simulation�Construction:�Boundary�ConditionsSymmetry�and�Free�Edges�(Sample�Thickness:�1�mm)
Symmetry
Symmetry
(2D-Symm)
Symmetry�(smallest�cross-section)
Stress-Free
Edge�(2D-Free)Edge�for�
Line-Evaluations
Region�of�Simulation
2D-Symm�≈�plane�strain
2D-Free�≈�plane�stress

Steel�&�Hydrogen�2014
05.05.2014
Dr.�R.G.�Thiessen
16161616 ThyssenKrupp�Steel�EuropeThyssenKrupp�Steel�EuropeThyssenKrupp�Steel�EuropeThyssenKrupp�Steel�Europe
Simulation�Construction :�Material�Description�Flow�Curves and Fits ( ) ( ) ( )( )ξασσασα −−−++= ∞ exp1
YYHK
�� (MPa) � (MPa) �� (MPa) �
DP 623 1969 1129 132
TDP 1108 50 1240 84

Steel�&�Hydrogen�2014
05.05.2014
Dr.�R.G.�Thiessen
17171717 ThyssenKrupp�Steel�EuropeThyssenKrupp�Steel�EuropeThyssenKrupp�Steel�EuropeThyssenKrupp�Steel�Europe
Simulation�Construction:�Assumptions
TDP-Steel
DP-Steel
Motivation�for using same�material�stress-strain relation with and without H
• 1h�precharging in�20%�NH4SCN
• Samples�unnotched
• Strain�rate:�2E-6�s-1�
• Straining�in�medium�(continued�charging�during�straining)
• H-charged�samples�follow�the�stress-strain�path�of�the�uncharged�samples
AIRAIRAIRAIR
NHNHNHNH4444SCNSCNSCNSCN

Steel�&�Hydrogen�2014
05.05.2014
Dr.�R.G.�Thiessen
18181818 ThyssenKrupp�Steel�EuropeThyssenKrupp�Steel�EuropeThyssenKrupp�Steel�EuropeThyssenKrupp�Steel�Europe
Test�Results of SSRT�(notched samples;�air +�NH4SCN)Basis�for Simulation
0
200
400
600
800
1000
1200
1400
0 0,1 0,2 0,3 0,4 0,5 0,6 0,7 0,8
Stress
�base
d�on�smalle
st�Cross
Stress
�base
d�on�smalle
st�Cross
Stress
�base
d�on�smalle
st�Cross
Stress
�base
d�on�smalle
st�Cross
-- -- Section��
Section��
Section��
Section��(M
Pa)
(MPa)
(MPa)
(MPa)
Grip�Displacement�(mmGrip�Displacement�(mmGrip�Displacement�(mmGrip�Displacement�(mm))))
DP
TDP
H-Fracture in�TDP�(after�ca.�650s,�637,3�MPa)�
H-Fracture in�DP�(after�ca.�500s,�481,8�MPa)

Steel�&�Hydrogen�2014
05.05.2014
Dr.�R.G.�Thiessen
19191919 ThyssenKrupp�Steel�EuropeThyssenKrupp�Steel�EuropeThyssenKrupp�Steel�EuropeThyssenKrupp�Steel�Europe
Comparison of the von�Mises Equivalent StressMid-Plane�at�Notch Area
1200TM09:�F/Amin =�637,3�MPa1200M04:�F/Amin =�481,8�MPa

Steel�&�Hydrogen�2014
05.05.2014
Dr.�R.G.�Thiessen
20202020 ThyssenKrupp�Steel�EuropeThyssenKrupp�Steel�EuropeThyssenKrupp�Steel�EuropeThyssenKrupp�Steel�Europe
Comparison of the Effective Plastic StrainMid-Plane�at�Notch Area
1200TM09:�F/Amin =�637,3�MPa1200M04:�F/Amin =�481,8�MPa

Steel�&�Hydrogen�2014
05.05.2014
Dr.�R.G.�Thiessen
21212121 ThyssenKrupp�Steel�EuropeThyssenKrupp�Steel�EuropeThyssenKrupp�Steel�EuropeThyssenKrupp�Steel�Europe
Comparison of the Hydrostatic StressMid-Plane�at�Notch Area
1200TM09:�F/Amin =�637,3�MPa1200M04:�F/Amin =�481,8�MPa

Steel�&�Hydrogen�2014
05.05.2014
Dr.�R.G.�Thiessen
22222222 ThyssenKrupp�Steel�EuropeThyssenKrupp�Steel�EuropeThyssenKrupp�Steel�EuropeThyssenKrupp�Steel�Europe
Comparison of the Hydrostatic Stress�on�Plane�of Smallest Cross-Section
1200TM09:�F/Amin =�637,3�MPa1200M04:�F/Amin =�481,8�MPa
Steel�&�Hydrogen�2014
05.05.2014
Dr.�R.G.�Thiessen
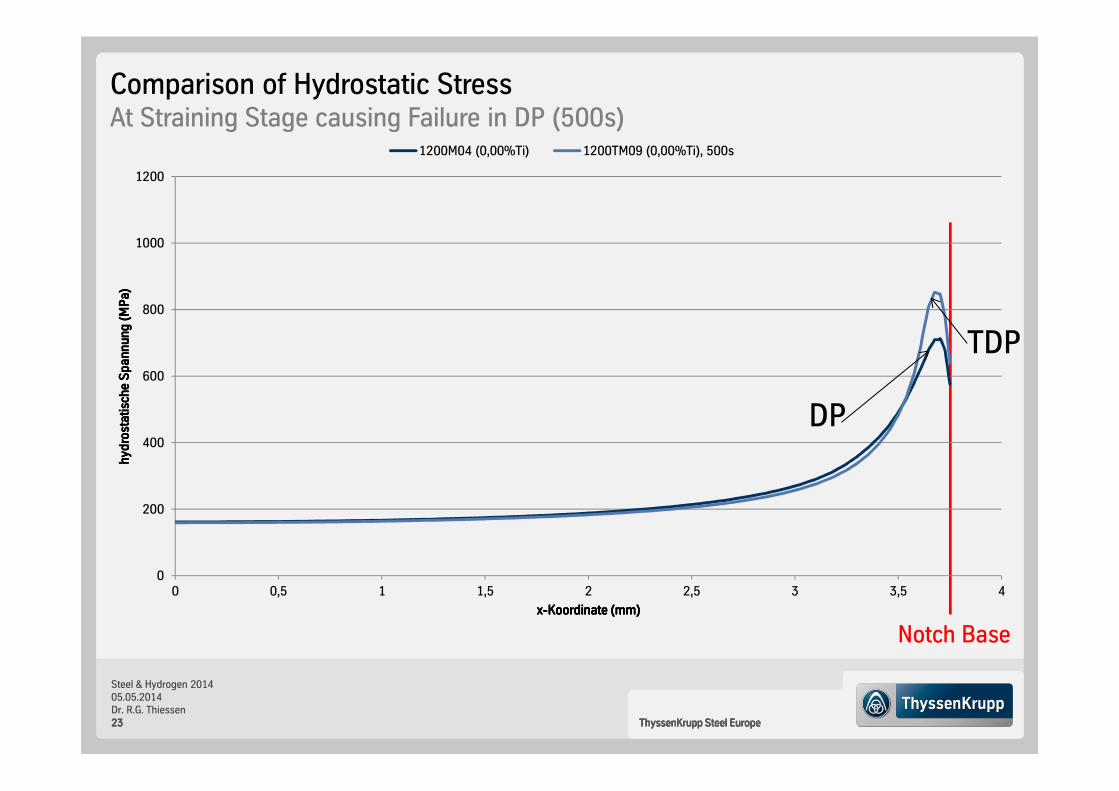
23232323 ThyssenKrupp�Steel�EuropeThyssenKrupp�Steel�EuropeThyssenKrupp�Steel�EuropeThyssenKrupp�Steel�Europe
Comparison of Hydrostatic Stress�At�Straining Stage�causing Failure in�DP�(500s)
Notch Base
0
200
400
600
800
1000
1200
0 0,5 1 1,5 2 2,5 3 3,5 4
hydrostatisc
he�Spannung�(MPa)
hydrostatisc
he�Spannung�(MPa)
hydrostatisc
he�Spannung�(MPa)
hydrostatisc
he�Spannung�(MPa)
xxxx----Koordinate�(mm)Koordinate�(mm)Koordinate�(mm)Koordinate�(mm)
1200M04�(0,00%Ti) 1200TM09�(0,00%Ti),�500s
DP
TDP
Steel�&�Hydrogen�2014
05.05.2014
Dr.�R.G.�Thiessen
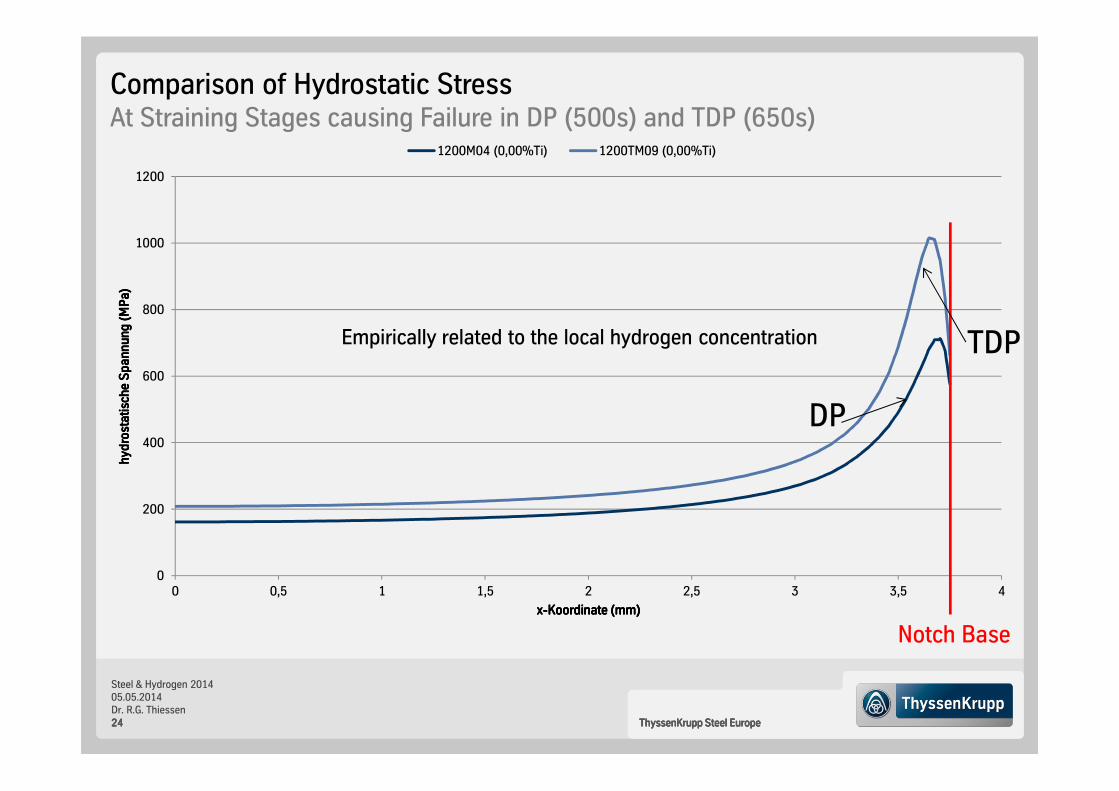
24242424 ThyssenKrupp�Steel�EuropeThyssenKrupp�Steel�EuropeThyssenKrupp�Steel�EuropeThyssenKrupp�Steel�Europe
Comparison of Hydrostatic Stress�At�Straining Stages�causing Failure in�DP�(500s)�and TDP�(650s)
0
200
400
600
800
1000
1200
0 0,5 1 1,5 2 2,5 3 3,5 4
hydrostatisc
he�Spannung�(MPa)
hydrostatisc
he�Spannung�(MPa)
hydrostatisc
he�Spannung�(MPa)
hydrostatisc
he�Spannung�(MPa)
xxxx----Koordinate�(mm)Koordinate�(mm)Koordinate�(mm)Koordinate�(mm)
1200M04�(0,00%Ti) 1200TM09�(0,00%Ti)
Empirically related to the local hydrogen�concentration
Notch Base
DP
TDP

Steel�&�Hydrogen�2014
05.05.2014
Dr.�R.G.�Thiessen
25252525 ThyssenKrupp�Steel�EuropeThyssenKrupp�Steel�EuropeThyssenKrupp�Steel�EuropeThyssenKrupp�Steel�Europe
0
0,5
1
1,5
2
2,5
3
3 3,1 3,2 3,3 3,4 3,5 3,6 3,7 3,8
effektive
�pl.�Dehnung�(%)
effektive
�pl.�Dehnung�(%)
effektive
�pl.�Dehnung�(%)
effektive
�pl.�Dehnung�(%)
xxxx----Koordinate�(mm)Koordinate�(mm)Koordinate�(mm)Koordinate�(mm)
1200M04�(0,00%Ti) 1200TM09�(0,00%�Ti),�500s max.�hydr.�Sp.�(DP) max.�hydr.�Sp.�(TM,�500s)
Comparison of Effective Plastic StrainAt�Straining Stage�causing Failure in�DP�(500s)
Notch Base
DP TDP
��̅ 0.035 ��̅ 0.016
max.�hydrostatic stress

Steel�&�Hydrogen�2014
05.05.2014
Dr.�R.G.�Thiessen
26262626 ThyssenKrupp�Steel�EuropeThyssenKrupp�Steel�EuropeThyssenKrupp�Steel�EuropeThyssenKrupp�Steel�Europe
0
0,5
1
1,5
2
2,5
3
3 3,1 3,2 3,3 3,4 3,5 3,6 3,7 3,8
effektive
�pl.�Dehnung�(%)
effektive
�pl.�Dehnung�(%)
effektive
�pl.�Dehnung�(%)
effektive
�pl.�Dehnung�(%)
xxxx----Koordinate�(mm)Koordinate�(mm)Koordinate�(mm)Koordinate�(mm)
1200M04�(0,00%Ti) 1200TM09�(0,00%�Ti) max.�hydr.�Spannung�(DP) max.�hydr.�Spannung�(TM)
Comparison of Effective Plastic StrainAt�Straining Stages�causing Failure in�DP�(500s)�and TDP�(650s)
Notch Base
DP TDP
��̅ 0.035 ��̅ 0.040
max.�hydrostatic stress

Steel�&�Hydrogen�2014
05.05.2014
Dr.�R.G.�Thiessen
27272727 ThyssenKrupp�Steel�EuropeThyssenKrupp�Steel�EuropeThyssenKrupp�Steel�EuropeThyssenKrupp�Steel�Europe
Mini-Summary�of Simulation�Results
• DP-Steel
− max.�strain (air)�Φmax =�0.077�(=7.7%)
− max.�pl. deformation at�notch base 1.8%
− max.�hydrostatic stress�ca.�710�MPa
− eff.�pl. deformation at�max.�hydrostatic stress�ca.�0.75%
− at�fracture (500s),�ave.�εPL in�DP�=�0.035�(TDP�=�0.016)�&�max.�σH =�713MPa�(in�TDP=825MPa)
� TDP�doesn‘t fail due�to lower eff.�Pl.�Strain???
• TDP-Steeel
− max.�strain (air)�Φmax =�0.030�(=3.0%)
− max.�pl. deformation at�notch base 2.5%
− max.�hydrostatic stress�ca.�1014�MPa
− eff.�pl. deformation at�max.�hydrostatic stress�ca.�0.50%
− at�fracture (650s),�average εPL in�TDP�=�0.040�&�max.�σH =�1015MPa
HE�– Multi-Scale Modelling and Measurement�:�NPL,�UK
08.10.2014
Dr.�R.G.�Thiessen
28282828 ThyssenKrupp�Steel�EuropeThyssenKrupp�Steel�EuropeThyssenKrupp�Steel�EuropeThyssenKrupp�Steel�Europe
Considerations�for�the�Development�of�New�UHSSOutline
• Introduction
• Material�characterization
− Mechanical properties
− Microstructural features &�Hydrogen�Management
• Modelling to Understand Test�Results
− Model�Construction,�Constraints and Assumptions
− Stresses�and Strain Distribution�at�Critical�Stages
• Summary,�Conclusions,�&�Remarks
HE�– Multi-Scale Modelling and Measurement�:�NPL,�UK
08.10.2014
Dr.�R.G.�Thiessen
29292929 ThyssenKrupp�Steel�EuropeThyssenKrupp�Steel�EuropeThyssenKrupp�Steel�EuropeThyssenKrupp�Steel�Europe
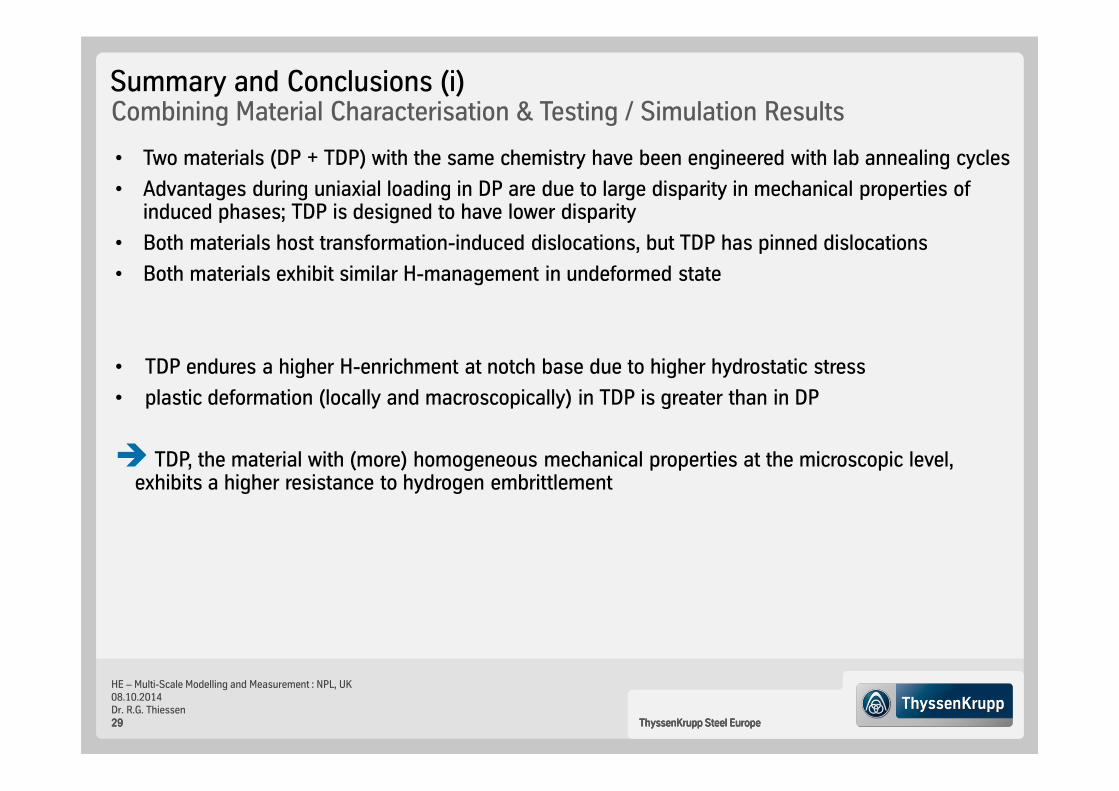
Summary�and�Conclusions�(i)
• Two materials (DP�+�TDP)�with the same�chemistry have been engineered with lab�annealing cycles
• Advantages�during uniaxial loading in�DP�are due�to large�disparity in�mechanical properties ofinduced phases;�TDP�is designed to have lower disparity
• Both materials host�transformation-induced dislocations,�but�TDP�has pinned dislocations
• Both materials exhibit similar H-management�in�undeformed state
• TDP�endures a�higher H-enrichment at�notch base due�to higher hydrostatic stress
• plastic deformation (locally and macroscopically)�in�TDP�is greater than in�DP
� TDP,�the material�with (more)�homogeneous mechanical properties at�the microscopic level,�exhibits a�higher resistance to hydrogen�embrittlement
Combining Material�Characterisation &�Testing /�Simulation�Results

HE�– Multi-Scale Modelling and Measurement�:�NPL,�UK
08.10.2014
Dr.�R.G.�Thiessen
30303030 ThyssenKrupp�Steel�EuropeThyssenKrupp�Steel�EuropeThyssenKrupp�Steel�EuropeThyssenKrupp�Steel�Europe
Summary�and�Conclusions�(ii)
• Open�question:�
− observations based on�ferritic microstructures (high�diffusibility,�low solubility)�� valid�forfundamentally different�microstructures?
• When developing rankings,�please combine apples with apples
− comparing loss of ductility (delta-factors)�can lose�sight of the higher absolute�elongation
− rankings should be developed between materials that satisfy requirements for an�application(multiple�properties,�such�as yield stress,�strength,�elongation,�bending &/or HER)
Open�Questions and Requests
HE�– Multi-Scale Modelling and Measurement�:�NPL,�UK
08.10.2014
Dr.�R.G.�Thiessen
31313131 ThyssenKrupp�Steel�EuropeThyssenKrupp�Steel�EuropeThyssenKrupp�Steel�EuropeThyssenKrupp�Steel�Europe
Thank-you for yourattention…
Questions?
Research�for this publication was�supported in�part by theRFCS�grant number RFSR-CT-2010-00020
Recommended