http://ltj.sagepub.com/Language Testing
http://ltj.sagepub.com/content/29/1/43The online version of this article can be found at:
DOI: 10.1177/0265532211404383 2012 29: 43 originally published online 15 June 2011Language TestingTan Jin, Barley Mak and Pei Zhou
exact?Confidence scoring of speaking performance: How does fuzziness become
Published by:
http://www.sagepublications.com
can be found at:Language TestingAdditional services and information for
http://ltj.sagepub.com/cgi/alertsEmail Alerts:
http://ltj.sagepub.com/subscriptionsSubscriptions:
http://www.sagepub.com/journalsReprints.navReprints:
http://www.sagepub.com/journalsPermissions.navPermissions:
http://ltj.sagepub.com/content/29/1/43.refs.htmlCitations:
What is This?
- Jun 15, 2011 OnlineFirst Version of Record
- Jan 25, 2012Version of Record >>
at UNIV FED DO RIO GRANDE DO NOR on April 23, 2014ltj.sagepub.comDownloaded from at UNIV FED DO RIO GRANDE DO NOR on April 23, 2014ltj.sagepub.comDownloaded from
Confidence scoring of speaking performance: How does fuzziness become exact?
Tan Jin and Barley MakThe Chinese University of Hong Kong, China
Pei ZhouShanghai Jiao Tong University, China
AbstractThe fuzziness of assessing second language speaking performance raises two difficulties in scoring speaking performance: indistinction between adjacent levels and overlap between scales. To address these two problems, this article proposes a new approach, confidence scoring, to deal with such fuzziness, leading to confidence scores between two adjacent levels applied to three scales. Since confidence scores have to be transformed to an exact score for test interpretation and use, membership functions and rule bases are applied and a confidence scoring algorithm is developed. Confidence scoring is demonstrated in the paper by an example to facilitate easy understanding. The paper then describes a pilot study that was conducted to try out the confidence scoring design. Initial results reveal that: first, confidence scoring is as feasible as traditional scoring; second, confidence scoring performs better in scoring dependability and in correlations with established benchmarks. At the end of the article, further studies are called for in order to build a validity argument and make further revisions to the confidence scoring method described here.
Keywordsconfidence scoring, confidence scoring algorithm, membership functions, rule bases, speaking performance
Language Testing29(1) 43–65
© The Author(s) 2011Reprints and permission:
sagepub.co.uk/journalsPermissions.navDOI: 10.1177/0265532211404383
ltj.sagepub.com
Corresponding author:Tan Jin, Department of Curriculum and Instruction, Faculty of Education, The Chinese University of Hong Kong, Hong Kong, China.Email: [email protected]
Article
at UNIV FED DO RIO GRANDE DO NOR on April 23, 2014ltj.sagepub.comDownloaded from
44 Language Testing 29(1)
Introduction
For over two decades, language testers have been aware that ‘fuzziness’ exists in language tests (see Alderson, 1991; Davies, 1990). In speaking tests, the scoring of speaking performances involves the construction and application of rating scales. Constructing rating scales has attracted much attention from language testers since the Second World War (Fulcher, 2003). Studies have focused on making use of teachers’ interpretation of scaling descriptors (North, 2000), raters’ binary comparison (Turner & Upshur, 2002) and candidates’ performance data (Fulcher, 1996). As a result of these studies, the content of rating scales has experienced a series of changes. When viewing four influential rating scales at three historical stages as an example, we find that the ELTS Interview Assessment Scale 1986 (Davies, 2008, p. 321) adopted ‘competent speaker’ as an overall label for Band 6 and specified the degree to which the candidate ‘is able to’ or ‘can do’ with respect to the task-required communication. However, in Band Descriptors for IELTS Speaking Module 1989–2001 (Ingram & Wylie, 1993, pp. 232–234; Brown, 2005, p. 35), ‘generally communicates effectively’ replaced ‘compe-tent speaker’ in Band 6, but it was found to be still an inexact ‘tag’ for assessing candi-date performance. Recently, both IELTS and TOEFL iBT rating scales have employed ‘features of language use’ (Davies, 2008, p. 112) to characterize the quality of candidate performances at each level (see IELTS Website, retrieved on 7 August 2010; Educational Testing Service, 2005). The content development of rating scales has reflected an attempt to transform ‘fuzziness’ into ‘exactness’ in developing rating scales for scoring speaking.
The recent application of such ‘exact’ feature-based rating scales to score speaking performances, however, still faces difficulties in a series of empirical studies on interna-tional language tests, for example, IELTS and TOEFL iBT. Brown (2006a) explored IELTS expert examiners’ interpretations and applications of the revised band descriptors and revealed an unclear distinction between adjacent levels and an overlap between scales. Such findings were also confirmed by a worldwide survey of IELTS examiners’ views and experiences (Brown & Taylor, 2006), where two problems with the revised band descriptors were noted. One of these problems was that the terminology of the descriptors was ‘subjective, vague or otherwise problematic to interpret’, such as ‘suffi-cient, limited, basic, effective and occasional, wide range, etc’. The other was ‘the diffi-culty of distinguishing particular adjacent bands’ (Brown & Taylor, 2006, p. 16).
Indistinction between adjacent levels
Regarding indistinction between adjacent levels, Brown, Iwashita, and McNamara (2005) found that there were general trends in the expected direction for major concep-tual categories with significant differences across levels for individual features. However, some features were unmarked compared to others, or some were not significantly differ-ent. In terms of different features, the standard deviations were usually large, and the effect sizes were generally small. Brown, Iwashita, and McNamara (2005) further explained that such a lack of clear distinction between performances at adjoining levels might be attributed to the use of holistic scores as baseline data and the focus on analyz-ing measurable and quantifiable features (other than subjective and unmeasurable ones).
at UNIV FED DO RIO GRANDE DO NOR on April 23, 2014ltj.sagepub.comDownloaded from
Jin et al. 45
Even when using four analytic scores (Brown, 2006b), the situation hardly changed. The standard deviations for each measure were large, and variations within one level as well as the overlap between levels still existed. Iwashita, Brown, McNamara, and O’Hagan (2008) took the findings of Lee and Schallert (1997) to provide a possible explanation for the fuzziness of distinctions at adjacent levels. They theorized that level distinctions might be more clear-cut if there were three assigned levels instead of five. They also claimed that the complexity of the configuration of components as well as the fuzziness of distinctions between levels appeared to support the views of Douglas and Selinker (1992, 1993) and Douglas (1994) that speakers might produce different qualita-tive performances with similar quantitative ratings. Analytic rating data also confirmed the fuzziness of distinctions at adjacent levels. In Xi and Mollaun (2006), the agreement rate between first and second ratings on the three dimensions was about 50% for the exact level and around 40% for adjacent levels; the frequency of raters’ ‘very confident’ reports was less than 30% for each of the three dimensions.
Overlap between scales
With respect to overlap between scales, two empirical studies of analytic scoring (Sawaki, 2007; Xi and Mollaun 2006; also see Xi, 2007) revealed the multidimensional but highly correlated nature of the analytic scales, which justified the use of distinctive scales (mul-tidimensional) despite being intertwined (highly correlated). Xi and Mollaun (2006) fur-ther noted the distinctiveness of the three dimensions (delivery, language use and topic development), and both much overlap and some overlap of the three dimensions were also perceived by raters (64%~86%). Overall by task, the proportion of any profiles of scores (1–4 point scales with 0 for no response or off topic are used) was 35.1% when differing by a score of 1 or more, 10.6% when differing by 1.5 or more, but surprisingly flat (1.0% for 1 or more and 0% for 1.5 or more) when averaged across tasks or task types.
Traditional scoring and current measures
Traditional scoring allows only one score to be assigned and scores from different scales are usually averaged to produce a final score. However, recent studies of raters’ orienta-tion and candidates’ performance in speaking tests have conceived fuzziness of indistinc-tion between adjacent levels and overlap between scales when using traditional scoring, even with exact feature-based rating scales. Two measures were taken to tackle these two problems. On the one hand, fewer levels with more tasks were used. For example, the TOEFL iBT project applied four scoring levels rather than five to enhance the low inter-rater reliability observed in a 2002 field study (Pearlman, 2008); the scores on the six tasks were averaged to obtain a scaled score of 0–30 based on the score conversion table (Educational Testing Service, 2005). On the other hand, scores of different scales were averaged to generate an overall score, such as in IELTS where certified examiners awarded a band score for each of the four criteria based on their respective band descrip-tors. The four criteria were equally weighted (IELTS Website, retrieved on 19 January 2010).
at UNIV FED DO RIO GRANDE DO NOR on April 23, 2014ltj.sagepub.comDownloaded from
46 Language Testing 29(1)
Such methods of dealing with fuzziness have raised more issues with two major challenges arising. First and foremost, problems are not alleviated even after using gen-eral ratings for more tasks. Using fewer scoring levels reduces the ability to discriminate between candidates, which leads to qualitatively different performances with quantita-tively similar scores (Douglas & Selinker, 1992, 1993; Douglas, 1994), thus increasing the risk of making inappropriate decisions. At the same time, it is suggested that averag-ing the ratings of various tasks should be conducted with great caution. High universe score correlations among task types justify the composite scores of both integrated and independent tasks (see Lee, 2005; Enright, Bridgeman, Eignor, Lee, & Powers, 2008), but the idiosyncrasy of speaking task difficulty may still threaten the validity of such combi-nations. Second, overlap between scales mystifies the rationales for the exact weightings among them. Such averaging activity lacks empirical evidence, and fuzzy overlapping cannot be quantified to establish exact mathematical relations among different scales.
Confidence scoring
In response to fuzziness in traditional scoring, Jin, Wang, Song, and Guo (2008) employed raters’ confidence in assigning scores to develop three fuzzy scoring methods in a Chinese speaking test study consisting of 34 students learning Chinese as a second lan-guage. Because the first method dealt with holistic scoring and the third method was applied with weighted averages, only the second method is relevant to this paper. Raters were allowed to use a score of 1–100 to show their scoring confidence in any level from 1 to 5, and they assigned a score of 100 when their confidence was high enough to reflect a scored sum of 100. Raters first assigned confidence scores on four analytic scales of pronunciation, content, accuracy and fluency. Then, rule-based reasoning was applied and these confidence scores were transformed to an exact score.
Jin et al. (2008) allowed latitude in tackling fuzziness when scoring speaking perform-ance, but while conducting scoring using the second method in Jin et al. (2008), two observations were made: first, raters tended to assign confidence scores to the two adja-cent levels despite being allowed to choose any level from one to five, whether adjacent or nonadjacent; second, raters preferred to use factors of 10 (e.g. 30, 70 or 20, 80) prob-ably due to cognitive load. Therefore, it would be more efficient if two measures are undertaken in response to the two observations. On the one hand, the confidence scores are only designed for assignment to adjacent levels with new membership functions; on the other hand, the total confidence score is changed to 10 to be more feasible and con-venient for raters. In this article, we will use confidence scoring to replace the name of fuzzy scoring because confidence scoring better reflects the nature of such scoring prac-tice. Different from traditional scoring, the logic of confidence scoring will be applied by:
(1) Using a score of 1–10 to show their scoring confidence in two adjacent levels.(2) Assigning a score of 10 to one level when they are very confident.(3) The sum of the confidence scores is 10.
In terms of scales, we have adopted three dimensions based on common beliefs about language proficiency in language testing and assessment (Chapelle, Enright, & Jamieson,
at UNIV FED DO RIO GRANDE DO NOR on April 23, 2014ltj.sagepub.comDownloaded from
Jin et al. 47
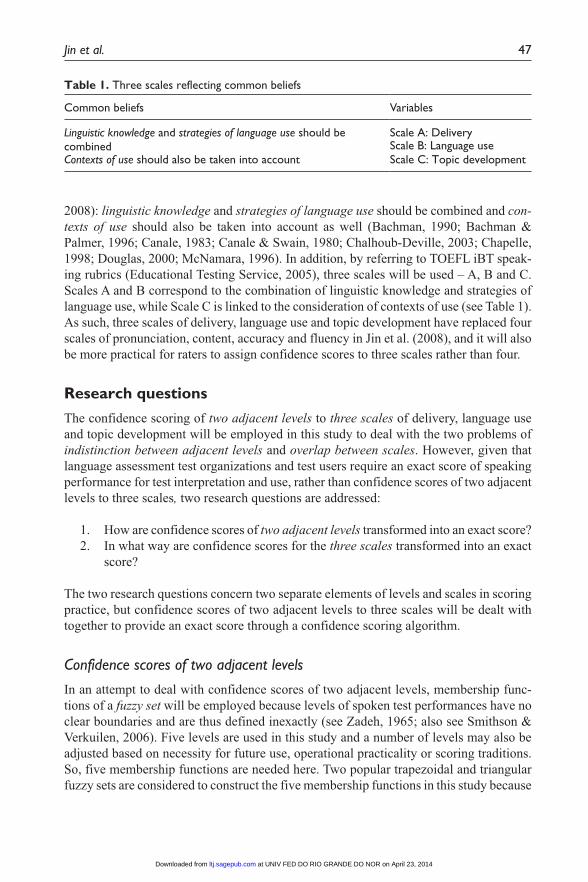
2008): linguistic knowledge and strategies of language use should be combined and con-texts of use should also be taken into account as well (Bachman, 1990; Bachman & Palmer, 1996; Canale, 1983; Canale & Swain, 1980; Chalhoub-Deville, 2003; Chapelle, 1998; Douglas, 2000; McNamara, 1996). In addition, by referring to TOEFL iBT speak-ing rubrics (Educational Testing Service, 2005), three scales will be used – A, B and C. Scales A and B correspond to the combination of linguistic knowledge and strategies of language use, while Scale C is linked to the consideration of contexts of use (see Table 1). As such, three scales of delivery, language use and topic development have replaced four scales of pronunciation, content, accuracy and fluency in Jin et al. (2008), and it will also be more practical for raters to assign confidence scores to three scales rather than four.
Research questions
The confidence scoring of two adjacent levels to three scales of delivery, language use and topic development will be employed in this study to deal with the two problems of indistinction between adjacent levels and overlap between scales. However, given that language assessment test organizations and test users require an exact score of speaking performance for test interpretation and use, rather than confidence scores of two adjacent levels to three scales, two research questions are addressed:
1. How are confidence scores of two adjacent levels transformed into an exact score?2. In what way are confidence scores for the three scales transformed into an exact
score?
The two research questions concern two separate elements of levels and scales in scoring practice, but confidence scores of two adjacent levels to three scales will be dealt with together to provide an exact score through a confidence scoring algorithm.
Confidence scores of two adjacent levels
In an attempt to deal with confidence scores of two adjacent levels, membership func-tions of a fuzzy set will be employed because levels of spoken test performances have no clear boundaries and are thus defined inexactly (see Zadeh, 1965; also see Smithson & Verkuilen, 2006). Five levels are used in this study and a number of levels may also be adjusted based on necessity for future use, operational practicality or scoring traditions. So, five membership functions are needed here. Two popular trapezoidal and triangular fuzzy sets are considered to construct the five membership functions in this study because
Table 1. Three scales reflecting common beliefs
Common beliefs Variables
Linguistic knowledge and strategies of language use should be combined
Scale A: DeliveryScale B: Language use
Contexts of use should also be taken into account Scale C: Topic development
at UNIV FED DO RIO GRANDE DO NOR on April 23, 2014ltj.sagepub.comDownloaded from
48 Language Testing 29(1)
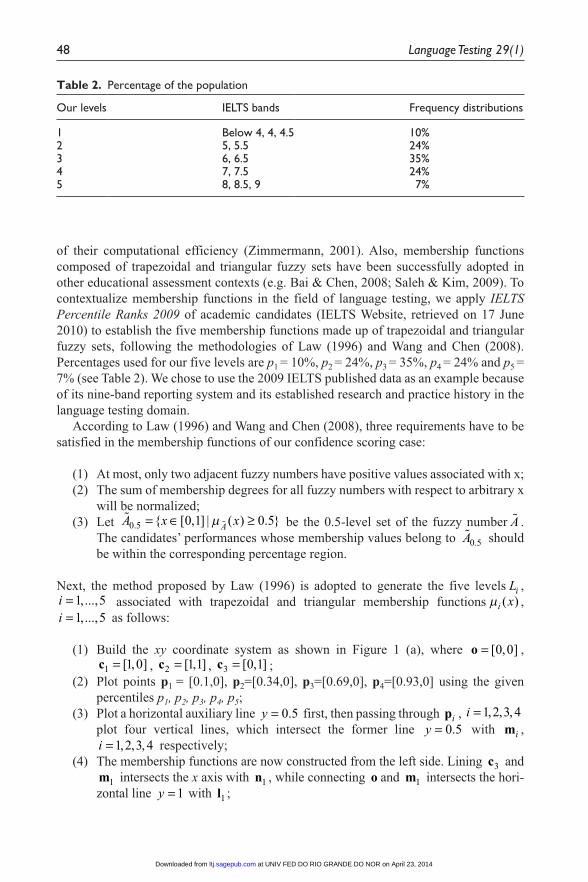
of their computational efficiency (Zimmermann, 2001). Also, membership functions composed of trapezoidal and triangular fuzzy sets have been successfully adopted in other educational assessment contexts (e.g. Bai & Chen, 2008; Saleh & Kim, 2009). To contextualize membership functions in the field of language testing, we apply IELTS Percentile Ranks 2009 of academic candidates (IELTS Website, retrieved on 17 June 2010) to establish the five membership functions made up of trapezoidal and triangular fuzzy sets, following the methodologies of Law (1996) and Wang and Chen (2008). Percentages used for our five levels are p1 = 10%, p2 = 24%, p3 = 35%, p4 = 24% and p5 = 7% (see Table 2). We chose to use the 2009 IELTS published data as an example because of its nine-band reporting system and its established research and practice history in the language testing domain.
According to Law (1996) and Wang and Chen (2008), three requirements have to be satisfied in the membership functions of our confidence scoring case:
(1) At most, only two adjacent fuzzy numbers have positive values associated with x;(2) The sum of membership degrees for all fuzzy numbers with respect to arbitrary x
will be normalized;(3) Let
A x xA0 5 0 1 0 5. { [ , ] | ( ) . }= ∈ ≥µ be the 0.5-level set of the fuzzy number A . The candidates’ performances whose membership values belong to A0 5. should be within the corresponding percentage region.
Next, the method proposed by Law (1996) is adopted to generate the five levels Li , i = 1 5,..., associated with trapezoidal and triangular membership functions µi x( ) , i = 1 5,..., as follows:
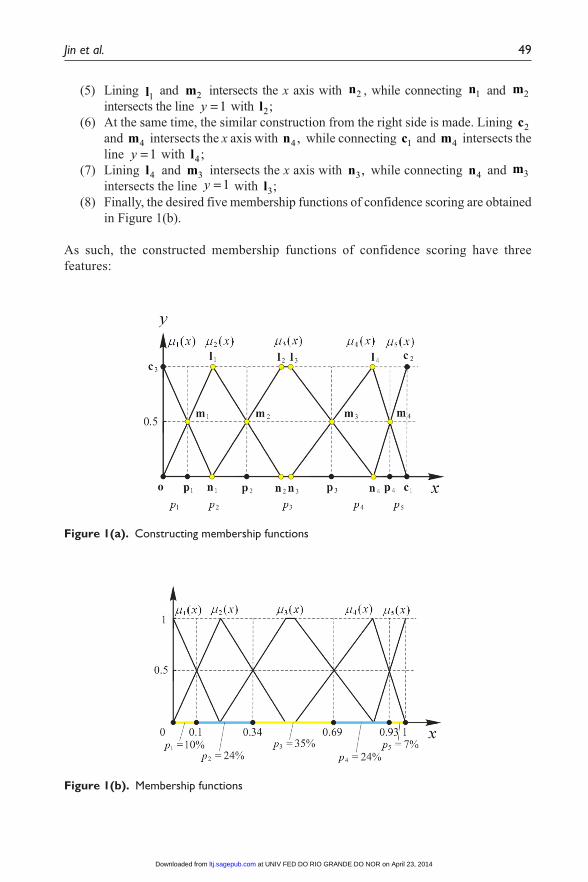
(1) Build the xy coordinate system as shown in Figure 1 (a), where o = [ , ]0 0 , c1 1 0= [ , ] , c2 1 1= [ , ] , c3 0 1= [ , ] ;
(2) Plot points p1 = [0.1,0], p2=[0.34,0], p3=[0.69,0], p4=[0.93,0] using the given percentiles p1, p2, p3, p4, p5;
(3) Plot a horizontal auxiliary line y = 0 5. first, then passing through pi , i = 1 2 3 4, , , plot four vertical lines, which intersect the former line y = 0 5. with mi , i = 1 2 3 4, , , respectively;
(4) The membership functions are now constructed from the left side. Lining c3 and m1 intersects the x axis with n1 , while connecting o and m1 intersects the hori-zontal line y = 1 with l1 ;
Table 2. Percentage of the population
Our levels IELTS bands Frequency distributions
1 Below 4, 4, 4.5 10%2 5, 5.5 24%3 6, 6.5 35%4 7, 7.5 24%5 8, 8.5, 9 7%
at UNIV FED DO RIO GRANDE DO NOR on April 23, 2014ltj.sagepub.comDownloaded from
Jin et al. 49
(5) Lining l1 and m2 intersects the x axis with n2 , while connecting n1 and m2 intersects the line y = 1 with l2;
(6) At the same time, the similar construction from the right side is made. Lining c2 and m4 intersects the x axis with n4 , while connecting c1 and m4 intersects the line y = 1 with l4;
(7) Lining l4 and m3 intersects the x axis with n3, while connecting n4 and m3 intersects the line y = 1 with l3;
(8) Finally, the desired five membership functions of confidence scoring are obtained in Figure 1(b).
As such, the constructed membership functions of confidence scoring have three features:
Figure 1(a). Constructing membership functions
Figure 1(b). Membership functions
at UNIV FED DO RIO GRANDE DO NOR on April 23, 2014ltj.sagepub.comDownloaded from
50 Language Testing 29(1)
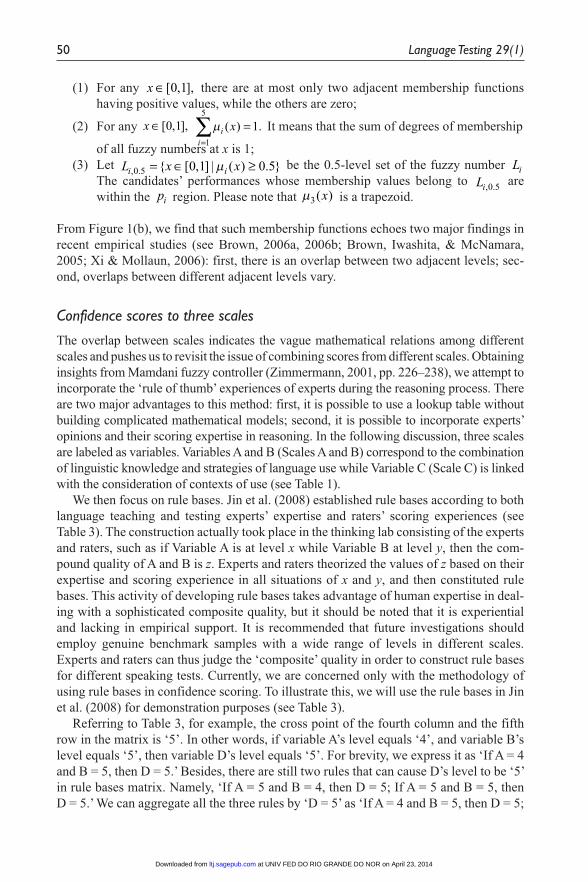
(1) For any x ∈[ , ],0 1 there are at most only two adjacent membership functions having positive values, while the others are zero;
(2) For any x ∈[ , ],0 1 µii
x( ) .=∑ =
1
5
1 It means that the sum of degrees of membership
of all fuzzy numbers at x is 1;(3) Let L x xi i, . { [ , ] | ( ) . }0 5 0 1 0 5= ∈ ≥µ be the 0.5-level set of the fuzzy number Li
The candidates’ performances whose membership values belong to Li, .0 5 are within the pi region. Please note that µ3( )x is a trapezoid.
From Figure 1(b), we find that such membership functions echoes two major findings in recent empirical studies (see Brown, 2006a, 2006b; Brown, Iwashita, & McNamara, 2005; Xi & Mollaun, 2006): first, there is an overlap between two adjacent levels; sec-ond, overlaps between different adjacent levels vary.
Confidence scores to three scales
The overlap between scales indicates the vague mathematical relations among different scales and pushes us to revisit the issue of combining scores from different scales. Obtaining insights from Mamdani fuzzy controller (Zimmermann, 2001, pp. 226–238), we attempt to incorporate the ‘rule of thumb’ experiences of experts during the reasoning process. There are two major advantages to this method: first, it is possible to use a lookup table without building complicated mathematical models; second, it is possible to incorporate experts’ opinions and their scoring expertise in reasoning. In the following discussion, three scales are labeled as variables. Variables A and B (Scales A and B) correspond to the combination of linguistic knowledge and strategies of language use while Variable C (Scale C) is linked with the consideration of contexts of use (see Table 1).
We then focus on rule bases. Jin et al. (2008) established rule bases according to both language teaching and testing experts’ expertise and raters’ scoring experiences (see Table 3). The construction actually took place in the thinking lab consisting of the experts and raters, such as if Variable A is at level x while Variable B at level y, then the com-pound quality of A and B is z. Experts and raters theorized the values of z based on their expertise and scoring experience in all situations of x and y, and then constituted rule bases. This activity of developing rule bases takes advantage of human expertise in deal-ing with a sophisticated composite quality, but it should be noted that it is experiential and lacking in empirical support. It is recommended that future investigations should employ genuine benchmark samples with a wide range of levels in different scales. Experts and raters can thus judge the ‘composite’ quality in order to construct rule bases for different speaking tests. Currently, we are concerned only with the methodology of using rule bases in confidence scoring. To illustrate this, we will use the rule bases in Jin et al. (2008) for demonstration purposes (see Table 3).
Referring to Table 3, for example, the cross point of the fourth column and the fifth row in the matrix is ‘5’. In other words, if variable A’s level equals ‘4’, and variable B’s level equals ‘5’, then variable D’s level equals ‘5’. For brevity, we express it as ‘If A = 4 and B = 5, then D = 5.’ Besides, there are still two rules that can cause D’s level to be ‘5’ in rule bases matrix. Namely, ‘If A = 5 and B = 4, then D = 5; If A = 5 and B = 5, then D = 5.’ We can aggregate all the three rules by ‘D = 5’ as ‘If A = 4 and B = 5, then D = 5;
at UNIV FED DO RIO GRANDE DO NOR on April 23, 2014ltj.sagepub.comDownloaded from
Jin et al. 51
also If A = 5 and B = 4, then D = 5; also If A = 5 and B = 5, then D = 5.’ In the subsequent fuzzy reasoning in the computational unit, ‘and’ means the ‘min’ operation for μA (x) and μB (x), while ‘also’ denotes the ‘max’ operation for μD (x).
Confidence scores to an exact score
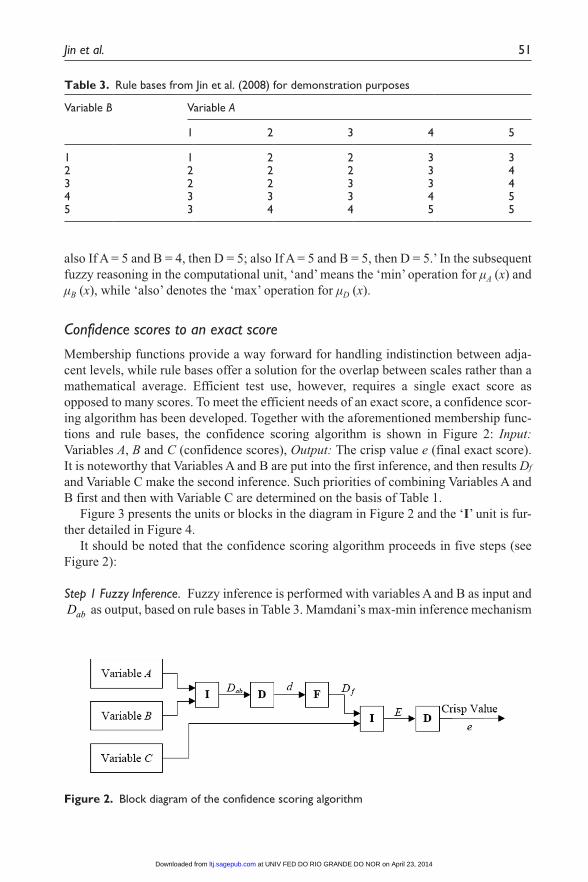
Membership functions provide a way forward for handling indistinction between adja-cent levels, while rule bases offer a solution for the overlap between scales rather than a mathematical average. Efficient test use, however, requires a single exact score as opposed to many scores. To meet the efficient needs of an exact score, a confidence scor-ing algorithm has been developed. Together with the aforementioned membership func-tions and rule bases, the confidence scoring algorithm is shown in Figure 2: Input: Variables A, B and C (confidence scores), Output: The crisp value e (final exact score). It is noteworthy that Variables A and B are put into the first inference, and then results Df
and Variable C make the second inference. Such priorities of combining Variables A and B first and then with Variable C are determined on the basis of Table 1.
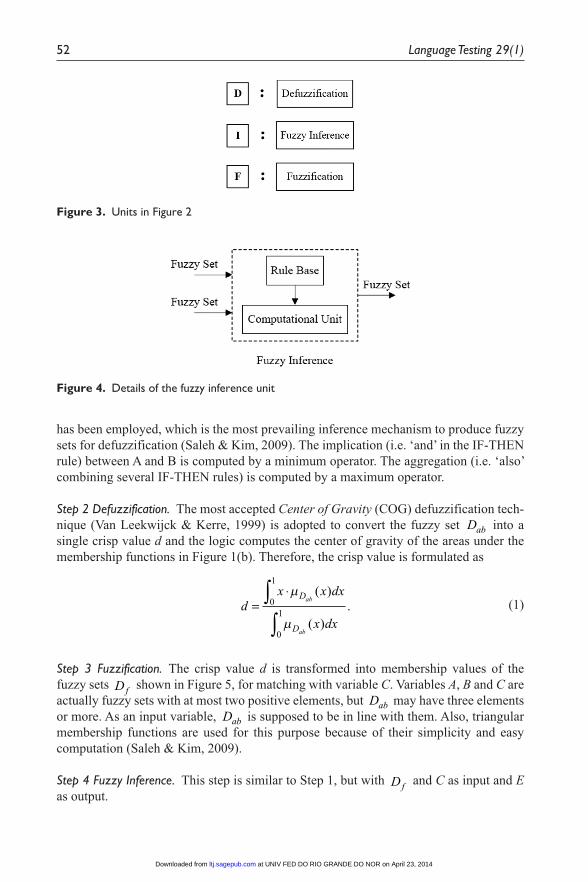
Figure 3 presents the units or blocks in the diagram in Figure 2 and the ‘I’ unit is fur-ther detailed in Figure 4.
It should be noted that the confidence scoring algorithm proceeds in five steps (see Figure 2):
Step 1 Fuzzy Inference. Fuzzy inference is performed with variables A and B as input and Dab as output, based on rule bases in Table 3. Mamdani’s max-min inference mechanism
Table 3. Rule bases from Jin et al. (2008) for demonstration purposes
Variable B Variable A
1 2 3 4 5
1 1 2 2 3 32 2 2 2 3 43 2 2 3 3 44 3 3 3 4 55 3 4 4 5 5
Figure 2. Block diagram of the confidence scoring algorithm
at UNIV FED DO RIO GRANDE DO NOR on April 23, 2014ltj.sagepub.comDownloaded from
52 Language Testing 29(1)
has been employed, which is the most prevailing inference mechanism to produce fuzzy sets for defuzzification (Saleh & Kim, 2009). The implication (i.e. ‘and’ in the IF-THEN rule) between A and B is computed by a minimum operator. The aggregation (i.e. ‘also’ combining several IF-THEN rules) is computed by a maximum operator.
Step 2 Defuzzification. The most accepted Center of Gravity (COG) defuzzification tech-nique (Van Leekwijck & Kerre, 1999) is adopted to convert the fuzzy set Dab into a single crisp value d and the logic computes the center of gravity of the areas under the membership functions in Figure 1(b). Therefore, the crisp value is formulated as
(1)
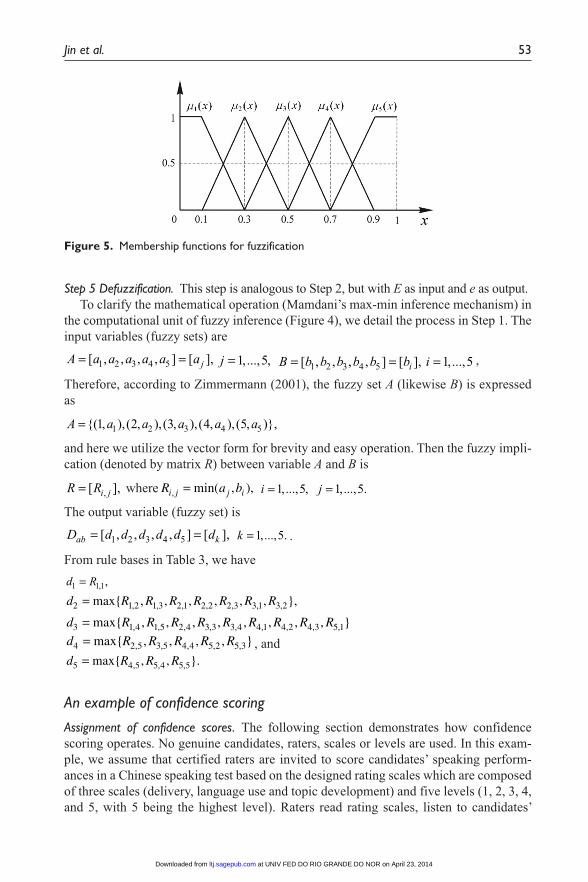
Step 3 Fuzzification. The crisp value d is transformed into membership values of the fuzzy sets Df shown in Figure 5, for matching with variable C. Variables A, B and C are actually fuzzy sets with at most two positive elements, but Dab may have three elements or more. As an input variable, Dab is supposed to be in line with them. Also, triangular membership functions are used for this purpose because of their simplicity and easy computation (Saleh & Kim, 2009).
Step 4 Fuzzy Inference. This step is similar to Step 1, but with Df and C as input and E as output.
Figure 3. Units in Figure 2
Figure 4. Details of the fuzzy inference unit
dx x dx
x dx
D
D
ab
ab
=⋅∫
∫
µ
µ
( )
( ).0
1
0
1
at UNIV FED DO RIO GRANDE DO NOR on April 23, 2014ltj.sagepub.comDownloaded from
Jin et al. 53
Step 5 Defuzzification. This step is analogous to Step 2, but with E as input and e as output.To clarify the mathematical operation (Mamdani’s max-min inference mechanism) in
the computational unit of fuzzy inference (Figure 4), we detail the process in Step 1. The input variables (fuzzy sets) are
A a a a a a aj= =[ , , , , ] [ ],1 2 3 4 5 j = 1 5,..., , B b b b b b bi= =[ , , , , ] [ ],1 2 3 4 5 i = 1 5,..., ,
Therefore, according to Zimmermann (2001), the fuzzy set A (likewise B) is expressed as
A a a a a a={( , ), ( , ), ( , ), ( , ), ( , )},1 2 3 4 51 2 3 4 5
and here we utilize the vector form for brevity and easy operation. Then the fuzzy impli-cation (denoted by matrix R) between variable A and B is
R Ri j= [ ],, where R a bi j j i, min( , ),= i = 1 5,..., , j = 1 5,..., .
The output variable (fuzzy set) is
D d d d d d dab k= =[ , , , , ] [ ],1 2 3 4 5 k = 1 5,..., . .
From rule bases in Table 3, we have
d R1 11= , ,
d R R R R R R R2 1 2 1 3 2 1 2 2 2 3 3 1 3 2= max{ , , , , , , },, , , , , , ,
d R R R R R R R R R3 1 4 1 5 2 4 3 3 3 4 4 1 4 2 4 3 5 1= max{ , , , , , , , , }, , , , , , , , ,
d R R R R R4 2 5 3 5 4 4 5 2 5 3= max{ , , , , }, , , , , , andd R R R5 4 5 5 4 5 5= max{ , , }., , ,
An example of confidence scoring
Assignment of confidence scores. The following section demonstrates how confidence scoring operates. No genuine candidates, raters, scales or levels are used. In this exam-ple, we assume that certified raters are invited to score candidates’ speaking perform-ances in a Chinese speaking test based on the designed rating scales which are composed of three scales (delivery, language use and topic development) and five levels (1, 2, 3, 4, and 5, with 5 being the highest level). Raters read rating scales, listen to candidates’
Figure 5. Membership functions for fuzzification
at UNIV FED DO RIO GRANDE DO NOR on April 23, 2014ltj.sagepub.comDownloaded from
54 Language Testing 29(1)
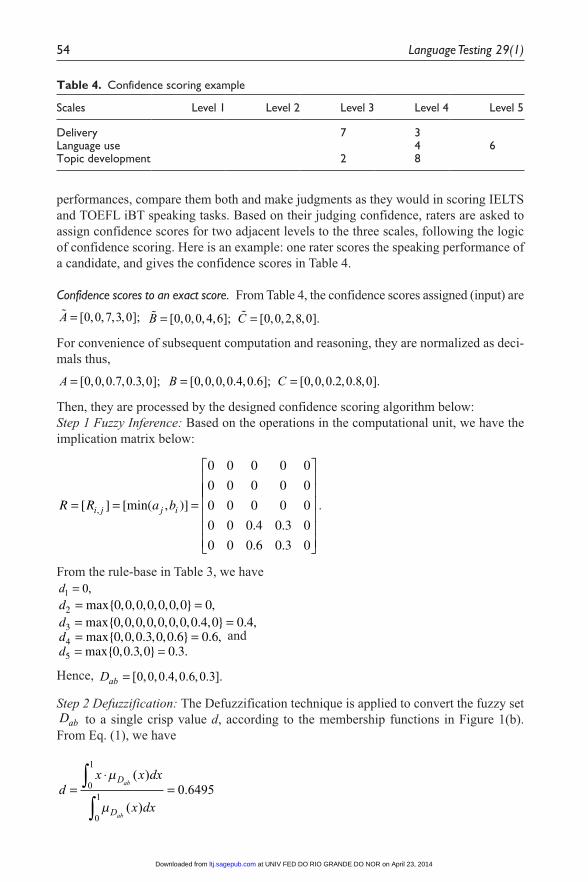
performances, compare them both and make judgments as they would in scoring IELTS and TOEFL iBT speaking tasks. Based on their judging confidence, raters are asked to assign confidence scores for two adjacent levels to the three scales, following the logic of confidence scoring. Here is an example: one rater scores the speaking performance of a candidate, and gives the confidence scores in Table 4.
Confidence scores to an exact score. From Table 4, the confidence scores assigned (input) areA = [ , , , , ];0 0 7 3 0 B = [ , , , , ];0 0 0 4 6 C = [ , , , , ].0 0 2 8 0
For convenience of subsequent computation and reasoning, they are normalized as deci-mals thus,
A = [ , , . , . , ];0 0 0 7 0 3 0 B = [ , , , . , . ];0 0 0 0 4 0 6 C = [ , , . , . , ].0 0 0 2 0 8 0
Then, they are processed by the designed confidence scoring algorithm below:Step 1 Fuzzy Inference: Based on the operations in the computational unit, we have the implication matrix below:
R R a bi j j i= = =
[ ] [min( , )]
. .
. .
,
0 0 0 0 0
0 0 0 0 0
0 0 0 0 0
0 0 0 4 0 3 0
0 0 0 6 0 3 0
.
From the rule-base in Table 3, we haved1 0= ,d2 0 0 0 0 0 0 0 0= =max{ , , , , , , } ,d3 0 0 0 0 0 0 0 0 4 0 0 4= =max{ , , , , , , , . , } . ,d4 0 0 0 3 0 0 6 0 6= =max{ , , . , , . } . , andd5 0 0 3 0 0 3= =max{ , . , } . .
Hence, Dab = [ , , . , . , . ].0 0 0 4 0 6 0 3
Step 2 Defuzzification: The Defuzzification technique is applied to convert the fuzzy set Dab to a single crisp value d, according to the membership functions in Figure 1(b). From Eq. (1), we have
dx x dx
x dx
D
D
ab
ab
=⋅
=∫∫
µ
µ
( )
( ).0
1
0
10 6495
Table 4. Confidence scoring example
Scales Level 1 Level 2 Level 3 Level 4 Level 5
Delivery 7 3Language use 4 6Topic development 2 8
at UNIV FED DO RIO GRANDE DO NOR on April 23, 2014ltj.sagepub.comDownloaded from
Jin et al. 55
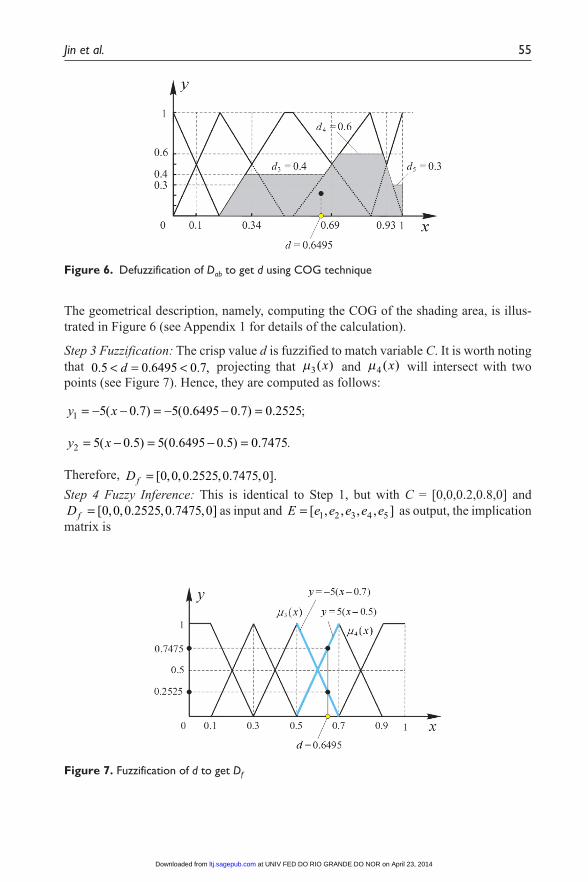
The geometrical description, namely, computing the COG of the shading area, is illus-trated in Figure 6 (see Appendix 1 for details of the calculation).
Step 3 Fuzzification: The crisp value d is fuzzified to match variable C. It is worth noting that 0 5 0 6495 0 7. . . ,< = <d projecting that µ3( )x and µ4 ( )x will intersect with two points (see Figure 7). Hence, they are computed as follows:
y x1 5 0 7 5 0 6495 0 7 0 2525= − − = − − =( . ) ( . . ) . ;
y x2 5 0 5 5 0 6495 0 5 0 7475= − = − =( . ) ( . . ) . .
Therefore, Df = [ , , . , . , ].0 0 0 2525 0 7475 0
Step 4 Fuzzy Inference: This is identical to Step 1, but with C = [0,0,0.2,0.8,0] and Df = [ , , . , . , ]0 0 0 2525 0 7475 0 as input and E e e e e e= [ , , , , ]1 2 3 4 5 as output, the implication matrix is
Figure 6. Defuzzification of Dab to get d using COG technique
Figure 7. Fuzzification of d to get Df
at UNIV FED DO RIO GRANDE DO NOR on April 23, 2014ltj.sagepub.comDownloaded from
56 Language Testing 29(1)
R R d ci j j i= = =[ ] [min( , )] . .
. .,
0 0 0 0 0
0 0 0 0 0
0 0 0 2 0 2 0
0 0 0 2525 0 7475 0
0 0 00 0 0
.
From the rule-base in Table 3, we have
e1 0= , e2 0= , e3 0 2525= . , e4 0 7475= . , e5 0= .
Hence, E = [ , , . , . , ].0 0 0 2525 0 7475 0
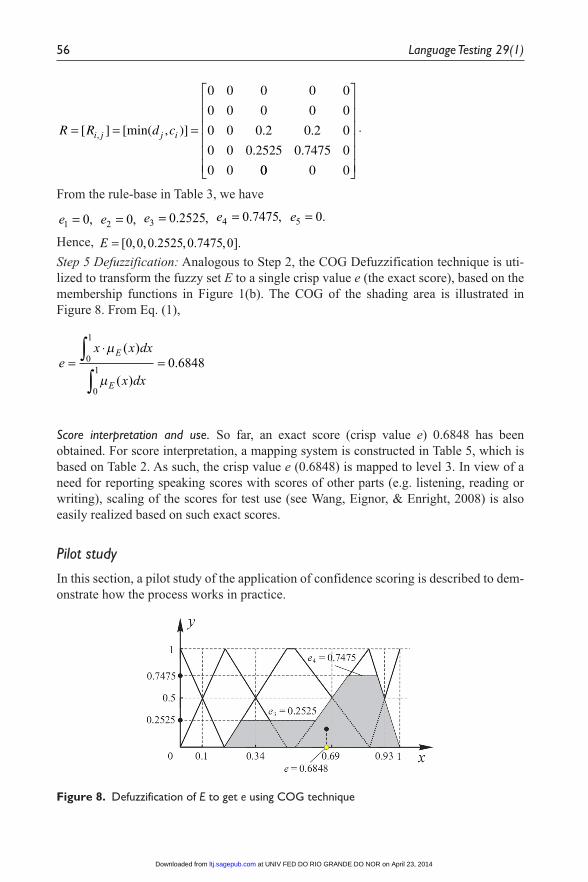
Step 5 Defuzzification: Analogous to Step 2, the COG Defuzzification technique is uti-lized to transform the fuzzy set E to a single crisp value e (the exact score), based on the membership functions in Figure 1(b). The COG of the shading area is illustrated in Figure 8. From Eq. (1),
ex x dx
x dx
E
E
=⋅
=∫∫
µ
µ
( )
( ).0
1
0
10 6848
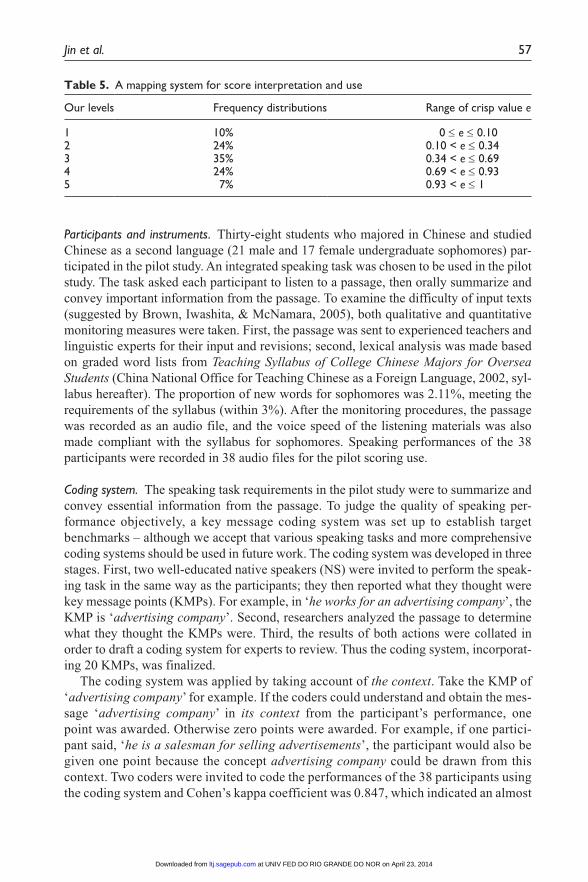
Score interpretation and use. So far, an exact score (crisp value e) 0.6848 has been obtained. For score interpretation, a mapping system is constructed in Table 5, which is based on Table 2. As such, the crisp value e (0.6848) is mapped to level 3. In view of a need for reporting speaking scores with scores of other parts (e.g. listening, reading or writing), scaling of the scores for test use (see Wang, Eignor, & Enright, 2008) is also easily realized based on such exact scores.
Pilot study
In this section, a pilot study of the application of confidence scoring is described to dem-onstrate how the process works in practice.
Figure 8. Defuzzification of E to get e using COG technique
at UNIV FED DO RIO GRANDE DO NOR on April 23, 2014ltj.sagepub.comDownloaded from
Jin et al. 57
Participants and instruments. Thirty-eight students who majored in Chinese and studied Chinese as a second language (21 male and 17 female undergraduate sophomores) par-ticipated in the pilot study. An integrated speaking task was chosen to be used in the pilot study. The task asked each participant to listen to a passage, then orally summarize and convey important information from the passage. To examine the difficulty of input texts (suggested by Brown, Iwashita, & McNamara, 2005), both qualitative and quantitative monitoring measures were taken. First, the passage was sent to experienced teachers and linguistic experts for their input and revisions; second, lexical analysis was made based on graded word lists from Teaching Syllabus of College Chinese Majors for Oversea Students (China National Office for Teaching Chinese as a Foreign Language, 2002, syl-labus hereafter). The proportion of new words for sophomores was 2.11%, meeting the requirements of the syllabus (within 3%). After the monitoring procedures, the passage was recorded as an audio file, and the voice speed of the listening materials was also made compliant with the syllabus for sophomores. Speaking performances of the 38 participants were recorded in 38 audio files for the pilot scoring use.
Coding system. The speaking task requirements in the pilot study were to summarize and convey essential information from the passage. To judge the quality of speaking per-formance objectively, a key message coding system was set up to establish target benchmarks – although we accept that various speaking tasks and more comprehensive coding systems should be used in future work. The coding system was developed in three stages. First, two well-educated native speakers (NS) were invited to perform the speak-ing task in the same way as the participants; they then reported what they thought were key message points (KMPs). For example, in ‘he works for an advertising company’, the KMP is ‘advertising company’. Second, researchers analyzed the passage to determine what they thought the KMPs were. Third, the results of both actions were collated in order to draft a coding system for experts to review. Thus the coding system, incorporat-ing 20 KMPs, was finalized.
The coding system was applied by taking account of the context. Take the KMP of ‘advertising company’ for example. If the coders could understand and obtain the mes-sage ‘advertising company’ in its context from the participant’s performance, one point was awarded. Otherwise zero points were awarded. For example, if one partici-pant said, ‘he is a salesman for selling advertisements’, the participant would also be given one point because the concept advertising company could be drawn from this context. Two coders were invited to code the performances of the 38 participants using the coding system and Cohen’s kappa coefficient was 0.847, which indicated an almost
Table 5. A mapping system for score interpretation and use
Our levels Frequency distributions Range of crisp value e
1 10% 0 ≤ e ≤ 0.102 24% 0.10 < e ≤ 0.343 35% 0.34 < e ≤ 0.694 24% 0.69 < e ≤ 0.935 7% 0.93 < e ≤ 1
at UNIV FED DO RIO GRANDE DO NOR on April 23, 2014ltj.sagepub.comDownloaded from
58 Language Testing 29(1)
perfect agreement (Landis & Koch, 1977). We averaged the tallies of the two coding results to coding scores for the 38 participants. This served as the benchmark for the pilot study.
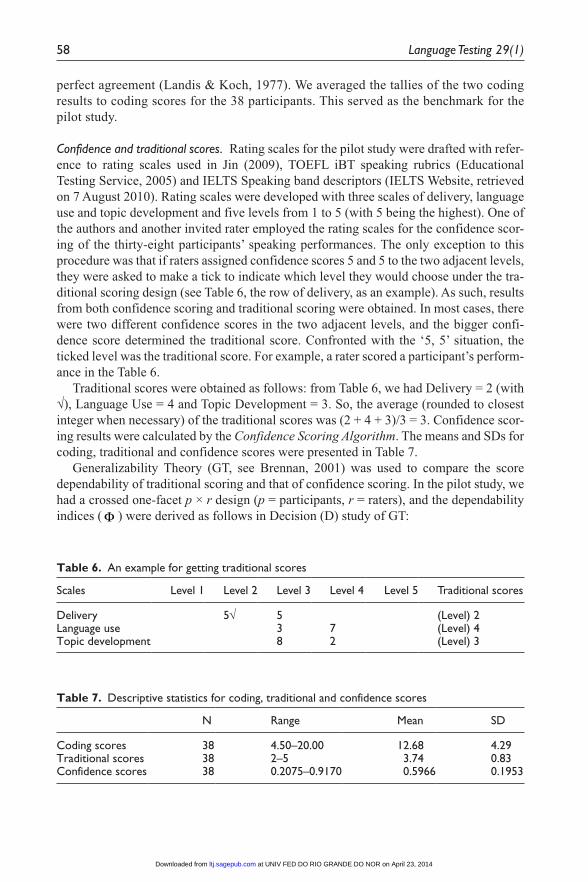
Confidence and traditional scores. Rating scales for the pilot study were drafted with refer-ence to rating scales used in Jin (2009), TOEFL iBT speaking rubrics (Educational Testing Service, 2005) and IELTS Speaking band descriptors (IELTS Website, retrieved on 7 August 2010). Rating scales were developed with three scales of delivery, language use and topic development and five levels from 1 to 5 (with 5 being the highest). One of the authors and another invited rater employed the rating scales for the confidence scor-ing of the thirty-eight participants’ speaking performances. The only exception to this procedure was that if raters assigned confidence scores 5 and 5 to the two adjacent levels, they were asked to make a tick to indicate which level they would choose under the tra-ditional scoring design (see Table 6, the row of delivery, as an example). As such, results from both confidence scoring and traditional scoring were obtained. In most cases, there were two different confidence scores in the two adjacent levels, and the bigger confi-dence score determined the traditional score. Confronted with the ‘5, 5’ situation, the ticked level was the traditional score. For example, a rater scored a participant’s perform-ance in the Table 6.
Traditional scores were obtained as follows: from Table 6, we had Delivery = 2 (with √), Language Use = 4 and Topic Development = 3. So, the average (rounded to closest integer when necessary) of the traditional scores was (2 + 4 + 3)/3 = 3. Confidence scor-ing results were calculated by the Confidence Scoring Algorithm. The means and SDs for coding, traditional and confidence scores were presented in Table 7.
Generalizability Theory (GT, see Brennan, 2001) was used to compare the score dependability of traditional scoring and that of confidence scoring. In the pilot study, we had a crossed one-facet p × r design (p = participants, r = raters), and the dependability indices ( Φ ) were derived as follows in Decision (D) study of GT:
Table 6. An example for getting traditional scores
Scales Level 1 Level 2 Level 3 Level 4 Level 5 Traditional scores
Delivery 5√ 5 (Level) 2Language use 3 7 (Level) 4Topic development 8 2 (Level) 3
Table 7. Descriptive statistics for coding, traditional and confidence scores
N Range Mean SD
Coding scores 38 4.50–20.00 12.68 4.29Traditional scores 38 2–5 3.74 0.83Confidence scores 38 0.2075–0.9170 0.5966 0.1953
at UNIV FED DO RIO GRANDE DO NOR on April 23, 2014ltj.sagepub.comDownloaded from
Jin et al. 59
Φ∆
∆
=+
= +
= −
σσ σ
σσ σ
σ µ µ
2
2 2
22 2
2
( )
( ) ( ),
( )( ) ( )
,
( ) ( )
’ ’
p
p
r
n
pr
n
p E
r r
p p22
2 2
2 2
,
( ) ( ) ,
( ) ( ) ,
σ µ µ
σ µ µ µ
r E
pr E E X
r r
p r pr p r
= −
= − − +
where ∆ is the absolute error, nr’ means the number of raters (one or two in our case),
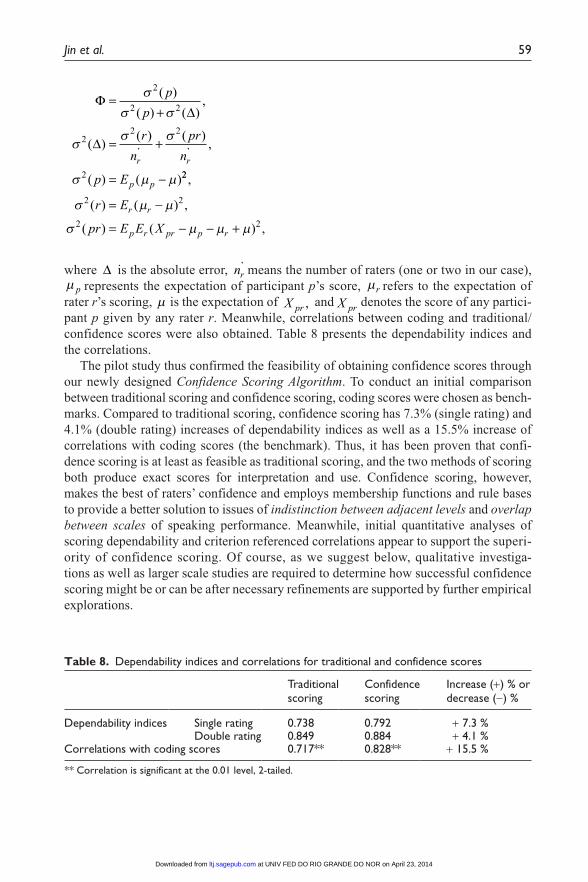
µ p represents the expectation of participant p’s score, µr refers to the expectation of rater r’s scoring, µ is the expectation of X pr , and X pr denotes the score of any partici-pant p given by any rater r. Meanwhile, correlations between coding and traditional/confidence scores were also obtained. Table 8 presents the dependability indices and the correlations.
The pilot study thus confirmed the feasibility of obtaining confidence scores through our newly designed Confidence Scoring Algorithm. To conduct an initial comparison between traditional scoring and confidence scoring, coding scores were chosen as bench-marks. Compared to traditional scoring, confidence scoring has 7.3% (single rating) and 4.1% (double rating) increases of dependability indices as well as a 15.5% increase of correlations with coding scores (the benchmark). Thus, it has been proven that confi-dence scoring is at least as feasible as traditional scoring, and the two methods of scoring both produce exact scores for interpretation and use. Confidence scoring, however, makes the best of raters’ confidence and employs membership functions and rule bases to provide a better solution to issues of indistinction between adjacent levels and overlap between scales of speaking performance. Meanwhile, initial quantitative analyses of scoring dependability and criterion referenced correlations appear to support the superi-ority of confidence scoring. Of course, as we suggest below, qualitative investiga-tions as well as larger scale studies are required to determine how successful confidence scoring might be or can be after necessary refinements are supported by further empirical explorations.
Table 8. Dependability indices and correlations for traditional and confidence scores
Traditional scoring
Confidence scoring
Increase (+) % or decrease (−) %
Dependability indices Single rating 0.738 0.792 + 7.3 %Double rating 0.849 0.884 + 4.1 %
Correlations with coding scores 0.717** 0.828** + 15.5 %
** Correlation is significant at the 0.01 level, 2-tailed.
at UNIV FED DO RIO GRANDE DO NOR on April 23, 2014ltj.sagepub.comDownloaded from
60 Language Testing 29(1)
Discussion
Research question 1: How are confidence scores of two adjacent levels transformed into an exact score?
Findings of recent empirical studies on scoring speaking performances reveal the diffi-culty for raters to distinguish between adjacent levels (e.g. Brown, 2006a, 2006b; Brown, Iwashita, & McNamara, 2005; Brown & Taylor, 2006; Xi & Mollaun, 2006). This article proposes a confidence scoring design by using raters’ confidence in the scoring process. Raters are asked to score candidates’ performances on each of three scales or dimensions using a sum of 10 scores to show their judging confidence of the two adjacent levels.
Confidence scores of the adjacent levels must be converted into an exact score for test use and interpretation. To achieve this goal, membership functions are empirically con-structed according to established language test data (this article uses IELTS Percentile Ranks 2009 as an example). From the findings, it can therefore be asserted that computa-tion and reasoning of confidence scores to an exact score can be deemed acceptably operational (Figure 1b). As mentioned, the first question is not solved separately, and is dealt with in the second question because only by taking account of confidence scores to the three scales can we eventually transform the confidence scores into an exact score.
Research question 2: In what way are confidence scores for the three scales transformed into an exact score?
A corollary of complexity of speaking performance was that there existed an overlap between scales – found in many studies (e.g. Brown, 2006a; Xi & Mollaun, 2006). Furthermore, precise mathematical relations among scales were hard to establish. The equal weighting activity, therefore, lacked theoretical or empirical foundations. Confidence scoring design makes best use of the expertise and experience of language testing experts and experienced raters by adopting rule bases (Table 3) to tackle the over-lap between the three scales. Finally, the confidence scores of the two adjacent levels to three scales are eventually computed and reasoned to an exact score for interpretation and use (see the Confidence Scoring Algorithm).
It should also be noted that confidence scoring is based on and developed from traditional scoring in the following three ways. First, if raters are very confident in their judgments, they score the speaking performances traditionally by assigning a ‘10’ to one particular level, which means that confidence scoring embraces traditional scoring but provides a more flexible way of acknowledging raters’ scoring confidence for assigning scores. Second, confidence scores are processed into exact scores based on rule bases, which takes advan-tage of human expertise in dealing with the scoring of sophisticated speaking performances. Third, both confidence and traditional scorings finally produce exact scores, which are eas-ily interpreted and used and can be scaled to the reported scores for further needs.
Conclusion and future work
Fuzziness of speaking performance evokes two problems with traditional scoring practice: indistinction between adjacent levels and overlap between scales. Thus, this article
at UNIV FED DO RIO GRANDE DO NOR on April 23, 2014ltj.sagepub.comDownloaded from
Jin et al. 61
proposes a confidence scoring by acknowledging raters’confidence for assigning scores of two adjacent levels to three scales. Confidence scoring, however, produces many scores, which are thus interpreted and used with difficulty. To address this concern, membership functions and rule bases are employed to deal with these confidence scores, and a confidence scoring algorithm has been designed to process these confidence scores into an exact score. Score interpretation and use are also discussed in the context of confidence scoring.
Finally, a pilot study was conducted to test confidence scoring. As a result, the effi-cient calculation of scoring results has proven the feasibility of the confidence scoring algorithm. Preliminary comparisons are then conducted between traditional and confi-dence scoring, and coding scores are chosen as benchmarks. Generalizability theory and correlations are applied, and the results show that confidence scoring performs better both in scoring dependability and correlations with coding scores. Compared with tradi-tional scoring, confidence scoring has improved both in dependability indices (single rating: 7.3%, double rating: 4.1%) and in correlations with benchmarks (15.5%).
Limitations are also noted in this article and demand further explorations in future. First, benchmark samples at all levels and scales in a particular speaking test should be selected for experts and raters to determine the compound effects of different scales; such empirical data are suggested to establish real rule bases for that speaking test. Second, performances of various speaking tasks (e.g. independent and integrated tasks) and coding scores representing wide dimensions of the speaking construct (e.g. vocabu-lary and grammar) are suggested to be employed. Third, a fruitful area for future research might be to compare confidence scoring with other approaches. Both quantitative analy-ses (e.g. many-faceted Rasch measurement and generalizability theory) and qualitative measures (e.g. introspective techniques) could thus be applied in order to build a validity argument (Chapelle, Enright, & Jamieson, 2008; Bachman & Palmer, 2010) and make further refinements to the confidence scoring.
References
Alderson, J. C. (1991). Bands and scores. In J. C. Alderson & B. North (Eds.), Language testing in the 1990s: The communicative legacy (pp. 71–86). London: Macmillan.
Bachman, L. (1990). Fundamental considerations in language testing. Oxford: Oxford University Press.
Bachman, L. F., & Palmer, A. S. (1996). Language testing in practice. Oxford: Oxford University Press.
Bachman, L. F., & Palmer, A. S. (2010). Language assessment in practice. Oxford: Oxford University Press.
Bai, S.-M., & Chen, S.-M. (2008). Evaluating students’ learning achievement using fuzzy mem-bership functions and fuzzy rules. Expert Systems with Applications, 34(1), 399–410.
Brennan, R. L. (2001). Generalizability theory. New York: Springer-Verlag.Brown, A. (2005). Interviewer variability in oral proficiency interviews. Frankfurt: Peter Lang.Brown, A. (2006a). An examination of the rating process in the revised IELTS Speaking Test.
In P. McGovern & S. Walsh (Eds.), IELTS research reports 2006 (pp. 41–70). Canberra & Manchester: IELTS Australia and British Council.
Brown, A. (2006b). Candidate discourse in the revised IELTS Speaking Test. In P. McGovern & S. Walsh (Eds.), IELTS research reports 2006 (pp. 71–89). Canberra & Manchester: IELTS Australia and British Council.
at UNIV FED DO RIO GRANDE DO NOR on April 23, 2014ltj.sagepub.comDownloaded from
62 Language Testing 29(1)
Brown, A., Iwashita, N., & McNamara, T. (2005). An examination of rater orientations and test taker performance on English-for-Academic-Purposes speaking tasks (TOEFL Monograph No. 29). Princeton, NJ: Educational Testing Service.
Brown, A., & Taylor, L. (2006). A world survey of examiners’ views and experience of the revised IELTS Speaking Test. Cambridge ESOL: Research Notes, 26, 14–18.
Canale, M. (1983). On some dimensions of language proficiency. In J. Oller (Ed.), Issues in lan-guage testing research (pp. 333–342). Rowley, MA: Newbury House.
Canale, M., & Swain, M. (1980). Theoretical bases of communicative approaches to second lan-guage teaching and testing. Applied Linguistics, 1(1), 1–47.
Chalhoub-Deville, M. (2003). Second language interaction: Current perspectives and future trends. Language Testing, 20(4), 269–383.
Chapelle, C. A. (1998). Construct definition and validity inquiry in SLA research. In L. Bachman and A. Cohen. (Eds.), Interfaces between second language acquisition and language testing research (pp. 32–70). Cambridge: Cambridge University Press.
Chapelle, C., Enright, K., & Jamieson, M. (Eds.). (2008). Building a validity argument for the Test of English as a Foreign Language. New York: Routledge.
China National Office for Teaching Chinese as a Foreign Language. (2002). Teaching sylla-bus of college Chinese majors for oversea students. Beijing: Beijing Language and Culture University Press.
Davies, A. (1990). Principles of language testing. Oxford: Basil Blackwell.Davies, A. (2008). Assessing academic English: Testing English proficiency, 1950–1989 – the
IELTS solution. Cambridge: Cambridge University Press.Douglas, D. (1994). Quantity and quality in speaking test performance. Language Testing, 11(2),
125–144.Douglas, D. (2000). Assessing languages for specific purposes. Cambridge: Cambridge University
Press.Douglas, D., & Selinker, L. (1992). Analyzing oral proficiency test performance in general and
specific purpose contexts. System, 20(3), 317–328.Douglas, D., & Selinker, L. (1993). Performance on a general versus a field-specific test of speak-
ing proficiency by international teaching assistants. In D. Douglas, & C. Chapelle (Eds.), A new decade of language testing research: Selected papers from the 1990 Language Testing Research Colloquium (pp. 235–256). Alexandria, VA: TESOL.
Educational Testing Service. (2005). TOEFL iBT tips: How to prepare for the next genera-tion TOEFL test and communicate with confidence. Princeton, NJ: Educational Testing Service.
Enright, M. K., Bridgeman, B., Eignor, D., Lee, Y.-W., & Powers, D. E. (2008). Prototyping meas-ures of listening, reading, speaking, and writing. In C. A. Chapelle, M. K. Enright, & J. M. Jamieson (Eds.), Building a validity argument for the Test of English as a Foreign Language (pp. 145–186). New York: Routledge.
Fulcher, G. (1996). Does thick description lead to smart tests? A data-based approach to rating scale construction. Language Testing, 13(2): 208–238.
Fulcher, G. (2003). Testing second language speaking. London: Pearson Education.IELTS Website. (19 January 2010). Score processing and reporting. Retrieved on 19 January 2010
from www.ielts.org/researchers/score_processing_and_reporting.aspxIELTS Website. (17 June 2010). IELTS percentile ranks 2009. Retrieved on 17 June 2010 from
www.ielts.org/researchers/analysis_of_test_data/percentile_ranks_2009.aspxIELTS Website. (7 August 2010). IELTS speaking band descriptors. Retrieved on 7 August 2010
from www.ielts.org/PDF/UOBDs_SpeakingFinal.pdf
at UNIV FED DO RIO GRANDE DO NOR on April 23, 2014ltj.sagepub.comDownloaded from
Jin et al. 63
Ingram, D. E., & Wylie, E. (1993). Assessing speaking proficiency in the International English Language Testing System. In D. Douglas & C. Chapelle (Eds.), A new decade of language testing research: Selected papers from the 1990 Language Testing Research Colloquium (pp. 220–234). Alexandria, VA: TESOL.
Iwashita, N., Brown, A., McNamara, T., & O’Hagan, S. (2008). Assessed levels of second lan-guage speaking proficiency: How distinct? Applied Linguistics, 29(1), 24–49.
Jin, T. (2009). An investigation into fuzzy scoring methods for speaking tests. Master’s degree thesis. Shanghai: Shanghai Jiao Tong University, Beijing: China Master Theses Full-text Database.
Jin, T., Wang, Y., Song, C., & Guo, S. (2008). An empirical study of fuzzy scoring methods for speaking tests. Modern Foreign Languages, 31(2): 157–164.
Landis, J. R., & Koch, G. G. (1977). The measurement of observer agreement for categorical data. Biometrics, 33(1), 159–174.
Law, C. K. (1996). Using fuzzy numbers in educational grading system. Fuzzy Sets and Systems, 83(3), 311–323.
Lee, Y.-W. (2005). Dependability of scores for a new ESL speaking test: Evaluating prototype tasks. TOEFL Monograph no. 28. Princeton, NJ: Educational Testing Service.
Lee, J.-W., & Schallert, D. (1997). The relative contribution of L2 language proficiency and L1 reading ability to L2 reading performance: A test of the threshold hypothesis in an EFL con-text. TESOL Quarterly, 31(4), 713–739.
McNamara, T. F. (1996). Measuring second language performance. London: Longman.North, B. (2000). The development of a common framework scale of language proficiency.
New York: Peter Lang. Pearlman, M. (2008). Finalizing the test blueprint. In C. A. Chapelle, M. K. Enright, & J. M.
Jamieson (Eds.), Building a validity argument for the Test of English as a Foreign Language (pp. 227–258). New York: Routledge.
Saleh, I., & Kim, S. (2009). A fuzzy system for evaluating students’ learning achievement. Expert Systems with Applications, 36(3), 6236–6243.
Sawaki, Y. (2007). Construct validation of analytic rating scales in a speaking assessment: Reporting a score profile and a composite. Language Testing. 24(3): 355–390.
Smithson, M. & Verkuilen, J. (2006). Fuzzy set theory: Applications in the social sciences. Thousand Oaks, CA: Sage.
Turner, C. E., & Upshur, J. (2002). Rating scales derived from student samples: Effects of the scale marker and the student sample on scale content and student scores. TESOL Quarterly, 36(1), 49–70.
Van Leekwijck, W. & Kerre, E. E. (1999). Defuzzification: Criteria and classification. Fuzzy Sets and Systems, 108(2), 159–178.
Wang, H.-Y., & Chen S.-M. (2008). Evaluating students’ answerscripts using fuzzy numbers asso-ciated with degrees of confidence. IEEE Transactions on Fuzzy Systems, 16(2), 403–415.
Wang, L., Eignor, D., & Enright, M. K. (2008). A final analysis. In C. A. Chapelle, M. K. Enright, & J. M. Jamieson (Eds.), Building a validity argument for the Test of English as a Foreign Language (pp. 259–318). New York: Routledge.
Xi, X. (2007). Evaluating analytic scoring for the TOEFL® Academic Speaking Test (TAST) for operational use. Language Testing, 24(2), 251–286.
Xi, X., & Mollaun, P. (2006). Investigating the utility of analytic scoring for the TOEFL Academic Speaking Test (TAST) (TOEFL iBT Research Report No. TOEFLiBT-01). Princeton, NJ: Educational Testing Service.
Zadeh, L. A. (1965). Fuzzy sets. Information and Control, 8(3), 338–353.Zimmermann, H.-J. (2001). Fuzzy set theory and its applications (4th ed.). Boston, MA: Kluwer
Academic.
at UNIV FED DO RIO GRANDE DO NOR on April 23, 2014ltj.sagepub.comDownloaded from
64 Language Testing 29(1)
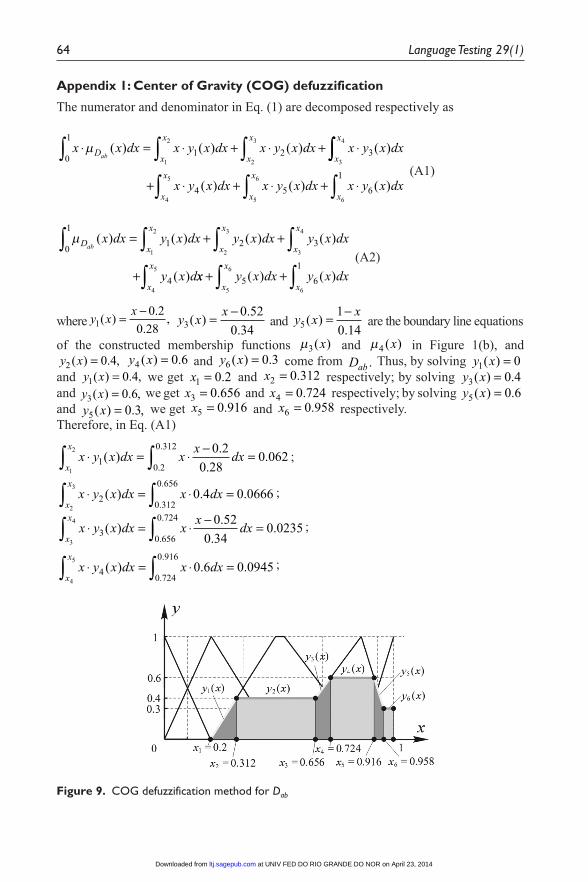
Appendix 1: Center of Gravity (COG) defuzzification
The numerator and denominator in Eq. (1) are decomposed respectively as
x x dx x y x dx x y x dx x y x dxDx
x
x
x
x
x
ab⋅ = ⋅ + ⋅ + ⋅∫ ∫ ∫µ ( ) ( ) ( ) ( )
0
1
1 2 31
2
2
3
3
4∫∫∫ ∫ ∫+ ⋅ + ⋅ + ⋅x y x dx x y x dx x y x dxx
x
x
x
x4 5 6
1
4
5
5
6
6
( ) ( ) ( ) (A1)
µDx
x
x
x
x
x
abx dx y x dx y x dx y x dx
y x d
( ) ( ) ( ) ( )
( )
0
1
1 2 3
4
1
2
2
3
3
4∫ ∫ ∫ ∫= + +
+ xx y x dx y x dxx
x
x
x
x4
5
5
6
65 6
1
∫ ∫ ∫+ +( ) ( )
(A2)
where y xx
10 2
0 28( )
.
.,= − y x
x3
0 52
0 34( )
.
.= −
and y xx
51
0 14( )
.= −
are the boundary line equations
of the constructed membership functions µ3( )x and µ4 ( )x in Figure 1(b), and y x2 0 4( ) . ,= y x4 0 6( ) .= and y x6 0 3( ) .= come from Dab . Thus, by solving y x1 0( ) =
and y x1 0 4( ) . ,= we get x1 0 2= . and x2 0 312= . respectively; by solving y x3 0 4( ) .= and y x3 0 6( ) . ,= we get x3 0 656= . and x4 0 724= . respectively; by solving y x5 0 6( ) .= and y x5 0 3( ) . ,= we get x5 0 916= . and x6 0 958= . respectively.Therefore, in Eq. (A1)
x y x dx xx
dxx
x⋅ = ⋅ − =∫ ∫1
0 2
0 312
1
2 0 2
0 280 062( )
.
..
.
.;
x y x dx x dxx
x⋅ = ⋅ =∫ ∫2
0 312
0 656
2
3
0 4 0 0666( ) . ..
.;
x y x dx xx
dxx
x⋅ = ⋅ − =∫ ∫3
0 656
0 724
3
4 0 52
0 340 0235( )
.
..
.
.
x y x dx x dxx
x⋅ = ⋅ =∫ ∫4
0 724
0 916
4
5
0 6 0 0945( ) . ..
.;
Figure 9. COG defuzzification method for Dab
;
at UNIV FED DO RIO GRANDE DO NOR on April 23, 2014ltj.sagepub.comDownloaded from
Jin et al. 65
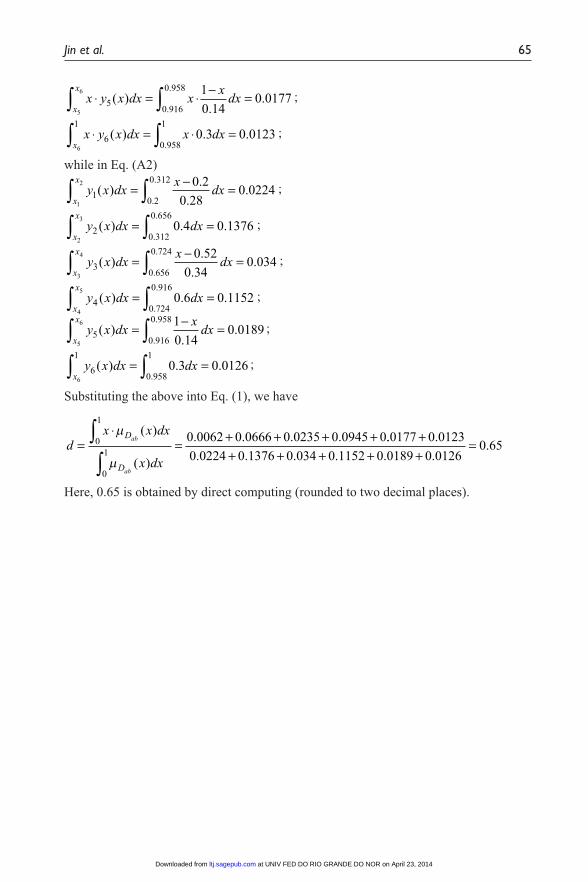
x y x dx xxdx
x
x⋅ = ⋅ − =∫ ∫5
0 916
0 958
5
6 1
0 140 0177( )
..
.
.;
x y x dx x dxx
⋅ = ⋅ =∫ ∫6
1
0 958
1
6
0 3 0 0123( ) . ..
;
while in Eq. (A2)
y x dxx
dxx
x
10 2
0 312
1
2 0 2
0 280 0224( )
.
..
.
.
∫ ∫= − = ;
y x dx dxx
x
20 312
0 656
2
3
0 4 0 1376( ) . ..
.
∫ ∫= = ;
y x dxx
dxx
x
30 656
0 724
3
4 0 52
0 340 034( )
.
..
.
.
∫ ∫= − = ;
y x dx dxx
x
40 724
0 916
4
5
0 6 0 1152( ) . ..
.
∫ ∫= = ;
y x dxxdx
x
x
50 916
0 958
5
6 1
0 140 0189( )
..
.
.
∫ ∫= − = ;
y x dx dxx
6
1
0 958
1
6
0 3 0 0126( ) . ..∫ ∫= = ;
Substituting the above into Eq. (1), we have
dx x dx
x dx
D
D
ab
ab
=⋅
= + + + +∫∫
µ
µ
( )
( )
. . . .0
1
0
1
0 0062 0 0666 0 0235 0 0945 0.. .
. . . . . ..
0177 0 0123
0 0224 0 1376 0 034 0 1152 0 0189 0 01260 65
++ + + + +
=
Here, 0.65 is obtained by direct computing (rounded to two decimal places).
at UNIV FED DO RIO GRANDE DO NOR on April 23, 2014ltj.sagepub.comDownloaded from
Recommended