Concrete walls
The evaluation of the reinforcement design methods
in D-regions around openings and overhangs
By
Jalal Fitoury

Concrete walls, The evaluation of the reinforcement design methods in D-regions around openings and overhangs May 10, 2009
2
Concrete walls, The evaluation of the reinforcement design methods in D-regions around openings and overhangs May 10, 2009
3
Graduation report presented to the faculty of Civil Engineering and Geosciences
In fulfillments of the requirements Master of Science in Engineering
By Jalal Fitoury
May 10, 2009
Members of the thesis committee:
Prof. dr. ir. J.C. Walraven
Section Structural and Building Engineering
Faculty Civil Engineering and Geosciences, Delft University of Technology
Prof. dipl. -ing. J.N.J.A. Vamberský
Section Structural and Building Engineering
Faculty Civil Engineering and Geosciences, Delft University of Technology
Dr. ir. P.C.J. Hoogenboom
Section Structural Mechanics
Faculty Civil Engineering and Geosciences, Delft University of Technology
Ir. F.H. Middelkoop
Directing manager, Corsmit Consulting Engineers
Ir. J.A. Bunkers
Department Building Control, The Municipality of Rotterdam
Ir. L.J.M. Houben
Section Road and Railway Engineering
Faculty Civil Engineering and Geosciences, Delft University of Technology

Concrete walls, The evaluation of the reinforcement design methods in D-regions around openings and overhangs May 10, 2009
4

Concrete walls, The evaluation of the reinforcement design methods in D-regions around openings and overhangs May 10, 2009
i
Acknowledgement
Special thanks to my supervisors, Prof. dr. ir. J.C. Walraven, Prof. dipl. -ing. J.N.J.A. Vamberský, Dr. ir. P.C.J.
Hoogenboom, Ir. F.H. Middelkoop and Ir. J.A. Bunkers. I would like to show my gratitude for their guidance and
for sharing their specialized knowledge with me. I would also like to thank Ir. J.A. Den Uijl for his important
assistance.
Finally, I would like to thank my family for their support during this research.
Jalal Fitoury
May 10, 2009
Delft, The Netherlands

Concrete walls, The evaluation of the reinforcement design methods in D-regions around openings and overhangs May 10, 2009
ii
Concrete walls, The evaluation of the reinforcement design methods in D-regions around openings and overhangs May 10, 2009
iii
Abstract
Unlike for concrete beams and plates, relative little amount of theory is present for concrete walls. In
combination with the underexposure of the reinforcement design of D-regions in the codes when concrete
walls are considered, engineering companies struggle to find a clear reinforcement design procedure which is
agreed upon by all relevant parties.
This report will therefore focus on the reinforcement design of D-regions around openings and overhangs for
concrete walls loaded by a high distributed load. For this purpose 27 reinforcement designs are given in
accordance with the Dutch Code NEN6720, using the Beam Method, and in accordance with the Eurocode EN
1992-1-1, using the Strut-and-Tie Method. The designs with the Dutch Code represent the way these cases are
designed in practice, while the designs with the Eurocode show how these cases will be designed in the future.
As a last step the designs are analyzed with ATENA using the Non-Linear Elastic Finite Element Method.
The goal of this report is to clarify whether both design methods are good methods for the reinforcement
design of concrete walls with an opening or an overhang with the specifications as described in chapter 2.
Furthermore the weaknesses of both methods are indicated and recommendations are given on how to
improve the designs.
Conclusions
Both the Beam Method (Dutch Code) and the Strut-and-Tie Method (Eurocode) are conservative methods for
the cases considered. This is caused by three phenomena:
1) Both methods do not take into account the contribution of the concrete tensile strength in the wall.
2) Both methods do not take into account that the reinforcement mesh will ensure a second load path
for the tensile stresses in the wall when the concrete is cracked.
3) a) For the opening cases both methods do not take into account the positive effect of the large
concrete mass which is present at both sides of the opening. This concrete mass will offer
resistance in the increase of the opening, such that the tension tie will not be stressed as
calculated by the codes. When less concrete mass is present at the sides of the opening, this
effect will be smaller so that the stress in the tie will increase.
b) For the overhang cases both methods do not take into account the positive effect of the concrete
mass which is present over a large height above the tie. Due to the presence of this concrete
mass, the tensile stresses in the concrete will be distributed over a large height so that the
stresses in the tie will be less than calculated by the codes. When less concrete is present above
the tie, this effect will be smaller so that the stress in the tie will increase.
In the cases considered the ULS condition is determined by crushing of the concrete at the corners of the
openings. Increasing the amount of reinforcement in the ties for the cases considered will therefore not
contribute to a higher load carrying capacity of the wall. In order to reduce the concentrated stress in these
opening, the sharp edges in the corners should be round off so that the stress is distributed more equally.
When a higher load carrying capacity of the wall is still desired, compression reinforcement can be added in
order to decrease the compression stresses in the concrete.
The traditional design steps that start by defining the concentrated reinforcement ties and end with defining
the minimum reinforcement mesh needed in the wall, might lead to a considerable amount of unnecessary
reinforcement. The reinforcement mesh, which is not incorporated in the calculations for determining the
reinforcement area needed in the ULS condition, will have a considerable contribution in transferring the forces
in the wall. A better order in the design of concrete walls is to first determine the minimum reinforcement
mesh needed in the wall. Then, if necessary, reinforcement can be added in order to meet the requirements in
the SLS and ULS condition.

Concrete walls, The evaluation of the reinforcement design methods in D-regions around openings and overhangs May 10, 2009
iv
This research shows that different truss models, which lead to different reinforcements, will not result in a
considerable change in the reaction of the wall. The designer should not make an effort in enhancing a truss
model, which results in a complex system. It is better to choose a simple truss model that clarifies the force
flow throughout the truss, as long as the truss model follows the overall image drawn by the flow of forces in
the wall.
Detailing of the reinforcement is of big importance in order to transfer the loads trough the truss.
When a stress trajectory plot is used, the Eurocode calls upon the knowledge of the designer in order to
translate the stress trajectory plot into a truss model that represents the flow of forces.
The ultimate load on a wall, according to the calculations used in practice, is limited by the 𝜏2-check in such a
way, that it is only a function of the design concrete compressive strength, the thickness of the wall and the
angle of the shear reinforcement.
Recommendations
The designer should realize that the crack width calculations presented in the codes are based on a bar loaded
in tension. For walls these calculations do not provide solid ground for the determination of the crack widths.
In D-regions the maximum allowable stress in the struts is set to approx. 50% of the concrete design
compressive strength according to the Strut-and-Tie Method of the Eurocode. Outside the D-region the
maximum allowable stress is equal to the concrete design compressive strength. At the border of the D-region
this causes a compatibility problem. Efforts should be made in order to understand the consequence of these
compatibility problems.
In order to apply the Strut-and-Tie Method, it is important to have knowledge of the dimensions of the D-
region for which the Strut-and-Tie Method is applicable. Research should be performed in order to achieve
guidelines for the determination of this D-region in walls.
When high loading is applied, the struts in the Strut-and-Tie Method may become very large. In reality the
compression stresses may not be distributed over such a large width. This might lead to a distorted image of
the force flow through the D-region. Efforts should be made in order to determine the maximum width of the
compression struts.

Concrete walls, The evaluation of the reinforcement design methods in D-regions around openings and overhangs May 10, 2009
v
Table of contents
ACKNOWLEDGEMENT I
ABSTRACT III
TABLE OF CONTENTS V
1. INTRODUCTION 1
2. SPECIFICATIONS 3
2.1 THE CODES 3
2.2 THE LOADS 3
2.3 THE MATERIAL AND ENVIRONMENT 3
2.4 THE CASES 3
3. THE DESIGN METHODS 5
3.1 THE DUTCH CODE 5
3.1.1 Backgrounds of the Beam Method for deep beams 5
3.1.2 Design steps 5
3.1.3 Comments on the design steps 9
3.2 THE EUROCODE 10
3.2.1 Backgrounds of the Strut-and-Tie Method 10
3.2.2 Design steps 11
3.2.3 Analytical investigation on optimizing different truss models 15
3.2.4 Summary 36
4 THE DESIGNS 45
4.1 THE OVERHANG OF 1 M 45
4.1.1 The Dutch Code 45
4.1.2 The Eurocode, truss model 1 46
4.1.3 The Eurocode, truss model 2 46
4.1.4 The Eurocode, truss model 3 47
4.2 THE OVERHANG OF 5 M 48
4.2.1 The Dutch Code 48
4.2.2 The Eurocode, truss model 1 48
4.2.3 The Eurocode, truss model 2 49
4.2.4 The Eurocode, truss model 3 50
4.3 THE OVERHANG OF 10 M 51
4.3.1 The Dutch Code 51
4.3.2 The Eurocode, truss model 1 51
4.3.3 The Eurocode, truss model 2 52 4.3.4 The Eurocode, truss model 3 53
4.4 THE OPENING OF 1 M 54
4.4.1 The Dutch Code 54
4.4.2 The Eurocode, truss model 1 54
4.4.3 The Eurocode, truss model 2 55
4.4.4 The Eurocode, truss model 3 56
4.4.5 The Eurocode, truss model 4 56
Concrete walls, The evaluation of the reinforcement design methods in D-regions around openings and overhangs May 10, 2009
vi
4.5 THE OPENING OF 5 M 57
4.5.1 The Dutch Code 57
4.5.2 The Eurocode, truss model 1 58
4.5.3 The Eurocode, truss model 2 58
4.5.4 The Eurocode, truss model 3 59
4.5.5 The Eurocode, truss model 4 59
4.6 THE OPENING OF 10 M 60
4.6.1 The Dutch Code 60
4.6.2 The Eurocode, truss model 1 61
4.6.3 The Eurocode, truss model 2 61
4.6.4 The Eurocode, truss model 3 62
4.6.5 The Eurocode, truss model 4 62
4.7 COMPARING THE DIFFERENT DESIGNS 64
5. EVALUATION OF THE DESIGNS WITH ATENA 65
5.1 PRE-PROCESSING 65
5.1.1 Material properties 65
5.1.2 Mesh generation 66
5.1.3 The Loading 66
5.2 POST-PROCESSING 68
5.2.1 Simulation of the cases with unreinforced concrete 68
5.2.2 Simulation of the designs with a concrete tensile strength approaching zero 69
5.2.3 Investigating the importance of the reinforcement tie 72
5.2.4 Stress distribution 75
6. CONCLUSIONS AND RECOMMENDATIONS 81
6.1 CONCLUSIONS 81
6.2 RECOMMENDATIONS 82
REFERENCE 83
APPENDIX 85

Concrete walls, The evaluation of the reinforcement design methods in D-regions around openings and overhangs May 10, 2009
1
1. Introduction
Unlike for concrete beams and plates, in practice no clear design procedure is present for the reinforcement
design of D-regions in concrete walls. This is caused by the relative little amount of theory which is present for
concrete walls in combination with the underexposure of this subject in the codes.
This report therefore focuses on the reinforcement design in D-regions around openings and overhangs for
concrete walls loaded by a high distributed load. For this purpose the reinforcement design is performed
multiple times in accordance with the Dutch Code NEN6720 and the Eurocode EN 1992-1-1. The designs with
the Dutch Code using the Beam Method represent the way these cases are designed in practice. The designs
with the Eurocode using the Strut-and-Tie Method are given in order to show how these cases will be designed
in the future, as this code will be the European standard from March 2010. As a last step the designs will be
analyzed with ATENA using the Non-Linear Elastic Finite Element Method (FNL-FEM).
In the first part of this report the design methods will be discussed. The design steps of each code will be
presented after which comments on these design steps will be given. For the Eurocode an analytical
investigation is performed in order to examine how the various parameters of different truss models can be
optimized.
In the second part of this report a total of 27 designs will be given. 6 designs, representing 1 design per case,
are made with the Dutch Code. 21 designs, representing several designs per cases, are made using the
Eurocode.
In the last part of this report the designs are evaluated with ATENA. By means of ATENA it is investigated how
the different elements of the design influence the performance of the wall. Based on this investigation
conclusions are drawn.
The goal of this report is to clarify whether both design methods are good methods for the reinforcement
design of concrete walls with an opening or an overhang with the specifications as described in the next
chapter. Furthermore the weaknesses of both methods are indicated and recommendations are given on how
to improve the designs.

Concrete walls, The evaluation of the reinforcement design methods in D-regions around openings and overhangs May 10, 2009
2
Concrete walls, The evaluation of the reinforcement design methods in D-regions around openings and overhangs May 10, 2009
3
2. Specifications
This report focuses on the evaluation of the reinforcement design methods. The starting points for this
research are summed below.
2.1 The Codes
Two codes are considered in this investigation. The first code considered is the Dutch Code NEN6720, which is
based on the Beam Theory. In practice engineering companies use this code for the design of concrete
structures. The second code considered is the Eurocode EN 1992-1-1, which will be the European standard for
concrete structures from March 2010. For the design of Discontinuity-regions, the Eurocode is based on the
Strut-and-Tie Method Theory.
2.2 The loads
The evaluation of the reinforcement design methods will be investigated under high vertical distributed load on
the wall equal to 1900 kN/m for the overhang cases and 2400 kN/m for the opening cases in the Ultimate Limit
State. These high loads incorporate the total dead load and live load on the wall. The proportion of the dead
load and live load is estimated to be 50%-50%. According to both NEN6720 and EN 1992-1-1, the safety factor
for dead load and live load is respectively 1.2 and 1.5. Assuming the proportions as described above, the overall
safety factor becomes: 1.2 ∙ 0.5 + 1.5 ∙ 0.5 = 1.35. In this research other loads, such as horizontal wind load, in
plane and perpendicular to the plane of the wall, are left out of consideration. Phenomena perpendicular to
the plane of the wall, such as the lateral instability of the wall, are also left out of consideration. Furthermore
the stiffness of the supports is assumed to be infinitely stiff.
2.3 The material and environment
The concrete used for this research is of class C35/45 and B45 for respectively the Eurocode and the Dutch
code. The reinforcement used is of type FeB500. Because the design is based on walls in the inner side of the
building, the environment class is chosen equal to XC1 and 1 for respectively the Eurocode and the Dutch code.
Time effects, such as shrinkage and creep, are left out of consideration in this research as they are among other
things influenced by the fabrication method.
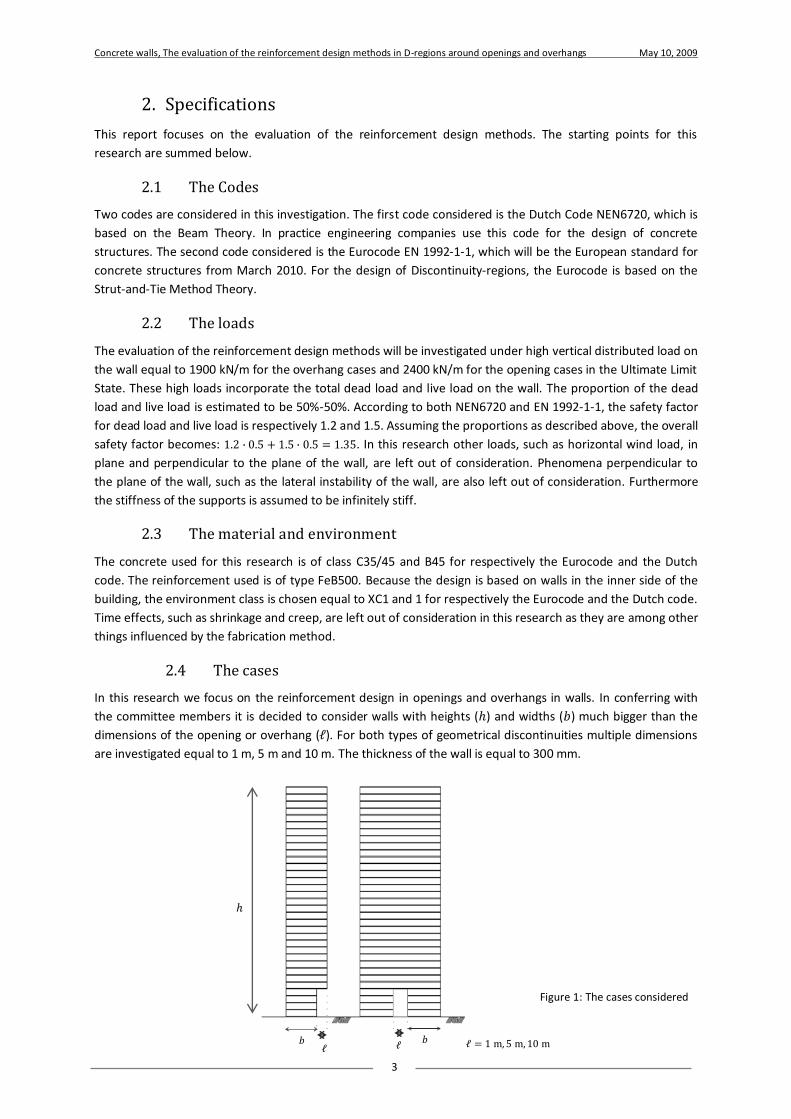
2.4 The cases
In this research we focus on the reinforcement design in openings and overhangs in walls. In conferring with
the committee members it is decided to consider walls with heights () and widths (𝑏) much bigger than the
dimensions of the opening or overhang (ℓ). For both types of geometrical discontinuities multiple dimensions
are investigated equal to 1 m, 5 m and 10 m. The thickness of the wall is equal to 300 mm.
Figure 1: The cases considered
𝑏 𝑏 ℓ = 1 m, 5 m, 10 m
ℓ ℓ

Concrete walls, The evaluation of the reinforcement design methods in D-regions around openings and overhangs May 10, 2009
4
Concrete walls, The evaluation of the reinforcement design methods in D-regions around openings and overhangs May 10, 2009
5
3. The design methods
3.1 The Dutch code
In practice a lot of engineering companies think in terms of the Dutch code. In order to give an impression of
the calculations in practice, the calculations should be performed according to the Dutch code NEN6720 for
concrete structures.
In the following chapters the background of the Beam Method for deep beams will be given in a concise
manner. Then the design steps according to the Dutch code for concrete structures NEN6720 (Ref. 4) will be
given. Finally comments will be given on the calculation method.
3.1.1 Backgrounds of the Beam Method for deep beams
The Dutch Code NEN6720 calculates deep beams by using the bending theory for thin beams on which a
correction is applied due to the influence of the vertical shear stress. For determining this correction, which
leads to a reduction for the accountable shear force, theories are used in accordance with the methods applied
by Magnel, Paduart, Brendel, and others (Ref. 2). These theories are implemented in the GBV 1962, the VB
1974/1984 and NEN6720 (VBC 1990/1995).
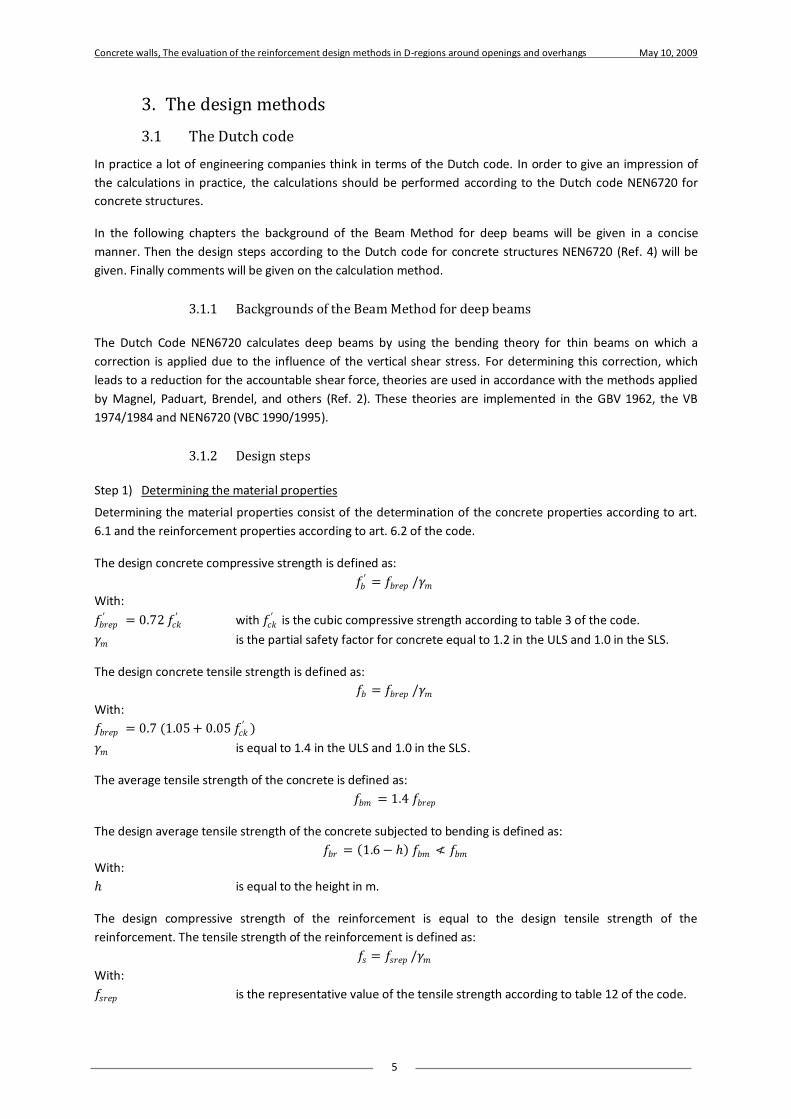
3.1.2 Design steps
Step 1) Determining the material properties
Determining the material properties consist of the determination of the concrete properties according to art.
6.1 and the reinforcement properties according to art. 6.2 of the code.
The design concrete compressive strength is defined as:
𝑓𝑏′ = 𝑓𝑏𝑟𝑒𝑝 /𝛾𝑚
With:
𝑓𝑏𝑟𝑒𝑝′ = 0.72 𝑓𝑐𝑘
′ with 𝑓𝑐𝑘′ is the cubic compressive strength according to table 3 of the code.
𝛾𝑚 is the partial safety factor for concrete equal to 1.2 in the ULS and 1.0 in the SLS.
The design concrete tensile strength is defined as:
𝑓𝑏 = 𝑓𝑏𝑟𝑒𝑝 /𝛾𝑚
With:
𝑓𝑏𝑟𝑒𝑝 = 0.7 (1.05 + 0.05 𝑓𝑐𝑘′ )
𝛾𝑚 is equal to 1.4 in the ULS and 1.0 in the SLS.
The average tensile strength of the concrete is defined as:
𝑓𝑏𝑚 = 1.4 𝑓𝑏𝑟𝑒𝑝
The design average tensile strength of the concrete subjected to bending is defined as:
𝑓𝑏𝑟 = 1.6− 𝑓𝑏𝑚 ≮ 𝑓𝑏𝑚
With:
is equal to the height in m.
The design compressive strength of the reinforcement is equal to the design tensile strength of the
reinforcement. The tensile strength of the reinforcement is defined as:
𝑓𝑠 = 𝑓𝑠𝑟𝑒𝑝 /𝛾𝑚
With:
𝑓𝑠𝑟𝑒𝑝 is the representative value of the tensile strength according to table 12 of the code.
Concrete walls, The evaluation of the reinforcement design methods in D-regions around openings and overhangs May 10, 2009
6
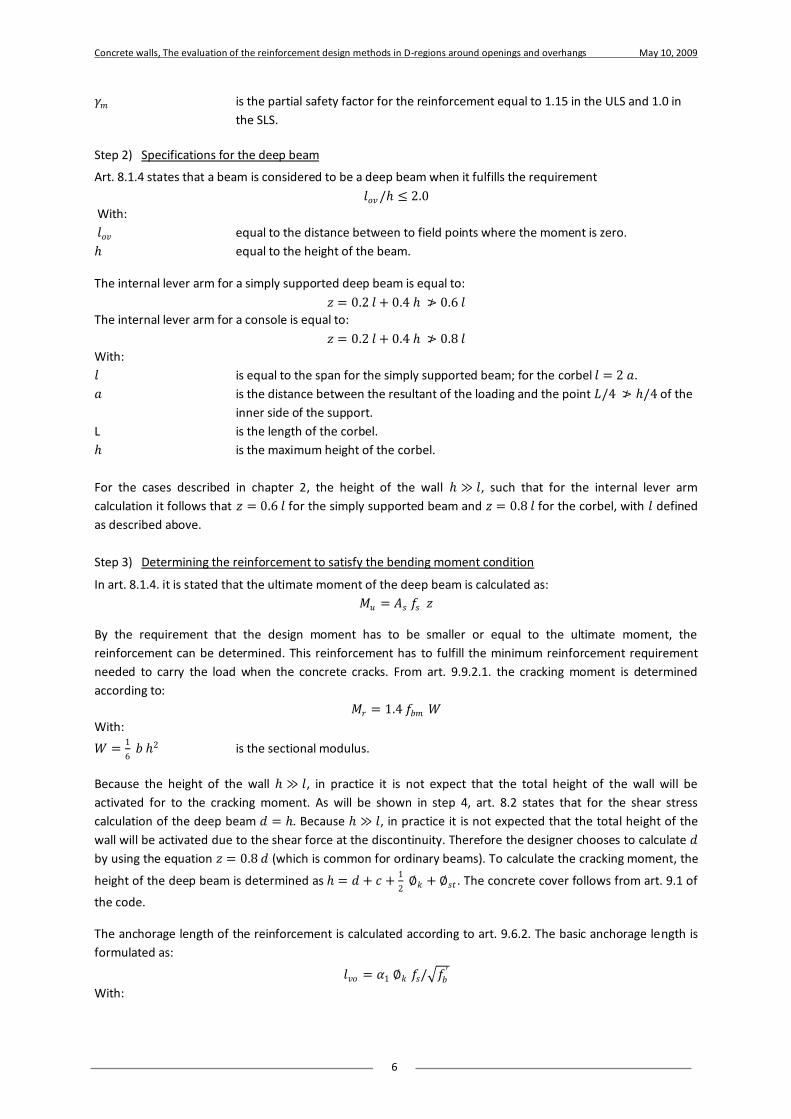
𝛾𝑚 is the partial safety factor for the reinforcement equal to 1.15 in the ULS and 1.0 in
the SLS.
Step 2) Specifications for the deep beam
Art. 8.1.4 states that a beam is considered to be a deep beam when it fulfills the requirement
𝑙𝑜𝑣/ ≤ 2.0
With:
𝑙𝑜𝑣 equal to the distance between to field points where the moment is zero.
equal to the height of the beam.
The internal lever arm for a simply supported deep beam is equal to:
𝑧 = 0.2 𝑙 + 0.4 ≯ 0.6 𝑙
The internal lever arm for a console is equal to:
𝑧 = 0.2 𝑙 + 0.4 ≯ 0.8 𝑙
With:
𝑙 is equal to the span for the simply supported beam; for the corbel 𝑙 = 2 𝑎.
𝑎 is the distance between the resultant of the loading and the point 𝐿/4 ≯ /4 of the
inner side of the support.
L is the length of the corbel.
is the maximum height of the corbel.
For the cases described in chapter 2, the height of the wall ≫ 𝑙, such that for the internal lever arm
calculation it follows that 𝑧 = 0.6 𝑙 for the simply supported beam and 𝑧 = 0.8 𝑙 for the corbel, with 𝑙 defined
as described above.
Step 3) Determining the reinforcement to satisfy the bending moment condition
In art. 8.1.4. it is stated that the ultimate moment of the deep beam is calculated as:
𝑀𝑢 = 𝐴𝑠 𝑓𝑠 𝑧
By the requirement that the design moment has to be smaller or equal to the ultimate moment, the
reinforcement can be determined. This reinforcement has to fulfill the minimum reinforcement requirement
needed to carry the load when the concrete cracks. From art. 9.9.2.1. the cracking moment is determined
according to:
𝑀𝑟 = 1.4 𝑓𝑏𝑚 𝑊
With:
𝑊 =1
6 𝑏 2 is the sectional modulus.
Because the height of the wall ≫ 𝑙, in practice it is not expect that the total height of the wall will be
activated for to the cracking moment. As will be shown in step 4, art. 8.2 states that for the shear stress
calculation of the deep beam 𝑑 = . Because ≫ 𝑙, in practice it is not expected that the total height of the
wall will be activated due to the shear force at the discontinuity. Therefore the designer chooses to calculate 𝑑
by using the equation 𝑧 = 0.8 𝑑 (which is common for ordinary beams). To calculate the cracking moment, the
height of the deep beam is determined as = 𝑑 + 𝑐 +1
2 ∅𝑘 + ∅𝑠𝑡 . The concrete cover follows from art. 9.1 of
the code.
The anchorage length of the reinforcement is calculated according to art. 9.6.2. The basic anchorage length is
formulated as:
𝑙𝑣𝑜 = 𝛼1 ∅𝑘 𝑓𝑠/ 𝑓𝑏′
With:

Concrete walls, The evaluation of the reinforcement design methods in D-regions around openings and overhangs May 10, 2009
7
𝛼1 = 0.4 (1− 0.1𝑐
∅𝑘) ≮ 0.24 for ribbed steel, with 𝑐 equal to the concrete cover.
∅𝑘 is the diameter of the reinforcement bar.
When the reinforcing bar has a diameter smaller or equal to 25 mm, the anchorage length 𝑙𝑣 is equal to the
basis anchorage length 𝑙𝑣𝑜 , otherwise 𝑙𝑣 = 1.25 𝑙𝑣𝑜 .
In art. 9.6.2. it is stated that the anchorage length may be reduced when the stress in the reinforcement bar is
smaller than the representative tension strength of the bar. The reduced anchorage length is calculated
according to:
𝑙𝑣𝑟 =𝜎𝑠𝑑𝑓𝑠
𝑙𝑣
Step 4) Determining the shear reinforcement
The shear stress in the critical cross-section is calculated according to:
𝜏𝑑 =𝑉𝑑𝑏 𝑑
Art. 8.2 states that for deep beams 𝑑 = . As already mentioned in step 3, in practice designers choose
𝑑 =1
0.8 𝑧, which is commonly the case for ordinary beams.
The ultimate shear stress of the concrete is calculated according to art. 8.2.3:
𝜏1 = 0.4 𝑓𝑏 𝑘 𝑘𝜆 𝜔03 ≮ 0.4 𝑓𝑏
With:
𝑘𝜆 =12
𝑔𝜆
𝐴0
𝑏 𝑑
3≮ 1 for corbels and beams where between the loading and the support
a compression diagonal can be formed. Otherwise 𝑘𝜆 = 1.
𝑔𝜆 = 1 + 𝜆𝑣2 for 𝜆𝑣 ≥ 0.6
𝑔𝜆 = 2.5− 3 𝜆𝑣 ≮ 1.36 for 𝜆𝑣 < 0.6
𝜆𝑣 =𝑀𝑑𝑚𝑎𝑥
𝑑 𝑉𝑑𝑚𝑎𝑥
𝑀𝑑𝑚𝑎𝑥 is the absolute maxim value of the moment.
𝑉𝑑𝑚𝑎𝑥 is the absolute maxim value of the shear force.
𝐴0 is the smallest area where the loading has to go through.
𝑘 = 1,6− ≮ 1,0 with in meters.
𝑤0 = 100 𝐴𝑠
𝑏 𝑑≯ 2.0 and ≮ 0.7− 0.5 𝜆𝑣 is the present percentage of the reinforcement to carry the
moment.
The shear stress that has to be carried by the shear reinforcement is calculated according to art. 8.2.1:
𝜏𝑠 = 𝜏𝑑 − 𝜏1
The amount of vertical shear reinforcement is then calculated according to art. 8.2.4:
𝐴𝑠𝑣 =𝜏𝑠 𝑏 𝑑
𝑧 𝑓𝑠 sin𝛼 cot𝜃 + cot𝛼
With:
45 ≯ 𝛼 ≯ 90 is the angle between the shear reinforcement and the longitudinal axis of
the deep beam. In art. 8.2.4 it is stated that for deep beams 𝛼 = 90°.
30 ≯ 𝜃 ≯ 60 is the angle between the compression diagonal and the axis of the deep
beam. For deep beams 𝜃 is calculated according art. 8.1.4.
In art. 8.2.4 it is also stated that for deep beams horizontal shear reinforcement should be applied. If 𝜆𝑣 ≥ 0.4,
the amount of horizontal shear reinforcement should be equal to the vertical shear reinforcement. Otherwise
Concrete walls, The evaluation of the reinforcement design methods in D-regions around openings and overhangs May 10, 2009
8
the horizontal shear reinforcement should be twice the vertical shear reinforcement. This horizontal shear
reinforcement should be distributed over the height of the internal leverarm 𝑧.
In art. 8.2.1 it is stated that the shear stress may not exceed the 𝜏2-value. This 𝜏2-value is formulated as:
𝜏2 = 0.2 𝑓𝑏′ 𝑘𝑛 𝑘𝜃
With:
𝑘𝑛 = 1 when no prestressing is applied.
𝑘𝜃 = 1 for 𝛼 = 90 or when no shear reinforcement is applied. Otherwise 𝑘𝜃 is a function of
angles 𝜃 and 𝛼. However this not the case for deep beams as 𝛼 = 90.
Step 5) Determining the additional reinforcement requirements
If the concrete compressive stress is bigger than the design concrete compressive strength 𝑓𝑏′ , splitting
reinforcement should be applied according to art. 9.13.1.
According to art. 9.9.3.1, 20% of the reinforcement needed to satisfy the ultimate moment should be applied
as a minimum distributed horizontal reinforcement.
The reinforcement applied at the discontinuity must be able to carry the total shear force at the section
according to 9.11.7
Step 6) Crack width control
The crack width control is performed in accordance with art. 8.7. In the SLS the stress in the uncracked
concrete has to be determined. If the concrete stress is smaller than the average tensile stress of the concrete
𝑓𝑏𝑚 , the check has to be performed according to art 8.7.3. which states that the concrete is in the crack
formation stage. Otherwise the check has to be performed according to art. 8.7.2 which states that the
concrete is in the crack stabilizing stage.
These checks are related to the diameter of the reinforcing bar ∅𝑘 and the center to center distance of the
bars. These are a function of the environment class and the stress in the reinforcing bars.
Step 7) Drawing the reinforcement
Before drawing the reinforcement the additional detailing requirements according to the code are first
determined.
According to art. 9.11.4 the center to center distance of the reinforcement, needed to carry the ultimate
moment, should not be bigger than 150 mm in the critical cross-section. In the other cross-sections the center
to center distance may not be smaller than 50 mm and bigger than 250 mm according to art. 9.11.2. According
to art. 9.11.3 the reinforcement may be distributed over an height equal to 0.2 𝑙 ≯ 0.2 , with 𝑙 being the span
and the height of the wall. When the reinforcement is bend, the radius may not be smaller than two and a
half times the diameter of the bar according to art. 9.6.3. The diameter of the bar itself must fulfill the
minimum requirements according to art. 9.9.1.
The center to center distance of the stirrups may not be bigger than 300 mm according to art. 9.11.4.4. The
same condition holds for the minimum distributed horizontal reinforcement according to art. 9.9.3.1.
The concrete cover should fulfill the requirements according to table 44 of art 9.2. In addition to table 44 it is
stated that the concrete cover must be bigger than one and a half times the diameter of the bar, when this
diameter is bigger than 25 mm.
Concrete walls, The evaluation of the reinforcement design methods in D-regions around openings and overhangs May 10, 2009
9
3.1.3 Comments on the design steps
A part of the shear force calculation in NEN6720, is the 𝜏2-check according to art. 8.2.1. This check consists of
the verification 𝜏𝑑 ≤ 𝜏2, with 𝜏𝑑 being the shear stress due to the loading and 𝜏2 = 0.2 𝑓𝑏′ 𝑘𝑛 𝑘𝜃 .
The 𝜏2 expression gives the maximum allowable shear stress based on the maximum allowable stress in the
compression strut (App. 1). The 𝜏2 expression includes the reduction of the compressive strength of the strut
due to the transverse tensile stresses caused by the reinforcement and the fact that the shear reinforcement
gives rise to local stress concentrations. The maximum allowable stress for the compression strut is for this
purpose determined by experiments. The following imperative relation was found for the compression strut
(Ref. 1):
𝜎𝑏′ = 𝜐 ∗ 𝑓𝑏
′ with: 𝜐 = 0.7−𝑓𝑐𝑘′
200≥ 0.5
When the stress in the compression strut is equal to the maximum allowable stress according to the imperative
relation, it can be shown that the shear stress in that cross-section is equal to the 𝜏2-value (App. 1).
When a wall, with an opening or an overhang, has to be checked according the shear stress calculations of
NEN6720, the 𝜏2-check has to be satisfied. In order to use the 𝜏2-check, in practice the designers schematize
the wall as a deep beam according to art. 8.1.4. However the deep beam schematization according to art. 8.1.4
was originally not meant for these types of problems. As a consequence it turns out that due to the
schematization according to art. 8.1.4, the ultimate load defined by the 𝜏2-check is not influenced by the
dimensions of the opening or overhang (App. 2). The ultimate load is than only influenced by the thickness of
the wall, the concrete compressive strength and the angle of the shear reinforcement according to the
equation:
𝑞𝑢𝑙𝑡 = 𝛽 ∗ 𝑏 ∗ 𝑓𝑏′ with:
𝛽 = 0.6 ∗5
8+cot 𝛼
1+ 5
8
2 for the overhang
𝛽 = 0.75 ∗5
6+cot 𝛼
1+ 5
6
2 for the opening
In practice the shear reinforcement in a wall will be placed vertically, such that 𝛼 = 90°. The ultimate load will
therefore be 𝑞 = 0.27 ∗ 𝑏 ∗ 𝑓𝑏′ and 𝑞 = 0.37 ∗ 𝑏 ∗ 𝑓𝑏
′ for resp. the overhang and the opening.
The reason that the ultimate load is not influenced by the dimensions of the opening or overhang, is because
the angle of the compression diagonal in art. 8.1.4 is fixed. This means that the factor 𝑘𝜃 is fixed, such that the
value of 𝜏2 is only influenced by the concrete compressive strength.
Another point that catches the eye in the design steps presented, is that the shear reinforcement is not a
function of the span due to the schematization of the wall according to art. 8.1.4. Art. 8.2 states that the shear
reinforcement is expressed by:
𝐴𝑠𝑣 =𝜏𝑠 𝑏 𝑑
𝑧 𝑓𝑠 sin 𝛼 cot 𝜃+cot 𝛼 with: 𝜏𝑠 = 𝜏𝑑 − 𝜏1
𝜏1 is the ultimate shear stress of the concrete according to art. 8.2.2 and is not a function of the span. Art. 8.2
states that 𝜏𝑑 =𝑉𝑑
𝑏 𝑑 and 𝑑 is chosen equal to 1/0.8 ∙ 𝑧 according to the calculations in practice. Because the
angle 𝜃 is fixed according to art. 8.1.4, the relation between the internal leverarm 𝑧 and the span 𝐿 is fixed.
Therefore the value of 𝑑 will increase exactly the same amount as the value of 𝑉𝑑 , such that the value of 𝜏𝑑
stays unchanged. The shear stress that has to be transferred by the shear reinforcement 𝜏𝑠 is not a function of
the span, because both 𝜏𝑑 and 𝜏1 are not a function of the span. In the expression of the shear reinforcement
𝐴𝑠𝑣 , the values of 𝜏𝑠 , 𝑏, 𝑓𝑠 , 𝛼 and 𝜃 are fixed as well as the relation of 𝑑/𝑧 is fixed. Therefore it can be
concluded that due the schematization of the wall according to art. 8.1.4 the shear reinforcement 𝐴𝑠𝑣 [mm2/m]
is not a function of the span.
Concrete walls, The evaluation of the reinforcement design methods in D-regions around openings and overhangs May 10, 2009
10
3.2 The Eurocode
3.2.1 Backgrounds of the Strut-and-Tie Method
According to art. 5.6.4 of the Eurocode (Ref. 7) the design of discontinuity regions should be performed
according to the Strut-and-Tie method. The predecessor of this method is the truss method developed by Ritter
in 1899 for the design of reinforced concrete beams loaded by shear. In 1920 Mörsch extended this truss
method for beams loaded by torsion. The method idealizes cracked reinforced concrete beams by representing
the main reinforcing steel as the tension chord, the stirrups as the vertical tension web members, and the
concrete between the inclined cracks as the compressive diagonals inclined at an angle of 45° with respect to
the longitudinal axis of the beam (Ref. 9, 10).
In the last century the truss method is improved by refining and expanding the truss analogy by Kupfer in 1964
and Leonhardt in 1965. It was observed that the angle of the concrete compression struts is generally not 45
degrees, but ranges between 25 and 65 degrees depending on the reinforcement arrangement. In 1971 and
1983 Lampert and Thürlimann introduced the truss method with compressive diagonals inclined at a variable
angle. The truss method is subsequently expanded by considering deformations for the design of concrete
beams in shear by Collins and Mitchell in 1980. However the design according to this method could only be
used in the regions where the Bernoulli hypothesis is valid, which states that plane cross-sections remain
planar after deformation. These regions are called the B-regions.
Due to discontinuities (caused by e.g. point loads or abrupt changes in the geometry) the stress distribution will
be non-linear such that the Bernoulli hypothesis will not be valid. In order to design these regions, which are
called the D-regions, the Strut-and-Tie method is developed by Marti in 1985. This Strut-and-Tie method is a
generalization of the truss method and can be applied for the designs of D-regions. The determination of the
ultimate strength by the Strut-and-Tie method is based on the lower bound plastic theory (Ref. 9).
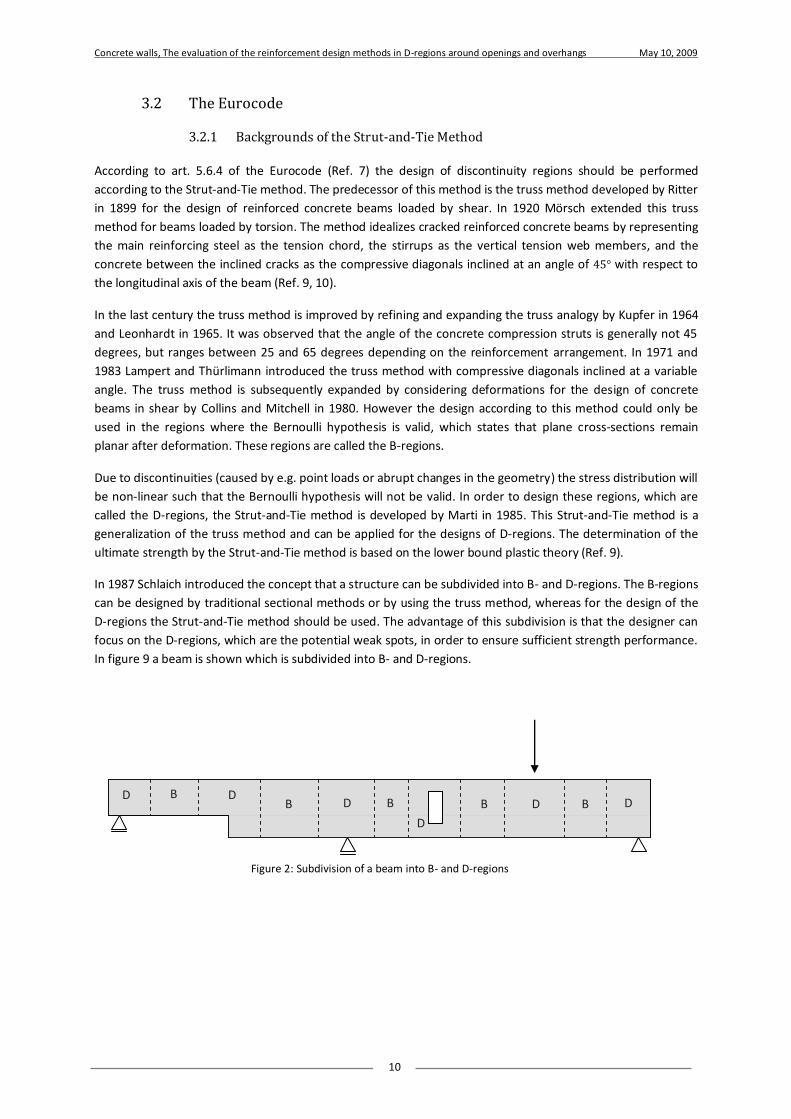
In 1987 Schlaich introduced the concept that a structure can be subdivided into B- and D-regions. The B-regions
can be designed by traditional sectional methods or by using the truss method, whereas for the design of the
D-regions the Strut-and-Tie method should be used. The advantage of this subdivision is that the designer can
focus on the D-regions, which are the potential weak spots, in order to ensure sufficient strength performance.
In figure 9 a beam is shown which is subdivided into B- and D-regions.
B B B B B
D D D D
D
D
Figure 2: Subdivision of a beam into B- and D-regions
Concrete walls, The evaluation of the reinforcement design methods in D-regions around openings and overhangs May 10, 2009
11
3.2.2 Design steps
Step 1) Determining the material properties
The first step is to determine the material properties of the structure. The material properties of the concrete
can be determined according to art. 3.1, which are based on the characteristic cylinder strength (𝑓𝑐𝑘 )
determined at 28 days.
The mean compressive strength of the concrete at an age of 28 days is defined as:
𝑓𝑐𝑚 = 𝑓𝑐𝑘 + 8 MPa
The mean tensile strength of the concrete at an age of 28 days is defined as:
𝑓𝑐𝑡𝑚 = 0.30 𝑓𝑐𝑘
23 for 𝑓𝑐𝑘 ≤ 50 MPa
𝑓𝑐𝑡𝑚 = 2.12 ln 1 +𝑓𝑐𝑚10
for 𝑓𝑐𝑘 > 50 MPa
The 5% fractile of the tensile strength of the concrete is defined as:
𝑓𝑐𝑡𝑘 ,0.05 = 0.7 𝑓𝑐𝑡𝑚
The design tensile strength and the design compressive strength of the concrete is resp. defined as:
𝑓𝑐𝑡𝑑 = 𝛼𝑐𝑡 𝑓𝑐𝑡𝑘 ,0.05/𝛾𝑐
𝑓𝑐𝑑 = 𝛼𝑐𝑐 𝑓𝑐𝑚 /𝛾𝑐
With:
𝛼𝑐𝑐 = 1,0 taking into account the long term effects on the compression strength.
𝛼𝑐𝑡 = 1,0 taking into account the long term effects on the tensile strength.
𝛾𝑐 is the partial safety factor for the concrete (ULS = 1.5 and SLS = 1.0).
The modulus of elasticity of the concrete is defined as:
𝐸𝑐𝑚 = 22 𝑓𝑐𝑚10
0.3
The material properties of the reinforcing steel can be determined according to art. 3.2, which are based on the
yield strength (𝑓𝑦𝑘 ). The design tensile strength of the reinforcing steel is defined as:
𝑓𝑦𝑑 = 𝑓𝑦𝑘 /𝛾𝑠
With:
𝛾𝑠 is the partial safety factor for the reinforcing steel (ULS = 1.15 and SLS = 1.0).
The modulus of elasticity for the reinforcing steel (𝐸𝑠 ) is equal to 210000 MPa.
According to art. 6.5.2 the design strength for a concrete strut in a region with transverse compression stress or
no transverse stress may be calculated according to 𝜎𝑅𝑑 ,𝑚𝑎𝑥 = 𝑓𝑐𝑑 . The design strength of concrete struts with
transverse tension is reduced to:
𝜎𝑅𝑑 ,𝑚𝑎𝑥 = 0.6 𝑣 ′𝑓𝑐𝑑
With:
𝑣 = 1 −𝑓𝑐𝑘
250
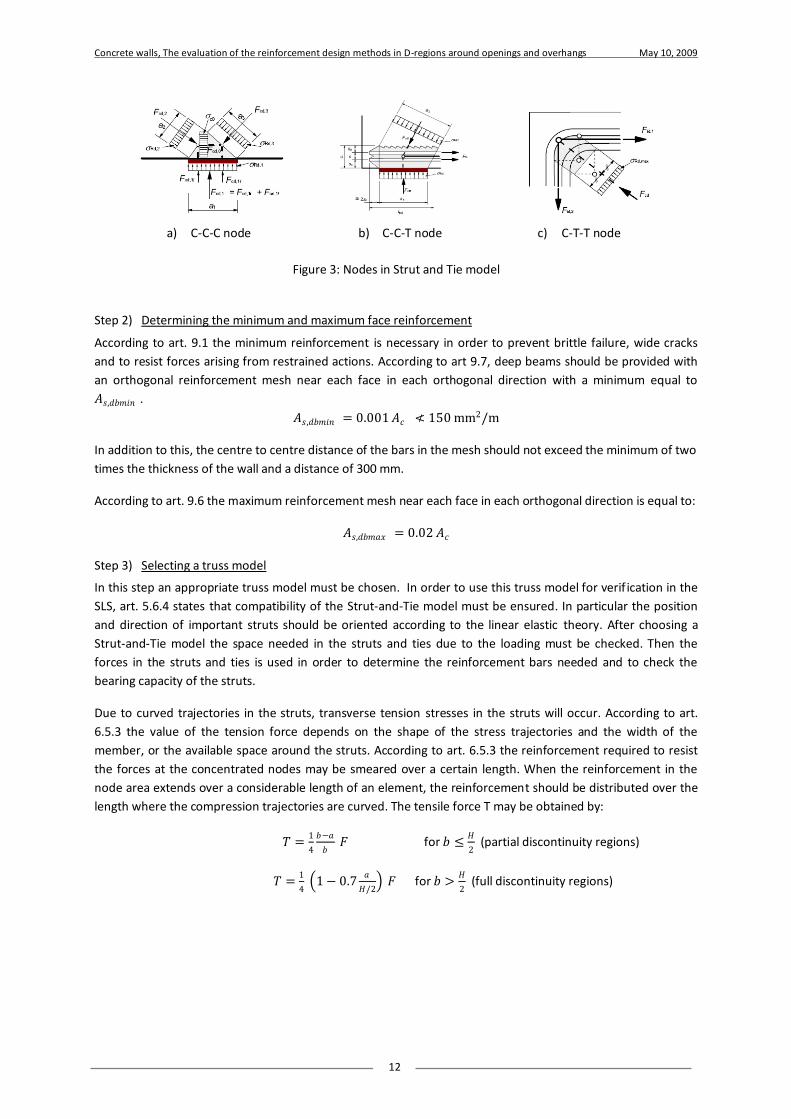
According to art. 6.5.4 the design concrete compressive stress in the nodes is limited according to the loading
on the nodes. A distinguishing is made between nodes loaded only by compression (C-C-C), nodes loaded in
tension in one direction (C-C-T) and nodes loaded in tension in two or more directions (C-T-T). The maximum
compressive strength of the nodes is calculated according to:
𝜎𝑅𝑑 ,𝑚𝑎𝑥 ,𝐶𝐶𝐶 = 𝑣 ′𝑓𝑐𝑑 for nodes loaded by C-C-C
𝜎𝑅𝑑 ,𝑚𝑎𝑥 ,𝐶𝐶𝑇 = 0,85 𝑣 ′𝑓𝑐𝑑 for nodes loaded by C-C-T
𝜎𝑅𝑑 ,𝑚𝑎𝑥 ,𝐶𝑇𝑇 = 0,75 𝑣 ′𝑓𝑐𝑑 for nodes loaded by C-T-T
Concrete walls, The evaluation of the reinforcement design methods in D-regions around openings and overhangs May 10, 2009
12
Step 2) Determining the minimum and maximum face reinforcement
According to art. 9.1 the minimum reinforcement is necessary in order to prevent brittle failure, wide cracks
and to resist forces arising from restrained actions. According to art 9.7, deep beams should be provided with
an orthogonal reinforcement mesh near each face in each orthogonal direction with a minimum equal to
𝐴𝑠,𝑑𝑏𝑚𝑖𝑛 .
𝐴𝑠 ,𝑑𝑏𝑚𝑖𝑛 = 0.001 𝐴𝑐 ≮ 150 mm2/m
In addition to this, the centre to centre distance of the bars in the mesh should not exceed the minimum of two
times the thickness of the wall and a distance of 300 mm.
According to art. 9.6 the maximum reinforcement mesh near each face in each orthogonal direction is equal to:
𝐴𝑠,𝑑𝑏𝑚𝑎𝑥 = 0.02 𝐴𝑐
Step 3) Selecting a truss model
In this step an appropriate truss model must be chosen. In order to use this truss model for verif ication in the
SLS, art. 5.6.4 states that compatibility of the Strut-and-Tie model must be ensured. In particular the position
and direction of important struts should be oriented according to the linear elastic theory. After choosing a
Strut-and-Tie model the space needed in the struts and ties due to the loading must be checked. Then the
forces in the struts and ties is used in order to determine the reinforcement bars needed and to check the
bearing capacity of the struts.
Due to curved trajectories in the struts, transverse tension stresses in the struts will occur. According to art.
6.5.3 the value of the tension force depends on the shape of the stress trajectories and the width of the
member, or the available space around the struts. According to art. 6.5.3 the reinforcement required to resist
the forces at the concentrated nodes may be smeared over a certain length. When the reinforcement in the
node area extends over a considerable length of an element, the reinforcement should be distributed over the
length where the compression trajectories are curved. The tensile force T may be obtained by:
𝑇 =1
4
𝑏−𝑎
𝑏 𝐹 for 𝑏 ≤
𝐻
2 (partial discontinuity regions)
𝑇 =1
4 1− 0.7
𝑎
𝐻/2 𝐹 for 𝑏 >
𝐻
2 (full discontinuity regions)
a) C-C-C node b) C-C-T node c) C-T-T node
Figure 3: Nodes in Strut and Tie model

Concrete walls, The evaluation of the reinforcement design methods in D-regions around openings and overhangs May 10, 2009
13
With this tension force T, one can calculate the reinforcement needed in the direction orthogonal to the strut
direction. This reinforcement can be translated to a reinforcement mesh by using the strut angle 𝜃 such that it
can be concluded whether the minimum reinforcement mesh calculated in designing step 2 is sufficient to
carry this tension force T.
𝐴𝑠,𝑑𝑏 =𝐴𝑠,𝜃
2 sin𝜃 + cos𝜃 ≮ 𝐴𝑠 ,𝑑𝑏𝑚𝑖𝑛
With:
𝐴𝑠,𝑑𝑏𝑚𝑖𝑛 minimum face reinforcement calculated in designing step 2.
𝐴𝑠,𝜃 reinforcement needed in the direction orthogonal to the strut direction in order to
carry the tension force T.
𝜃 the angle of the compression strut.
After calculating the reinforcement mesh needed for the struts, one has to calculate the reinforcement needed
for the ties. The basic anchorage length needed for this reinforcement can be calculated according to art. 8.4.3.
𝑙𝑏 ,𝑟𝑞𝑑 =𝜙
4
𝜎𝑠𝑑𝑓𝑏𝑑
With:
𝜙 is the diameter of the bar.
𝜎𝑠𝑑 is the design stress in the bar.
𝑓𝑏𝑑 = 2,25 𝜂1 𝜂2 𝑓𝑐𝑡𝑑 is the design value of the ultimate bond stress.
𝜂1 coefficient related to the bond condition (1.0 is for good bond condition).
𝜂2 coefficient related to the bar diameter (1.0 for 𝜙 ≤ 32 mm and 132−𝜙
100 for
𝜙 > 32 mm).
According to art. 8.4.4 the design anchorage length is calculated according to:
𝑙𝑏𝑑 = 𝛼1 𝛼2 𝛼3 𝛼4 𝛼5 𝑙𝑏,𝑟𝑞𝑑
With:
𝛼1 coefficient related to the form of the bars.
𝛼2 coefficient related to the concrete minimum cover.
𝛼3 coefficient related to the confinement by transverse reinforcement.
𝛼4 coefficient related to influence of welded transverse bars.
𝛼5 coefficient related to the pressure transverse to the plane of splitting.
a) Partial discontinuity regions b) Full discontinuity regions
Figure 4: Parameters for determining the transverse tensile force
Concrete walls, The evaluation of the reinforcement design methods in D-regions around openings and overhangs May 10, 2009
14
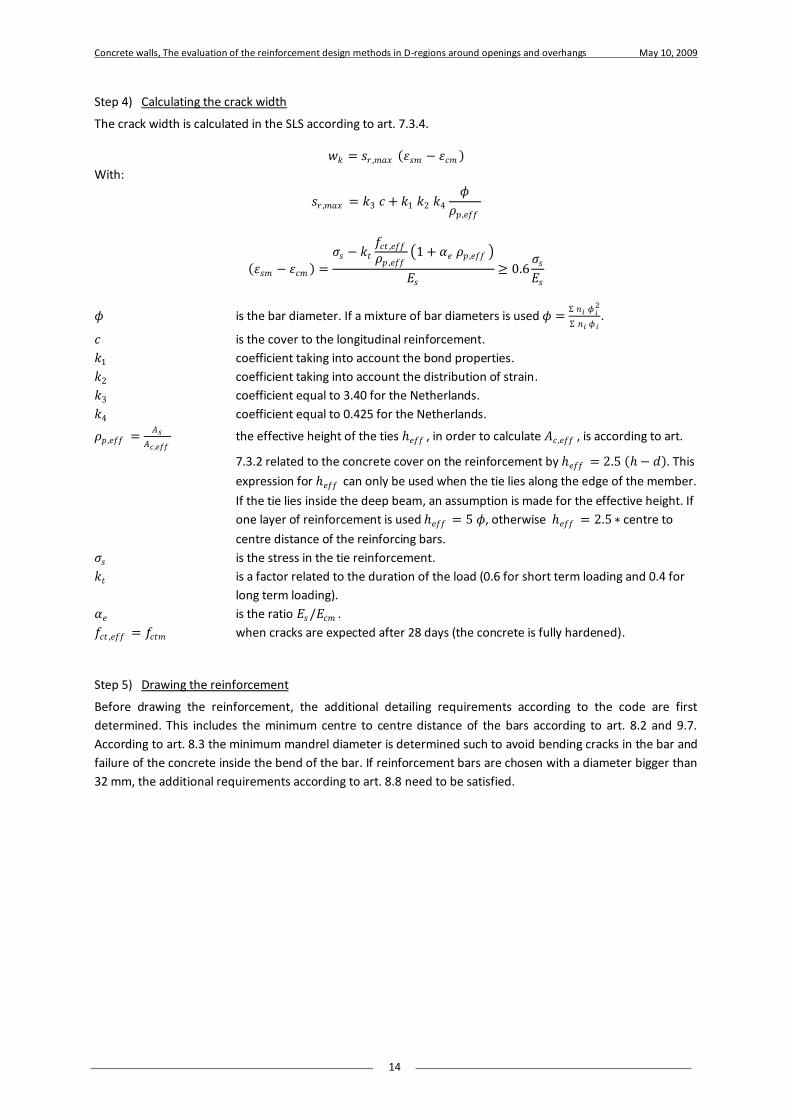
Step 4) Calculating the crack width
The crack width is calculated in the SLS according to art. 7.3.4.
𝑤𝑘 = 𝑠𝑟 ,𝑚𝑎𝑥 𝜀𝑠𝑚 − 𝜀𝑐𝑚
With:
𝑠𝑟 ,𝑚𝑎𝑥 = 𝑘3 𝑐 + 𝑘1 𝑘2 𝑘4
𝜙
𝜌𝑝 ,𝑒𝑓𝑓
𝜀𝑠𝑚 − 𝜀𝑐𝑚 =
𝜎𝑠 − 𝑘𝑡𝑓𝑐𝑡 ,𝑒𝑓𝑓
𝜌𝑝 ,𝑒𝑓𝑓 1 + 𝛼𝑒 𝜌𝑝 ,𝑒𝑓𝑓
𝐸𝑠≥ 0.6
𝜎𝑠𝐸𝑠
𝜙 is the bar diameter. If a mixture of bar diameters is used 𝜙 =Σ 𝑛𝑖 𝜙 𝑖
2
Σ 𝑛𝑖 𝜙 𝑖.
𝑐 is the cover to the longitudinal reinforcement.
𝑘1 coefficient taking into account the bond properties.
𝑘2 coefficient taking into account the distribution of strain.
𝑘3 coefficient equal to 3.40 for the Netherlands.
𝑘4 coefficient equal to 0.425 for the Netherlands.
𝜌𝑝 ,𝑒𝑓𝑓 =𝐴𝑠
𝐴𝑐 ,𝑒𝑓𝑓 the effective height of the ties 𝑒𝑓𝑓 , in order to calculate 𝐴𝑐 ,𝑒𝑓𝑓 , is according to art.
7.3.2 related to the concrete cover on the reinforcement by 𝑒𝑓𝑓 = 2.5 − 𝑑 . This
expression for 𝑒𝑓𝑓 can only be used when the tie lies along the edge of the member.
If the tie lies inside the deep beam, an assumption is made for the effective height. If
one layer of reinforcement is used 𝑒𝑓𝑓 = 5 𝜙, otherwise 𝑒𝑓𝑓 = 2.5 ∗ centre to
centre distance of the reinforcing bars.
𝜎𝑠 is the stress in the tie reinforcement.
𝑘𝑡 is a factor related to the duration of the load (0.6 for short term loading and 0.4 for
long term loading).
𝛼𝑒 is the ratio 𝐸𝑠/𝐸𝑐𝑚 .
𝑓𝑐𝑡 ,𝑒𝑓𝑓 = 𝑓𝑐𝑡𝑚 when cracks are expected after 28 days (the concrete is fully hardened).
Step 5) Drawing the reinforcement
Before drawing the reinforcement, the additional detailing requirements according to the code are first
determined. This includes the minimum centre to centre distance of the bars according to art. 8.2 and 9.7.
According to art. 8.3 the minimum mandrel diameter is determined such to avoid bending cracks in the bar and
failure of the concrete inside the bend of the bar. If reinforcement bars are chosen with a diameter bigger than
32 mm, the additional requirements according to art. 8.8 need to be satisfied.
Concrete walls, The evaluation of the reinforcement design methods in D-regions around openings and overhangs May 10, 2009
15
3.2.3 Analytical investigation on optimizing different truss models
It is observed that the Eurocode gives more freedom to the designer in comparison with the Dutch code, but at
the same time requires from the designer to have detailed knowledge of the force flow within the system. This
is especially the case when the designer has to choose an appropriate truss model for the Strut-and-Tie
method. The code recommends choosing the angle of the compression diagonals in accordance with the stress
trajectories of the linear elastic theory, when this model is used for calculations in the Serviceability Limit State.
The code does not give more guidelines in this respect.
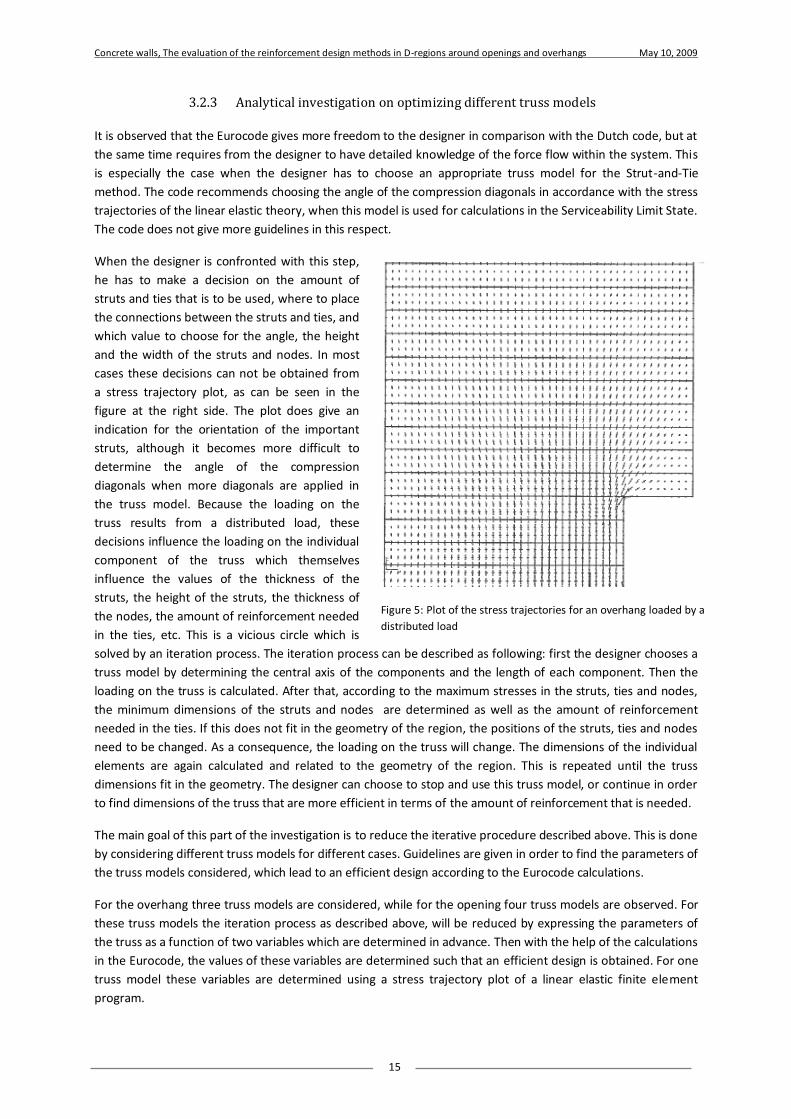
When the designer is confronted with this step,
he has to make a decision on the amount of
struts and ties that is to be used, where to place
the connections between the struts and ties, and
which value to choose for the angle, the height
and the width of the struts and nodes. In most
cases these decisions can not be obtained from
a stress trajectory plot, as can be seen in the
figure at the right side. The plot does give an
indication for the orientation of the important
struts, although it becomes more difficult to
determine the angle of the compression
diagonals when more diagonals are applied in
the truss model. Because the loading on the
truss results from a distributed load, these
decisions influence the loading on the individual
component of the truss which themselves
influence the values of the thickness of the
struts, the height of the struts, the thickness of
the nodes, the amount of reinforcement needed
in the ties, etc. This is a vicious circle which is
solved by an iteration process. The iteration process can be described as following: first the designer chooses a
truss model by determining the central axis of the components and the length of each component. Then the
loading on the truss is calculated. After that, according to the maximum stresses in the struts, ties and nodes,
the minimum dimensions of the struts and nodes are determined as well as the amount of reinforcement
needed in the ties. If this does not fit in the geometry of the region, the positions of the struts, ties and nodes
need to be changed. As a consequence, the loading on the truss will change. The dimensions of the individual
elements are again calculated and related to the geometry of the region. This is repeated until the truss
dimensions fit in the geometry. The designer can choose to stop and use this truss model, or continue in order
to find dimensions of the truss that are more efficient in terms of the amount of reinforcement that is needed.
The main goal of this part of the investigation is to reduce the iterative procedure described above. This is done
by considering different truss models for different cases. Guidelines are given in order to find the parameters of
the truss models considered, which lead to an efficient design according to the Eurocode calculations.
For the overhang three truss models are considered, while for the opening four truss models are observed. For
these truss models the iteration process as described above, will be reduced by expressing the parameters of
the truss as a function of two variables which are determined in advance. Then with the help of the calculations
in the Eurocode, the values of these variables are determined such that an efficient design is obtained. For one
truss model these variables are determined using a stress trajectory plot of a linear elastic finite element
program.
Figure 5: Plot of the stress trajectories for an overhang loaded by a
distributed load

Concrete walls, The evaluation of the reinforcement design methods in D-regions around openings and overhangs May 10, 2009
16
The overhang, truss model 1
The first truss model considered is shown in the figure above. It consists of one tie, two diagonal struts with
both width 𝑏1 and two vertical struts with widths 𝑏2 and 𝑏3. The variables of this truss model are the angle of
the compression diagonals 𝜃 and the height of the compression diagonals 1. The parameters of the truss and
the forces on the truss can be expressed as a function of those two variables, the value of the distributed load
and the dimensions of the overhang. This is done by considering the geometry requirements and the strength
requirements of the individual elements, according to the Eurocode, as will be shown below.
It should be noted that the expressions derived in the next part relate the dimensions of the truss to the
variables such that the stress in the struts is equal to the maximum allowable stress. This is a first step in order
to achieve parameters for an efficient design. In order to achieve a lower stress in the struts, the widths of the
struts have to be increased. When the width 𝑏1 of the compression diagonals is increased, the amount of the
distributed load that will go through the diagonals will increase, so that the force in the tie will increase. The
amount of reinforcement needed will therefore also increase. The stress in the diagonal itself will decrease as
𝑞𝑑 < 𝑑𝑤𝑎𝑙𝑙 𝜎𝑟𝑑 ,𝑚𝑎𝑥 . This condition must hold according to the Eurocode, otherwise the thickness of the wall is
not sufficient. When the width 𝑏2 of the vertical strut is increased, the amount of reinforcement needed will
not increase. However the length of the reinforcement will increase as the distance between the compression
diagonals will increase.
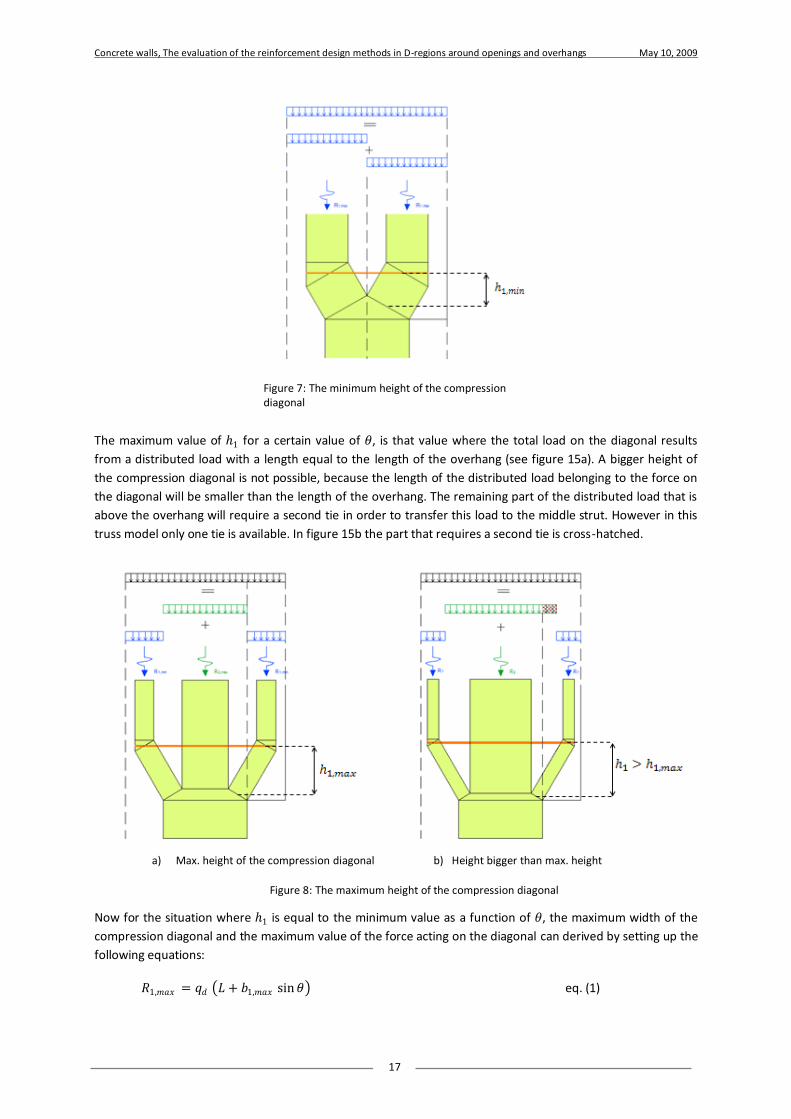
First the minimum and maximum value of 1 as a function of 𝜃 have to be observed. The minimum value of 1
for a certain value of 𝜃, is that value where the total load goes through the compression diagonals. The force
on the compression diagonal results from a distributed load with a length of (0,5 𝑏3 + 𝐿) (see figure 14).
a) Location truss model in the wall.
𝑏𝑤𝑎𝑙𝑙 ,𝑚𝑖𝑛
𝐿
Figure 6: Truss model 1 for the overhang
b) Parameters of the truss model
Concrete walls, The evaluation of the reinforcement design methods in D-regions around openings and overhangs May 10, 2009
17
The maximum value of 1 for a certain value of 𝜃, is that value where the total load on the diagonal results
from a distributed load with a length equal to the length of the overhang (see figure 15a). A bigger height of
the compression diagonal is not possible, because the length of the distributed load belonging to the force on
the diagonal will be smaller than the length of the overhang. The remaining part of the distributed load that is
above the overhang will require a second tie in order to transfer this load to the middle strut. However in this
truss model only one tie is available. In figure 15b the part that requires a second tie is cross-hatched.
Now for the situation where 1 is equal to the minimum value as a function of 𝜃, the maximum width of the
compression diagonal and the maximum value of the force acting on the diagonal can derived by setting up the
following equations:
𝑅1,𝑚𝑎𝑥 = 𝑞𝑑 𝐿 + 𝑏1,𝑚𝑎𝑥 sin𝜃 eq. (1)
a) Max. height of the compression diagonal b) Height bigger than max. height
Figure 8: The maximum height of the compression diagonal
Figure 7: The minimum height of the compression diagonal
Concrete walls, The evaluation of the reinforcement design methods in D-regions around openings and overhangs May 10, 2009
18
𝑁1,𝑚𝑎𝑥 = 𝑅1,𝑚𝑎𝑥 / sin𝜃 eq. (2)
𝜎𝑟𝑑 ,𝑚𝑎𝑥 = 0,6 𝑣 ′𝑓𝑐𝑑 eq. (3)
𝜎𝑟𝑑 ,𝐶𝐶𝑇 = 0,85 𝑣 ′𝑓𝑐𝑑 eq. (4)
𝜎𝑟𝑑 ,𝐶𝐶𝐶 = 𝑣 ′𝑓𝑐𝑑 eq. (5)
𝑏1,𝑚𝑎𝑥 =1
𝑑𝑤𝑎𝑙𝑙∙
𝑁1,𝑚𝑎𝑥
𝑚𝑖𝑛 𝜎𝑟𝑑 ,𝑚𝑎𝑥 ;𝜎𝑟𝑑 ,𝐶𝐶𝐶 ;𝜎𝑟𝑑 ,𝐶𝐶𝑇 eq. (6)
Combining eq. (1) till eq. (6) gives:
𝑅1,𝑚𝑎𝑥 =𝑞𝑑 ∙𝐿
1−𝑞𝑑 /(𝑑𝑤𝑎𝑙𝑙 ∙𝜎𝑟𝑑 ,𝑚𝑎𝑥 ) eq. (7)
𝑏1,𝑚𝑎𝑥 =𝑅1,𝑚𝑎𝑥
𝑑𝑤𝑎𝑙𝑙 ∙𝜎𝑟𝑑 ,𝑚𝑎𝑥 ∙sin 𝜃 eq. (8)
Now the situation where 1 is between the two limit values will be considered. The following equation for the
compression diagonal can now be derived:
𝑅1 = 2 𝑞𝑑 1
2 𝑏1 sin𝜃 + 𝐿 −
1
tan 𝜃 eq. (9)
𝑁1 = 𝑅1/ sin θ eq. (10)
𝑏1 =1
𝑑𝑤𝑎𝑙𝑙∙
𝑁1
𝑚𝑖𝑛 𝜎𝑟𝑑 ,𝑚𝑎𝑥 ;𝜎𝑟𝑑 ,𝐶𝐶𝐶 ;𝜎𝑟𝑑 ,𝐶𝐶𝑇 eq. (11)
Combining eq. (9) till eq. (11) gives:
𝑏1 =2 𝑞𝑑
sin 𝜃 𝑑𝑤𝑎𝑙𝑙 ∙𝜎𝑟𝑑 ,𝑚𝑎𝑥 −𝑞𝑑 ∙ 𝐿 −
1
tan 𝜃 eq. (12)
For the vertical strut above the node the following equations can be derived:
𝑏2 = 2 𝑏1,𝑚𝑎𝑥 ∙ sin𝜃 − 𝑏1 ∙ sin𝜃 eq. (13)
𝑅2 = 𝑁2 = 2 𝑞𝑑 ∙ 𝑏1,𝑚𝑎𝑥 ∙ sin𝜃 + 𝐿 − 𝑅1 eq. (14)
Combining eq. (8), (9), (12), (13) and (14) gives:
𝑏2 =2 𝑞𝑑 𝐿
𝑑𝑤𝑎𝑙𝑙 ∙𝜎𝑟𝑑 ,𝑚𝑎𝑥 −𝑞𝑑∙
2 1
𝐿∙tan 𝜃− 1 eq. (15)
𝑅2 = 2 𝑞𝑑 1
2𝑏3 + 𝐿 − 𝑅1 eq. (16)
For the vertical strut below the node, the following equations are valid:
𝑏3 = 𝑏2 + 2 𝑏1 sin θ eq. (17)
Combining eq. (12), (15) and (17) gives:
𝑏3 =2 𝑞𝑑 𝐿
𝑑𝑤𝑎𝑙𝑙 ∙𝜎𝑟𝑑 ,𝑚𝑎𝑥 −𝑞𝑑 eq. (18)
The range of 1 can now be determined according to the following equations:
Concrete walls, The evaluation of the reinforcement design methods in D-regions around openings and overhangs May 10, 2009
19
1
2𝑏3 −
1
2𝑏1 sin𝜃 +
1
tan 𝜃≥
1
2𝑏1 sin𝜃 + 𝐿 −
1
tan 𝜃 eq. (19)
1
2𝑏3 −
1
2𝑏1 sin𝜃 +
1
tan 𝜃≤
1
2 𝑏3 +
1
2 𝐿 eq. (20)
Combining eq. (12) and (18) till (20) gives:
𝐿 tan𝜃 ≤ 1 ≤1
2𝐿 tan𝜃 1 +
𝑞𝑑
𝑑𝑤𝑎𝑙𝑙 ∙𝜎𝑟𝑑 ,𝑚𝑎𝑥 eq. (21)
In theory the expressions above should be valid for widths of the wall bigger than the length of the distributed
load that is transferred by the truss. Using the geometrical conditions this can be expressed as:
𝑏𝑤𝑎𝑙𝑙 ,𝑚𝑖𝑛 = 𝑏2 + 2 𝑏1 sin𝜃 + 2 𝐿 eq. (22)
Combining eq. (12), (15) and (22) gives:
𝑏𝑤𝑎𝑙𝑙 ,𝑚𝑖𝑛 = 2 𝐿 𝑞𝑑
𝑑𝑤𝑎𝑙𝑙 𝜎𝑟𝑑 ,𝑚𝑎𝑥 −𝑞𝑑+ 1 eq. (23)
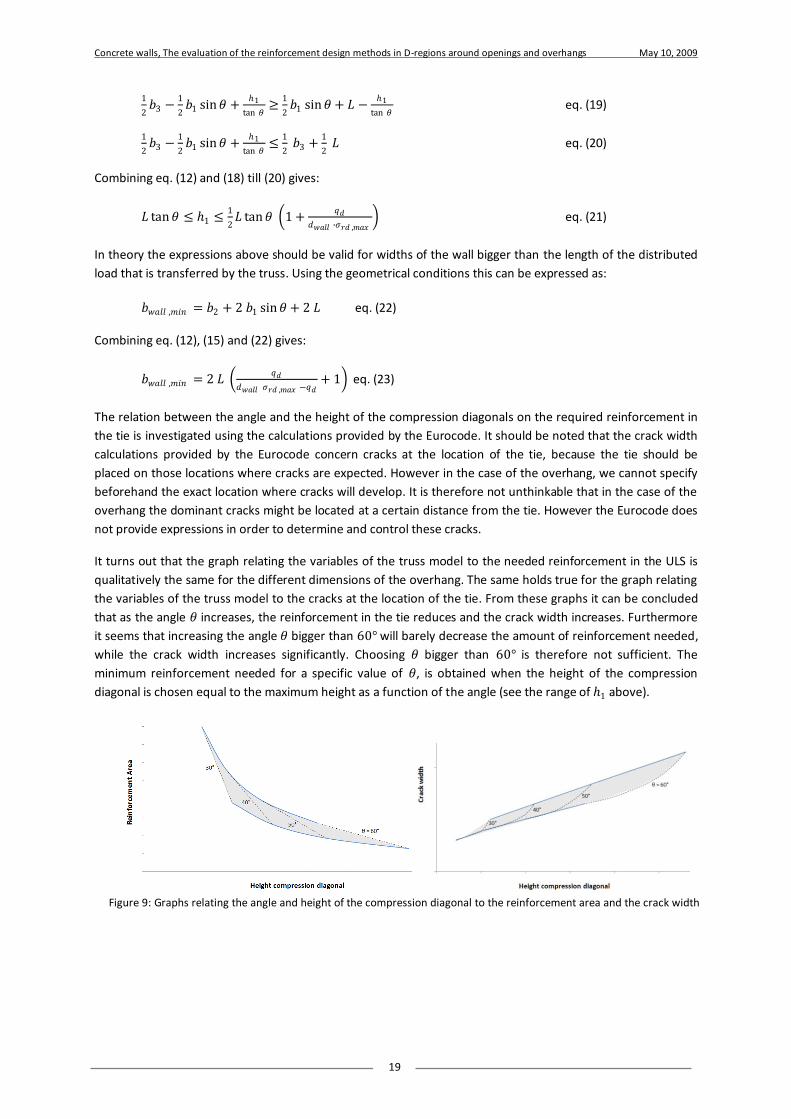
The relation between the angle and the height of the compression diagonals on the required reinforcement in
the tie is investigated using the calculations provided by the Eurocode. It should be noted that the crack width
calculations provided by the Eurocode concern cracks at the location of the tie, because the tie should be
placed on those locations where cracks are expected. However in the case of the overhang, we cannot specify
beforehand the exact location where cracks will develop. It is therefore not unthinkable that in the case of the
overhang the dominant cracks might be located at a certain distance from the tie. However the Eurocode does
not provide expressions in order to determine and control these cracks.
It turns out that the graph relating the variables of the truss model to the needed reinforcement in the ULS is
qualitatively the same for the different dimensions of the overhang. The same holds true for the graph relating
the variables of the truss model to the cracks at the location of the tie. From these graphs it can be concluded
that as the angle 𝜃 increases, the reinforcement in the tie reduces and the crack width increases. Furthermore
it seems that increasing the angle 𝜃 bigger than 60° will barely decrease the amount of reinforcement needed,
while the crack width increases significantly. Choosing 𝜃 bigger than 60° is therefore not sufficient. The
minimum reinforcement needed for a specific value of 𝜃, is obtained when the height of the compression
diagonal is chosen equal to the maximum height as a function of the angle (see the range of 1 above).
Figure 9: Graphs relating the angle and height of the compression diagonal to the reinforcement area and the crack width
Concrete walls, The evaluation of the reinforcement design methods in D-regions around openings and overhangs May 10, 2009
20
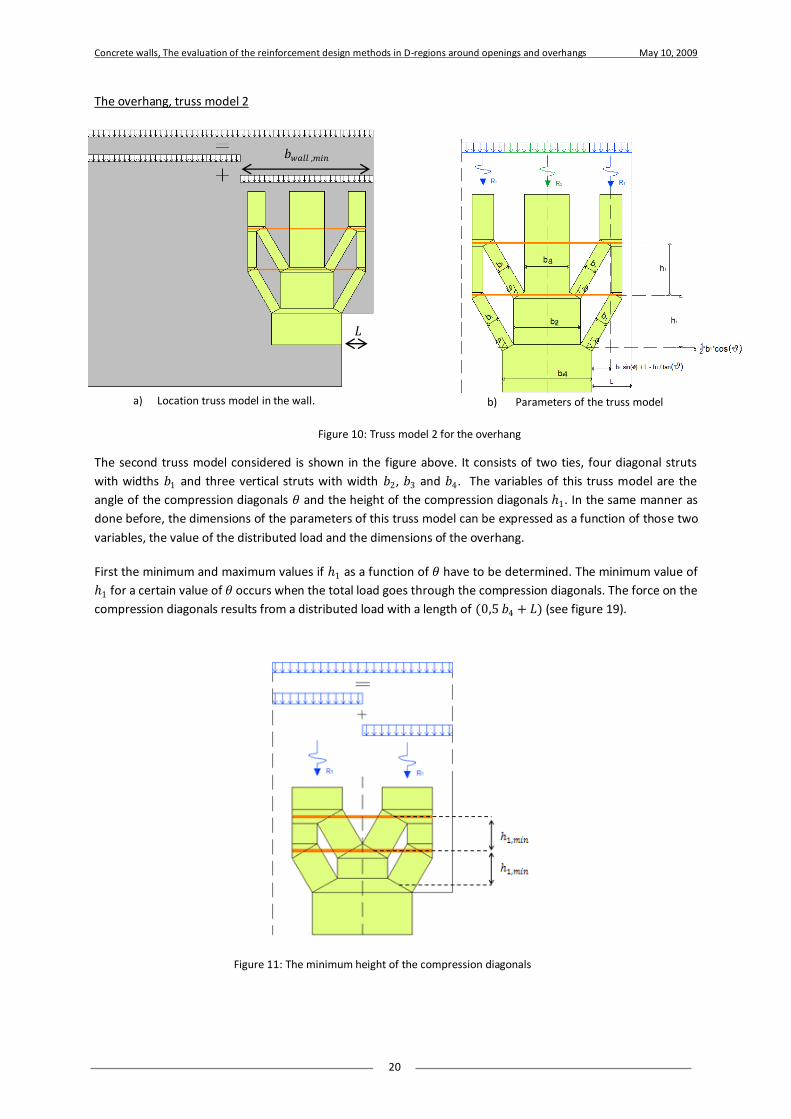
The overhang, truss model 2
The second truss model considered is shown in the figure above. It consists of two ties, four diagonal struts
with widths 𝑏1 and three vertical struts with width 𝑏2, 𝑏3 and 𝑏4. The variables of this truss model are the
angle of the compression diagonals 𝜃 and the height of the compression diagonals 1. In the same manner as
done before, the dimensions of the parameters of this truss model can be expressed as a function of those two
variables, the value of the distributed load and the dimensions of the overhang.
First the minimum and maximum values if 1 as a function of 𝜃 have to be determined. The minimum value of
1 for a certain value of 𝜃 occurs when the total load goes through the compression diagonals. The force on the
compression diagonals results from a distributed load with a length of (0,5 𝑏4 + 𝐿) (see figure 19).
Figure 11: The minimum height of the compression diagonals
Figure 10: Truss model 2 for the overhang
a) Location truss model in the wall.
𝑏𝑤𝑎𝑙𝑙 ,𝑚𝑖𝑛
𝐿
b) Parameters of the truss model
3
2
4
Concrete walls, The evaluation of the reinforcement design methods in D-regions around openings and overhangs May 10, 2009
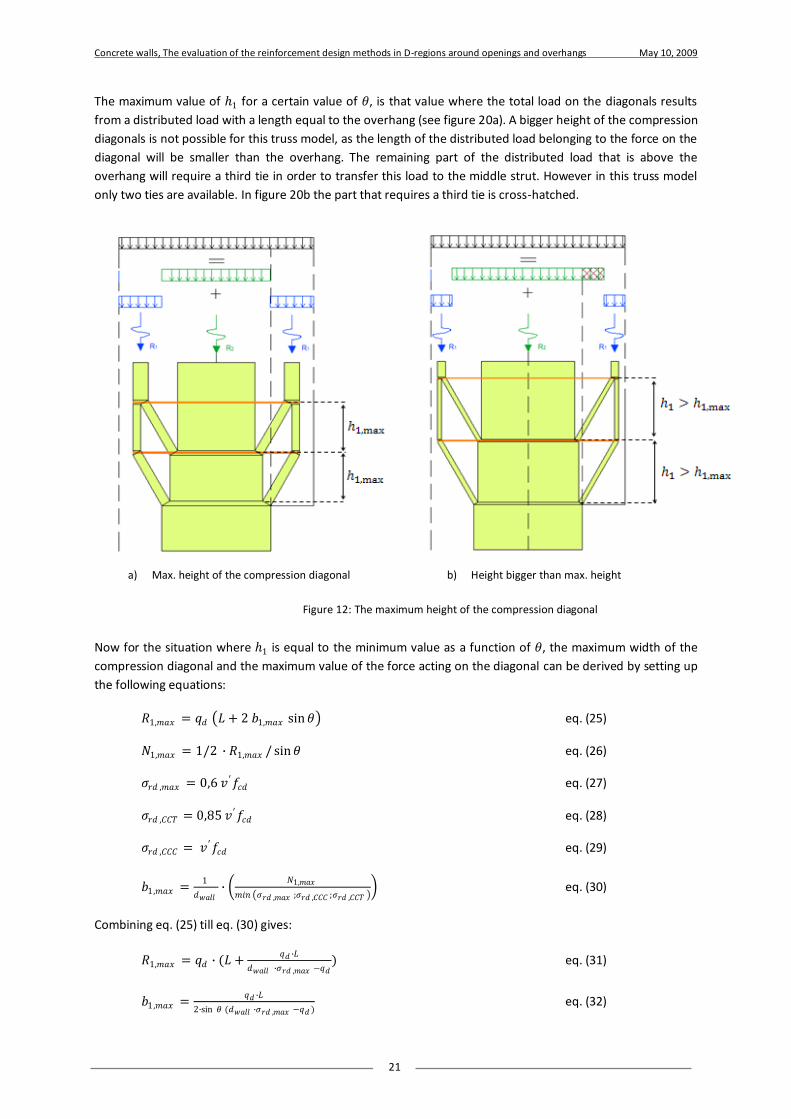
21
The maximum value of 1 for a certain value of 𝜃, is that value where the total load on the diagonals results
from a distributed load with a length equal to the overhang (see figure 20a). A bigger height of the compression
diagonals is not possible for this truss model, as the length of the distributed load belonging to the force on the
diagonal will be smaller than the overhang. The remaining part of the distributed load that is above the
overhang will require a third tie in order to transfer this load to the middle strut. However in this truss model
only two ties are available. In figure 20b the part that requires a third tie is cross-hatched.
Now for the situation where 1 is equal to the minimum value as a function of 𝜃, the maximum width of the
compression diagonal and the maximum value of the force acting on the diagonal can be derived by setting up
the following equations:
𝑅1,𝑚𝑎𝑥 = 𝑞𝑑 𝐿 + 2 𝑏1,𝑚𝑎𝑥 sin𝜃 eq. (25)
𝑁1,𝑚𝑎𝑥 = 1/2 ∙ 𝑅1,𝑚𝑎𝑥 / sin𝜃 eq. (26)
𝜎𝑟𝑑 ,𝑚𝑎𝑥 = 0,6 𝑣 ′𝑓𝑐𝑑 eq. (27)
𝜎𝑟𝑑 ,𝐶𝐶𝑇 = 0,85 𝑣 ′𝑓𝑐𝑑 eq. (28)
𝜎𝑟𝑑 ,𝐶𝐶𝐶 = 𝑣 ′𝑓𝑐𝑑 eq. (29)
𝑏1,𝑚𝑎𝑥 =1
𝑑𝑤𝑎𝑙𝑙∙
𝑁1,𝑚𝑎𝑥
𝑚𝑖𝑛 𝜎𝑟𝑑 ,𝑚𝑎𝑥 ;𝜎𝑟𝑑 ,𝐶𝐶𝐶 ;𝜎𝑟𝑑 ,𝐶𝐶𝑇 eq. (30)
Combining eq. (25) till eq. (30) gives:
𝑅1,𝑚𝑎𝑥 = 𝑞𝑑 ∙ (𝐿 +𝑞𝑑 ∙𝐿
𝑑𝑤𝑎𝑙𝑙 ∙𝜎𝑟𝑑 ,𝑚𝑎𝑥 −𝑞𝑑) eq. (31)
𝑏1,𝑚𝑎𝑥 =𝑞𝑑 ∙𝐿
2∙sin 𝜃 (𝑑𝑤𝑎𝑙𝑙 ∙𝜎𝑟𝑑 ,𝑚𝑎𝑥 −𝑞𝑑 ) eq. (32)
a) Max. height of the compression diagonal b) Height bigger than max. height
Figure 12: The maximum height of the compression diagonal

Concrete walls, The evaluation of the reinforcement design methods in D-regions around openings and overhangs May 10, 2009
22
Now the situation will be considered where 1 is between the two limit values. The following equations for the
compression diagonal can be derived:
𝑅1 = 2 𝑞𝑑 𝑏1 sin𝜃 + 𝐿 −1
tan 𝜃 eq. (33)
𝑁1 = 1/2 ∙ 𝑅1/ sin θ eq. (34)
𝑏1 =1
𝑑𝑤𝑎𝑙𝑙∙
𝑁1
𝑚𝑖𝑛 𝜎𝑟𝑑 ,𝑚𝑎𝑥 ;𝜎𝑟𝑑 ,𝐶𝐶𝐶 ;𝜎𝑟𝑑 ,𝐶𝐶𝑇 eq. (35)
Combining eq. (33) till eq. (35) gives:
𝑏1 =𝑞𝑑
sin 𝜃 𝑑𝑤𝑎𝑙𝑙 ∙𝜎𝑟𝑑 ,𝑚𝑎𝑥 −𝑞𝑑 ∙ 𝐿 −
1
tan 𝜃 eq. (36)
For the vertical strut above the lowest node, the following equations can be derived:
𝑏2 = 2 2 𝑏1,𝑚𝑎𝑥 ∙ sin𝜃 − 𝑏1 ∙ sin𝜃 eq. (37)
𝑅2 = 𝑁2 = 2 𝑞𝑑 ∙ 2 𝑏1,𝑚𝑎𝑥 ∙ sin𝜃 + 𝐿 − 𝑁1 ∙ sin𝜃 eq. (38)
Combining eq. (32), (36) and (38) gives:
𝑏2 =2 𝑞𝑑
𝑑𝑤𝑎𝑙𝑙 ∙𝜎𝑟𝑑 ,𝑚𝑎𝑥 −𝑞𝑑∙
1
tan 𝜃 eq. (39)
For the vertical strut above the highest middle node, the following equations can be derived:
𝑏3 = 2 2 𝑏1,𝑚𝑎𝑥 ∙ sin𝜃 − 2 𝑏1 ∙ sin𝜃 eq. (40)
𝑅3 = 𝑁3 = 2 𝑞𝑑 ∙ 2 𝑏1,𝑚𝑎𝑥 ∙ sin𝜃 + 𝐿 − 𝑅1 eq. (41)
Combining eq. (32), (33), (36), (40) and (41) gives:
𝑏3 =2 𝑞𝑑 𝐿
𝑑𝑤𝑎𝑙𝑙 ∙𝜎𝑟𝑑 ,𝑚𝑎𝑥 −𝑞𝑑∙
2 1
𝐿 tan 𝜃− 1 eq. (42)
𝑅3 = 2 𝑞𝑑 1
2𝑏4 + 𝐿 − 𝑅1 eq. (43)
For the vertical strut below the lowest node, the following equations can be derived:
𝑏4 = 𝑏2 + 2 𝑏1 sin θ eq. (44)
Combining eq. (36), (39) and (44) gives:
𝑏4 =2 𝑞𝑑 𝐿
𝑑𝑤𝑎𝑙𝑙 ∙𝜎𝑟𝑑 ,𝑚𝑎𝑥 −𝑞𝑑 eq. (45)
The range of 1 is now determined according to the following equations:
1
2𝑏3 + 𝑏1 sin𝜃 +
1
tan 𝜃≥
1
2(
1
2𝑏4 + 𝐿) eq. (46)
1
2𝑏3 + 𝑏1 sin𝜃 +
1
tan 𝜃≤
1
2𝑏4 +
1
2𝐿 eq. (47)
Combining eq. (36), (42) and (45) till (47) gives:
1
2𝐿 tan𝜃 ≤ 1 ≤
1
2 𝐿 tan𝜃 1 +
𝑞𝑑
𝑑𝑤𝑎𝑙𝑙 ∙𝜎𝑟𝑑 ,𝑚𝑎𝑥 eq. (48)

Concrete walls, The evaluation of the reinforcement design methods in D-regions around openings and overhangs May 10, 2009
23
In theory the expressions above should be valid for widths of the wall bigger than the length of the distributed
load that is transferred by the truss. Using the geometrical conditions this can be expressed as:
𝑏𝑤𝑎𝑙𝑙 ,𝑚𝑖𝑛 = 𝑏3 + 4 𝑏1 sin𝜃 + 2 𝐿 eq. (49)
Combining eq. (36), (42) and (49) gives:
𝑏𝑤𝑎𝑙𝑙 ,𝑚𝑖𝑛 = 2 𝐿 𝑞𝑑
𝑑𝑤𝑎𝑙𝑙 𝜎𝑟𝑑 ,𝑚𝑎𝑥 −𝑞𝑑+ 1 eq. (50)
As for truss model 1, the calculations provided in the Eurocode are used in order to determine the optimum
values for the variables of the truss model. Again it is denoted that the calculations in the Eurocode concerning
the crack width control do not take into account the cracks elsewhere than the position of the tie. As for truss
model 1, 𝜃 equal to 60° and 1 equal to the maximum value as a function of 𝜃 gives an efficient design
according to the calculations of the Eurocode.
Concrete walls, The evaluation of the reinforcement design methods in D-regions around openings and overhangs May 10, 2009
24
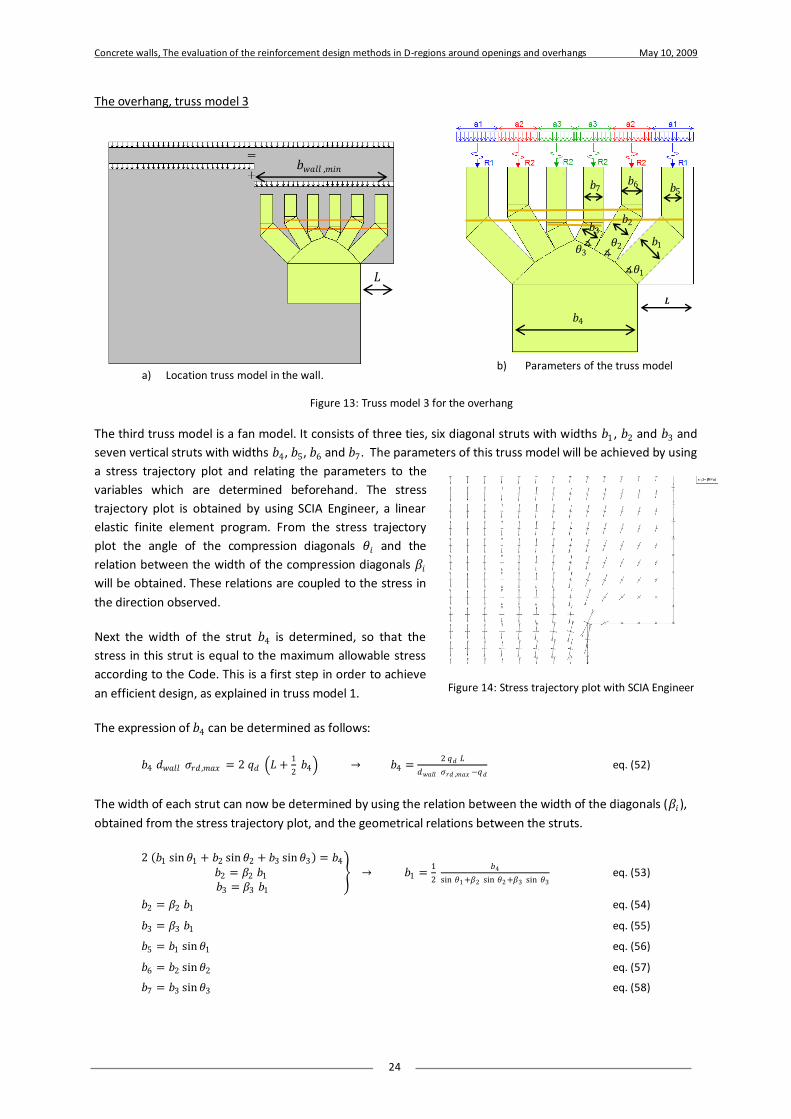
The overhang, truss model 3
The third truss model is a fan model. It consists of three ties, six diagonal struts with widths 𝑏1 , 𝑏2 and 𝑏3 and
seven vertical struts with widths 𝑏4, 𝑏5, 𝑏6 and 𝑏7. The parameters of this truss model will be achieved by using
a stress trajectory plot and relating the parameters to the
variables which are determined beforehand. The stress
trajectory plot is obtained by using SCIA Engineer, a linear
elastic finite element program. From the stress trajectory
plot the angle of the compression diagonals 𝜃𝑖 and the
relation between the width of the compression diagonals 𝛽𝑖
will be obtained. These relations are coupled to the stress in
the direction observed.
Next the width of the strut 𝑏4 is determined, so that the
stress in this strut is equal to the maximum allowable stress
according to the Code. This is a first step in order to achieve
an efficient design, as explained in truss model 1.
The expression of 𝑏4 can be determined as follows:
𝑏4 𝑑𝑤𝑎𝑙𝑙 𝜎𝑟𝑑 ,𝑚𝑎𝑥 = 2 𝑞𝑑 𝐿 +1
2 𝑏4 → 𝑏4 =
2 𝑞𝑑 𝐿
𝑑𝑤𝑎𝑙𝑙 𝜎𝑟𝑑 ,𝑚𝑎𝑥 −𝑞𝑑 eq. (52)
The width of each strut can now be determined by using the relation between the width of the diagonals (𝛽𝑖 ),
obtained from the stress trajectory plot, and the geometrical relations between the struts.
2 𝑏1 sin𝜃1 + 𝑏2 sin𝜃2 + 𝑏3 sin𝜃3 = 𝑏4
𝑏2 = 𝛽2 𝑏1 𝑏3 = 𝛽3 𝑏1
→ 𝑏1 =1
2
𝑏4
sin 𝜃1 +𝛽2 sin 𝜃2 +𝛽3 sin 𝜃3 eq. (53)
𝑏2 = 𝛽2 𝑏1 eq. (54)
𝑏3 = 𝛽3 𝑏1 eq. (55)
𝑏5 = 𝑏1 sin𝜃1 eq. (56)
𝑏6 = 𝑏2 sin𝜃2 eq. (57)
𝑏7 = 𝑏3 sin𝜃3 eq. (58)
a) Location truss model in the wall.
𝑏𝑤𝑎𝑙𝑙 ,𝑚𝑖𝑛
𝐿
Figure 13: Truss model 3 for the overhang
3 3
b) Parameters of the truss model
𝑏4
𝑏5 𝑏6 𝑏7
𝑳
𝑏1
𝑏2 𝑏3
∡𝜃1
∡ ∡ 𝜃3
𝜃2
Figure 14: Stress trajectory plot with SCIA Engineer
Concrete walls, The evaluation of the reinforcement design methods in D-regions around openings and overhangs May 10, 2009
25
The height of the individual diagonal is geometrically determined by considering the available space of the
distributed load that form the resultant force on the diagonals.
1 = tan𝜃1 𝐿 −1
2𝑎1 +
1
2 𝑏1 sin𝜃1 eq. (59)
2 = tan 𝜃2 𝐿 − 𝑎1 −1
2𝑎2 + 𝑏1 sin𝜃1 +
1
2 𝑏2 sin𝜃2 eq. (60)
3 = tan 𝜃3 1
2𝑎3 −
1
2 𝑏3 sin𝜃3 eq. (61)
With:
𝑎1 =sin 𝜃1 𝑑𝑤𝑎𝑙𝑙 𝜎𝑟𝑑 ,𝑚𝑎𝑥
𝑞𝑑 𝑏1 eq. (62)
𝑎2 =sin 𝜃2 𝑑𝑤𝑎𝑙𝑙 𝜎𝑟𝑑 ,𝑚𝑎𝑥
𝑞𝑑 𝑏2 eq. (63)
𝑎3 =1
2𝑏4 + 𝐿 − 𝑎1 − 𝑎2 eq. (64)
The value of the resultant force acting on the individual diagonal is calculated according to:
𝑅1 = 𝑞𝑑 𝑎1 eq. (65)
𝑅2 = 𝑞𝑑 𝑎2 eq. (66)
𝑅3 = 𝑞𝑑 𝑎3 eq. (67)
The minimum width of the wall for which these expressions are applicable can be expressed as:
𝑏𝑤𝑎𝑙𝑙 ,𝑚𝑖𝑛 = 2 𝐿 𝑞𝑑
𝑑𝑤𝑎𝑙𝑙 𝜎𝑟𝑑 ,𝑚𝑎𝑥 −𝑞𝑑+ 1 eq. (68)
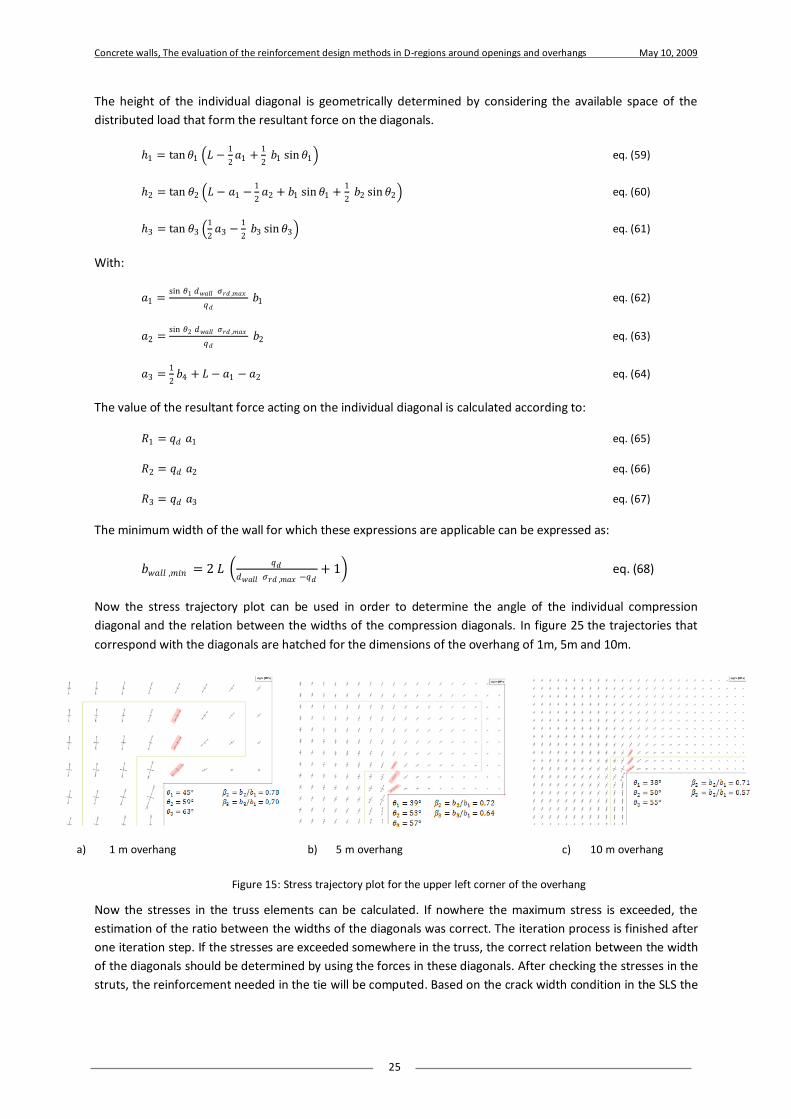
Now the stress trajectory plot can be used in order to determine the angle of the individual compression
diagonal and the relation between the widths of the compression diagonals. In figure 25 the trajectories that
correspond with the diagonals are hatched for the dimensions of the overhang of 1m, 5m and 10m.
Now the stresses in the truss elements can be calculated. If nowhere the maximum stress is exceeded, the
estimation of the ratio between the widths of the diagonals was correct. The iteration process is finished after
one iteration step. If the stresses are exceeded somewhere in the truss, the correct relation between the width
of the diagonals should be determined by using the forces in these diagonals. After checking the stresses in the
struts, the reinforcement needed in the tie will be computed. Based on the crack width condition in the SLS the
a) 1 m overhang b) 5 m overhang c) 10 m overhang
Figure 15: Stress trajectory plot for the upper left corner of the overhang
Concrete walls, The evaluation of the reinforcement design methods in D-regions around openings and overhangs May 10, 2009
26
diameter of the bars and the centre to centre distance of the bars are determined. If necessary the
reinforcement area is increased.
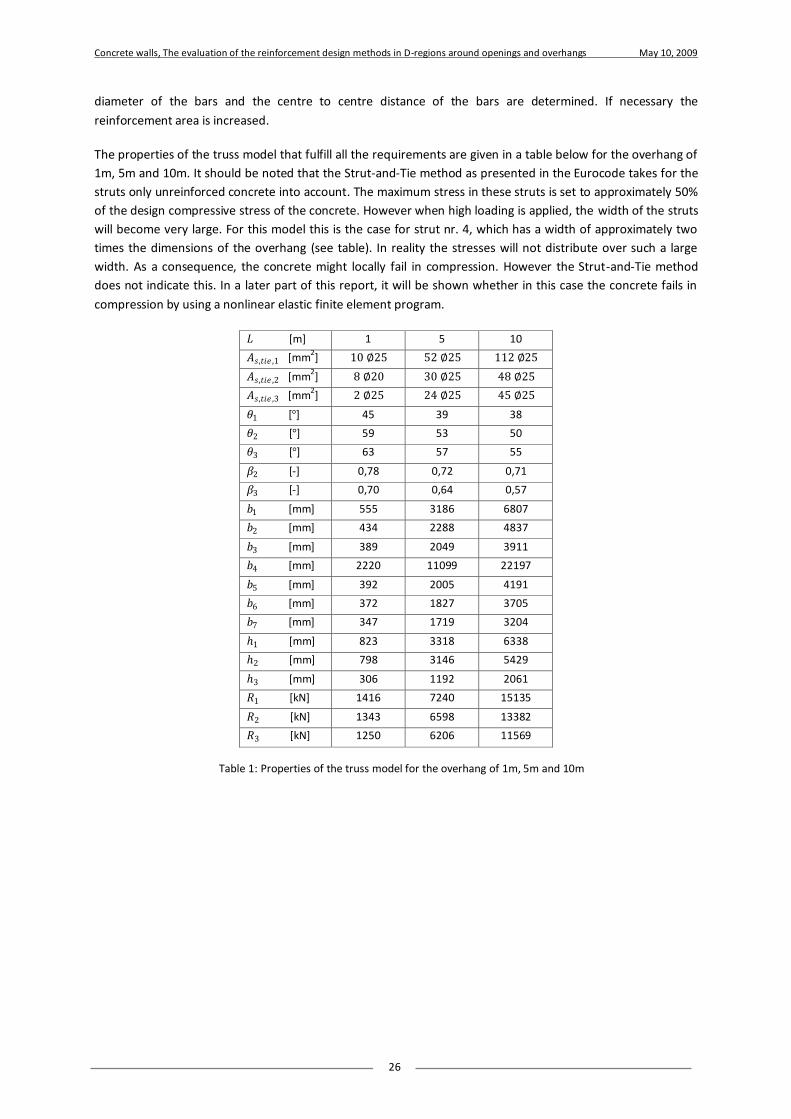
The properties of the truss model that fulfill all the requirements are given in a table below for the overhang of
1m, 5m and 10m. It should be noted that the Strut-and-Tie method as presented in the Eurocode takes for the
struts only unreinforced concrete into account. The maximum stress in these struts is set to approximately 50%
of the design compressive stress of the concrete. However when high loading is applied, the width of the struts
will become very large. For this model this is the case for strut nr. 4, which has a width of approximately two
times the dimensions of the overhang (see table). In reality the stresses will not distribute over such a large
width. As a consequence, the concrete might locally fail in compression. However the Strut-and-Tie method
does not indicate this. In a later part of this report, it will be shown whether in this case the concrete fails in
compression by using a nonlinear elastic finite element program.
𝐿 [m] 1 5 10
𝐴𝑠,𝑡𝑖𝑒 ,1 [mm2] 10 ∅25 52 ∅25 112 ∅25
𝐴𝑠,𝑡𝑖𝑒 ,2 [mm2] 8 ∅20 30 ∅25 48 ∅25
𝐴𝑠,𝑡𝑖𝑒 ,3 [mm2] 2 ∅25 24 ∅25 45 ∅25
𝜃1 [°] 45 39 38
𝜃2 [°] 59 53 50
𝜃3 [°] 63 57 55
𝛽2 [-] 0,78 0,72 0,71
𝛽3 [-] 0,70 0,64 0,57
𝑏1 [mm] 555 3186 6807
𝑏2 [mm] 434 2288 4837
𝑏3 [mm] 389 2049 3911
𝑏4 [mm] 2220 11099 22197
𝑏5 [mm] 392 2005 4191
𝑏6 [mm] 372 1827 3705
𝑏7 [mm] 347 1719 3204
1 [mm] 823 3318 6338
2 [mm] 798 3146 5429
3 [mm] 306 1192 2061
𝑅1 [kN] 1416 7240 15135
𝑅2 [kN] 1343 6598 13382
𝑅3 [kN] 1250 6206 11569
Table 1: Properties of the truss model for the overhang of 1m, 5m and 10m
Concrete walls, The evaluation of the reinforcement design methods in D-regions around openings and overhangs May 10, 2009
27
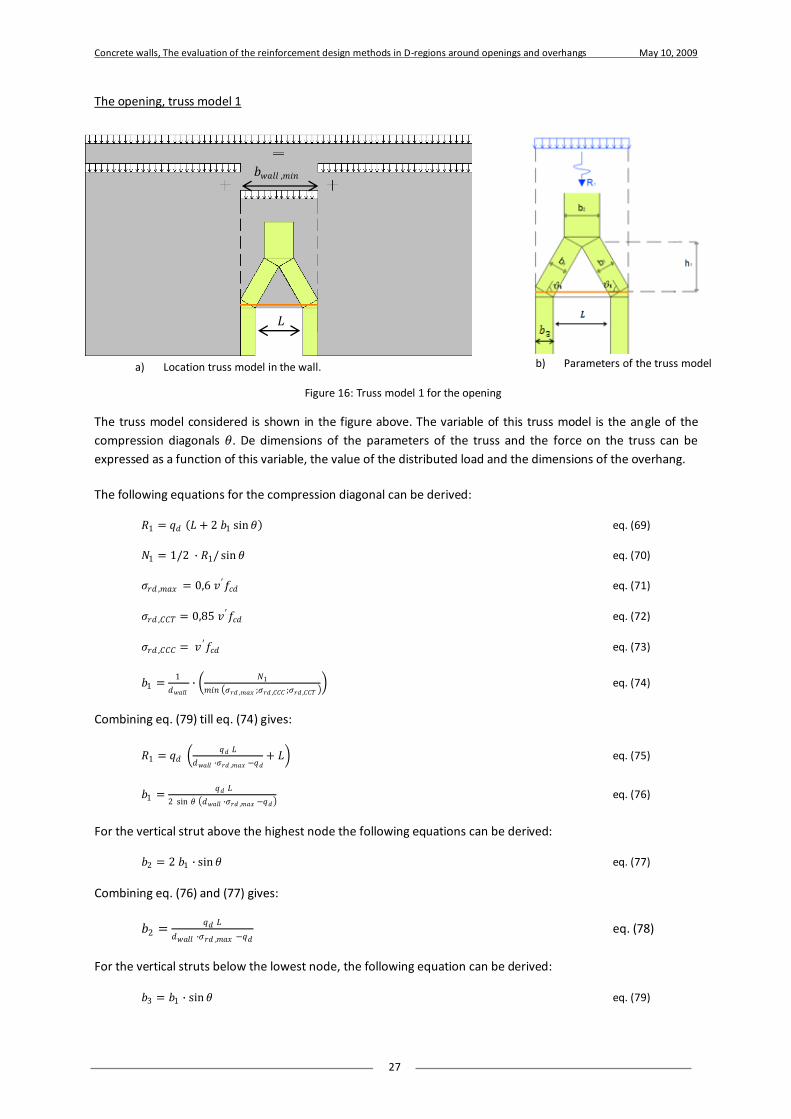
The opening, truss model 1
The truss model considered is shown in the figure above. The variable of this truss model is the angle of the
compression diagonals 𝜃. De dimensions of the parameters of the truss and the force on the truss can be
expressed as a function of this variable, the value of the distributed load and the dimensions of the overhang.
The following equations for the compression diagonal can be derived:
𝑅1 = 𝑞𝑑 𝐿 + 2 𝑏1 sin𝜃 eq. (69)
𝑁1 = 1/2 ∙ 𝑅1/ sin𝜃 eq. (70)
𝜎𝑟𝑑 ,𝑚𝑎𝑥 = 0,6 𝑣 ′𝑓𝑐𝑑 eq. (71)
𝜎𝑟𝑑 ,𝐶𝐶𝑇 = 0,85 𝑣 ′𝑓𝑐𝑑 eq. (72)
𝜎𝑟𝑑 ,𝐶𝐶𝐶 = 𝑣 ′𝑓𝑐𝑑 eq. (73)
𝑏1 =1
𝑑𝑤𝑎𝑙𝑙∙
𝑁1
𝑚𝑖𝑛 𝜎𝑟𝑑 ,𝑚𝑎𝑥 ;𝜎𝑟𝑑 ,𝐶𝐶𝐶 ;𝜎𝑟𝑑 ,𝐶𝐶𝑇 eq. (74)
Combining eq. (79) till eq. (74) gives:
𝑅1 = 𝑞𝑑 𝑞𝑑 𝐿
𝑑𝑤𝑎𝑙𝑙 ∙𝜎𝑟𝑑 ,𝑚𝑎𝑥 −𝑞𝑑+ 𝐿 eq. (75)
𝑏1 = 𝑞𝑑 𝐿
2 sin 𝜃 𝑑𝑤𝑎𝑙𝑙 ∙𝜎𝑟𝑑 ,𝑚𝑎𝑥 −𝑞𝑑 eq. (76)
For the vertical strut above the highest node the following equations can be derived:
𝑏2 = 2 𝑏1 ∙ sin𝜃 eq. (77)
Combining eq. (76) and (77) gives:
𝑏2 =𝑞𝑑 𝐿
𝑑𝑤𝑎𝑙𝑙 ∙𝜎𝑟𝑑 ,𝑚𝑎𝑥 −𝑞𝑑 eq. (78)
For the vertical struts below the lowest node, the following equation can be derived:
𝑏3 = 𝑏1 ∙ sin𝜃 eq. (79)
a) Location truss model in the wall.
𝑏𝑤𝑎𝑙𝑙 ,𝑚𝑖𝑛
𝐿
Figure 16: Truss model 1 for the opening
b) Parameters of the truss model
Concrete walls, The evaluation of the reinforcement design methods in D-regions around openings and overhangs May 10, 2009
28
Combining eq. (76) and (79) gives:
𝑏3 =𝑞𝑑 𝐿
2 𝑑𝑤𝑎𝑙𝑙 ∙𝜎𝑟𝑑 ,𝑚𝑎𝑥 −𝑞𝑑 eq. (80)
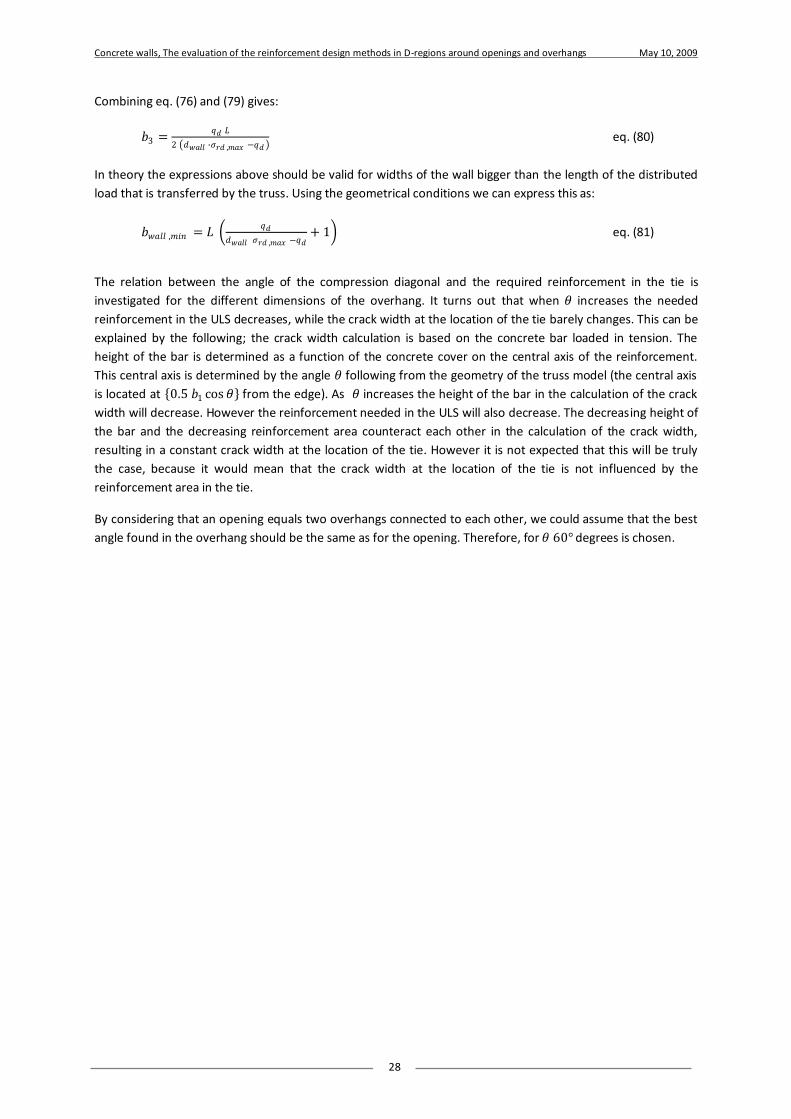
In theory the expressions above should be valid for widths of the wall bigger than the length of the distributed
load that is transferred by the truss. Using the geometrical conditions we can express this as:
𝑏𝑤𝑎𝑙𝑙 ,𝑚𝑖𝑛 = 𝐿 𝑞𝑑
𝑑𝑤𝑎𝑙𝑙 𝜎𝑟𝑑 ,𝑚𝑎𝑥 −𝑞𝑑+ 1 eq. (81)
The relation between the angle of the compression diagonal and the required reinforcement in the tie is
investigated for the different dimensions of the overhang. It turns out that when 𝜃 increases the needed
reinforcement in the ULS decreases, while the crack width at the location of the tie barely changes. This can be
explained by the following; the crack width calculation is based on the concrete bar loaded in tension. The
height of the bar is determined as a function of the concrete cover on the central axis of the reinforcement.
This central axis is determined by the angle 𝜃 following from the geometry of the truss model (the central axis
is located at 0.5 𝑏1 cos 𝜃 from the edge). As 𝜃 increases the height of the bar in the calculation of the crack
width will decrease. However the reinforcement needed in the ULS will also decrease. The decreasing height of
the bar and the decreasing reinforcement area counteract each other in the calculation of the crack width,
resulting in a constant crack width at the location of the tie. However it is not expected that this will be truly
the case, because it would mean that the crack width at the location of the tie is not influenced by the
reinforcement area in the tie.
By considering that an opening equals two overhangs connected to each other, we could assume that the best
angle found in the overhang should be the same as for the opening. Therefore, for 𝜃 60° degrees is chosen.
Concrete walls, The evaluation of the reinforcement design methods in D-regions around openings and overhangs May 10, 2009
29
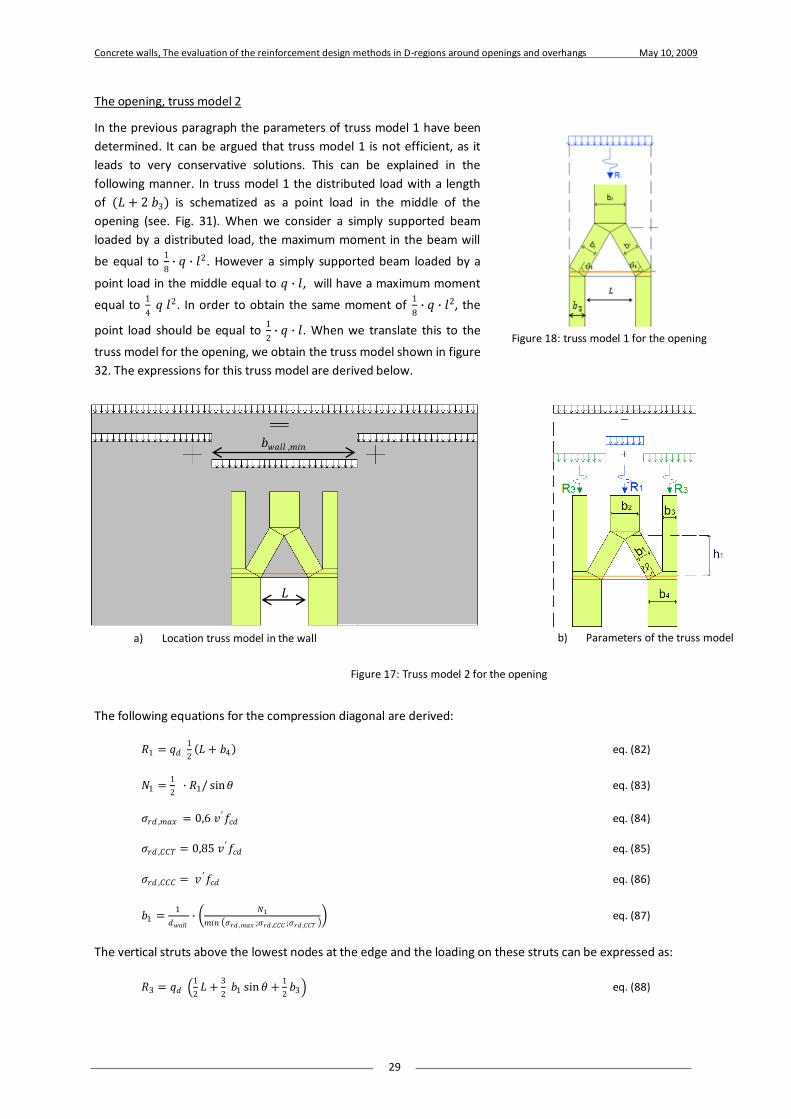
The opening, truss model 2
In the previous paragraph the parameters of truss model 1 have been
determined. It can be argued that truss model 1 is not efficient, as it
leads to very conservative solutions. This can be explained in the
following manner. In truss model 1 the distributed load with a length
of (𝐿 + 2 𝑏3) is schematized as a point load in the middle of the
opening (see. Fig. 31). When we consider a simply supported beam
loaded by a distributed load, the maximum moment in the beam will
be equal to 1
8∙ 𝑞 ∙ 𝑙2. However a simply supported beam loaded by a
point load in the middle equal to 𝑞 ∙ 𝑙, will have a maximum moment
equal to 1
4 𝑞 𝑙2. In order to obtain the same moment of
1
8∙ 𝑞 ∙ 𝑙2, the
point load should be equal to 1
2∙ 𝑞 ∙ 𝑙. When we translate this to the
truss model for the opening, we obtain the truss model shown in figure
32. The expressions for this truss model are derived below.
The following equations for the compression diagonal are derived:
𝑅1 = 𝑞𝑑 1
2 𝐿 + 𝑏4 eq. (82)
𝑁1 =1
2 ∙ 𝑅1/ sin𝜃 eq. (83)
𝜎𝑟𝑑 ,𝑚𝑎𝑥 = 0,6 𝑣 ′𝑓𝑐𝑑 eq. (84)
𝜎𝑟𝑑 ,𝐶𝐶𝑇 = 0,85 𝑣 ′𝑓𝑐𝑑 eq. (85)
𝜎𝑟𝑑 ,𝐶𝐶𝐶 = 𝑣 ′𝑓𝑐𝑑 eq. (86)
𝑏1 =1
𝑑𝑤𝑎𝑙𝑙∙
𝑁1
𝑚𝑖𝑛 𝜎𝑟𝑑 ,𝑚𝑎𝑥 ;𝜎𝑟𝑑 ,𝐶𝐶𝐶 ;𝜎𝑟𝑑 ,𝐶𝐶𝑇 eq. (87)
The vertical struts above the lowest nodes at the edge and the loading on these struts can be expressed as:
𝑅3 = 𝑞𝑑 1
2𝐿 +
3
2 𝑏1 sin𝜃 +
1
2𝑏3 eq. (88)
Figure 18: truss model 1 for the opening
b) Parameters of the truss model
a) Location truss model in the wall
𝑏𝑤𝑎𝑙𝑙 ,𝑚𝑖𝑛
𝐿
Figure 17: Truss model 2 for the opening
Concrete walls, The evaluation of the reinforcement design methods in D-regions around openings and overhangs May 10, 2009
30
𝑁3 = 𝑅3 eq. (89)
𝜎𝑟𝑑 ,𝑚𝑎𝑥 = 0,6 𝑣 ′𝑓𝑐𝑑 eq. (90)
𝜎𝑟𝑑 ,𝐶𝐶𝑇 = 0,85 𝑣 ′𝑓𝑐𝑑 eq. (91)
𝜎𝑟𝑑 ,𝐶𝐶𝐶 = 𝑣 ′𝑓𝑐𝑑 eq. (92)
𝑏3 =1
𝑑𝑤𝑎𝑙𝑙∙
𝑁3
𝑚𝑖𝑛 𝜎𝑟𝑑 ,𝑚𝑎𝑥 ;𝜎𝑟𝑑 ,𝐶𝐶𝐶 ;𝜎𝑟𝑑 ,𝐶𝐶𝑇 eq. (93)
The vertical struts below the lowest nodes at the edge can be expressed as:
𝑏4 = 𝑏1 sin𝜃 + 𝑏3 eq. (94)
Combining eq. (82) till eq. (94) gives:
𝑅1 = 2 𝑞𝑑 𝐿 𝑑𝑤𝑎𝑙𝑙 ∙𝜎𝑟𝑑 ,𝑚𝑎𝑥
2
𝑑𝑤𝑎𝑙𝑙 ∙𝜎𝑟𝑑 ,𝑚𝑎𝑥 −𝑞𝑑 4 𝑑𝑤𝑎𝑙𝑙 ∙𝜎𝑟𝑑 ,𝑚𝑎𝑥 +𝑞𝑑 eq. (95)
𝑏1 = 𝑞𝑑 𝐿 𝑑𝑤𝑎𝑙𝑙 ∙𝜎𝑟𝑑 ,𝑚𝑎𝑥
sin 𝜃 𝑑𝑤𝑎𝑙𝑙 ∙𝜎𝑟𝑑 ,𝑚𝑎𝑥 −𝑞𝑑 4 𝑑𝑤𝑎𝑙𝑙 ∙𝜎𝑟𝑑 ,𝑚𝑎𝑥 +𝑞𝑑 eq. (96)
𝑅3 = 𝑞𝑑 𝐿 𝑑𝑤𝑎𝑙𝑙 ∙𝜎𝑟𝑑 ,𝑚𝑎𝑥 (2 𝑑𝑤𝑎𝑙𝑙 ∙𝜎𝑟𝑑 ,𝑚𝑎𝑥 +𝑞𝑑)
𝑑𝑤𝑎𝑙𝑙 ∙𝜎𝑟𝑑 ,𝑚𝑎𝑥 −𝑞𝑑 4 𝑑𝑤𝑎𝑙𝑙 ∙𝜎𝑟𝑑 ,𝑚𝑎𝑥 +𝑞𝑑 eq. (97)
𝑏3 = 𝑞𝑑 𝐿 (2 𝑑𝑤𝑎𝑙𝑙 ∙𝜎𝑟𝑑 ,𝑚𝑎𝑥 +𝑞𝑑)
𝑑𝑤𝑎𝑙𝑙 ∙𝜎𝑟𝑑 ,𝑚𝑎𝑥 −𝑞𝑑 4 𝑑𝑤𝑎𝑙𝑙 ∙𝜎𝑟𝑑 ,𝑚𝑎𝑥 +𝑞𝑑 eq. (98)
𝑏4 = 𝑞𝑑 𝐿 (3 𝑑𝑤𝑎𝑙𝑙∙𝜎𝑟𝑑,𝑚𝑎𝑥+𝑞𝑑)
𝑑𝑤𝑎𝑙𝑙∙𝜎𝑟𝑑,𝑚𝑎𝑥−𝑞𝑑 4 𝑑𝑤𝑎𝑙𝑙∙𝜎𝑟𝑑,𝑚𝑎𝑥+𝑞𝑑 eq. (99)
The vertical strut above the highest node in the middle can be expressed as:
𝑏2 = 2 𝑏1 sin𝜃 eq. (100)
Combining eq. (96) and (100) gives:
𝑏2 = 2 𝑞𝑑
𝐿 𝑑𝑤𝑎𝑙𝑙∙𝜎𝑟𝑑,𝑚𝑎𝑥
𝑑𝑤𝑎𝑙𝑙∙𝜎𝑟𝑑,𝑚𝑎𝑥−𝑞𝑑 4 𝑑𝑤𝑎𝑙𝑙∙𝜎𝑟𝑑,𝑚𝑎𝑥+𝑞𝑑 eq. (101)
In theory the expressions above should be valid for widths of the wall bigger than the length of the distributed
load that is transferred by the truss. Using the geometrical conditions this is expressed as:
𝑏𝑤𝑎𝑙𝑙 ,𝑚𝑖𝑛 = 2 𝐿 𝑑𝑤𝑎𝑙𝑙∙𝜎𝑟𝑑,𝑚𝑎𝑥 (3 𝑑𝑤𝑎𝑙𝑙∙𝜎𝑟𝑑,𝑚𝑎𝑥+𝑞𝑑)
𝑑𝑤𝑎𝑙𝑙∙𝜎𝑟𝑑,𝑚𝑎𝑥−𝑞𝑑 4 𝑑𝑤𝑎𝑙𝑙∙𝜎𝑟𝑑,𝑚𝑎𝑥+𝑞𝑑 eq. (102)

Concrete walls, The evaluation of the reinforcement design methods in D-regions around openings and overhangs May 10, 2009
31
The opening, truss model 3
The truss model considered is shown in the figure above. The variable of this truss model is the angle of the
compression diagonals 𝜃. The dimensions of other parameters of the truss and the resultant of the load on the
truss can be expressed as a function of this variable, the value of the distributed load and the dimensions of
the overhang.
The following equation for the compression diagonal can be derived:
𝑅1 =1
2𝑞𝑑 𝐿+ 𝑏4 eq. (103)
𝑁1 = 1/4 ∙ 𝑅1/ sin𝜃 eq. (104)
𝜎𝑟𝑑 ,𝑚𝑎𝑥 = 0,6 𝑣 ′𝑓𝑐𝑑 eq. (105)
𝜎𝑟𝑑 ,𝐶𝐶𝑇 = 0,85 𝑣 ′𝑓𝑐𝑑 eq. (106)
𝜎𝑟𝑑 ,𝐶𝐶𝐶 = 𝑣 ′𝑓𝑐𝑑 eq. (107)
𝑏1 =1
𝑑𝑤𝑎𝑙𝑙∙
𝑁1
𝑚𝑖𝑛 𝜎𝑟𝑑 ,𝑚𝑎𝑥 ;𝜎𝑟𝑑 ,𝐶𝐶𝐶 ;𝜎𝑟𝑑 ,𝐶𝐶𝑇 eq. (108)
For the vertical struts below the lowest nodes at the edge, the following equation can be derived:
𝑏4 = 2 𝑏1 ∙ sin𝜃 + 𝑏5 eq. (109)
For the vertical struts above the highest nodes at the edge of the truss, the following equations can be derived:
𝑅5 = 2 𝑞𝑑 1
2𝐿 + 𝑏4 −
1
2𝑏5 −
1
2
𝑅1
𝑞𝑑 eq. (110)
𝑁5 = 𝑅5 eq. (111)
𝜎𝑟𝑑 ,𝑚𝑎𝑥 = 0,6 𝑣 ′𝑓𝑐𝑑 eq. (112)
𝜎𝑟𝑑 ,𝐶𝐶𝑇 = 0,85 𝑣 ′𝑓𝑐𝑑 eq. (113)
𝜎𝑟𝑑 ,𝐶𝐶𝐶 = 𝑣 ′𝑓𝑐𝑑 eq. (114)
𝑏5 =1
𝑑𝑤𝑎𝑙𝑙∙
𝑁5
𝑚𝑖𝑛 𝜎𝑟𝑑 ,𝑚𝑎𝑥 ;𝜎𝑟𝑑 ,𝐶𝐶𝐶 ;𝜎𝑟𝑑 ,𝐶𝐶𝑇 eq. (115)
a) Location truss model in wall
𝑏𝑤𝑎𝑙𝑙 ,𝑚𝑖𝑛
𝐿
Figure 19: Truss model 3 for the opening
b) Parameters of the truss model
Concrete walls, The evaluation of the reinforcement design methods in D-regions around openings and overhangs May 10, 2009
32
Combining eq. (103) and (115) gives:
𝑅1 = 2 𝑞𝑑 𝐿 𝑑𝑤𝑎𝑙𝑙 ∙𝜎𝑟𝑑 ,𝑚𝑎𝑥
2
𝑑𝑤𝑎𝑙𝑙 ∙𝜎𝑟𝑑 ,𝑚𝑎𝑥 −𝑞𝑑 4 𝑑𝑤𝑎𝑙𝑙 ∙𝜎𝑟𝑑 ,𝑚𝑎𝑥 +𝑞𝑑 eq. (116)
𝑏1 =1
2 𝑞𝑑 𝐿
𝑑𝑤𝑎𝑙𝑙 ∙𝜎𝑟𝑑 ,𝑚𝑎𝑥
sin 𝜃 𝑑𝑤𝑎𝑙𝑙 ∙𝜎𝑟𝑑 ,𝑚𝑎𝑥 −𝑞𝑑 4 𝑑𝑤𝑎𝑙𝑙 ∙𝜎𝑟𝑑 ,𝑚𝑎𝑥 +𝑞𝑑 eq. (117)
𝑏4 = 𝑞𝑑 𝐿 (3 𝑑𝑤𝑎𝑙𝑙∙𝜎𝑟𝑑,𝑚𝑎𝑥+𝑞𝑑)
𝑑𝑤𝑎𝑙𝑙∙𝜎𝑟𝑑,𝑚𝑎𝑥−𝑞𝑑 4 𝑑𝑤𝑎𝑙𝑙∙𝜎𝑟𝑑,𝑚𝑎𝑥+𝑞𝑑 eq. (118)
𝑅5 = 𝑞𝑑 𝐿 𝑑𝑤𝑎𝑙𝑙 ∙𝜎𝑟𝑑 ,𝑚𝑎𝑥 (2 𝑑𝑤𝑎𝑙𝑙 ∙𝜎𝑟𝑑 ,𝑚𝑎𝑥 +𝑞𝑑)
𝑑𝑤𝑎𝑙𝑙 ∙𝜎𝑟𝑑 ,𝑚𝑎𝑥 −𝑞𝑑 4 𝑑𝑤𝑎𝑙𝑙 ∙𝜎𝑟𝑑 ,𝑚𝑎𝑥 +𝑞𝑑 eq. (119)
𝑏5 = 𝑞𝑑 𝐿 (2 𝑑𝑤𝑎𝑙𝑙 ∙𝜎𝑟𝑑 ,𝑚𝑎𝑥 +𝑞𝑑)
𝑑𝑤𝑎𝑙𝑙 ∙𝜎𝑟𝑑 ,𝑚𝑎𝑥 −𝑞𝑑 4 𝑑𝑤𝑎𝑙𝑙 ∙𝜎𝑟𝑑 ,𝑚𝑎𝑥 +𝑞𝑑 eq. (120)
For the vertical strut above the lowest middle node, the following equation can be derived:
𝑏2 = 2 𝑏1 ∙ sin𝜃 eq. (121)
Combining eq. (117) and (121) gives:
𝑏2 = 𝑞𝑑
𝐿 𝑑𝑤𝑎𝑙𝑙∙𝜎𝑟𝑑,𝑚𝑎𝑥
𝑑𝑤𝑎𝑙𝑙∙𝜎𝑟𝑑,𝑚𝑎𝑥−𝑞𝑑 4 𝑑𝑤𝑎𝑙𝑙∙𝜎𝑟𝑑,𝑚𝑎𝑥+𝑞𝑑 eq. (122)
For the vertical strut above the highest middle node, the following equation can be derived:
𝑏3 = 𝑏2 + 2 𝑏1 ∙ sin𝜃 eq. (123)
Combining eq. (117), (122) and (123) gives:
𝑏3 = 2 𝑞𝑑 𝐿 𝑑𝑤𝑎𝑙𝑙 ∙𝜎𝑟𝑑 ,𝑚𝑎𝑥
𝑑𝑤𝑎𝑙𝑙 ∙𝜎𝑟𝑑 ,𝑚𝑎𝑥 −𝑞𝑑 4 𝑑𝑤𝑎𝑙𝑙 ∙𝜎𝑟𝑑 ,𝑚𝑎𝑥 +𝑞𝑑 eq. (124)
In theory the expressions above should be valid for widths of the wall bigger than the length of the distributed
load that is transferred by the truss. Using the geometrical conditions this can be expressed as:
𝑏𝑤𝑎𝑙𝑙 ,𝑚𝑖𝑛 = 2 𝐿 𝑑𝑤𝑎𝑙𝑙 ∙𝜎𝑟𝑑,𝑚𝑎𝑥 (3 𝑑𝑤𝑎𝑙𝑙∙𝜎𝑟𝑑,𝑚𝑎𝑥+𝑞𝑑)
𝑑𝑤𝑎𝑙𝑙∙𝜎𝑟𝑑,𝑚𝑎𝑥−𝑞𝑑 4 𝑑𝑤𝑎𝑙𝑙∙𝜎𝑟𝑑,𝑚𝑎𝑥+𝑞𝑑 eq. (125)
In the same way as for truss model 1, the best value of 𝜃 cannot be based on the crack width calculation.
Therefore the same procedure as truss model 1 is followed and 𝜃 is chosen equal to 60°.
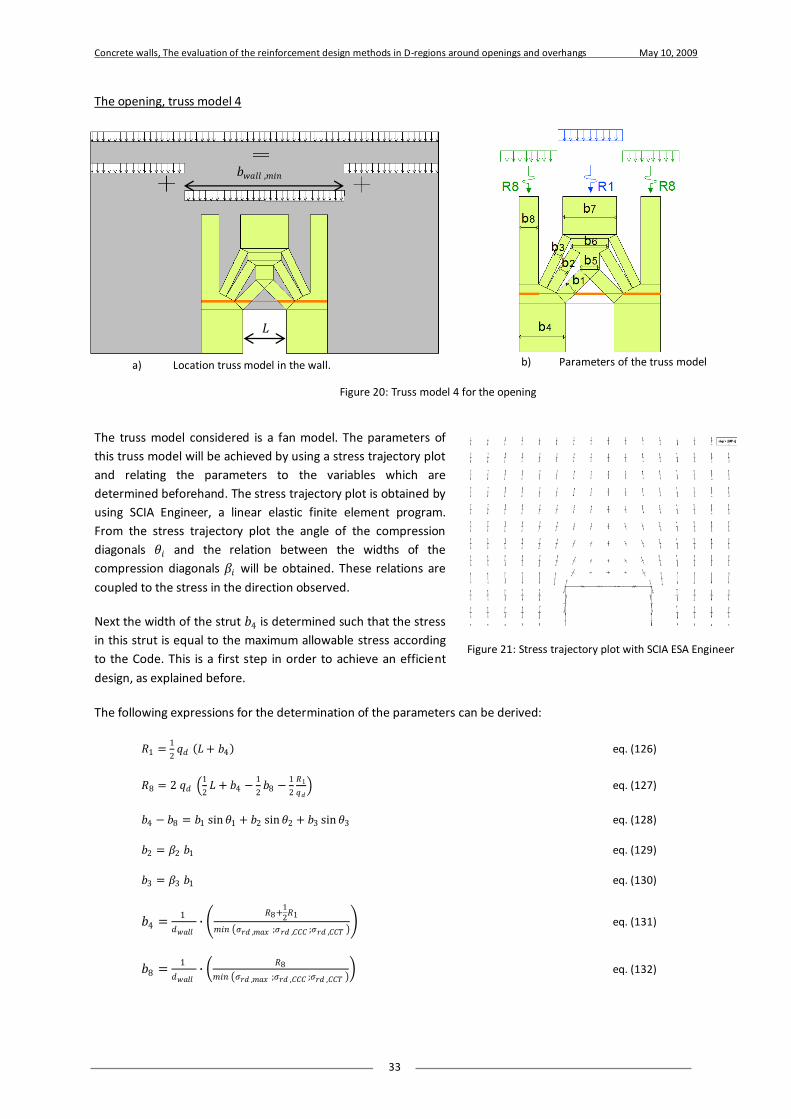
Concrete walls, The evaluation of the reinforcement design methods in D-regions around openings and overhangs May 10, 2009
33
The opening, truss model 4
The truss model considered is a fan model. The parameters of
this truss model will be achieved by using a stress trajectory plot
and relating the parameters to the variables which are
determined beforehand. The stress trajectory plot is obtained by
using SCIA Engineer, a linear elastic finite element program.
From the stress trajectory plot the angle of the compression
diagonals 𝜃𝑖 and the relation between the widths of the
compression diagonals 𝛽𝑖 will be obtained. These relations are
coupled to the stress in the direction observed.
Next the width of the strut 𝑏4 is determined such that the stress
in this strut is equal to the maximum allowable stress according
to the Code. This is a first step in order to achieve an efficient
design, as explained before.
The following expressions for the determination of the parameters can be derived:
𝑅1 =1
2𝑞𝑑 𝐿+ 𝑏4 eq. (126)
𝑅8 = 2 𝑞𝑑 1
2𝐿 + 𝑏4 −
1
2𝑏8 −
1
2
𝑅1
𝑞𝑑 eq. (127)
𝑏4 − 𝑏8 = 𝑏1 sin𝜃1 + 𝑏2 sin𝜃2 + 𝑏3 sin𝜃3 eq. (128)
𝑏2 = 𝛽2 𝑏1 eq. (129)
𝑏3 = 𝛽3 𝑏1 eq. (130)
𝑏4 =1
𝑑𝑤𝑎𝑙𝑙∙
𝑅8+1
2𝑅1
𝑚𝑖𝑛 𝜎𝑟𝑑 ,𝑚𝑎𝑥 ;𝜎𝑟𝑑 ,𝐶𝐶𝐶 ;𝜎𝑟𝑑 ,𝐶𝐶𝑇 eq. (131)
𝑏8 =1
𝑑𝑤𝑎𝑙𝑙∙
𝑅8
𝑚𝑖𝑛 𝜎𝑟𝑑 ,𝑚𝑎𝑥 ;𝜎𝑟𝑑 ,𝐶𝐶𝐶 ;𝜎𝑟𝑑 ,𝐶𝐶𝑇 eq. (132)
Figure 21: Stress trajectory plot with SCIA ESA Engineer
a) Location truss model in the wall.
𝑏𝑤𝑎𝑙𝑙 ,𝑚𝑖𝑛
𝐿
Figure 20: Truss model 4 for the opening
b) Parameters of the truss model
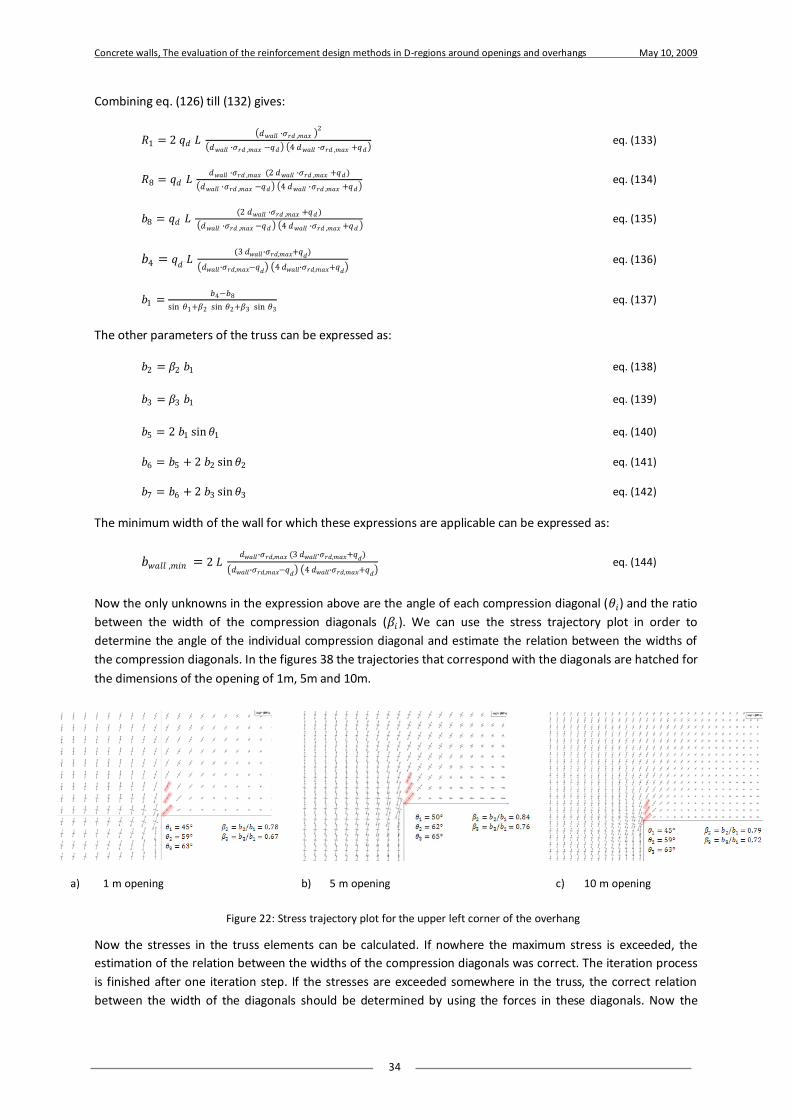
Concrete walls, The evaluation of the reinforcement design methods in D-regions around openings and overhangs May 10, 2009
34
Combining eq. (126) till (132) gives:
𝑅1 = 2 𝑞𝑑 𝐿 𝑑𝑤𝑎𝑙𝑙 ∙𝜎𝑟𝑑 ,𝑚𝑎𝑥
2
𝑑𝑤𝑎𝑙𝑙 ∙𝜎𝑟𝑑 ,𝑚𝑎𝑥 −𝑞𝑑 4 𝑑𝑤𝑎𝑙𝑙 ∙𝜎𝑟𝑑 ,𝑚𝑎𝑥 +𝑞𝑑 eq. (133)
𝑅8 = 𝑞𝑑 𝐿 𝑑𝑤𝑎𝑙𝑙 ∙𝜎𝑟𝑑 ,𝑚𝑎𝑥 (2 𝑑𝑤𝑎𝑙𝑙 ∙𝜎𝑟𝑑 ,𝑚𝑎𝑥 +𝑞𝑑)
𝑑𝑤𝑎𝑙𝑙 ∙𝜎𝑟𝑑 ,𝑚𝑎𝑥 −𝑞𝑑 4 𝑑𝑤𝑎𝑙𝑙 ∙𝜎𝑟𝑑 ,𝑚𝑎𝑥 +𝑞𝑑 eq. (134)
𝑏8 = 𝑞𝑑 𝐿 (2 𝑑𝑤𝑎𝑙𝑙 ∙𝜎𝑟𝑑 ,𝑚𝑎𝑥 +𝑞𝑑)
𝑑𝑤𝑎𝑙𝑙 ∙𝜎𝑟𝑑 ,𝑚𝑎𝑥 −𝑞𝑑 4 𝑑𝑤𝑎𝑙𝑙 ∙𝜎𝑟𝑑 ,𝑚𝑎𝑥 +𝑞𝑑 eq. (135)
𝑏4 = 𝑞𝑑 𝐿 (3 𝑑𝑤𝑎𝑙𝑙∙𝜎𝑟𝑑,𝑚𝑎𝑥+𝑞𝑑)
𝑑𝑤𝑎𝑙𝑙∙𝜎𝑟𝑑,𝑚𝑎𝑥−𝑞𝑑 4 𝑑𝑤𝑎𝑙𝑙∙𝜎𝑟𝑑,𝑚𝑎𝑥+𝑞𝑑 eq. (136)
𝑏1 =𝑏4−𝑏8
sin 𝜃1+𝛽2 sin 𝜃2+𝛽3 sin 𝜃3 eq. (137)
The other parameters of the truss can be expressed as:
𝑏2 = 𝛽2 𝑏1 eq. (138)
𝑏3 = 𝛽3 𝑏1 eq. (139)
𝑏5 = 2 𝑏1 sin𝜃1 eq. (140)
𝑏6 = 𝑏5 + 2 𝑏2 sin𝜃2 eq. (141)
𝑏7 = 𝑏6 + 2 𝑏3 sin𝜃3 eq. (142)
The minimum width of the wall for which these expressions are applicable can be expressed as:
𝑏𝑤𝑎𝑙𝑙 ,𝑚𝑖𝑛 = 2 𝐿 𝑑𝑤𝑎𝑙𝑙∙𝜎𝑟𝑑,𝑚𝑎𝑥 (3 𝑑𝑤𝑎𝑙𝑙∙𝜎𝑟𝑑,𝑚𝑎𝑥+𝑞
𝑑)
𝑑𝑤𝑎𝑙𝑙∙𝜎𝑟𝑑,𝑚𝑎𝑥−𝑞𝑑 4 𝑑𝑤𝑎𝑙𝑙∙𝜎𝑟𝑑,𝑚𝑎𝑥+𝑞𝑑 eq. (144)
Now the only unknowns in the expression above are the angle of each compression diagonal (𝜃𝑖) and the ratio
between the width of the compression diagonals (𝛽𝑖 ). We can use the stress trajectory plot in order to
determine the angle of the individual compression diagonal and estimate the relation between the widths of
the compression diagonals. In the figures 38 the trajectories that correspond with the diagonals are hatched for
the dimensions of the opening of 1m, 5m and 10m.
Now the stresses in the truss elements can be calculated. If nowhere the maximum stress is exceeded, the
estimation of the relation between the widths of the compression diagonals was correct. The iteration process
is finished after one iteration step. If the stresses are exceeded somewhere in the truss, the correct relation
between the width of the diagonals should be determined by using the forces in these diagonals. Now the
a) 1 m opening b) 5 m opening c) 10 m opening
Figure 22: Stress trajectory plot for the upper left corner of the overhang
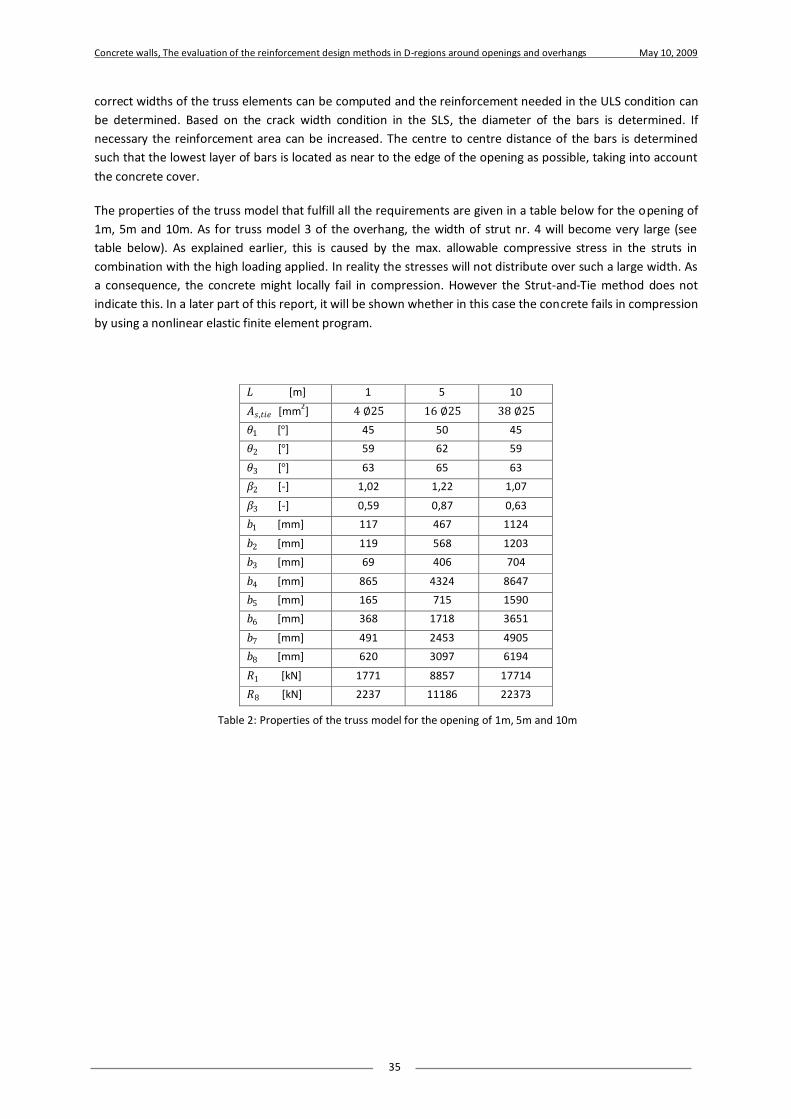
Concrete walls, The evaluation of the reinforcement design methods in D-regions around openings and overhangs May 10, 2009
35
correct widths of the truss elements can be computed and the reinforcement needed in the ULS condition can
be determined. Based on the crack width condition in the SLS, the diameter of the bars is determined. If
necessary the reinforcement area can be increased. The centre to centre distance of the bars is determined
such that the lowest layer of bars is located as near to the edge of the opening as possible, taking into account
the concrete cover.
The properties of the truss model that fulfill all the requirements are given in a table below for the opening of
1m, 5m and 10m. As for truss model 3 of the overhang, the width of strut nr. 4 will become very large (see
table below). As explained earlier, this is caused by the max. allowable compressive stress in the struts in
combination with the high loading applied. In reality the stresses will not distribute over such a large width. As
a consequence, the concrete might locally fail in compression. However the Strut-and-Tie method does not
indicate this. In a later part of this report, it will be shown whether in this case the concrete fails in compression
by using a nonlinear elastic finite element program.
𝐿 [m] 1 5 10
𝐴𝑠,𝑡𝑖𝑒 [mm2] 4 ∅25 16 ∅25 38 ∅25
𝜃1 [°] 45 50 45
𝜃2 [°] 59 62 59
𝜃3 [°] 63 65 63
𝛽2 [-] 1,02 1,22 1,07
𝛽3 [-] 0,59 0,87 0,63
𝑏1 [mm] 117 467 1124
𝑏2 [mm] 119 568 1203
𝑏3 [mm] 69 406 704
𝑏4 [mm] 865 4324 8647
𝑏5 [mm] 165 715 1590
𝑏6 [mm] 368 1718 3651
𝑏7 [mm] 491 2453 4905
𝑏8 [mm] 620 3097 6194
𝑅1 [kN] 1771 8857 17714
𝑅8 [kN] 2237 11186 22373
Table 2: Properties of the truss model for the opening of 1m, 5m and 10m
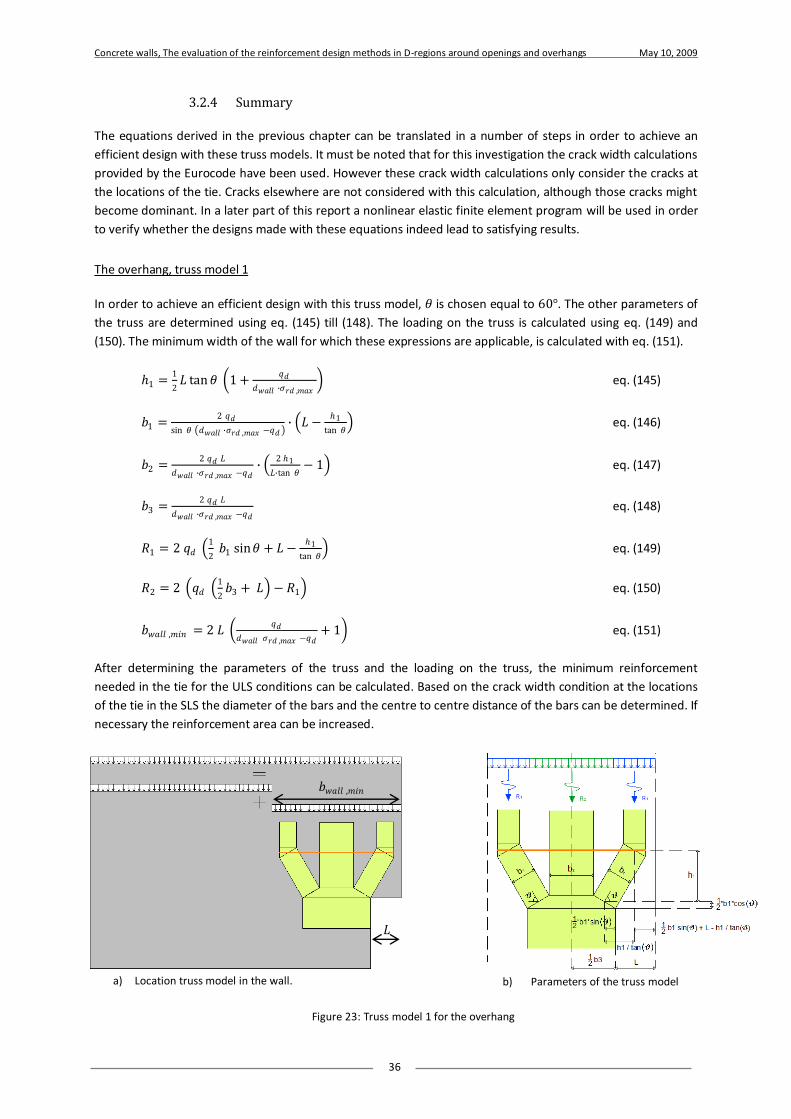
Concrete walls, The evaluation of the reinforcement design methods in D-regions around openings and overhangs May 10, 2009
36
3.2.4 Summary
The equations derived in the previous chapter can be translated in a number of steps in order to achieve an
efficient design with these truss models. It must be noted that for this investigation the crack width calculations
provided by the Eurocode have been used. However these crack width calculations only consider the cracks at
the locations of the tie. Cracks elsewhere are not considered with this calculation, although those cracks might
become dominant. In a later part of this report a nonlinear elastic finite element program will be used in order
to verify whether the designs made with these equations indeed lead to satisfying results.
The overhang, truss model 1
In order to achieve an efficient design with this truss model, 𝜃 is chosen equal to 60°. The other parameters of
the truss are determined using eq. (145) till (148). The loading on the truss is calculated using eq. (149) and
(150). The minimum width of the wall for which these expressions are applicable, is calculated with eq. (151).
1 =1
2𝐿 tan𝜃 1 +
𝑞𝑑
𝑑𝑤𝑎𝑙𝑙 ∙𝜎𝑟𝑑 ,𝑚𝑎𝑥 eq. (145)
𝑏1 =2 𝑞𝑑
sin 𝜃 𝑑𝑤𝑎𝑙𝑙 ∙𝜎𝑟𝑑 ,𝑚𝑎𝑥 −𝑞𝑑 ∙ 𝐿 −
1
tan 𝜃 eq. (146)
𝑏2 =2 𝑞𝑑 𝐿
𝑑𝑤𝑎𝑙𝑙 ∙𝜎𝑟𝑑 ,𝑚𝑎𝑥 −𝑞𝑑∙
2 1
𝐿∙tan 𝜃− 1 eq. (147)
𝑏3 =2 𝑞𝑑 𝐿
𝑑𝑤𝑎𝑙𝑙 ∙𝜎𝑟𝑑 ,𝑚𝑎𝑥 −𝑞𝑑 eq. (148)
𝑅1 = 2 𝑞𝑑 1
2 𝑏1 sin𝜃 + 𝐿 −
1
tan 𝜃 eq. (149)
𝑅2 = 2 𝑞𝑑 1
2𝑏3 + 𝐿 − 𝑅1 eq. (150)
𝑏𝑤𝑎𝑙𝑙 ,𝑚𝑖𝑛 = 2 𝐿 𝑞𝑑
𝑑𝑤𝑎𝑙𝑙 𝜎𝑟𝑑 ,𝑚𝑎𝑥 −𝑞𝑑+ 1 eq. (151)
After determining the parameters of the truss and the loading on the truss, the minimum reinforcement
needed in the tie for the ULS conditions can be calculated. Based on the crack width condition at the locations
of the tie in the SLS the diameter of the bars and the centre to centre distance of the bars can be determined. If
necessary the reinforcement area can be increased.
a) Location truss model in the wall.
𝑏𝑤𝑎𝑙𝑙 ,𝑚𝑖𝑛
𝐿
Figure 23: Truss model 1 for the overhang
b) Parameters of the truss model
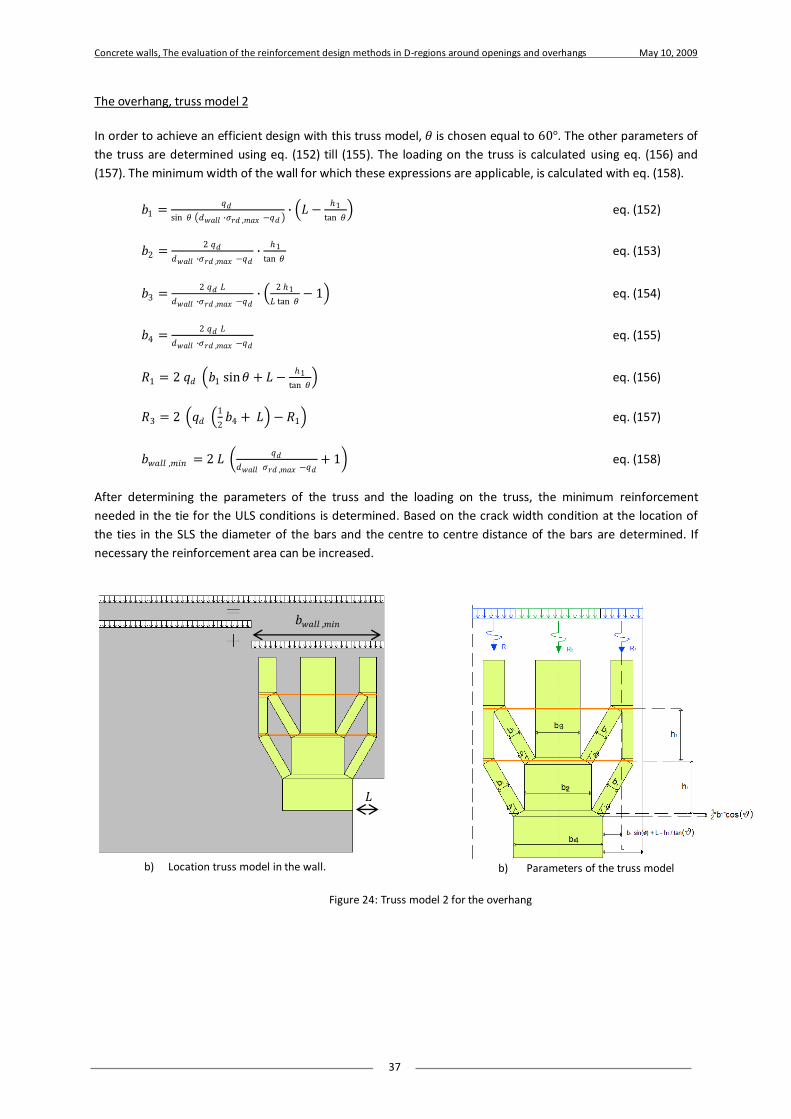
Concrete walls, The evaluation of the reinforcement design methods in D-regions around openings and overhangs May 10, 2009
37
The overhang, truss model 2
In order to achieve an efficient design with this truss model, 𝜃 is chosen equal to 60°. The other parameters of
the truss are determined using eq. (152) till (155). The loading on the truss is calculated using eq. (156) and
(157). The minimum width of the wall for which these expressions are applicable, is calculated with eq. (158).
𝑏1 =𝑞𝑑
sin 𝜃 𝑑𝑤𝑎𝑙𝑙 ∙𝜎𝑟𝑑 ,𝑚𝑎𝑥 −𝑞𝑑 ∙ 𝐿 −
1
tan 𝜃 eq. (152)
𝑏2 =2 𝑞𝑑
𝑑𝑤𝑎𝑙𝑙 ∙𝜎𝑟𝑑 ,𝑚𝑎𝑥 −𝑞𝑑∙
1
tan 𝜃 eq. (153)
𝑏3 =2 𝑞𝑑 𝐿
𝑑𝑤𝑎𝑙𝑙 ∙𝜎𝑟𝑑 ,𝑚𝑎𝑥 −𝑞𝑑∙
2 1
𝐿 tan 𝜃− 1 eq. (154)
𝑏4 =2 𝑞𝑑 𝐿
𝑑𝑤𝑎𝑙𝑙 ∙𝜎𝑟𝑑 ,𝑚𝑎𝑥 −𝑞𝑑 eq. (155)
𝑅1 = 2 𝑞𝑑 𝑏1 sin𝜃 + 𝐿 −1
tan 𝜃 eq. (156)
𝑅3 = 2 𝑞𝑑 1
2𝑏4 + 𝐿 − 𝑅1 eq. (157)
𝑏𝑤𝑎𝑙𝑙 ,𝑚𝑖𝑛 = 2 𝐿 𝑞𝑑
𝑑𝑤𝑎𝑙𝑙 𝜎𝑟𝑑 ,𝑚𝑎𝑥 −𝑞𝑑+ 1 eq. (158)
After determining the parameters of the truss and the loading on the truss, the minimum reinforcement
needed in the tie for the ULS conditions is determined. Based on the crack width condition at the location of
the ties in the SLS the diameter of the bars and the centre to centre distance of the bars are determined. If
necessary the reinforcement area can be increased.
Figure 24: Truss model 2 for the overhang
b) Location truss model in the wall.
𝑏𝑤𝑎𝑙𝑙 ,𝑚𝑖𝑛
𝐿
b) Parameters of the truss model
3
2
4
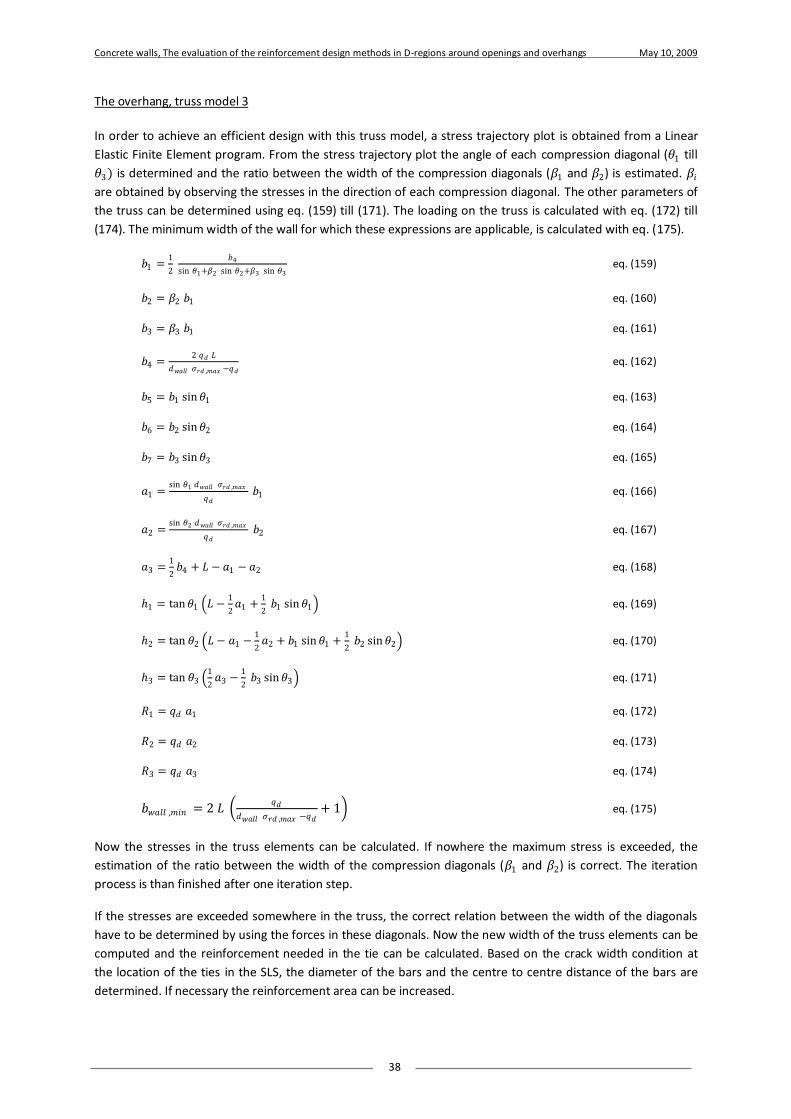
Concrete walls, The evaluation of the reinforcement design methods in D-regions around openings and overhangs May 10, 2009
38
The overhang, truss model 3
In order to achieve an efficient design with this truss model, a stress trajectory plot is obtained from a Linear
Elastic Finite Element program. From the stress trajectory plot the angle of each compression diagonal (𝜃1 till
𝜃3) is determined and the ratio between the width of the compression diagonals (𝛽1 and 𝛽2) is estimated. 𝛽𝑖
are obtained by observing the stresses in the direction of each compression diagonal. The other parameters of
the truss can be determined using eq. (159) till (171). The loading on the truss is calculated with eq. (172) till
(174). The minimum width of the wall for which these expressions are applicable, is calculated with eq. (175).
𝑏1 =1
2
𝑏4
sin 𝜃1+𝛽2 sin 𝜃2+𝛽3 sin 𝜃3 eq. (159)
𝑏2 = 𝛽2 𝑏1 eq. (160)
𝑏3 = 𝛽3 𝑏1 eq. (161)
𝑏4 =2 𝑞𝑑 𝐿
𝑑𝑤𝑎𝑙𝑙 𝜎𝑟𝑑 ,𝑚𝑎𝑥 −𝑞𝑑 eq. (162)
𝑏5 = 𝑏1 sin𝜃1 eq. (163)
𝑏6 = 𝑏2 sin𝜃2 eq. (164)
𝑏7 = 𝑏3 sin𝜃3 eq. (165)
𝑎1 =sin 𝜃1 𝑑𝑤𝑎𝑙𝑙 𝜎𝑟𝑑 ,𝑚𝑎𝑥
𝑞𝑑 𝑏1 eq. (166)
𝑎2 =sin 𝜃2 𝑑𝑤𝑎𝑙𝑙 𝜎𝑟𝑑 ,𝑚𝑎𝑥
𝑞𝑑 𝑏2 eq. (167)
𝑎3 =1
2𝑏4 + 𝐿 − 𝑎1 − 𝑎2 eq. (168)
1 = tan𝜃1 𝐿 −1
2𝑎1 +
1
2 𝑏1 sin𝜃1 eq. (169)
2 = tan 𝜃2 𝐿 − 𝑎1 −1
2𝑎2 + 𝑏1 sin𝜃1 +
1
2 𝑏2 sin𝜃2 eq. (170)
3 = tan 𝜃3 1
2𝑎3 −
1
2 𝑏3 sin𝜃3 eq. (171)
𝑅1 = 𝑞𝑑 𝑎1 eq. (172)
𝑅2 = 𝑞𝑑 𝑎2 eq. (173)
𝑅3 = 𝑞𝑑 𝑎3 eq. (174)
𝑏𝑤𝑎𝑙𝑙 ,𝑚𝑖𝑛 = 2 𝐿 𝑞𝑑
𝑑𝑤𝑎𝑙𝑙 𝜎𝑟𝑑 ,𝑚𝑎𝑥 −𝑞𝑑+ 1 eq. (175)
Now the stresses in the truss elements can be calculated. If nowhere the maximum stress is exceeded, the
estimation of the ratio between the width of the compression diagonals (𝛽1 and 𝛽2) is correct. The iteration
process is than finished after one iteration step.
If the stresses are exceeded somewhere in the truss, the correct relation between the width of the diagonals
have to be determined by using the forces in these diagonals. Now the new width of the truss elements can be
computed and the reinforcement needed in the tie can be calculated. Based on the crack width condition at
the location of the ties in the SLS, the diameter of the bars and the centre to centre distance of the bars are
determined. If necessary the reinforcement area can be increased.
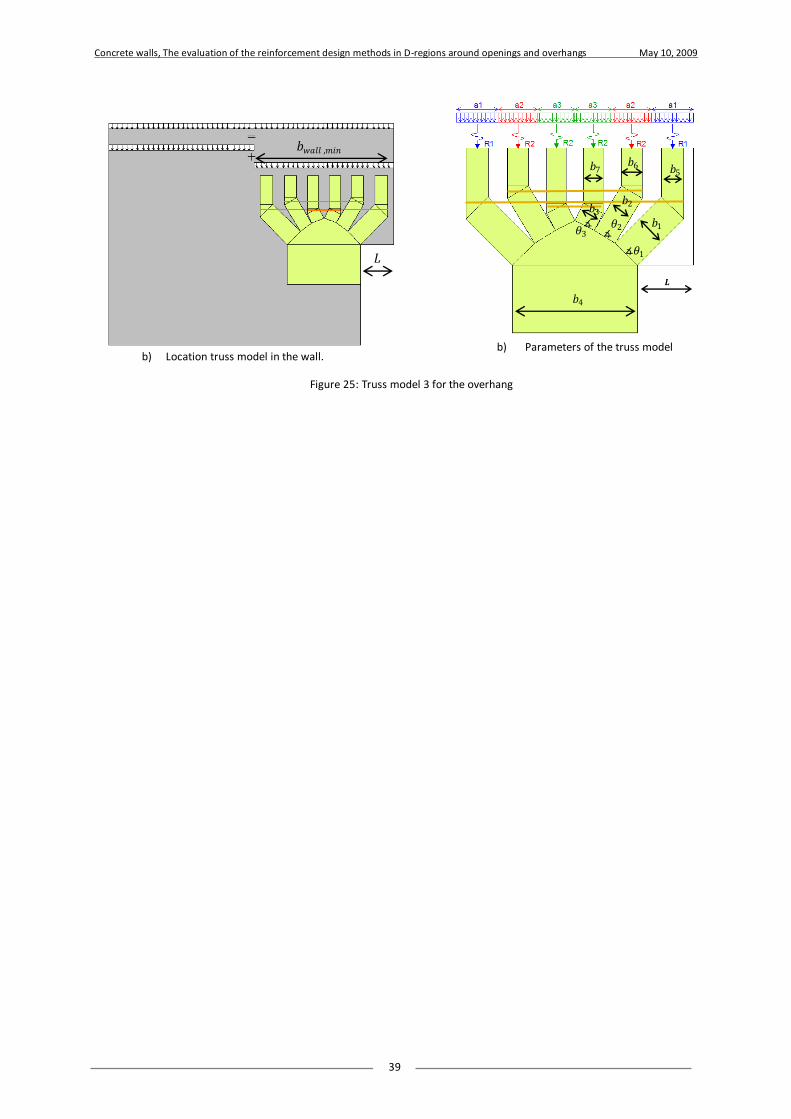
Concrete walls, The evaluation of the reinforcement design methods in D-regions around openings and overhangs May 10, 2009
39
b) Location truss model in the wall.
𝑏𝑤𝑎𝑙𝑙 ,𝑚𝑖𝑛
𝐿
Figure 25: Truss model 3 for the overhang
3 3
b) Parameters of the truss model
𝑏4
𝑏5 𝑏6 𝑏7
𝑳
𝑏1
𝑏2 𝑏3
∡𝜃1
∡ ∡ 𝜃3 𝜃2
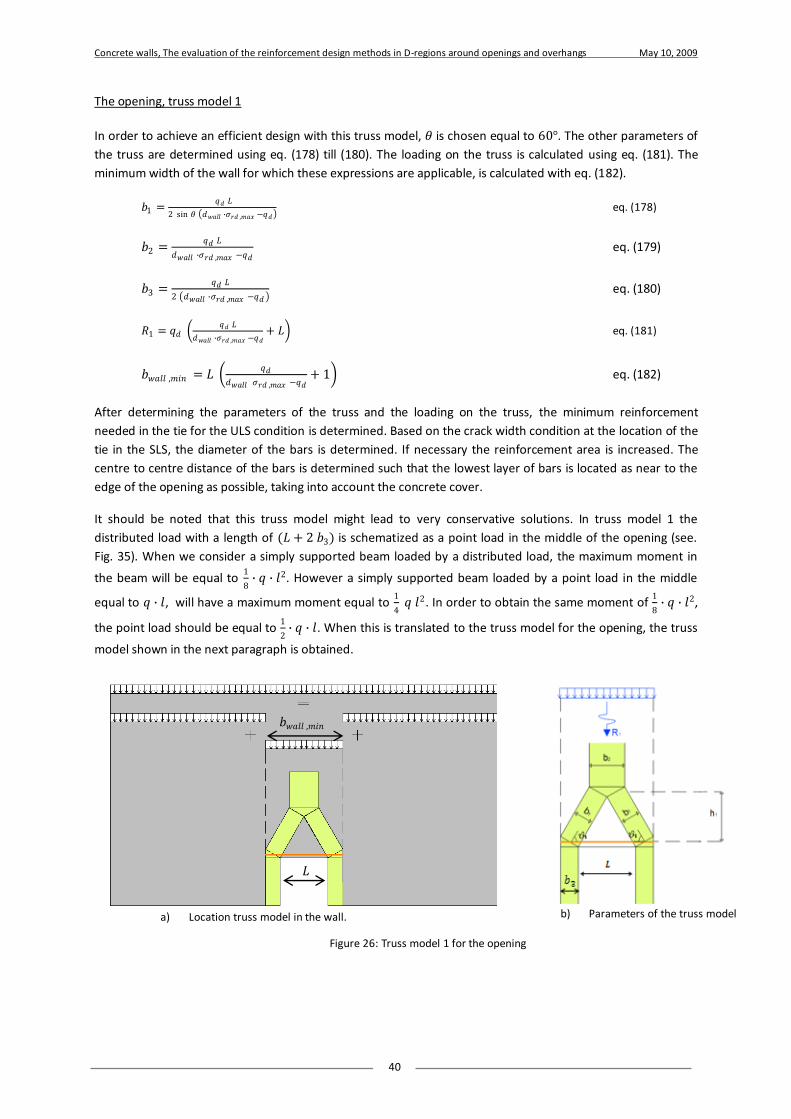
Concrete walls, The evaluation of the reinforcement design methods in D-regions around openings and overhangs May 10, 2009
40
The opening, truss model 1
In order to achieve an efficient design with this truss model, 𝜃 is chosen equal to 60°. The other parameters of
the truss are determined using eq. (178) till (180). The loading on the truss is calculated using eq. (181). The
minimum width of the wall for which these expressions are applicable, is calculated with eq. (182).
𝑏1 = 𝑞𝑑 𝐿
2 sin 𝜃 𝑑𝑤𝑎𝑙𝑙 ∙𝜎𝑟𝑑 ,𝑚𝑎𝑥 −𝑞𝑑 eq. (178)
𝑏2 =𝑞𝑑 𝐿
𝑑𝑤𝑎𝑙𝑙 ∙𝜎𝑟𝑑 ,𝑚𝑎𝑥 −𝑞𝑑 eq. (179)
𝑏3 =𝑞𝑑 𝐿
2 𝑑𝑤𝑎𝑙𝑙 ∙𝜎𝑟𝑑 ,𝑚𝑎𝑥 −𝑞𝑑 eq. (180)
𝑅1 = 𝑞𝑑 𝑞𝑑 𝐿
𝑑𝑤𝑎𝑙𝑙 ∙𝜎𝑟𝑑 ,𝑚𝑎𝑥 −𝑞𝑑+ 𝐿 eq. (181)
𝑏𝑤𝑎𝑙𝑙 ,𝑚𝑖𝑛 = 𝐿 𝑞𝑑
𝑑𝑤𝑎𝑙𝑙 𝜎𝑟𝑑 ,𝑚𝑎𝑥 −𝑞𝑑+ 1 eq. (182)
After determining the parameters of the truss and the loading on the truss, the minimum reinforcement
needed in the tie for the ULS condition is determined. Based on the crack width condition at the location of the
tie in the SLS, the diameter of the bars is determined. If necessary the reinforcement area is increased. The
centre to centre distance of the bars is determined such that the lowest layer of bars is located as near to the
edge of the opening as possible, taking into account the concrete cover.
It should be noted that this truss model might lead to very conservative solutions. In truss model 1 the
distributed load with a length of (𝐿 + 2 𝑏3) is schematized as a point load in the middle of the opening (see.
Fig. 35). When we consider a simply supported beam loaded by a distributed load, the maximum moment in
the beam will be equal to 1
8∙ 𝑞 ∙ 𝑙2. However a simply supported beam loaded by a point load in the middle
equal to 𝑞 ∙ 𝑙, will have a maximum moment equal to 1
4 𝑞 𝑙2. In order to obtain the same moment of
1
8∙ 𝑞 ∙ 𝑙2,
the point load should be equal to 1
2∙ 𝑞 ∙ 𝑙. When this is translated to the truss model for the opening, the truss
model shown in the next paragraph is obtained.
a) Location truss model in the wall.
𝑏𝑤𝑎𝑙𝑙 ,𝑚𝑖𝑛
𝐿
Figure 26: Truss model 1 for the opening
b) Parameters of the truss model
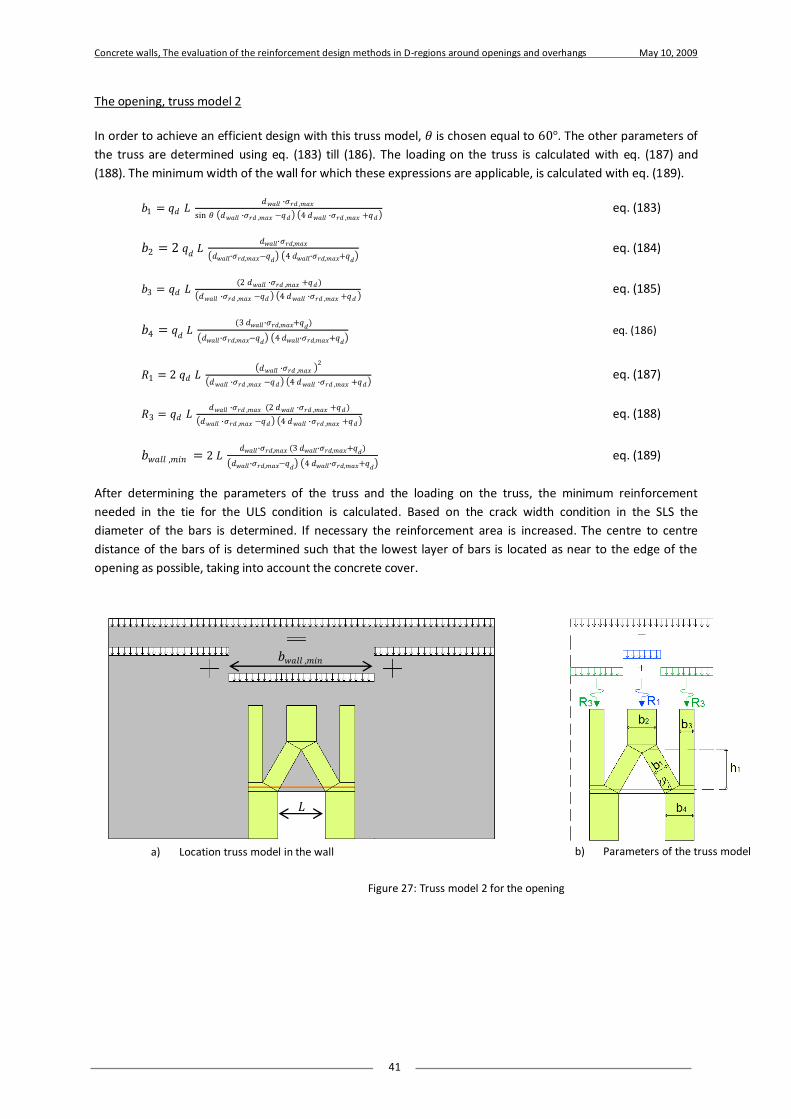
Concrete walls, The evaluation of the reinforcement design methods in D-regions around openings and overhangs May 10, 2009
41
The opening, truss model 2
In order to achieve an efficient design with this truss model, 𝜃 is chosen equal to 60°. The other parameters of
the truss are determined using eq. (183) till (186). The loading on the truss is calculated with eq. (187) and
(188). The minimum width of the wall for which these expressions are applicable, is calculated with eq. (189).
𝑏1 = 𝑞𝑑 𝐿 𝑑𝑤𝑎𝑙𝑙 ∙𝜎𝑟𝑑 ,𝑚𝑎𝑥
sin 𝜃 𝑑𝑤𝑎𝑙𝑙 ∙𝜎𝑟𝑑 ,𝑚𝑎𝑥 −𝑞𝑑 4 𝑑𝑤𝑎𝑙𝑙 ∙𝜎𝑟𝑑 ,𝑚𝑎𝑥 +𝑞𝑑 eq. (183)
𝑏2 = 2 𝑞𝑑
𝐿 𝑑𝑤𝑎𝑙𝑙∙𝜎𝑟𝑑,𝑚𝑎𝑥
𝑑𝑤𝑎𝑙𝑙∙𝜎𝑟𝑑,𝑚𝑎𝑥−𝑞𝑑 4 𝑑𝑤𝑎𝑙𝑙∙𝜎𝑟𝑑,𝑚𝑎𝑥+𝑞𝑑 eq. (184)
𝑏3 = 𝑞𝑑 𝐿 (2 𝑑𝑤𝑎𝑙𝑙 ∙𝜎𝑟𝑑 ,𝑚𝑎𝑥 +𝑞𝑑)
𝑑𝑤𝑎𝑙𝑙 ∙𝜎𝑟𝑑 ,𝑚𝑎𝑥 −𝑞𝑑 4 𝑑𝑤𝑎𝑙𝑙 ∙𝜎𝑟𝑑 ,𝑚𝑎𝑥 +𝑞𝑑 eq. (185)
𝑏4 = 𝑞𝑑
𝐿 (3 𝑑𝑤𝑎𝑙𝑙∙𝜎𝑟𝑑,𝑚𝑎𝑥+𝑞𝑑)
𝑑𝑤𝑎𝑙𝑙∙𝜎𝑟𝑑,𝑚𝑎𝑥−𝑞𝑑 4 𝑑𝑤𝑎𝑙𝑙∙𝜎𝑟𝑑,𝑚𝑎𝑥+𝑞𝑑 eq. (186)
𝑅1 = 2 𝑞𝑑 𝐿 𝑑𝑤𝑎𝑙𝑙 ∙𝜎𝑟𝑑 ,𝑚𝑎𝑥
2
𝑑𝑤𝑎𝑙𝑙 ∙𝜎𝑟𝑑 ,𝑚𝑎𝑥 −𝑞𝑑 4 𝑑𝑤𝑎𝑙𝑙 ∙𝜎𝑟𝑑 ,𝑚𝑎𝑥 +𝑞𝑑 eq. (187)
𝑅3 = 𝑞𝑑 𝐿 𝑑𝑤𝑎𝑙𝑙 ∙𝜎𝑟𝑑 ,𝑚𝑎𝑥 (2 𝑑𝑤𝑎𝑙𝑙 ∙𝜎𝑟𝑑 ,𝑚𝑎𝑥 +𝑞𝑑)
𝑑𝑤𝑎𝑙𝑙 ∙𝜎𝑟𝑑 ,𝑚𝑎𝑥 −𝑞𝑑 4 𝑑𝑤𝑎𝑙𝑙 ∙𝜎𝑟𝑑 ,𝑚𝑎𝑥 +𝑞𝑑 eq. (188)
𝑏𝑤𝑎𝑙𝑙 ,𝑚𝑖𝑛 = 2 𝐿 𝑑𝑤𝑎𝑙𝑙∙𝜎𝑟𝑑,𝑚𝑎𝑥 (3 𝑑𝑤𝑎𝑙𝑙∙𝜎𝑟𝑑,𝑚𝑎𝑥+𝑞
𝑑)
𝑑𝑤𝑎𝑙𝑙∙𝜎𝑟𝑑,𝑚𝑎𝑥−𝑞𝑑 4 𝑑𝑤𝑎𝑙𝑙∙𝜎𝑟𝑑,𝑚𝑎𝑥+𝑞𝑑 eq. (189)
After determining the parameters of the truss and the loading on the truss, the minimum reinforcement
needed in the tie for the ULS condition is calculated. Based on the crack width condition in the SLS the
diameter of the bars is determined. If necessary the reinforcement area is increased. The centre to centre
distance of the bars of is determined such that the lowest layer of bars is located as near to the edge of the
opening as possible, taking into account the concrete cover.
b) Parameters of the truss model
a) Location truss model in the wall
𝑏𝑤𝑎𝑙𝑙 ,𝑚𝑖𝑛
𝐿
Figure 27: Truss model 2 for the opening
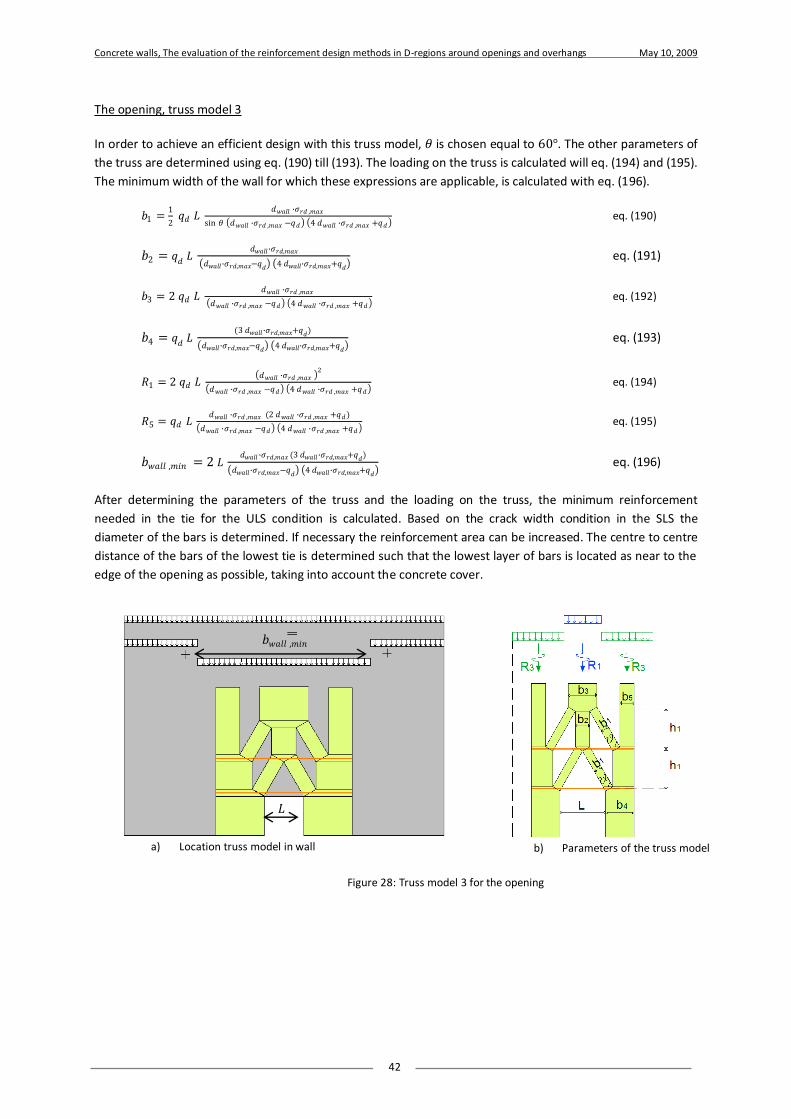
Concrete walls, The evaluation of the reinforcement design methods in D-regions around openings and overhangs May 10, 2009
42
The opening, truss model 3
In order to achieve an efficient design with this truss model, 𝜃 is chosen equal to 60°. The other parameters of
the truss are determined using eq. (190) till (193). The loading on the truss is calculated will eq. (194) and (195).
The minimum width of the wall for which these expressions are applicable, is calculated with eq. (196).
𝑏1 =1
2 𝑞𝑑 𝐿
𝑑𝑤𝑎𝑙𝑙 ∙𝜎𝑟𝑑 ,𝑚𝑎𝑥
sin 𝜃 𝑑𝑤𝑎𝑙𝑙 ∙𝜎𝑟𝑑 ,𝑚𝑎𝑥 −𝑞𝑑 4 𝑑𝑤𝑎𝑙𝑙 ∙𝜎𝑟𝑑 ,𝑚𝑎𝑥 +𝑞𝑑 eq. (190)
𝑏2 = 𝑞𝑑 𝐿 𝑑𝑤𝑎𝑙𝑙∙𝜎𝑟𝑑,𝑚𝑎𝑥
𝑑𝑤𝑎𝑙𝑙∙𝜎𝑟𝑑,𝑚𝑎𝑥−𝑞𝑑 4 𝑑𝑤𝑎𝑙𝑙∙𝜎𝑟𝑑,𝑚𝑎𝑥+𝑞𝑑 eq. (191)
𝑏3 = 2 𝑞𝑑 𝐿 𝑑𝑤𝑎𝑙𝑙 ∙𝜎𝑟𝑑 ,𝑚𝑎𝑥
𝑑𝑤𝑎𝑙𝑙 ∙𝜎𝑟𝑑 ,𝑚𝑎𝑥 −𝑞𝑑 4 𝑑𝑤𝑎𝑙𝑙 ∙𝜎𝑟𝑑 ,𝑚𝑎𝑥 +𝑞𝑑 eq. (192)
𝑏4 = 𝑞𝑑 𝐿 (3 𝑑𝑤𝑎𝑙𝑙∙𝜎𝑟𝑑,𝑚𝑎𝑥+𝑞𝑑)
𝑑𝑤𝑎𝑙𝑙∙𝜎𝑟𝑑,𝑚𝑎𝑥−𝑞𝑑 4 𝑑𝑤𝑎𝑙𝑙∙𝜎𝑟𝑑,𝑚𝑎𝑥+𝑞𝑑 eq. (193)
𝑅1 = 2 𝑞𝑑 𝐿 𝑑𝑤𝑎𝑙𝑙 ∙𝜎𝑟𝑑 ,𝑚𝑎𝑥
2
𝑑𝑤𝑎𝑙𝑙 ∙𝜎𝑟𝑑 ,𝑚𝑎𝑥 −𝑞𝑑 4 𝑑𝑤𝑎𝑙𝑙 ∙𝜎𝑟𝑑 ,𝑚𝑎𝑥 +𝑞𝑑 eq. (194)
𝑅5 = 𝑞𝑑 𝐿 𝑑𝑤𝑎𝑙𝑙 ∙𝜎𝑟𝑑 ,𝑚𝑎𝑥 (2 𝑑𝑤𝑎𝑙𝑙 ∙𝜎𝑟𝑑 ,𝑚𝑎𝑥 +𝑞𝑑)
𝑑𝑤𝑎𝑙𝑙 ∙𝜎𝑟𝑑 ,𝑚𝑎𝑥 −𝑞𝑑 4 𝑑𝑤𝑎𝑙𝑙 ∙𝜎𝑟𝑑 ,𝑚𝑎𝑥 +𝑞𝑑 eq. (195)
𝑏𝑤𝑎𝑙𝑙 ,𝑚𝑖𝑛 = 2 𝐿 𝑑𝑤𝑎𝑙𝑙 ∙𝜎𝑟𝑑,𝑚𝑎𝑥 (3 𝑑𝑤𝑎𝑙𝑙∙𝜎𝑟𝑑,𝑚𝑎𝑥+𝑞𝑑)
𝑑𝑤𝑎𝑙𝑙∙𝜎𝑟𝑑,𝑚𝑎𝑥−𝑞𝑑 4 𝑑𝑤𝑎𝑙𝑙∙𝜎𝑟𝑑,𝑚𝑎𝑥+𝑞𝑑 eq. (196)
After determining the parameters of the truss and the loading on the truss, the minimum reinforcement
needed in the tie for the ULS condition is calculated. Based on the crack width condition in the SLS the
diameter of the bars is determined. If necessary the reinforcement area can be increased. The centre to centre
distance of the bars of the lowest tie is determined such that the lowest layer of bars is located as near to the
edge of the opening as possible, taking into account the concrete cover.
a) Location truss model in wall
𝑏𝑤𝑎𝑙𝑙 ,𝑚𝑖𝑛
𝐿
Figure 28: Truss model 3 for the opening
b) Parameters of the truss model

Concrete walls, The evaluation of the reinforcement design methods in D-regions around openings and overhangs May 10, 2009
43
The opening, truss model 4
In order to achieve an efficient design with this truss model, a stress trajectory plot is used from a Linear Elastic
Finite Element program. From the stress trajectory plot the angle of each compression diagonal (𝜃1 till 𝜃3) is
determined and the ratio between the width of the compression diagonals (𝛽1 and 𝛽2) is estimated. The value
for 𝛽𝑖 are obtained by observing the stresses in the direction of each compression diagonal. The other
parameters of the truss can be determined using eq. (197) till (204). The loading on the truss is calculated with
eq. (205) and (206). The minimum width of the wall for which these expressions are applicable, is calculated
with eq. (207).
𝑏1 =𝑏4−𝑏8
sin 𝜃1+𝛽2 sin 𝜃2+𝛽3 sin 𝜃3 eq. (197)
𝑏2 = 𝛽2 𝑏1 eq. (198)
𝑏3 = 𝛽3 𝑏1 eq. (199)
𝑏4 = 𝑞𝑑 𝐿 (3 𝑑𝑤𝑎𝑙𝑙∙𝜎𝑟𝑑,𝑚𝑎𝑥+𝑞𝑑)
𝑑𝑤𝑎𝑙𝑙∙𝜎𝑟𝑑,𝑚𝑎𝑥−𝑞𝑑 4 𝑑𝑤𝑎𝑙𝑙∙𝜎𝑟𝑑,𝑚𝑎𝑥+𝑞𝑑 eq. (200)
𝑏5 = 2 𝑏1 sin𝜃1 eq. (201)
𝑏6 = 𝑏5 + 2 𝑏2 sin𝜃2 eq. (202)
𝑏7 = 𝑏6 + 2 𝑏3 sin𝜃3 eq. (203)
𝑏8 = 𝑞𝑑 𝐿 (2 𝑑𝑤𝑎𝑙𝑙 ∙𝜎𝑟𝑑 ,𝑚𝑎𝑥 +𝑞𝑑)
𝑑𝑤𝑎𝑙𝑙 ∙𝜎𝑟𝑑 ,𝑚𝑎𝑥 −𝑞𝑑 4 𝑑𝑤𝑎𝑙𝑙 ∙𝜎𝑟𝑑 ,𝑚𝑎𝑥 +𝑞𝑑 eq. (204)
𝑅1 = 2 𝑞𝑑 𝐿 𝑑𝑤𝑎𝑙𝑙 ∙𝜎𝑟𝑑 ,𝑚𝑎𝑥
2
𝑑𝑤𝑎𝑙𝑙 ∙𝜎𝑟𝑑 ,𝑚𝑎𝑥 −𝑞𝑑 4 𝑑𝑤𝑎𝑙𝑙 ∙𝜎𝑟𝑑 ,𝑚𝑎𝑥 +𝑞𝑑 eq. (205)
𝑅8 = 𝑞𝑑 𝐿 𝑑𝑤𝑎𝑙𝑙 ∙𝜎𝑟𝑑 ,𝑚𝑎𝑥 (2 𝑑𝑤𝑎𝑙𝑙 ∙𝜎𝑟𝑑 ,𝑚𝑎𝑥 +𝑞𝑑)
𝑑𝑤𝑎𝑙𝑙 ∙𝜎𝑟𝑑 ,𝑚𝑎𝑥 −𝑞𝑑 4 𝑑𝑤𝑎𝑙𝑙 ∙𝜎𝑟𝑑 ,𝑚𝑎𝑥 +𝑞𝑑 eq. (206)
𝑏𝑤𝑎𝑙𝑙 ,𝑚𝑖𝑛 = 2 𝐿 𝑑𝑤𝑎𝑙𝑙∙𝜎𝑟𝑑,𝑚𝑎𝑥 (3 𝑑𝑤𝑎𝑙𝑙∙𝜎𝑟𝑑,𝑚𝑎𝑥+𝑞
𝑑)
𝑑𝑤𝑎𝑙𝑙∙𝜎𝑟𝑑,𝑚𝑎𝑥−𝑞𝑑 4 𝑑𝑤𝑎𝑙𝑙∙𝜎𝑟𝑑,𝑚𝑎𝑥+𝑞𝑑 eq. (207)
Now the stresses in the truss elements can be calculated. If nowhere the maximum stress is exceeded, the
estimation of the ratio between the width of the compression diagonals (𝛽1 and 𝛽2) is correct. The iteration
process is than finished after one iteration step.
If the stresses are exceeded somewhere in the truss, the correct relation between the width of the diagonals
have to be determined by using the forces in these diagonals. Now the correct ratio between the widths of the
diagonals can be computed. The minimum reinforcement needed is calculated from the ULS condition. Based
on the crack width condition in the SLS, the diameter of the bars is determined. If necessary the reinforcement
area is increased. The centre to centre distance of the bars is determined such that the lowest layer of bars is
located as near to the edge of the opening as possible, taking into account the concrete cover.
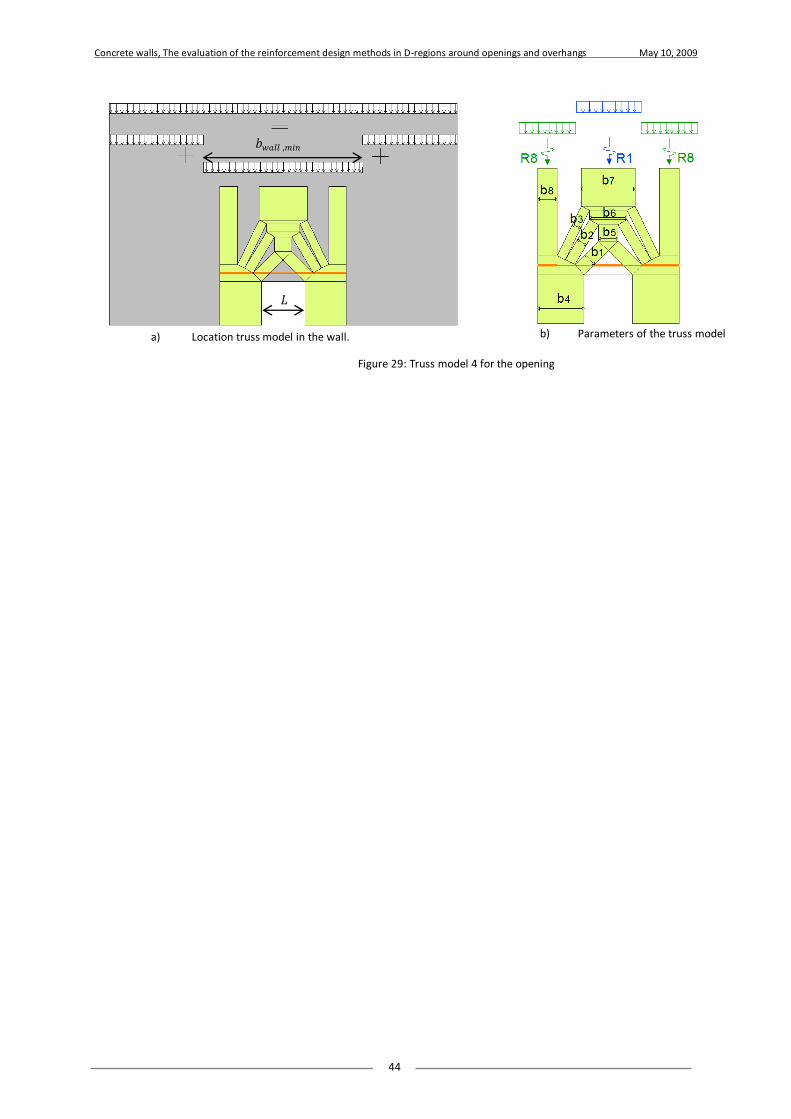
Concrete walls, The evaluation of the reinforcement design methods in D-regions around openings and overhangs May 10, 2009
44
a) Location truss model in the wall.
𝑏𝑤𝑎𝑙𝑙 ,𝑚𝑖𝑛
𝐿
Figure 29: Truss model 4 for the opening
b) Parameters of the truss model
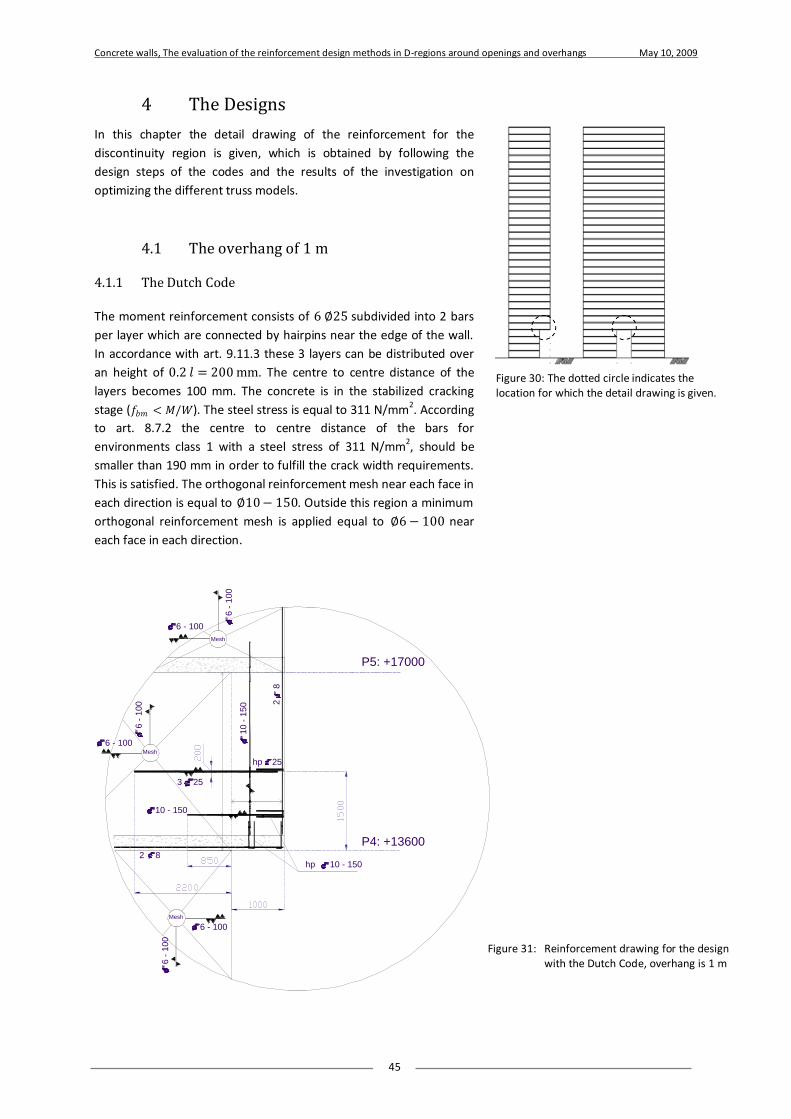
Concrete walls, The evaluation of the reinforcement design methods in D-regions around openings and overhangs May 10, 2009
45
4 The Designs
In this chapter the detail drawing of the reinforcement for the
discontinuity region is given, which is obtained by following the
design steps of the codes and the results of the investigation on
optimizing the different truss models.
4.1 The overhang of 1 m
4.1.1 The Dutch Code
The moment reinforcement consists of 6 ∅25 subdivided into 2 bars
per layer which are connected by hairpins near the edge of the wall.
In accordance with art. 9.11.3 these 3 layers can be distributed over
an height of 0.2 𝑙 = 200 mm. The centre to centre distance of the
layers becomes 100 mm. The concrete is in the stabilized cracking
stage (𝑓𝑏𝑚 < 𝑀/𝑊). The steel stress is equal to 311 N/mm2. According
to art. 8.7.2 the centre to centre distance of the bars for
environments class 1 with a steel stress of 311 N/mm2, should be
smaller than 190 mm in order to fulfill the crack width requirements.
This is satisfied. The orthogonal reinforcement mesh near each face in
each direction is equal to ∅10− 150. Outside this region a minimum
orthogonal reinforcement mesh is applied equal to ∅6− 100 near
each face in each direction.
Figure 30: The dotted circle indicates the location for which the detail drawing is given.
Figure 31: Reinforcement drawing for the design with the Dutch Code, overhang is 1 m
Mesh
6 - 100
6
- 1
00
6
- 1
00
Mesh
6 - 100
6
- 1
00
Mesh
6 - 100
10 - 150
3 25
P4: +13600
P5: +17000
hp 10 - 1502 8
2
8
hp 25
1
0 -
150
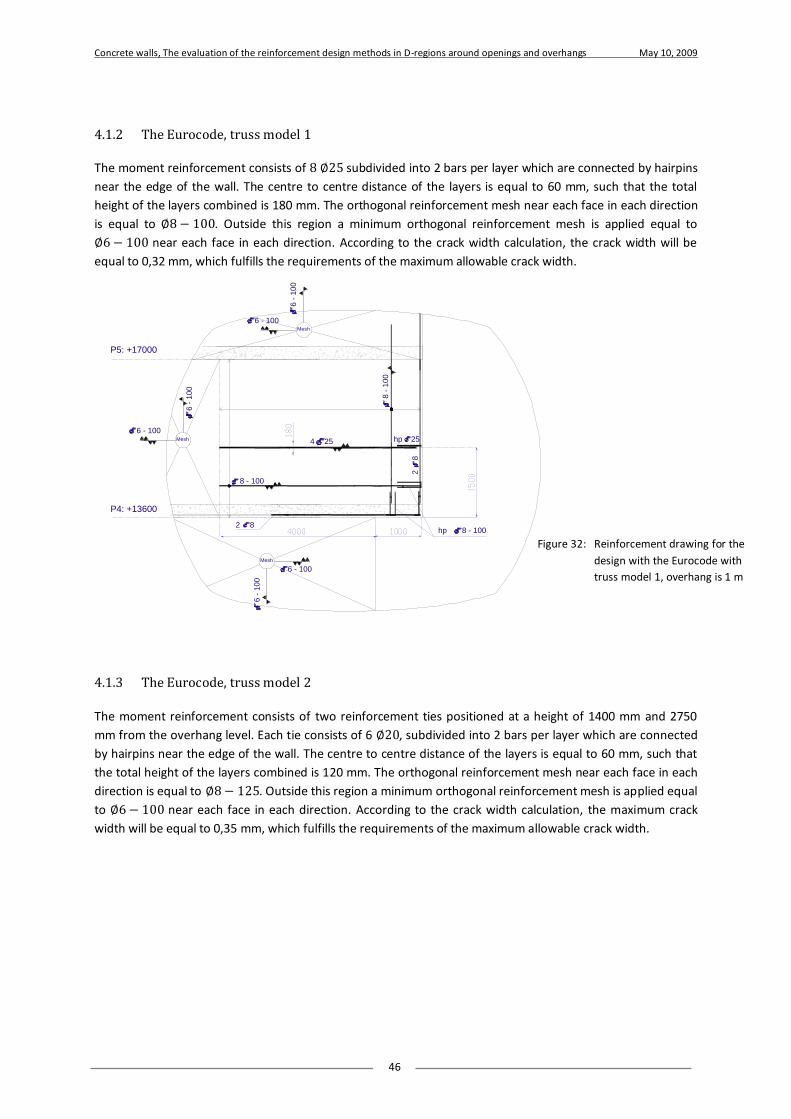
Concrete walls, The evaluation of the reinforcement design methods in D-regions around openings and overhangs May 10, 2009
46
4.1.2 The Eurocode, truss model 1
The moment reinforcement consists of 8 ∅25 subdivided into 2 bars per layer which are connected by hairpins
near the edge of the wall. The centre to centre distance of the layers is equal to 60 mm, such that the total
height of the layers combined is 180 mm. The orthogonal reinforcement mesh near each face in each direction
is equal to ∅8− 100. Outside this region a minimum orthogonal reinforcement mesh is applied equal to
∅6− 100 near each face in each direction. According to the crack width calculation, the crack width will be
equal to 0,32 mm, which fulfills the requirements of the maximum allowable crack width.
4.1.3 The Eurocode, truss model 2
The moment reinforcement consists of two reinforcement ties positioned at a height of 1400 mm and 2750
mm from the overhang level. Each tie consists of 6 ∅20, subdivided into 2 bars per layer which are connected
by hairpins near the edge of the wall. The centre to centre distance of the layers is equal to 60 mm, such that
the total height of the layers combined is 120 mm. The orthogonal reinforcement mesh near each face in each
direction is equal to ∅8− 125. Outside this region a minimum orthogonal reinforcement mesh is applied equal
to ∅6− 100 near each face in each direction. According to the crack width calculation, the maximum crack
width will be equal to 0,35 mm, which fulfills the requirements of the maximum allowable crack width.
Figure 32: Reinforcement drawing for the
design with the Eurocode with
truss model 1, overhang is 1 m
6
- 1
00
Mesh
6 - 100
6 - 100
Mesh
6
- 1
00
6 - 100Mesh
6
- 1
00
P4: +13600
P5: +17000
hp 8 - 1002 8
2
8
hp 25
8
- 1
00
8 - 100
4 25
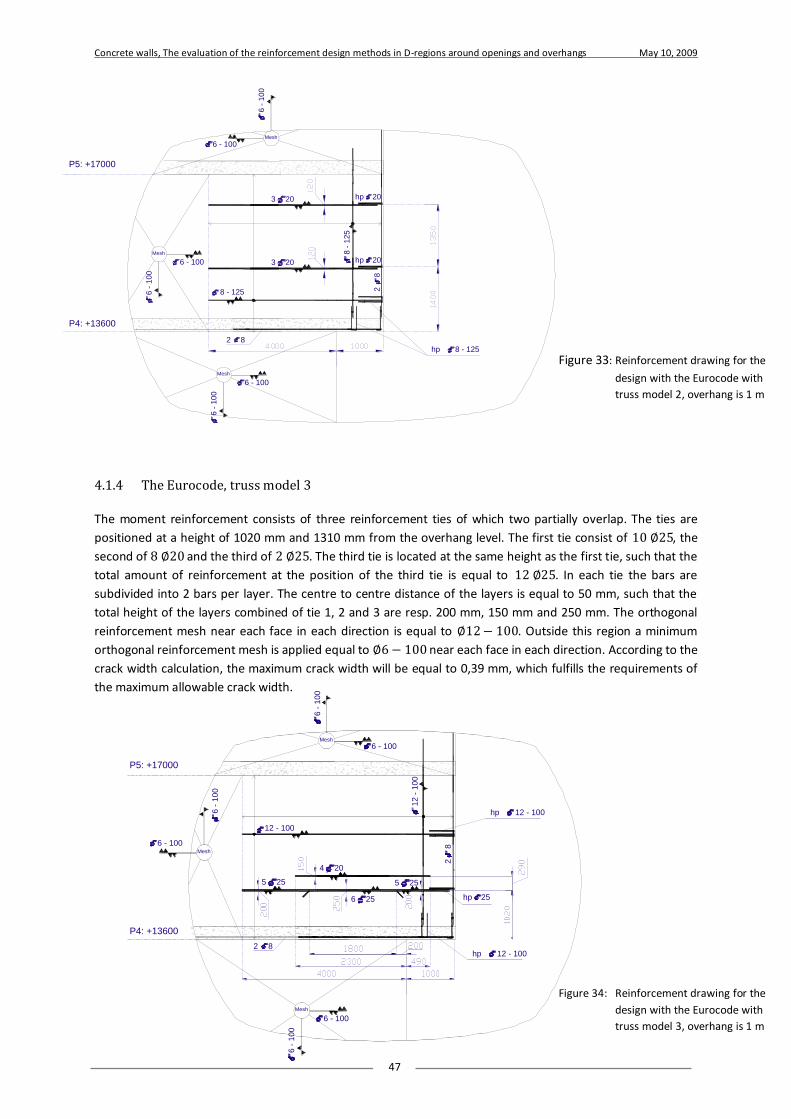
Concrete walls, The evaluation of the reinforcement design methods in D-regions around openings and overhangs May 10, 2009
47
4.1.4 The Eurocode, truss model 3
The moment reinforcement consists of three reinforcement ties of which two partially overlap. The ties are
positioned at a height of 1020 mm and 1310 mm from the overhang level. The first tie consist of 10 ∅25, the
second of 8 ∅20 and the third of 2 ∅25. The third tie is located at the same height as the first tie, such that the
total amount of reinforcement at the position of the third tie is equal to 12 ∅25. In each tie the bars are
subdivided into 2 bars per layer. The centre to centre distance of the layers is equal to 50 mm, such that the
total height of the layers combined of tie 1, 2 and 3 are resp. 200 mm, 150 mm and 250 mm. The orthogonal
reinforcement mesh near each face in each direction is equal to ∅12− 100. Outside this region a minimum
orthogonal reinforcement mesh is applied equal to ∅6− 100 near each face in each direction. According to the
crack width calculation, the maximum crack width will be equal to 0,39 mm, which fulfills the requirements of
the maximum allowable crack width.
Figure 33: Reinforcement drawing for the
design with the Eurocode with
truss model 2, overhang is 1 m
Figure 34: Reinforcement drawing for the
design with the Eurocode with
truss model 3, overhang is 1 m
8 - 125
3 20
P4: +13600
P5: +17000
hp 8 - 125
2 8
2
8
hp 20
8 -
12
5
hp 203 20
6
- 1
00
Mesh
6 - 100
6
- 1
00
Mesh
6 - 100
6 -
10
0
Mesh
6 - 100
12 - 100
6 25
hp 12 - 100
5 255 25
4 20
6
- 1
00
Mesh
6 - 100
6
- 1
00
Mesh
6 - 100
6
- 1
00
Mesh
6 - 100
P4: +13600
P5: +17000
hp 12 - 1002 8
2
8
hp 25
1
2 -
100
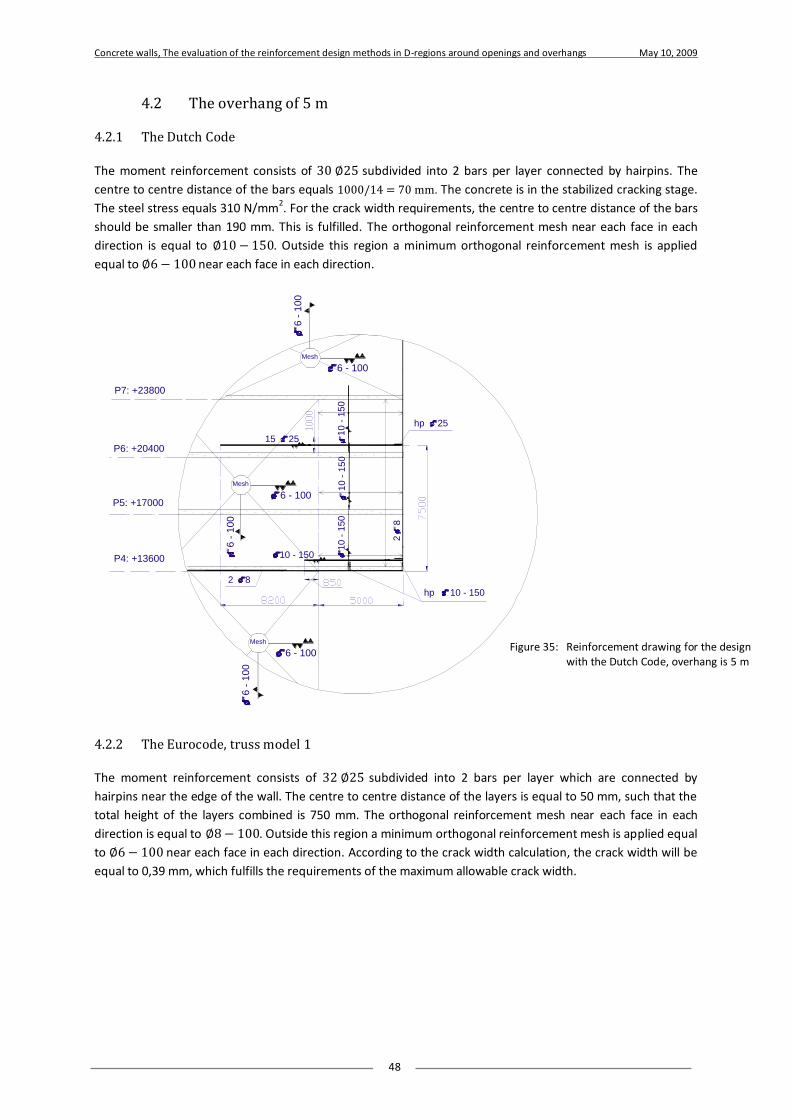
Concrete walls, The evaluation of the reinforcement design methods in D-regions around openings and overhangs May 10, 2009
48
4.2 The overhang of 5 m
4.2.1 The Dutch Code
The moment reinforcement consists of 30 ∅25 subdivided into 2 bars per layer connected by hairpins. The
centre to centre distance of the bars equals 1000/14 = 70 mm. The concrete is in the stabilized cracking stage.
The steel stress equals 310 N/mm2. For the crack width requirements, the centre to centre distance of the bars
should be smaller than 190 mm. This is fulfilled. The orthogonal reinforcement mesh near each face in each
direction is equal to ∅10− 150. Outside this region a minimum orthogonal reinforcement mesh is applied
equal to ∅6− 100 near each face in each direction.
4.2.2 The Eurocode, truss model 1
The moment reinforcement consists of 32 ∅25 subdivided into 2 bars per layer which are connected by
hairpins near the edge of the wall. The centre to centre distance of the layers is equal to 50 mm, such that the
total height of the layers combined is 750 mm. The orthogonal reinforcement mesh near each face in each
direction is equal to ∅8− 100. Outside this region a minimum orthogonal reinforcement mesh is applied equal
to ∅6− 100 near each face in each direction. According to the crack width calculation, the crack width will be
equal to 0,39 mm, which fulfills the requirements of the maximum allowable crack width.
Figure 35: Reinforcement drawing for the design with the Dutch Code, overhang is 5 m
1
0 -
15
0
1
0 -
15
0
6 - 100
Mesh
6
- 1
00
6 - 100
Mesh
6
- 1
00
6 - 100
Mesh
6
- 1
00
15 25
hp 25
2
8
1
0 -
15
0
2 8
hp 10 - 150
P6: +20400
P7: +23800
10 - 150P4: +13600
P5: +17000
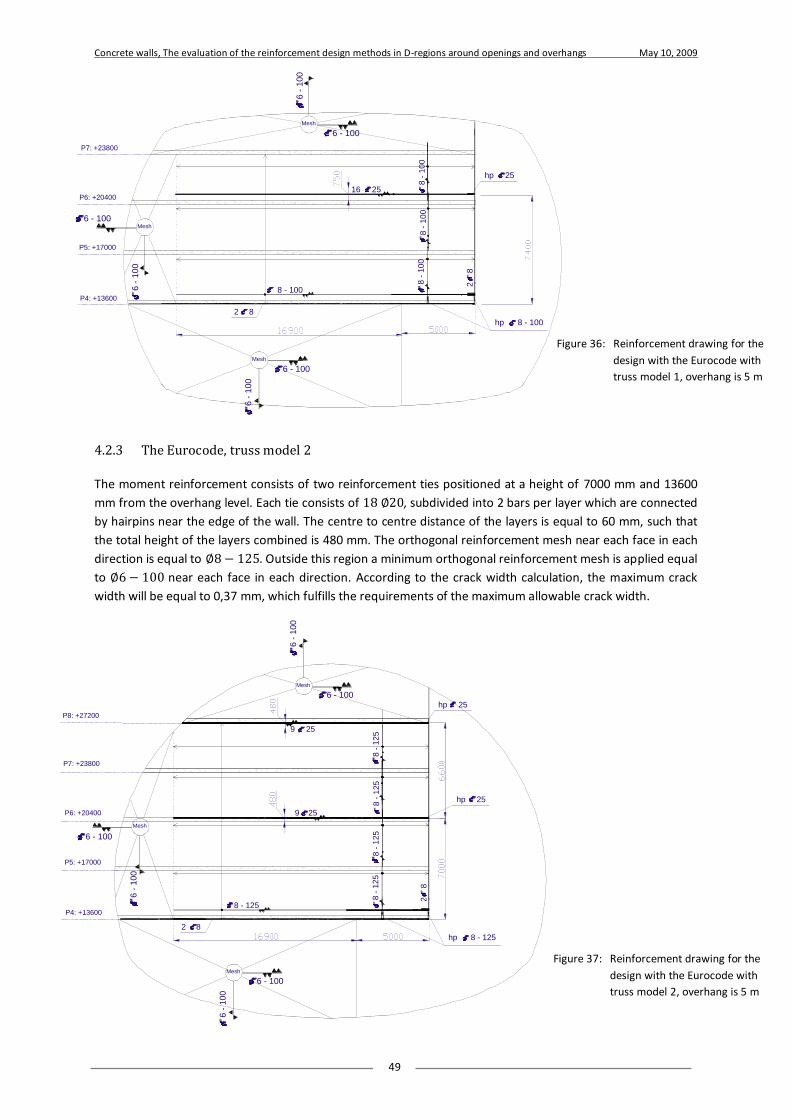
Concrete walls, The evaluation of the reinforcement design methods in D-regions around openings and overhangs May 10, 2009
49
4.2.3 The Eurocode, truss model 2
The moment reinforcement consists of two reinforcement ties positioned at a height of 7000 mm and 13600
mm from the overhang level. Each tie consists of 18 ∅20, subdivided into 2 bars per layer which are connected
by hairpins near the edge of the wall. The centre to centre distance of the layers is equal to 60 mm, such that
the total height of the layers combined is 480 mm. The orthogonal reinforcement mesh near each face in each
direction is equal to ∅8− 125. Outside this region a minimum orthogonal reinforcement mesh is applied equal
to ∅6− 100 near each face in each direction. According to the crack width calculation, the maximum crack
width will be equal to 0,37 mm, which fulfills the requirements of the maximum allowable crack width.
Figure 36: Reinforcement drawing for the
design with the Eurocode with
truss model 1, overhang is 5 m
Figure 37: Reinforcement drawing for the
design with the Eurocode with
truss model 2, overhang is 5 m
8 - 100P4: +13600
P5: +17000
16 25
hp 25
8
- 1
00
8
- 1
00
2
8
8
- 1
00
2 8
hp 8 - 100
P6: +20400
P7: +23800
6 - 100
Mesh
6
- 1
00
6 - 100Mesh
6
- 1
00
6 - 100
Mesh
6
- 1
00
6 - 100
Mesh
6
- 1
00
6
- 1
00
Mesh
6 - 100
6
- 1
00
Mesh
6 - 100
hp 25
8 -
125
8 -
125
2 8
8 -
125
2 8
hp 8 - 125
P6: +20400
P7: +23800
8 - 125P4: +13600
P5: +17000
hp 25
9 25
9 25
P8: +27200
8 -
125
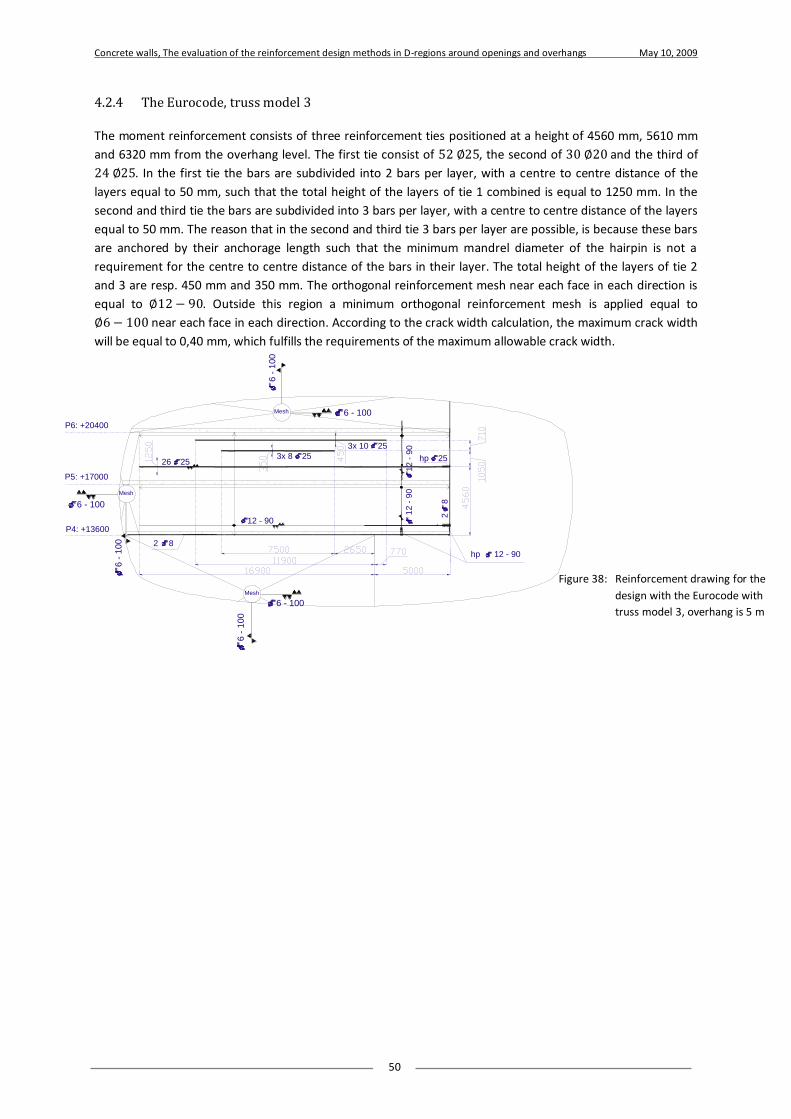
Concrete walls, The evaluation of the reinforcement design methods in D-regions around openings and overhangs May 10, 2009
50
4.2.4 The Eurocode, truss model 3
The moment reinforcement consists of three reinforcement ties positioned at a height of 4560 mm, 5610 mm
and 6320 mm from the overhang level. The first tie consist of 52 ∅25, the second of 30 ∅20 and the third of
24 ∅25. In the first tie the bars are subdivided into 2 bars per layer, with a centre to centre distance of the
layers equal to 50 mm, such that the total height of the layers of tie 1 combined is equal to 1250 mm. In the
second and third tie the bars are subdivided into 3 bars per layer, with a centre to centre distance of the layers
equal to 50 mm. The reason that in the second and third tie 3 bars per layer are possible, is because these bars
are anchored by their anchorage length such that the minimum mandrel diameter of the hairpin is not a
requirement for the centre to centre distance of the bars in their layer. The total height of the layers of tie 2
and 3 are resp. 450 mm and 350 mm. The orthogonal reinforcement mesh near each face in each direction is
equal to ∅12− 90. Outside this region a minimum orthogonal reinforcement mesh is applied equal to
∅6− 100 near each face in each direction. According to the crack width calculation, the maximum crack width
will be equal to 0,40 mm, which fulfills the requirements of the maximum allowable crack width.
Figure 38: Reinforcement drawing for the
design with the Eurocode with
truss model 3, overhang is 5 m
hp 25 26 253x 8 25
3x 10 25
1
2 -
90
2
8
1
2 -
90
2 8
hp 12 - 90
P6: +20400
12 - 90P4: +13600
P5: +17000
6 - 100Mesh
6
- 1
00
6 - 100
Mesh
6
- 1
00
6
- 1
00
Mesh
6 - 100

Concrete walls, The evaluation of the reinforcement design methods in D-regions around openings and overhangs May 10, 2009
51
4.3 The overhang of 10 m
4.3.1 The Dutch Code
The moment reinforcement consists of 60 ∅25 subdivided into 2 bars per layer connected by hairpins. The
centre to centre distance of the bars equals 2000/29 = 70 mm. The concrete is in the stabilized cracking stage.
The steel stress equals 310 N/mm2. For the crack with requirements, the centre to centre distance of the bars
should be smaller than 190 mm. This is fulfilled. The orthogonal reinforcement mesh near each face in each
direction is equal to ∅10− 150. Outside this region a minimum orthogonal reinforcement mesh is applied
equal to ∅6− 100 near each face in each direction.
4.3.2 The Eurocode, truss model 1
The moment reinforcement consists of 64 ∅25 subdivided into 2 bars per layer which are connected by
hairpins near the edge of the wall. The centre to centre distance of the layers is equal to 50 mm, such that the
total height of the layers combined is 1550 mm. The orthogonal reinforcement mesh near each face in each
direction is equal to ∅8− 100. Outside this region a minimum orthogonal reinforcement mesh is applied equal
to ∅6− 100 near each face in each direction. According to the crack width calculation, the maximum crack
width will be equal to 0,39 mm, which fulfills the requirements of the maximum allowable crack width.
Figure 39: Reinforcement drawing for the design with the Dutch Code, overhang is 10 m
hp 10 - 150
10 - 150
30 25 hp 25
P8: +27200
P9: +30600
6 - 100
Mesh
6
- 1
00
6
- 1
00
Mesh
6 - 100
2 8
2
8
P6: +20400
P7: +23800
P4: +13600
P5: +17000
6 - 100Mesh
6
- 1
00
10 - 150
10 - 150
10 - 150
10 - 150
10 - 150

Concrete walls, The evaluation of the reinforcement design methods in D-regions around openings and overhangs May 10, 2009
52
4.3.3 The Eurocode, truss model 2
The moment reinforcement consists of two reinforcement ties positioned at a height of 14000 mm and 27200
mm from the overhang level. Each tie consists of 34 ∅20, subdivided into 2 bars per layer which are connected
by hairpins near the edge of the wall. The centre to centre distance of the layers is equal to 60 mm, such that
the total height of the layers combined is 960 mm. The orthogonal reinforcement mesh near each face in each
direction is equal to ∅8− 125. Outside this region a minimum orthogonal reinforcement mesh is applied equal
to ∅6− 100 near each face in each direction. According to the crack width calculation, the maximum crack
width will be equal to 0,40 mm, which fulfills the requirements of the maximum allowable crack width.
Figure 40: Reinforcement drawing for the
design with the Eurocode with
truss model 1, overhang is 10 m
Figure 41: Reinforcement drawing for the
design with the Eurocode with
truss model 2, overhang is 10 m
2 8
2
8
P6: +20400
P7: +23800
8
- 1
00
8
- 1
00
8
- 1
00
8
- 1
00
P4: +13600
P5: +17000
hp 8 - 100
8
- 1
00
8 - 100
32 25 hp 25
P8: +27200
P9: +30600
6 - 100
6
- 1
00
Mesh
Mesh
6
- 1
00
6 - 100
Mesh
6
- 1
00
6 - 100
17 25 hp 25P8: +27200
P9: +30600
2 8
2
8
P6: +20400
P7: +23800
P4: +13600
P5: +17000
P13: +44200
P12: +40800
P11: +37400
P10: +34000
hp 25
17 25
8
- 1
25
hp 8 - 125
8 - 125
Mesh
6
- 1
00
6 - 100
Mesh
6
- 1
00
6 - 100
8
- 1
25
8
- 1
25
8
- 1
25
8
- 1
25
8
- 1
25
8
- 1
25
8
- 1
25
8
- 1
25
6 - 100
6
- 1
00
Mesh
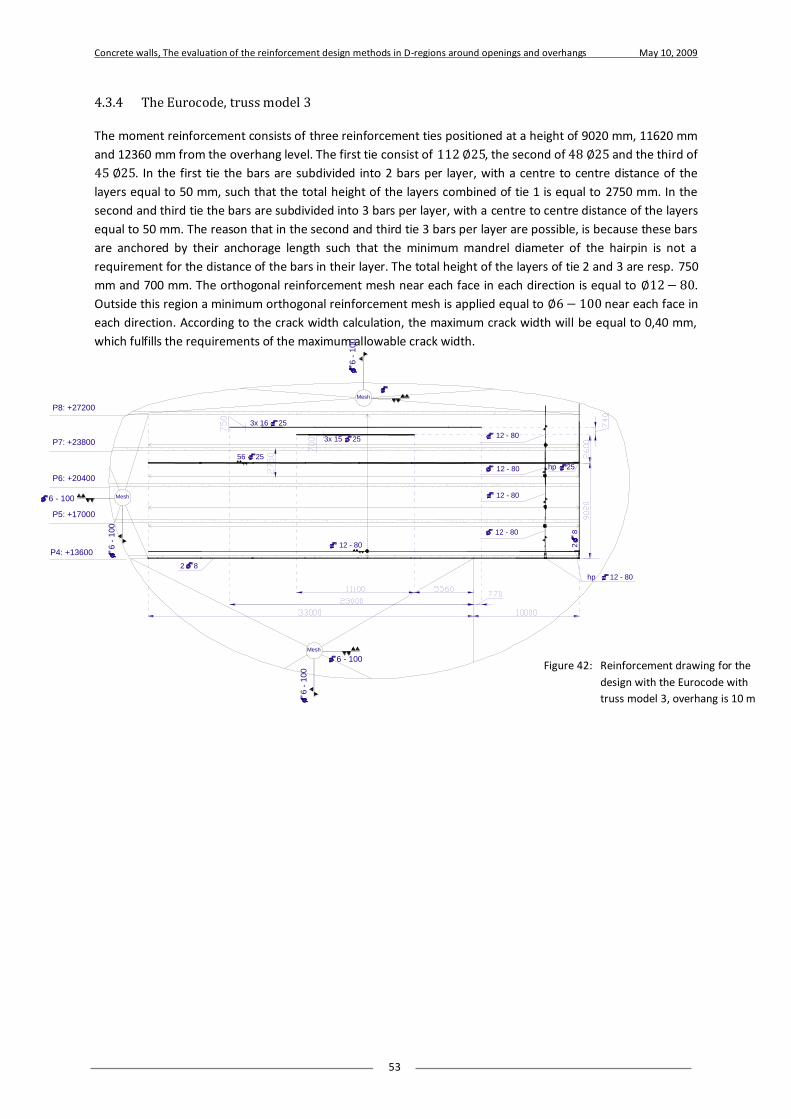
Concrete walls, The evaluation of the reinforcement design methods in D-regions around openings and overhangs May 10, 2009
53
4.3.4 The Eurocode, truss model 3
The moment reinforcement consists of three reinforcement ties positioned at a height of 9020 mm, 11620 mm
and 12360 mm from the overhang level. The first tie consist of 112 ∅25, the second of 48 ∅25 and the third of
45 ∅25. In the first tie the bars are subdivided into 2 bars per layer, with a centre to centre distance of the
layers equal to 50 mm, such that the total height of the layers combined of tie 1 is equal to 2750 mm. In the
second and third tie the bars are subdivided into 3 bars per layer, with a centre to centre distance of the layers
equal to 50 mm. The reason that in the second and third tie 3 bars per layer are possible, is because these bars
are anchored by their anchorage length such that the minimum mandrel diameter of the hairpin is not a
requirement for the distance of the bars in their layer. The total height of the layers of tie 2 and 3 are resp. 750
mm and 700 mm. The orthogonal reinforcement mesh near each face in each direction is equal to ∅12− 80.
Outside this region a minimum orthogonal reinforcement mesh is applied equal to ∅6− 100 near each face in
each direction. According to the crack width calculation, the maximum crack width will be equal to 0,40 mm,
which fulfills the requirements of the maximum allowable crack width.
Figure 42: Reinforcement drawing for the
design with the Eurocode with
truss model 3, overhang is 10 m
12 - 80
12 - 80
12 - 80
12 - 80
12 - 80
hp 25
56 25
3x 16 25
3x 15 25
2 82
8
P6: +20400
P7: +23800
P4: +13600
P5: +17000
P8: +27200
hp 12 - 80
6 - 100
6
- 1
00
Mesh
Mesh
6
- 1
00
6 - 100
Mesh
6
- 1
00
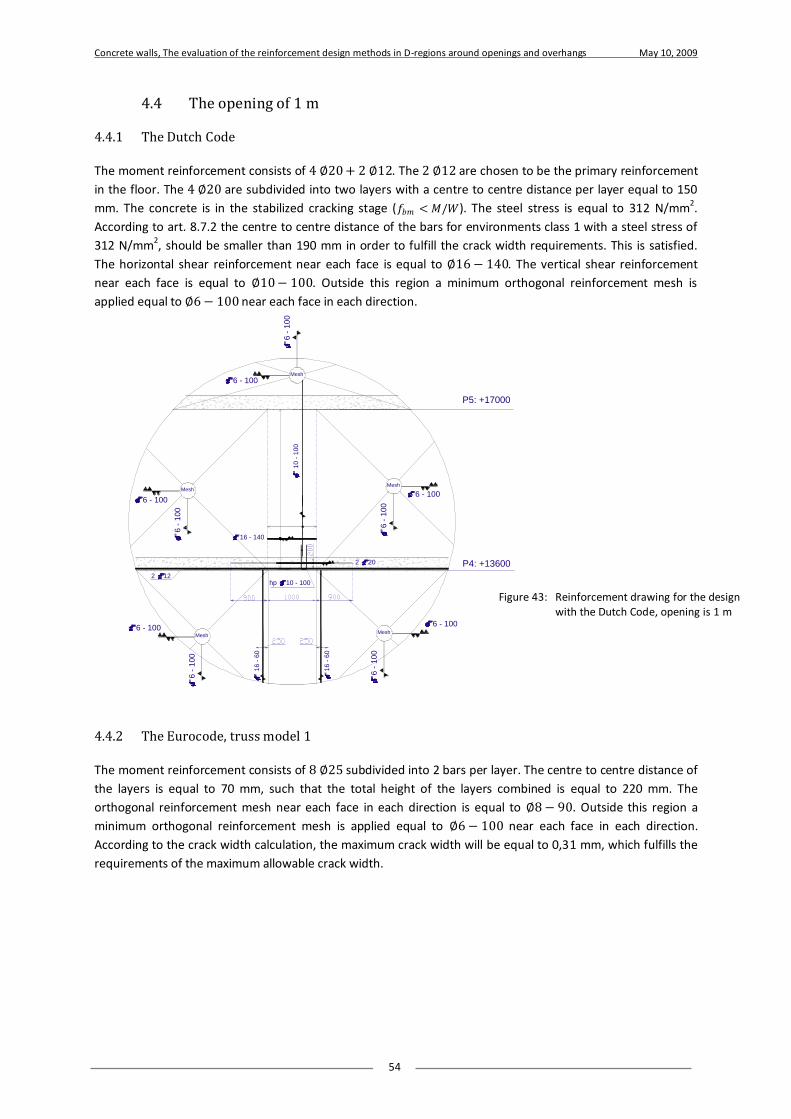
Concrete walls, The evaluation of the reinforcement design methods in D-regions around openings and overhangs May 10, 2009
54
4.4 The opening of 1 m
4.4.1 The Dutch Code
The moment reinforcement consists of 4 ∅20 + 2 ∅12. The 2 ∅12 are chosen to be the primary reinforcement
in the floor. The 4 ∅20 are subdivided into two layers with a centre to centre distance per layer equal to 150
mm. The concrete is in the stabilized cracking stage (𝑓𝑏𝑚 < 𝑀/𝑊). The steel stress is equal to 312 N/mm2.
According to art. 8.7.2 the centre to centre distance of the bars for environments class 1 with a steel stress of
312 N/mm2, should be smaller than 190 mm in order to fulfill the crack width requirements. This is satisfied.
The horizontal shear reinforcement near each face is equal to ∅16− 140. The vertical shear reinforcement
near each face is equal to ∅10− 100. Outside this region a minimum orthogonal reinforcement mesh is
applied equal to ∅6− 100 near each face in each direction.
4.4.2 The Eurocode, truss model 1
The moment reinforcement consists of 8 ∅25 subdivided into 2 bars per layer. The centre to centre distance of
the layers is equal to 70 mm, such that the total height of the layers combined is equal to 220 mm. The
orthogonal reinforcement mesh near each face in each direction is equal to ∅8− 90. Outside this region a
minimum orthogonal reinforcement mesh is applied equal to ∅6− 100 near each face in each direction.
According to the crack width calculation, the maximum crack width will be equal to 0,31 mm, which fulfills the
requirements of the maximum allowable crack width.
Figure 43: Reinforcement drawing for the design with the Dutch Code, opening is 1 m
6
- 1
00
Mesh
6 - 100
6 - 100Mesh
6
- 1
00
6 - 100
Mesh
6
- 1
00
6 - 100
Mesh
6
- 1
00
6 - 100Mesh
6
- 1
00
10
- 1
00
16 - 140
P4: +13600
P5: +17000
2 12
2 20
hp 10 - 100
16
- 6
0
16
- 6
0
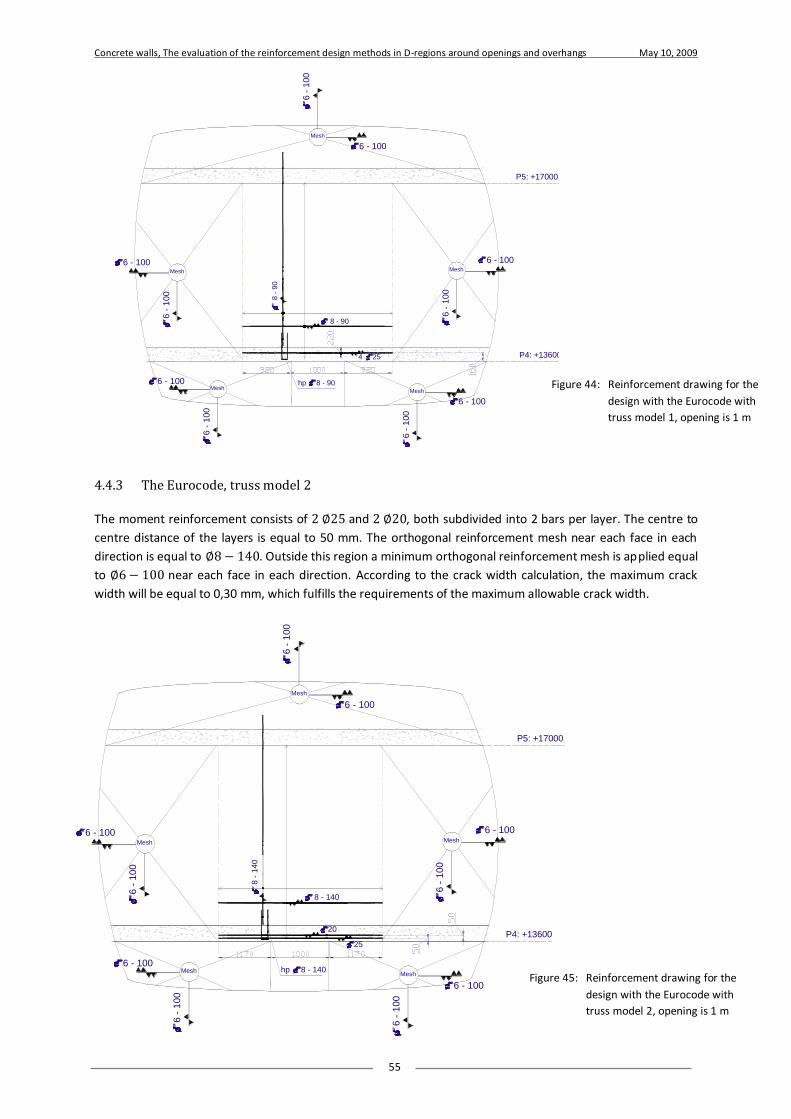
Concrete walls, The evaluation of the reinforcement design methods in D-regions around openings and overhangs May 10, 2009
55
4.4.3 The Eurocode, truss model 2
The moment reinforcement consists of 2 ∅25 and 2 ∅20, both subdivided into 2 bars per layer. The centre to
centre distance of the layers is equal to 50 mm. The orthogonal reinforcement mesh near each face in each
direction is equal to ∅8− 140. Outside this region a minimum orthogonal reinforcement mesh is applied equal
to ∅6− 100 near each face in each direction. According to the crack width calculation, the maximum crack
width will be equal to 0,30 mm, which fulfills the requirements of the maximum allowable crack width.
Figure 44: Reinforcement drawing for the
design with the Eurocode with
truss model 1, opening is 1 m
Figure 45: Reinforcement drawing for the
design with the Eurocode with
truss model 2, opening is 1 m
6
- 1
00
6 - 100
Mesh
Mesh
6 - 100
6
- 1
00
Mesh
6 - 100
6 -
100
8 -
90
8 - 90
P4: +13600
4 25
hp 8 - 90
P5: +17000
6
- 1
00
6 - 100Mesh
6
- 1
00
6 - 100Mesh
25
hp 8 - 140
20
6
- 1
00
6 - 100
Mesh
Mesh
6 - 100
6
- 1
00
Mesh
6 - 100
6
- 1
00
8 -
140
8 - 140
P4: +13600
P5: +17000
6
- 1
00
6 - 100Mesh
6
- 1
00
6 - 100Mesh
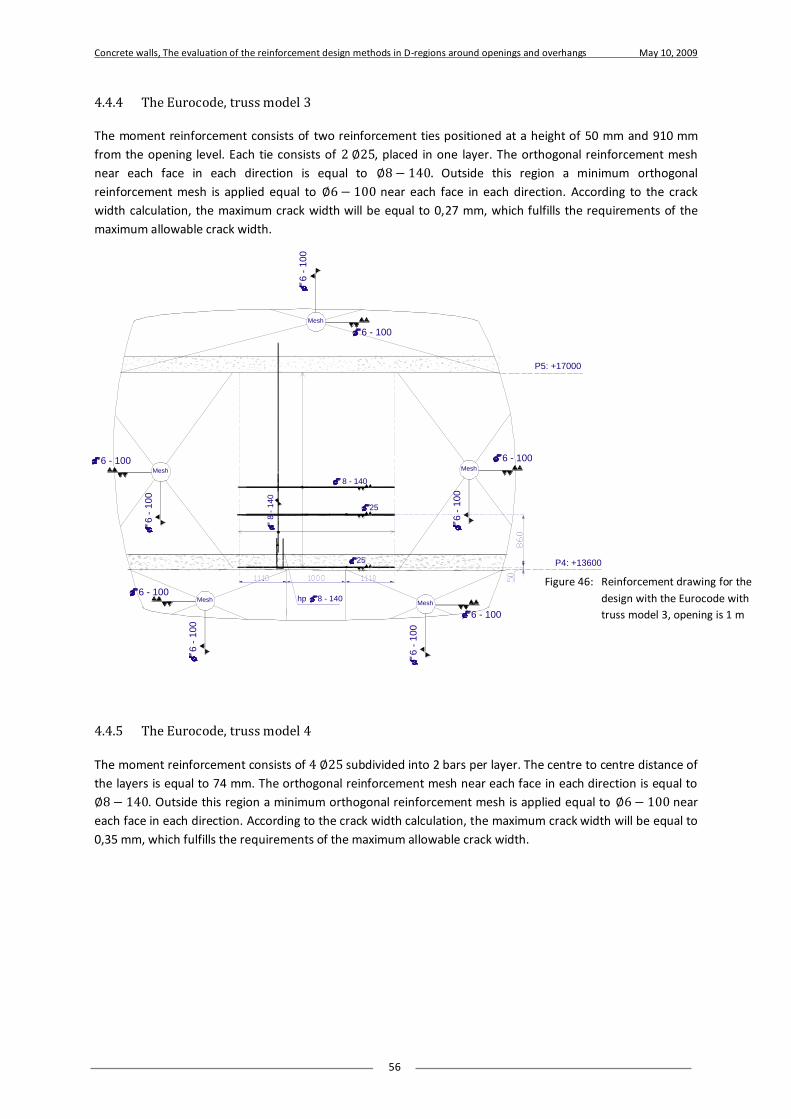
Concrete walls, The evaluation of the reinforcement design methods in D-regions around openings and overhangs May 10, 2009
56
4.4.4 The Eurocode, truss model 3
The moment reinforcement consists of two reinforcement ties positioned at a height of 50 mm and 910 mm
from the opening level. Each tie consists of 2 ∅25, placed in one layer. The orthogonal reinforcement mesh
near each face in each direction is equal to ∅8− 140. Outside this region a minimum orthogonal
reinforcement mesh is applied equal to ∅6− 100 near each face in each direction. According to the crack
width calculation, the maximum crack width will be equal to 0,27 mm, which fulfills the requirements of the
maximum allowable crack width.
4.4.5 The Eurocode, truss model 4
The moment reinforcement consists of 4 ∅25 subdivided into 2 bars per layer. The centre to centre distance of
the layers is equal to 74 mm. The orthogonal reinforcement mesh near each face in each direction is equal to
∅8− 140. Outside this region a minimum orthogonal reinforcement mesh is applied equal to ∅6− 100 near
each face in each direction. According to the crack width calculation, the maximum crack width will be equal to
0,35 mm, which fulfills the requirements of the maximum allowable crack width.
Figure 46: Reinforcement drawing for the
design with the Eurocode with
truss model 3, opening is 1 m
25
25 P4: +13600
8 - 140
8
- 1
40
hp 8 - 140
6
- 1
00
6 - 100
Mesh
Mesh
6 - 100
6 -
10
0
Mesh
6 - 100
6
- 1
00
P5: +17000
6
- 1
00
6 - 100Mesh
6
- 1
00
6 - 100Mesh
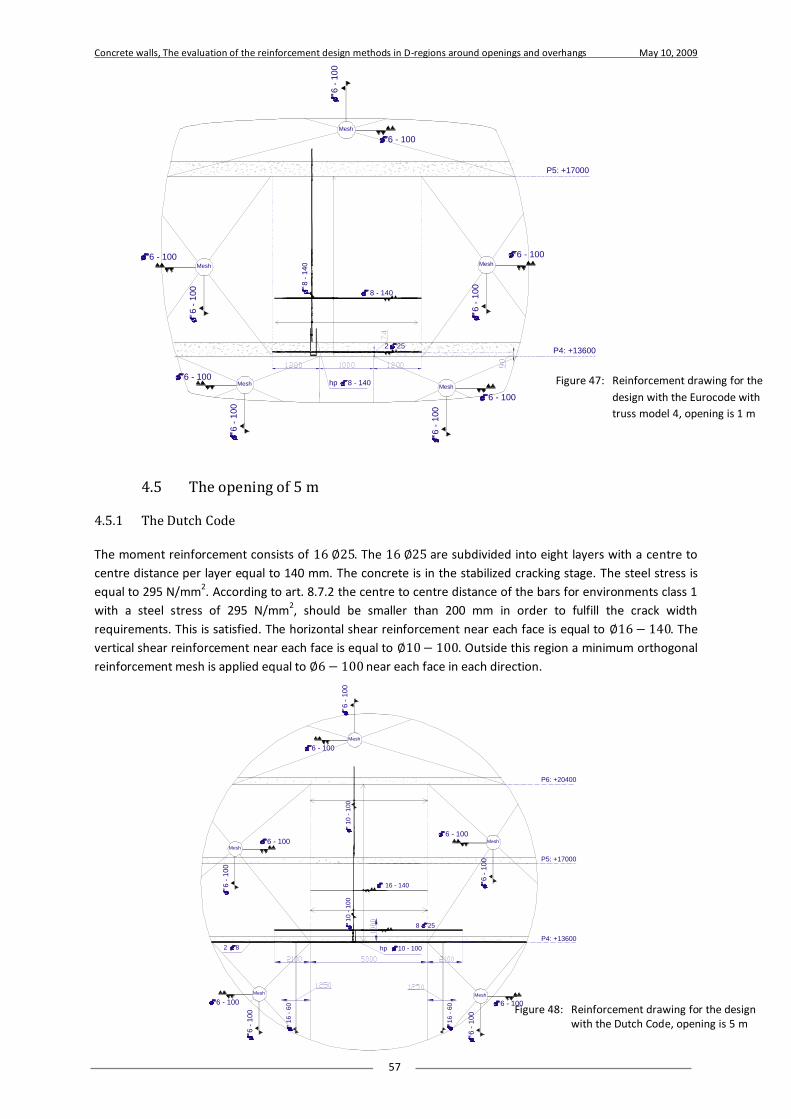
Concrete walls, The evaluation of the reinforcement design methods in D-regions around openings and overhangs May 10, 2009
57
4.5 The opening of 5 m
4.5.1 The Dutch Code
The moment reinforcement consists of 16 ∅25. The 16 ∅25 are subdivided into eight layers with a centre to
centre distance per layer equal to 140 mm. The concrete is in the stabilized cracking stage. The steel stress is
equal to 295 N/mm2. According to art. 8.7.2 the centre to centre distance of the bars for environments class 1
with a steel stress of 295 N/mm2, should be smaller than 200 mm in order to fulfill the crack width
requirements. This is satisfied. The horizontal shear reinforcement near each face is equal to ∅16− 140. The
vertical shear reinforcement near each face is equal to ∅10− 100. Outside this region a minimum orthogonal
reinforcement mesh is applied equal to ∅6− 100 near each face in each direction.
Figure 47: Reinforcement drawing for the
design with the Eurocode with
truss model 4, opening is 1 m
Figure 48: Reinforcement drawing for the design with the Dutch Code, opening is 5 m
2 25P4: +13600
8 - 140
8 -
140
hp 8 - 140
6
- 1
00
6 - 100
Mesh
Mesh
6 - 100
6
- 1
00
Mesh
6 - 100
6
- 1
00
P5: +17000
6
- 1
00
6 - 100Mesh
6
- 1
00
6 - 100Mesh
8 25
1
0 -
100
16
- 6
0
16
- 6
0
P6: +20400
2 8
10
- 1
00
16 - 140
P4: +13600
P5: +17000
6 - 100
Mesh
6
- 1
00
6
- 1
00
Mesh
6 - 100
6
- 1
00
Mesh 6 - 100
6
- 1
00
Mesh
6 - 100
hp 10 - 100
6
- 1
00
Mesh
6 - 100
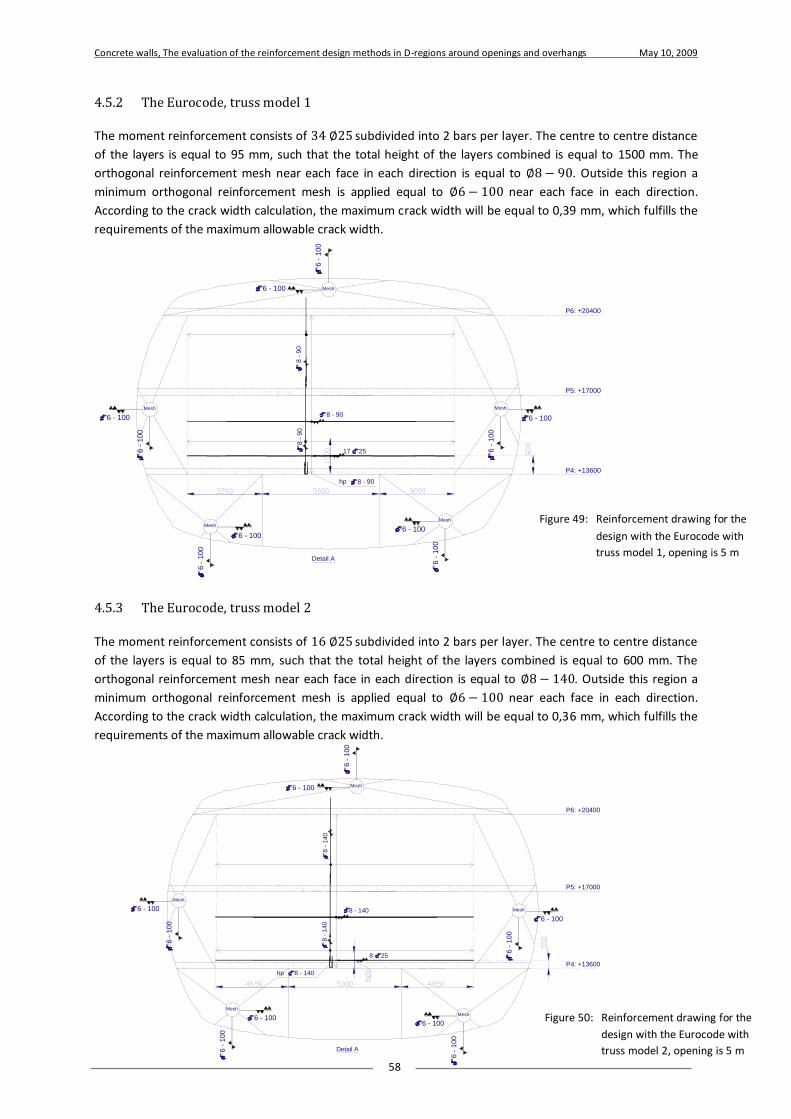
Concrete walls, The evaluation of the reinforcement design methods in D-regions around openings and overhangs May 10, 2009
58
4.5.2 The Eurocode, truss model 1
The moment reinforcement consists of 34 ∅25 subdivided into 2 bars per layer. The centre to centre distance
of the layers is equal to 95 mm, such that the total height of the layers combined is equal to 1500 mm. The
orthogonal reinforcement mesh near each face in each direction is equal to ∅8− 90. Outside this region a
minimum orthogonal reinforcement mesh is applied equal to ∅6− 100 near each face in each direction.
According to the crack width calculation, the maximum crack width will be equal to 0,39 mm, which fulfills the
requirements of the maximum allowable crack width.
4.5.3 The Eurocode, truss model 2
The moment reinforcement consists of 16 ∅25 subdivided into 2 bars per layer. The centre to centre distance
of the layers is equal to 85 mm, such that the total height of the layers combined is equal to 600 mm. The
orthogonal reinforcement mesh near each face in each direction is equal to ∅8− 140. Outside this region a
minimum orthogonal reinforcement mesh is applied equal to ∅6− 100 near each face in each direction.
According to the crack width calculation, the maximum crack width will be equal to 0,36 mm, which fulfills the
requirements of the maximum allowable crack width.
Figure 49: Reinforcement drawing for the
design with the Eurocode with
truss model 1, opening is 5 m
Figure 50: Reinforcement drawing for the
design with the Eurocode with
truss model 2, opening is 5 m
8 -
90
8 - 90
P4: +13600
P5: +17000
Detail A
hp 8 - 90
P6: +20400
17 25
8 -
90
6
- 1
00
6 - 100 Mesh
Mesh
6 - 100
6
- 1
00
6
- 1
00
6 - 100
Mesh
6
- 1
00
6 - 100
Mesh
6
- 1
00
6 - 100
Mesh
6
- 1
00
6 - 100 Mesh
Mesh
6 - 100
6
- 1
00
Mesh
6 - 100
6
- 1
00
Mesh
6 - 100
6
- 1
00
Mesh
6 - 100
6
- 1
00
P6: +20400
8 25
8
- 1
40
hp 8 - 140
8 -
140
8 - 140
P4: +13600
P5: +17000
Detail A

Concrete walls, The evaluation of the reinforcement design methods in D-regions around openings and overhangs May 10, 2009
59
4.5.4 The Eurocode, truss model 3
The moment reinforcement consists of two reinforcement ties positioned at a height of 180 mm and 4500 mm
from the opening level. Each tie consists of 8 ∅25, subdivided into 2 bars per layer. The centre to centre
distance of the layers of the lowest tie is equal to 85 mm, such that the total height of the layers combined is
250 mm. The centre to centre distance of the layers of the upper tie is equal to 60 mm, such that the total
height of the layers is equal to 180 mm. The orthogonal reinforcement mesh near each face in each direction is
equal to ∅8− 140. Outside this region a minimum orthogonal reinforcement mesh is applied equal to
∅6− 100 near each face in each direction. According to the crack width calculation, the maximum crack width
will be equal to 0,39 mm, which fulfills the requirements of the maximum allowable crack width.
4.5.5 The Eurocode, truss model 4
The moment reinforcement consists of 16 ∅25 subdivided into 2 bars per layer. The centre to centre distance
of the layers is equal to 90 mm, such that the total height of the layers combined is equal to 640 mm. The
orthogonal reinforcement mesh near each face in each direction is equal to ∅8− 140. Outside this region a
minimum orthogonal reinforcement mesh is applied equal to ∅6− 100 near each face in each direction.
According to the crack width calculation, the maximum crack width will be equal to 0,38 mm, which fulfills the
requirements of the maximum allowable crack width.
Figure 51: Reinforcement drawing for the
design with the Eurocode with
truss model 3, opening is 5 m
6 - 100
6
- 1
00
Mesh
6 - 100
6 -
10
0
Mesh
6 - 100
6
- 1
00
Mesh
6 - 100
6
- 1
00
P7: +23800
4 25
8 -
14
0
P6: +20400
4 25
8 -
14
0
8
- 1
40
8 - 140
P4: +13600
P5: +17000
Mesh
6 - 100
6
- 1
00
Mesh
hp 8 - 140
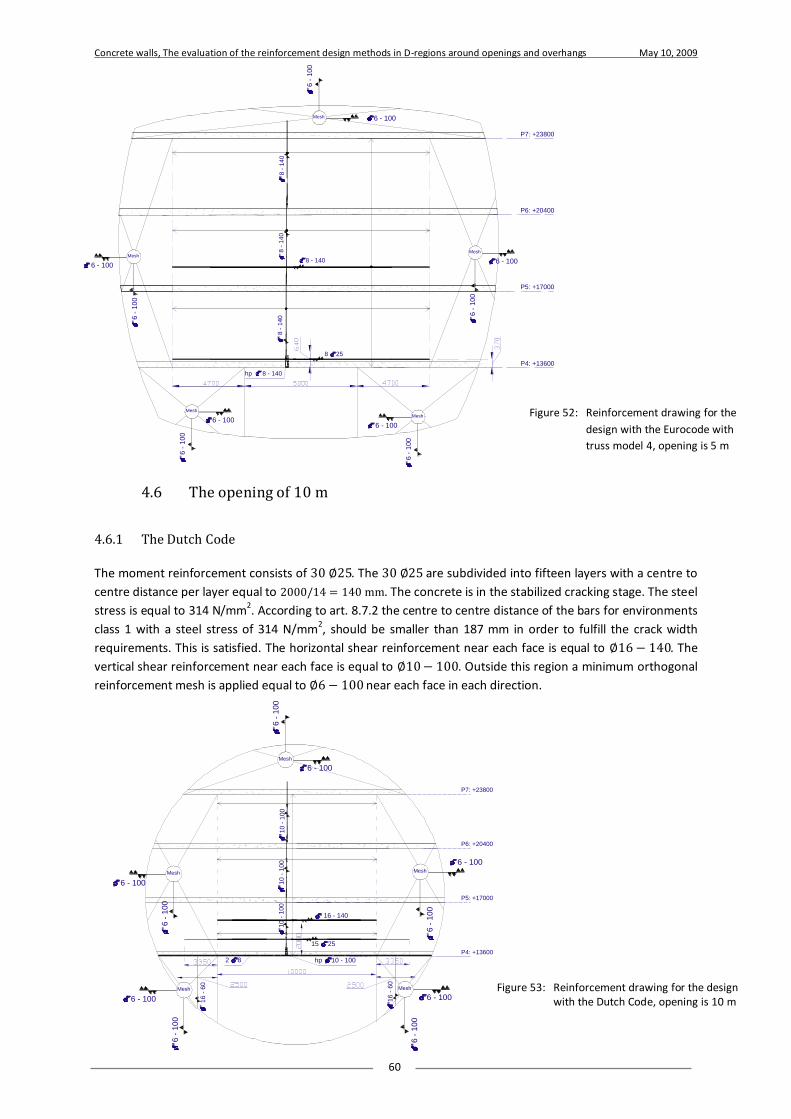
Concrete walls, The evaluation of the reinforcement design methods in D-regions around openings and overhangs May 10, 2009
60
4.6 The opening of 10 m
4.6.1 The Dutch Code
The moment reinforcement consists of 30 ∅25. The 30 ∅25 are subdivided into fifteen layers with a centre to
centre distance per layer equal to 2000/14 = 140 mm. The concrete is in the stabilized cracking stage. The steel
stress is equal to 314 N/mm2. According to art. 8.7.2 the centre to centre distance of the bars for environments
class 1 with a steel stress of 314 N/mm2, should be smaller than 187 mm in order to fulfill the crack width
requirements. This is satisfied. The horizontal shear reinforcement near each face is equal to ∅16− 140. The
vertical shear reinforcement near each face is equal to ∅10− 100. Outside this region a minimum orthogonal
reinforcement mesh is applied equal to ∅6− 100 near each face in each direction.
Figure 52: Reinforcement drawing for the
design with the Eurocode with
truss model 4, opening is 5 m
Figure 53: Reinforcement drawing for the design with the Dutch Code, opening is 10 m
8 -
140
8 25
P6: +20400
8 -
140
P7: +23800
hp 8 - 140
8
- 1
40
8 - 140
P4: +13600
P5: +17000
Mesh 6 - 100
6
- 1
00
Mesh
6 - 100
6
- 1
00
Mesh
6 - 100
6
- 1
00
Mesh
6 - 100
6
- 1
00
Mesh
6 - 100
6
- 1
00
Mesh
6
- 1
00
6 - 100
Mesh
6
- 1
00
6 - 100
6
- 1
00
6 - 100
Mesh
16 - 140
P4: +13600
P5: +17000
15 25
P6: +20400
2 8
P7: +23800
10
- 1
00
hp 10 - 100
10
- 1
00
10
- 1
00
16 -
60
16 -
60
Mesh
6
- 1
00
6 - 100
Mesh
6 - 100
6
- 1
00
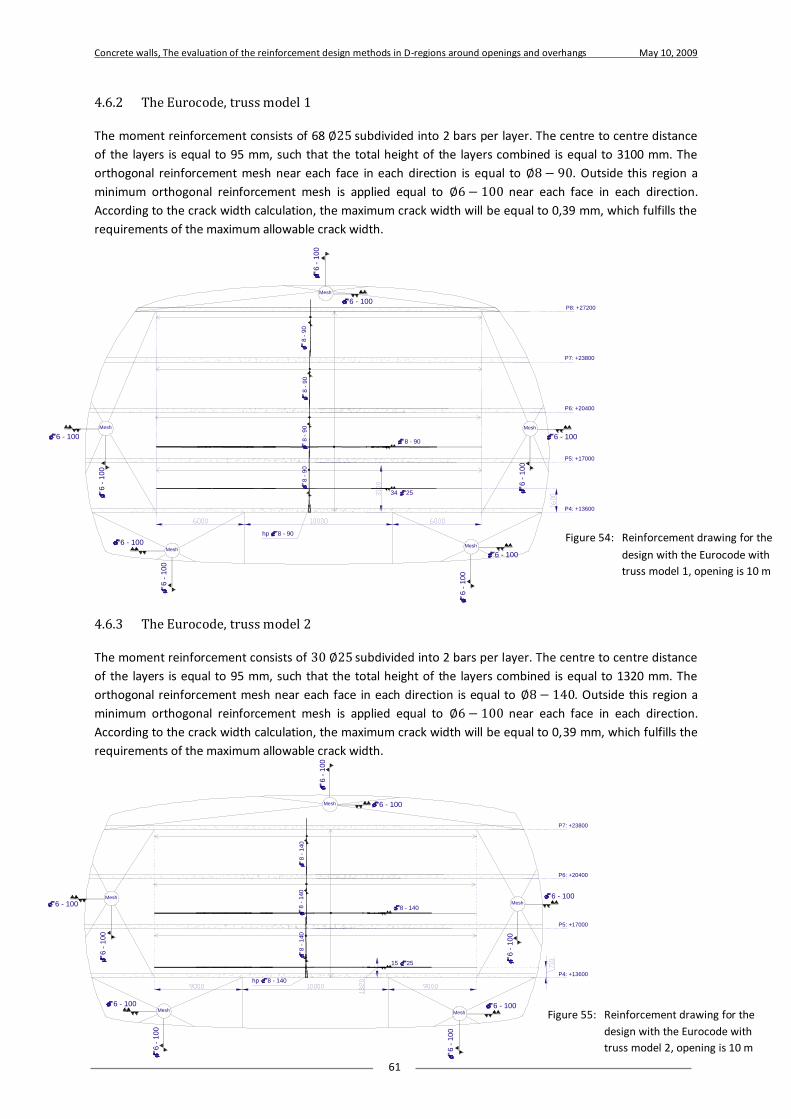
Concrete walls, The evaluation of the reinforcement design methods in D-regions around openings and overhangs May 10, 2009
61
4.6.2 The Eurocode, truss model 1
The moment reinforcement consists of 68 ∅25 subdivided into 2 bars per layer. The centre to centre distance
of the layers is equal to 95 mm, such that the total height of the layers combined is equal to 3100 mm. The
orthogonal reinforcement mesh near each face in each direction is equal to ∅8− 90. Outside this region a
minimum orthogonal reinforcement mesh is applied equal to ∅6− 100 near each face in each direction.
According to the crack width calculation, the maximum crack width will be equal to 0,39 mm, which fulfills the
requirements of the maximum allowable crack width.
4.6.3 The Eurocode, truss model 2
The moment reinforcement consists of 30 ∅25 subdivided into 2 bars per layer. The centre to centre distance
of the layers is equal to 95 mm, such that the total height of the layers combined is equal to 1320 mm. The
orthogonal reinforcement mesh near each face in each direction is equal to ∅8− 140. Outside this region a
minimum orthogonal reinforcement mesh is applied equal to ∅6− 100 near each face in each direction.
According to the crack width calculation, the maximum crack width will be equal to 0,39 mm, which fulfills the
requirements of the maximum allowable crack width.
Figure 54: Reinforcement drawing for the
design with the Eurocode with
truss model 1, opening is 10 m
Figure 55: Reinforcement drawing for the
design with the Eurocode with
truss model 2, opening is 10 m
6
- 1
00
6 - 100Mesh
6
- 1
00
6 - 100
Mesh Mesh
6 - 100
6
- 1
00
Mesh
6 - 100
6
- 1
00
Mesh
6 - 100
6
- 1
00
34 25
P8: +27200
8 -
90
8 -
90
P6: +20400
P7: +23800
8 -
90
hp 8 - 90
8 -
90
P4: +13600
P5: +17000
8 - 90
6
- 1
00
6 - 100Mesh
6
- 1
00
6 - 100Mesh
Mesh
6 - 100
6
- 1
00
6
- 1
00
6 - 100Mesh
6
- 1
00
6 - 100Mesh
P4: +13600
P5: +17000
P6: +20400
P7: +23800
8 -
140
hp 8 - 140
8 -
140
8 - 140
15 25
8 -
140
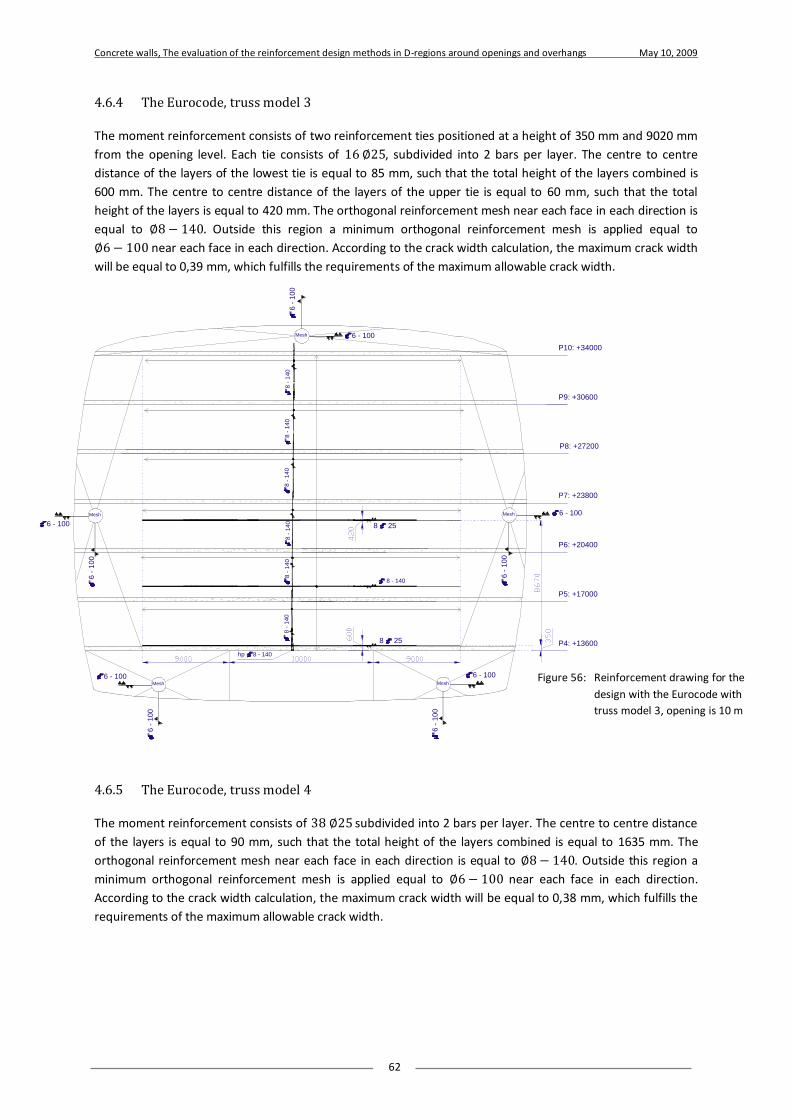
Concrete walls, The evaluation of the reinforcement design methods in D-regions around openings and overhangs May 10, 2009
62
4.6.4 The Eurocode, truss model 3
The moment reinforcement consists of two reinforcement ties positioned at a height of 350 mm and 9020 mm
from the opening level. Each tie consists of 16 ∅25, subdivided into 2 bars per layer. The centre to centre
distance of the layers of the lowest tie is equal to 85 mm, such that the total height of the layers combined is
600 mm. The centre to centre distance of the layers of the upper tie is equal to 60 mm, such that the total
height of the layers is equal to 420 mm. The orthogonal reinforcement mesh near each face in each direction is
equal to ∅8− 140. Outside this region a minimum orthogonal reinforcement mesh is applied equal to
∅6− 100 near each face in each direction. According to the crack width calculation, the maximum crack width
will be equal to 0,39 mm, which fulfills the requirements of the maximum allowable crack width.
4.6.5 The Eurocode, truss model 4
The moment reinforcement consists of 38 ∅25 subdivided into 2 bars per layer. The centre to centre distance
of the layers is equal to 90 mm, such that the total height of the layers combined is equal to 1635 mm. The
orthogonal reinforcement mesh near each face in each direction is equal to ∅8− 140. Outside this region a
minimum orthogonal reinforcement mesh is applied equal to ∅6− 100 near each face in each direction.
According to the crack width calculation, the maximum crack width will be equal to 0,38 mm, which fulfills the
requirements of the maximum allowable crack width.
Figure 56: Reinforcement drawing for the
design with the Eurocode with
truss model 3, opening is 10 m
8 - 140
P4: +13600
P5: +17000
P6: +20400
P7: +23800
8 -
14
0
hp 8 - 140
8 -
14
0
8 25
P8: +27200
8 -
14
0
8
- 1
40
P10: +34000
P9: +30600
8 25
8 -
14
0
8
- 1
40
6
- 1
00
6 - 100Mesh
6
- 1
00
6 - 100
Mesh
Mesh
6 - 100
6
- 1
00
Mesh 6 - 100
6
- 1
00
Mesh 6 - 100
6
- 1
00
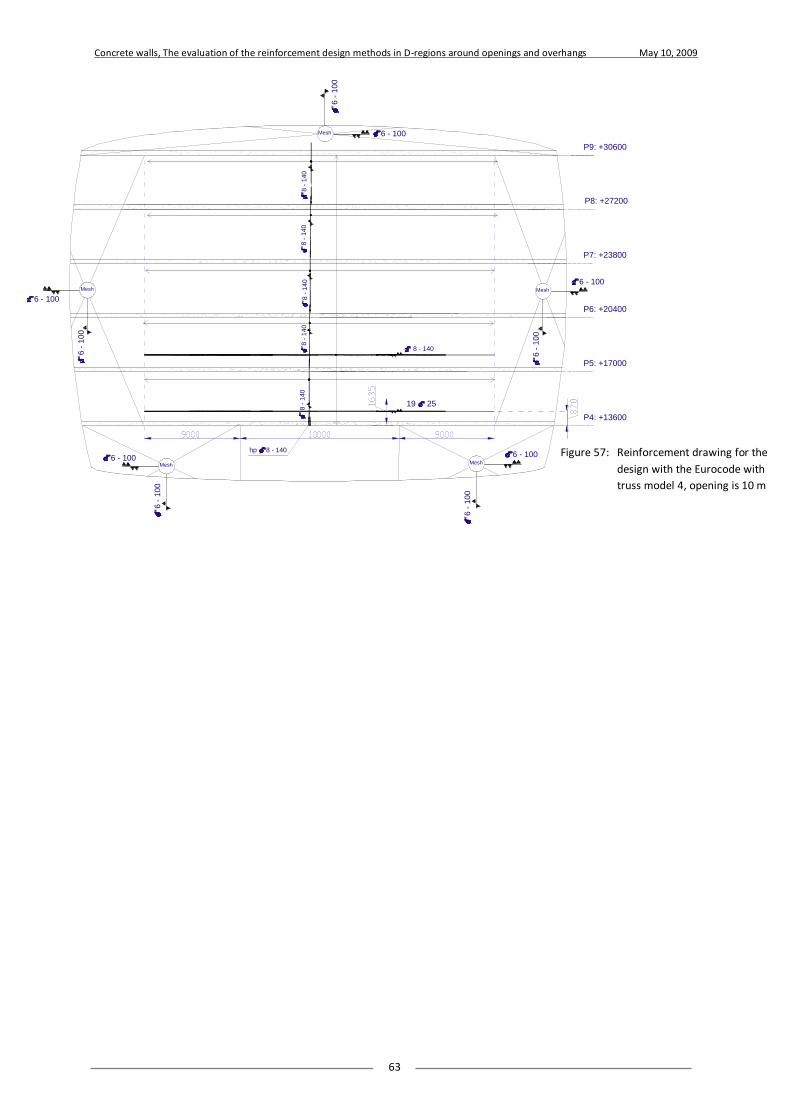
Concrete walls, The evaluation of the reinforcement design methods in D-regions around openings and overhangs May 10, 2009
63
Figure 57: Reinforcement drawing for the
design with the Eurocode with
truss model 4, opening is 10 m
6
- 1
00
6 - 100Mesh
6
- 1
00
6 - 100Mesh
8 - 140
P4: +13600
P5: +17000
19 25
P8: +27200
8
- 1
40
8
- 1
40
P9: +30600
8
- 1
40
P6: +20400
P7: +23800
8
- 1
40
hp 8 - 140
8
- 1
40
6
- 1
00
6 - 100Mesh
6
- 1
00
6 - 100
Mesh
Mesh
6 - 100
6
- 1
00
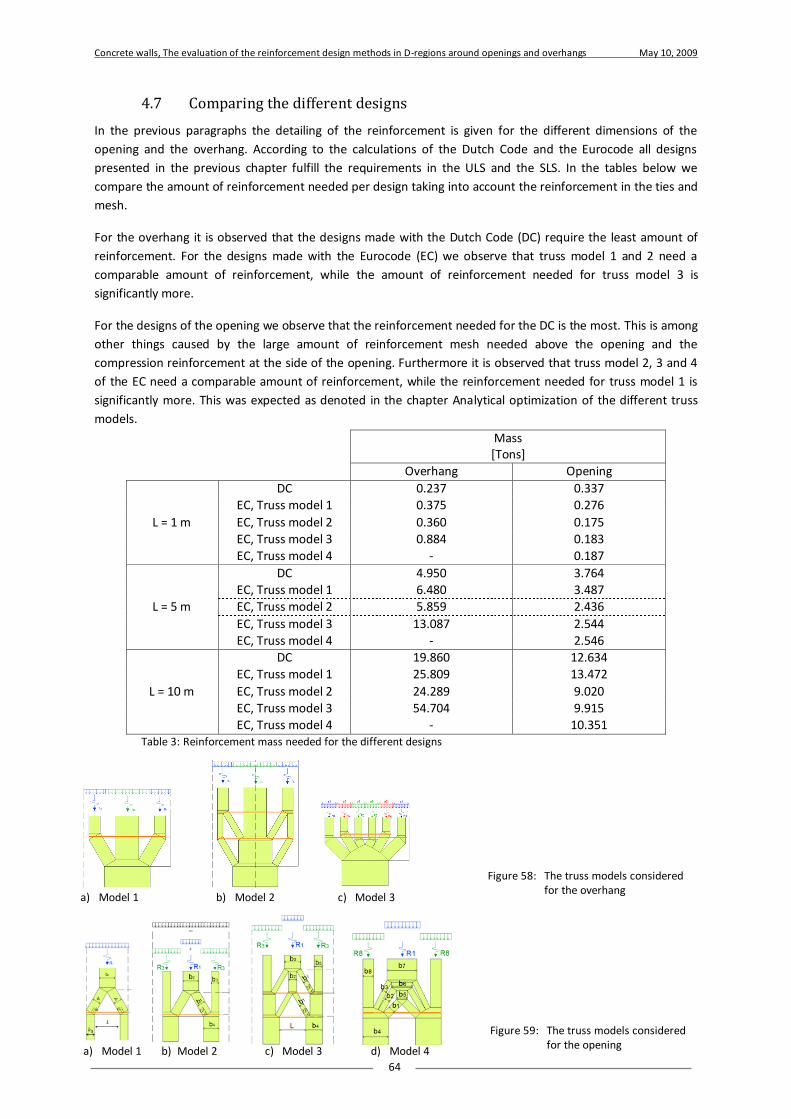
Concrete walls, The evaluation of the reinforcement design methods in D-regions around openings and overhangs May 10, 2009
64
4.7 Comparing the different designs
In the previous paragraphs the detailing of the reinforcement is given for the different dimensions of the
opening and the overhang. According to the calculations of the Dutch Code and the Eurocode all designs
presented in the previous chapter fulfill the requirements in the ULS and the SLS. In the tables below we
compare the amount of reinforcement needed per design taking into account the reinforcement in the ties and
mesh.
For the overhang it is observed that the designs made with the Dutch Code (DC) require the least amount of
reinforcement. For the designs made with the Eurocode (EC) we observe that truss model 1 and 2 need a
comparable amount of reinforcement, while the amount of reinforcement needed for truss model 3 is
significantly more.
For the designs of the opening we observe that the reinforcement needed for the DC is the most. This is among
other things caused by the large amount of reinforcement mesh needed above the opening and the
compression reinforcement at the side of the opening. Furthermore it is observed that truss model 2, 3 and 4
of the EC need a comparable amount of reinforcement, while the reinforcement needed for truss model 1 is
significantly more. This was expected as denoted in the chapter Analytical optimization of the different truss
models.
Mass [Tons]
Overhang Opening
L = 1 m
DC 0.237 0.337
EC, Truss model 1 0.375 0.276
EC, Truss model 2 0.360 0.175
EC, Truss model 3 0.884 0.183
EC, Truss model 4 - 0.187
L = 5 m
DC 4.950 3.764 EC, Truss model 1 6.480 3.487
EC, Truss model 2 5.859 2.436
EC, Truss model 3 13.087 2.544
EC, Truss model 4 - 2.546
L = 10 m
DC 19.860 12.634
EC, Truss model 1 25.809 13.472
EC, Truss model 2 24.289 9.020 EC, Truss model 3 54.704 9.915
EC, Truss model 4 - 10.351 Table 3: Reinforcement mass needed for the different designs
Figure 58: The truss models considered for the overhang
a) Model 1 b) Model 2 c) Model 3
a) Model 1 b) Model 2 c) Model 3 d) Model 4
Figure 59: The truss models considered for the opening

Concrete walls, The evaluation of the reinforcement design methods in D-regions around openings and overhangs May 10, 2009
65
5. Evaluation of the designs with ATENA
In this chapter a nonlinear elastic finite element program is used in order to simulate and compare the
behavior of the designed cases in reality. In consultation with the committee members, ATENA is chosen for
this purpose.
ATENA is a Nonlinear Finite Element program written by Červenka Consulting group in order to analyze
(un)reinforced and /or prestressed concrete structures. With this program it is possible to simulate the real
behavior of concrete structures including concrete cracking, concrete crushing and reinforcement yielding.
Several investigations show that analyses performed with ATENA give comparable results to the one found by
real experiments, such as Leonhardt’s shear beam test, prestressed concrete beam test, shear wall with an
opening, bond failure test and more (Ref. 12). For the cases investigated in this report, ATENA 2D version 4.1.1
has been used.
5.1 Pre-processing
5.1.1 Material properties
In this research ATENA is used in order to simulate the designed cases in reality. In order to do so, the average
values for the properties of the concrete should be incorporated in ATENA without the addition of any
(material) safety factors. However, in order to obtain results which are verged to the safe side, the (5%)
characteristic values are chosen for properties involving the strength conditions. The same holds for the
reinforcement properties, which are modeled using a bilinear stress-strain diagram. The reinforcement bond,
taking into account the transfer of forces between the concrete and the reinforcement, is generated using
confined concrete, ribbed reinforcement and good bond quality.
The different parameters for the concrete, reinforcement and reinforcement bond are generated using settings
in ATENA based on CEB-FIB Model Code 1990. The most important variables are listed below.
ATENA concrete properties
𝑓𝑐𝑘 ,𝑐𝑢𝑏𝑒 [MPa] 45
𝑓𝑐 [MPa] 38.25
𝑓𝑡 [MPa] 3.036
𝜇 [-] 0.2
𝐸 [MPa] 35570
𝐺𝑓 [N/m] 75.91
ATENA reinforcement properties
Stress-strain law Bilinear
𝜎𝑦 [MPa] 500
𝐸 [MPa] 210000
ATENA reinforcement bond properties
Bond stress [MPa]
Slip [mm]
5.5000 0.00
7.2215 0.25
10.423 0.50
13.750 1.00
13.750 3.00
5.5000 15.00
5.5000 1000.00
Table 4: Material properties in ATENA
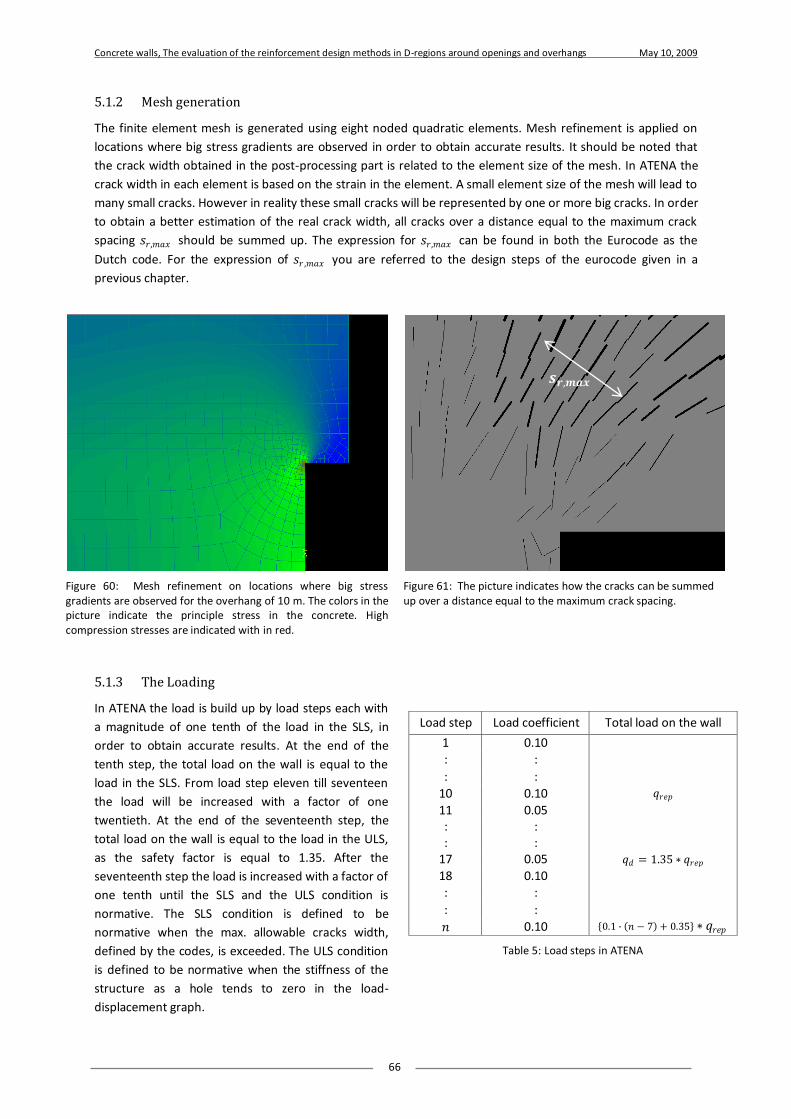
Concrete walls, The evaluation of the reinforcement design methods in D-regions around openings and overhangs May 10, 2009
66
5.1.2 Mesh generation
The finite element mesh is generated using eight noded quadratic elements. Mesh refinement is applied on
locations where big stress gradients are observed in order to obtain accurate results. It should be noted that
the crack width obtained in the post-processing part is related to the element size of the mesh. In ATENA the
crack width in each element is based on the strain in the element. A small element size of the mesh will lead to
many small cracks. However in reality these small cracks will be represented by one or more big cracks. In order
to obtain a better estimation of the real crack width, all cracks over a distance equal to the maximum crack
spacing 𝑠𝑟,𝑚𝑎𝑥 should be summed up. The expression for 𝑠𝑟,𝑚𝑎𝑥 can be found in both the Eurocode as the
Dutch code. For the expression of 𝑠𝑟 ,𝑚𝑎𝑥 you are referred to the design steps of the eurocode given in a
previous chapter.
5.1.3 The Loading
In ATENA the load is build up by load steps each with
a magnitude of one tenth of the load in the SLS, in
order to obtain accurate results. At the end of the
tenth step, the total load on the wall is equal to the
load in the SLS. From load step eleven till seventeen
the load will be increased with a factor of one
twentieth. At the end of the seventeenth step, the
total load on the wall is equal to the load in the ULS,
as the safety factor is equal to 1.35. After the
seventeenth step the load is increased with a factor of
one tenth until the SLS and the ULS condition is
normative. The SLS condition is defined to be
normative when the max. allowable cracks width,
defined by the codes, is exceeded. The ULS condition
is defined to be normative when the stiffness of the
structure as a hole tends to zero in the load-
displacement graph.
Figure 60: Mesh refinement on locations where big stress gradients are observed for the overhang of 10 m. The colors in the picture indicate the principle stress in the concrete. High compression stresses are indicated with in red.
Figure 61: The picture indicates how the cracks can be summed up over a distance equal to the maximum crack spacing.
𝒔𝒓,𝒎𝒂𝒙
Load step Load coefficient Total load on the wall
1 0.10
𝑞𝑟𝑒𝑝
: :
: :
10 0.10 11 0.05
𝑞𝑑 = 1.35 ∗ 𝑞𝑟𝑒𝑝
: : : :
17 0.05 18 0.10
0.1 ∙ 𝑛 − 7 + 0.35 ∗ 𝑞𝑟𝑒𝑝
: :
: :
𝑛 0.10
Table 5: Load steps in ATENA
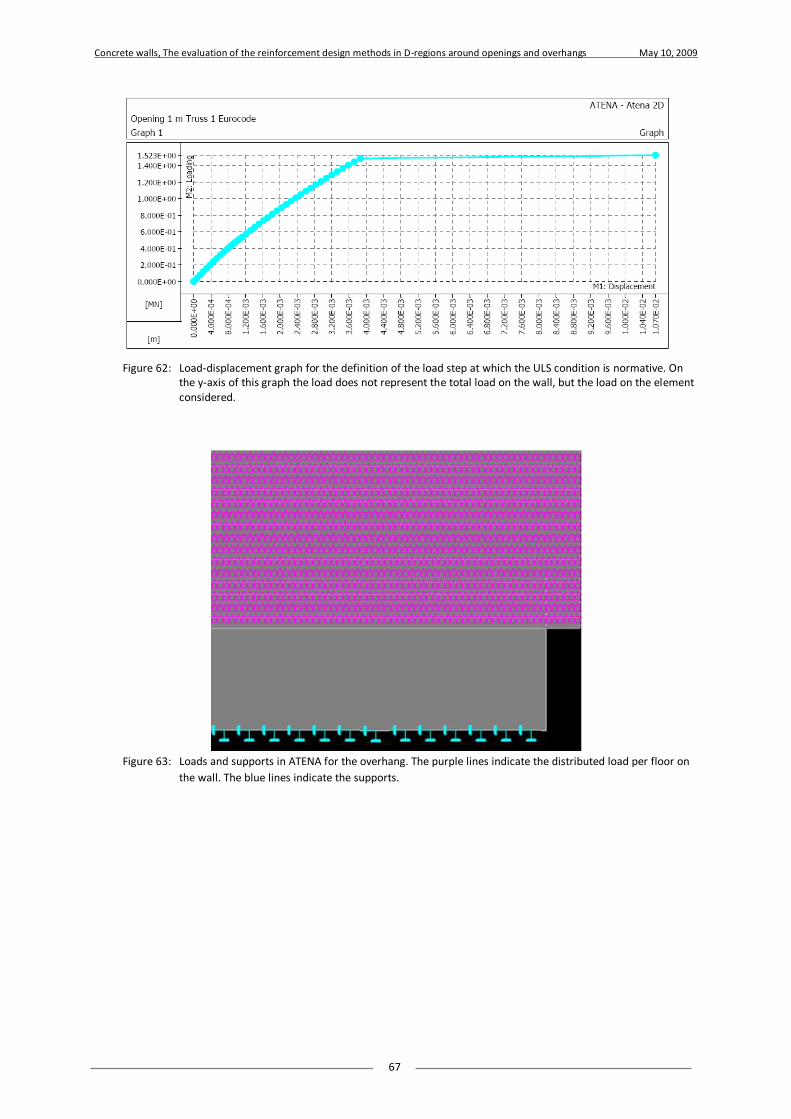
Concrete walls, The evaluation of the reinforcement design methods in D-regions around openings and overhangs May 10, 2009
67
Figure 62: Load-displacement graph for the definition of the load step at which the ULS condition is normative. On the y-axis of this graph the load does not represent the total load on the wall, but the load on the element considered.
Figure 63: Loads and supports in ATENA for the overhang. The purple lines indicate the distributed load per floor on
the wall. The blue lines indicate the supports.

Concrete walls, The evaluation of the reinforcement design methods in D-regions around openings and overhangs May 10, 2009
68
5.2 Post-processing
After obtaining the results for the different designs it turned out that all designs satisfy the SLS and ULS criterion. It is even observed that the very first crack initiates at a load bigger than the load accounted for in the designs. From these results two conclusions could be made, videlicet:
- The design methods of the Dutch code and the Eurocode are conservative methods for the reinforcement design of the observed cases;
- The cases considered will fulfill the SLS and ULS conditions with unreinforced concrete, as the first cracks initiates at a load bigger than the one accounted for in the designs (SLS and ULS).
The second conclusion is very surprising. In order to verify this in ATENA, it is decided to simulate the cases
considered with unreinforced concrete.
5.2.1 Simulation of the cases with unreinforced concrete
The results obtained with this simulation are represented in tables, like the one on this page. In these tables
the crack width is given for the SLS condition of the designs (load step 10), the max. compressive and tensile
stress in the concrete for the ULS condition of the design (load step 17), the factor between the loading in
ATENA and 𝑞𝑟𝑒𝑝 of the designs for which the SLS condition is normative and finally the factor between the
loading in ATENA and 𝑞𝑑 of the designs for which the ULS condition is normative.
For the overhang it turns out that the crack width requirements in the SLS condition (load step 10) are met as
well as the strength requirements in the ULS condition (load step 17). Furthermore the SLS and ULS condition
will be satisfied up to a load equal to 2 times the load which is present in the designs, see table below.
Overhang
1 m 5 m 10 m
SLS condition design (load step 10)
Crack width [mm]
- - -
ULS condition design (load step 17)
max. compressive stress in concrete [MPa] 19 22 23
max. tensile stress in concrete [MPa] 0.83 0.87 1.23
SLS condition normative
𝑞𝑙𝑜𝑎𝑑𝑖𝑛𝑔 𝐴𝑇𝐸𝑁𝐴 / 𝑞𝑟𝑒𝑝
3.0 2.6 2.0
ULS condition normative
𝑞𝑙𝑜𝑎𝑑𝑖𝑛𝑔 𝐴𝑇𝐸𝑁𝐴 / 𝑞𝑑 2.2 2.0 2.0
Table 6: Results of the unreinforced concrete wall with an overhang of 1 m, 5 m and 10 m.
For the opening it can also be verified that the crack width requirements in the SLS condition (load step 10) are
met as well as the strength requirements in the ULS condition (load step 17). However we see a clear division
in the results obtained for the opening of 1 m and the opening of 5 m and 10 m. For the opening of 1 m we see
that the highest load at which all the requirements are satisfied, is equal to 2.7 times the load which is present
in the designs. For the dimensions of 5 m and 10 m we see that the highest load at which all the requirements
are satisfied, is equal to 1.1 times the load which is present in the designs. The reason for this division is the
initiation of the first crack, which in the case of the opening of 5 m and 10 m occurs at al load equal to 1.1 times
the load which is present in the design. It is observed that for these dimensions the first crack has a
considerable width in the order of 0.5 mm.
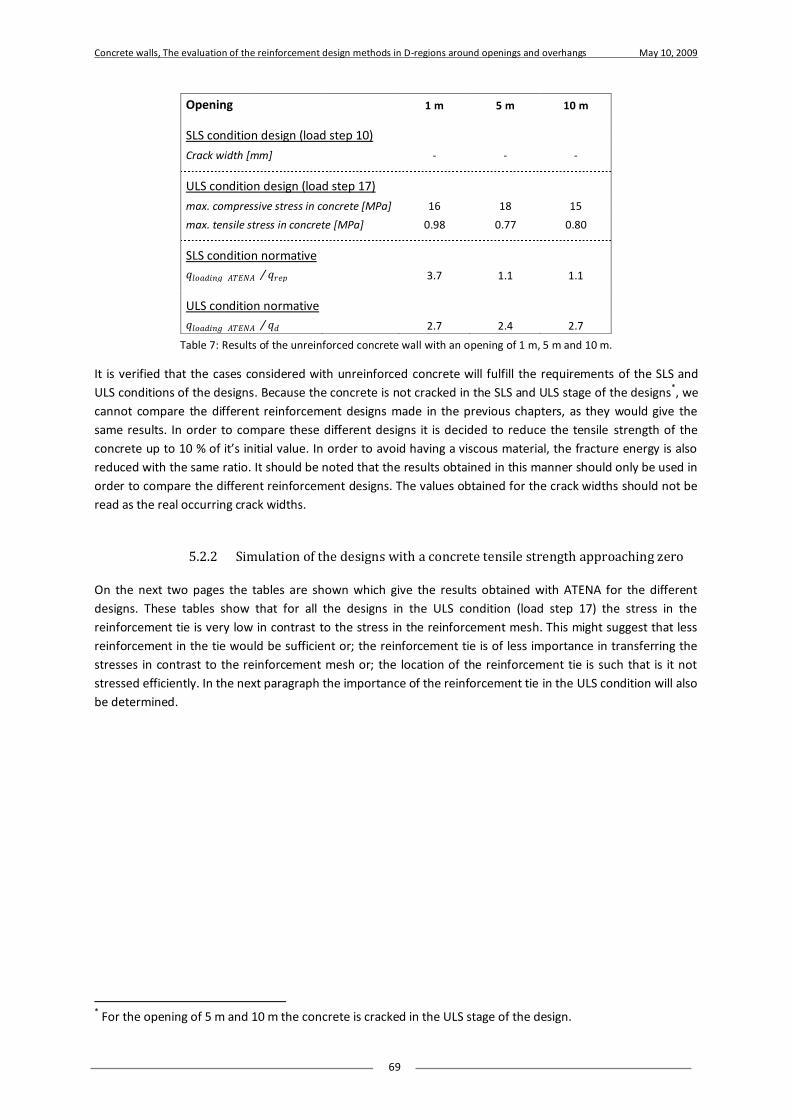
Concrete walls, The evaluation of the reinforcement design methods in D-regions around openings and overhangs May 10, 2009
69
Opening
1 m 5 m 10 m
SLS condition design (load step 10)
Crack width [mm]
- - -
ULS condition design (load step 17)
max. compressive stress in concrete [MPa] 16 18 15
max. tensile stress in concrete [MPa] 0.98 0.77 0.80
SLS condition normative
𝑞𝑙𝑜𝑎𝑑𝑖𝑛𝑔 𝐴𝑇𝐸𝑁𝐴 / 𝑞𝑟𝑒𝑝
3.7 1.1 1.1
ULS condition normative
𝑞𝑙𝑜𝑎𝑑𝑖𝑛𝑔 𝐴𝑇𝐸𝑁𝐴 / 𝑞𝑑 2.7 2.4 2.7
Table 7: Results of the unreinforced concrete wall with an opening of 1 m, 5 m and 10 m.
It is verified that the cases considered with unreinforced concrete will fulfill the requirements of the SLS and
ULS conditions of the designs. Because the concrete is not cracked in the SLS and ULS stage of the designs*, we
cannot compare the different reinforcement designs made in the previous chapters, as they would give the
same results. In order to compare these different designs it is decided to reduce the tensile strength of the
concrete up to 10 % of it’s initial value. In order to avoid having a viscous material, the fracture energy is also
reduced with the same ratio. It should be noted that the results obtained in this manner should only be used in
order to compare the different reinforcement designs. The values obtained for the crack widths should not be
read as the real occurring crack widths.
5.2.2 Simulation of the designs with a concrete tensile strength approaching zero
On the next two pages the tables are shown which give the results obtained with ATENA for the different
designs. These tables show that for all the designs in the ULS condition (load step 17) the stress in the
reinforcement tie is very low in contrast to the stress in the reinforcement mesh. This might suggest that less
reinforcement in the tie would be sufficient or; the reinforcement tie is of less importance in transferring the
stresses in contrast to the reinforcement mesh or; the location of the reinforcement tie is such that is it not
stressed efficiently. In the next paragraph the importance of the reinforcement tie in the ULS condition will also
be determined.
* For the opening of 5 m and 10 m the concrete is cracked in the ULS stage of the design.

Concrete walls, The evaluation of the reinforcement design methods in D-regions around openings and overhangs May 10, 2009
70
Overhang 1 m
DC EC
Truss 1 Truss 2 Truss 3
SLS condition design (load step 10)
Crack width [mm]
0.34 0.31 0.26 0.07
ULS condition design (load step 17)
max. compressive stress in concrete [MPa] 23 26 25 27
max. tensile stress in reinforcement tie [MPa] 67 51 46 30
max. tensile stress in reinforcement mesh [MPa] 155 99 119 49
SLS condition normative
𝑞𝑙𝑜𝑎𝑑𝑖𝑛𝑔 𝐴𝑇𝐸𝑁𝐴 / 𝑞𝑟𝑒𝑝
1.1 1.3 1.3 1.7
ULS condition normative
𝑞𝑙𝑜𝑎𝑑𝑖𝑛𝑔 𝐴𝑇𝐸𝑁𝐴 / 𝑞𝑑 1.7 2.1 2.1 2.1
Overhang 5 m
DC EC
Truss 1 Truss 2 Truss 3
SLS condition design (load step 10)
Crack width [mm]
0.58 0.52 0.54 0.31
ULS condition design (load step 17)
max. compressive stress in concrete [MPa] 21 25 35 31
max. tensile stress in reinforcement tie [MPa] 46 43 66 37
max. tensile stress in reinforcement mesh [MPa] 104 111 178 51
SLS condition normative
𝑞𝑙𝑜𝑎𝑑𝑖𝑛𝑔 𝐴𝑇𝐸𝑁𝐴 / 𝑞𝑟𝑒𝑝
0.7 0.7 0.6 1.2
ULS condition normative
𝑞𝑙𝑜𝑎𝑑𝑖𝑛𝑔 𝐴𝑇𝐸𝑁𝐴 / 𝑞𝑑 1.5 1.7 1.5 1.7
Overhang 10 m
DC EC
Truss 1 Truss 2 Truss 3
SLS condition design (load step 10)
Crack width [mm]
0.84 1.08 1.19 0.44
ULS condition design (load step 17)
max. compressive stress in concrete [MPa] 34 34 34 34
max. tensile stress in reinforcement tie [MPa] 81 68 82 49
max. tensile stress in reinforcement mesh [MPa] 197 203 248 83
SLS condition normative
𝑞𝑙𝑜𝑎𝑑𝑖𝑛𝑔 𝐴𝑇𝐸𝑁𝐴 / 𝑞𝑟𝑒𝑝
0.5 0.5 0.5 0.9
ULS condition normative
𝑞𝑙𝑜𝑎𝑑𝑖𝑛𝑔 𝐴𝑇𝐸𝑁𝐴 / 𝑞𝑑 1.3 1.3 1.3 1.4
Table 8: Comparing the results for the designs of the overhang of 1 m, 5 m and 10 m.

Concrete walls, The evaluation of the reinforcement design methods in D-regions around openings and overhangs May 10, 2009
71
Opening 1 m
DC EC
Truss 1 Truss 2 Truss 3 Truss 4
SLS condition design (load step 10)
Crack width [mm]
0.12 0.09 0.11 0.13 0.11
ULS condition design (load step 17)
max. compressive stress in concrete [MPa] 17 18 17 17 17
max. tensile stress in reinforcement tie [MPa] 22 24 23 25 23
max. tensile stress in reinforcement mesh [MPa] 35 93 61 65 63
SLS condition normative
𝑞𝑙𝑜𝑎𝑑𝑖𝑛𝑔 𝐴𝑇𝐸𝑁𝐴 / 𝑞𝑟𝑒𝑝
2.4 2.4 2.3 2.3 2.3
ULS condition normative
𝑞𝑙𝑜𝑎𝑑𝑖𝑛𝑔 𝐴𝑇𝐸𝑁𝐴 / 𝑞𝑑 3.1 2.8 2.9 2.9 3.0
Opening 5 m
DC EC
Truss 1 Truss 2 Truss 3 Truss 4
SLS condition design (load step 10)
Crack width [mm]
0.23 0.24 0.32 0.25 0.24
ULS condition design (load step 17)
max. compressive stress in concrete [MPa] 19 25 18 18 18
max. tensile stress in reinforcement tie [MPa] 25 30 23 22 27
max. tensile stress in reinforcement mesh [MPa] 59 99 103 97 97
SLS condition normative
𝑞𝑙𝑜𝑎𝑑𝑖𝑛𝑔 𝐴𝑇𝐸𝑁𝐴 / 𝑞𝑟𝑒𝑝
1.6 1.5 1.2 1.3 1.4
ULS condition normative
𝑞𝑙𝑜𝑎𝑑𝑖𝑛𝑔 𝐴𝑇𝐸𝑁𝐴 / 𝑞𝑑 2.9 2.4 2.8 2.9 2.8
Opening 10 m
DC EC
Truss 1 Truss 2 Truss 3 Truss 4
SLS condition design (load step 10)
Crack width [mm]
0.32 0.30 0.32 0.34 0.33
ULS condition design (load step 17)
max. compressive stress in concrete [MPa] 22 18 18 18 18
max. tensile stress in reinforcement tie [MPa] 27 25 24 22 24
max. tensile stress in reinforcement mesh [MPa] 57 45 62 66 59
SLS condition normative
𝑞𝑙𝑜𝑎𝑑𝑖𝑛𝑔 𝐴𝑇𝐸𝑁𝐴 / 𝑞𝑟𝑒𝑝
0.9 1.2 1.2 1.1 1.1
ULS condition normative
𝑞𝑙𝑜𝑎𝑑𝑖𝑛𝑔 𝐴𝑇𝐸𝑁𝐴 / 𝑞𝑑 2.9 2.8 2.7 2.7 2.6
Table 9: Comparing the results for the designs of the opening of 1 m, 5 m and 10 m.
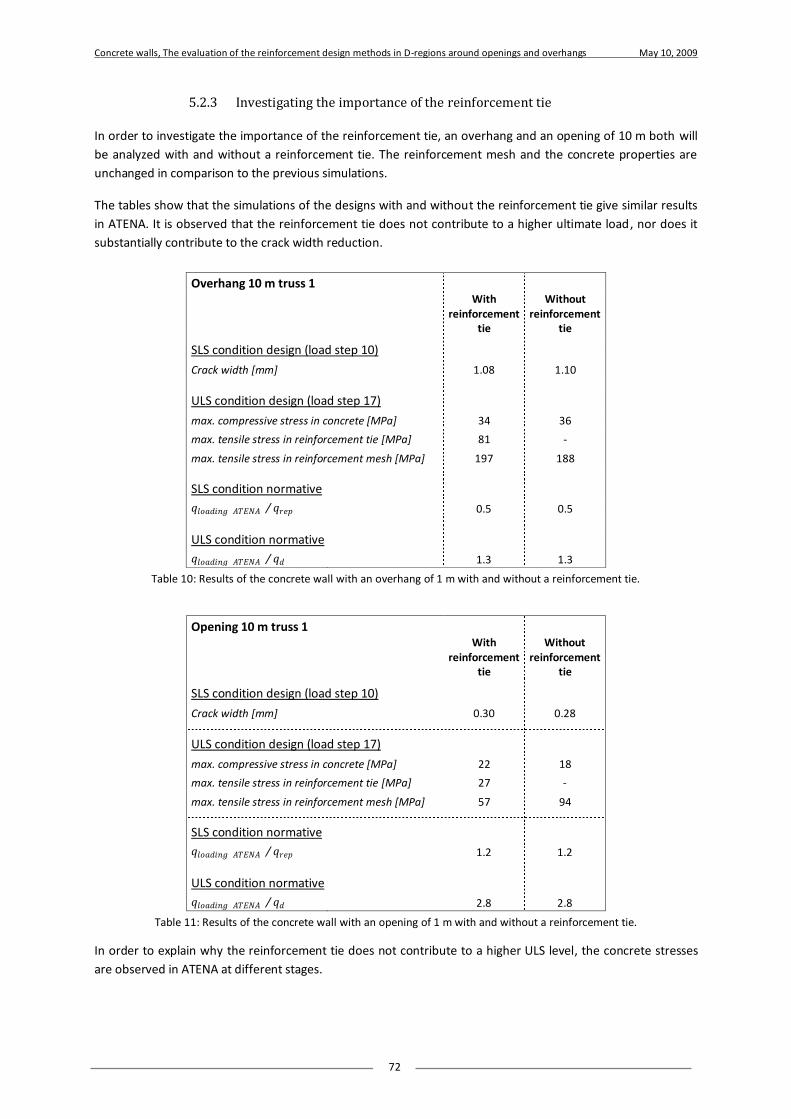
Concrete walls, The evaluation of the reinforcement design methods in D-regions around openings and overhangs May 10, 2009
72
5.2.3 Investigating the importance of the reinforcement tie
In order to investigate the importance of the reinforcement tie, an overhang and an opening of 10 m both will
be analyzed with and without a reinforcement tie. The reinforcement mesh and the concrete properties are
unchanged in comparison to the previous simulations.
The tables show that the simulations of the designs with and without the reinforcement tie give similar results
in ATENA. It is observed that the reinforcement tie does not contribute to a higher ultimate load, nor does it
substantially contribute to the crack width reduction.
Overhang 10 m truss 1
With reinforcement
tie
Without reinforcement
tie
SLS condition design (load step 10) Crack width [mm]
1.08 1.10
ULS condition design (load step 17) max. compressive stress in concrete [MPa] 34 36
max. tensile stress in reinforcement tie [MPa] 81 -
max. tensile stress in reinforcement mesh [MPa] 197 188
SLS condition normative 𝑞𝑙𝑜𝑎𝑑𝑖𝑛𝑔 𝐴𝑇𝐸𝑁𝐴 / 𝑞𝑟𝑒𝑝
0.5 0.5
ULS condition normative 𝑞𝑙𝑜𝑎𝑑𝑖𝑛𝑔 𝐴𝑇𝐸𝑁𝐴 / 𝑞𝑑 1.3 1.3
Table 10: Results of the concrete wall with an overhang of 1 m with and without a reinforcement tie.
Opening 10 m truss 1
With reinforcement
tie
Without reinforcement
tie
SLS condition design (load step 10) Crack width [mm]
0.30 0.28
ULS condition design (load step 17) max. compressive stress in concrete [MPa] 22 18
max. tensile stress in reinforcement tie [MPa] 27 -
max. tensile stress in reinforcement mesh [MPa] 57 94
SLS condition normative 𝑞𝑙𝑜𝑎𝑑𝑖𝑛𝑔 𝐴𝑇𝐸𝑁𝐴 / 𝑞𝑟𝑒𝑝
1.2 1.2
ULS condition normative 𝑞𝑙𝑜𝑎𝑑𝑖𝑛𝑔 𝐴𝑇𝐸𝑁𝐴 / 𝑞𝑑 2.8 2.8
Table 11: Results of the concrete wall with an opening of 1 m with and without a reinforcement tie.
In order to explain why the reinforcement tie does not contribute to a higher ULS level, the concrete stresses
are observed in ATENA at different stages.
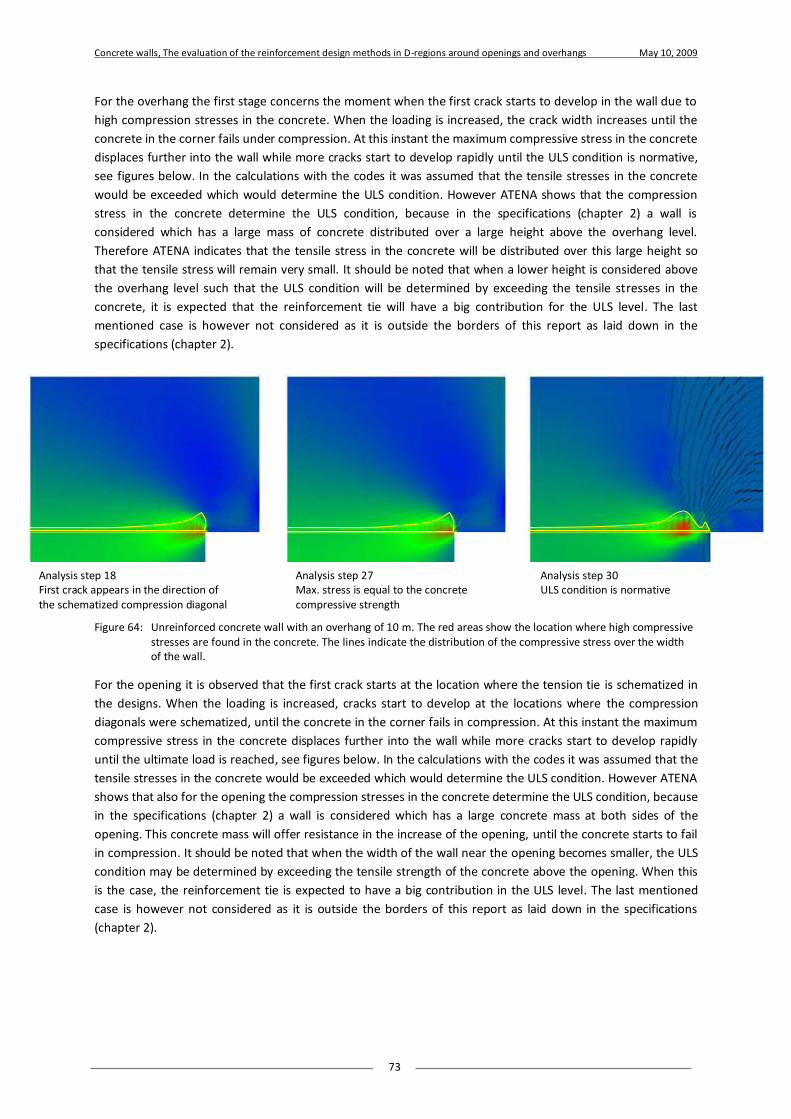
Concrete walls, The evaluation of the reinforcement design methods in D-regions around openings and overhangs May 10, 2009
73
For the overhang the first stage concerns the moment when the first crack starts to develop in the wall due to
high compression stresses in the concrete. When the loading is increased, the crack width increases until the
concrete in the corner fails under compression. At this instant the maximum compressive stress in the concrete
displaces further into the wall while more cracks start to develop rapidly until the ULS condition is normative,
see figures below. In the calculations with the codes it was assumed that the tensile stresses in the concrete
would be exceeded which would determine the ULS condition. However ATENA shows that the compression
stress in the concrete determine the ULS condition, because in the specifications (chapter 2) a wall is
considered which has a large mass of concrete distributed over a large height above the overhang level.
Therefore ATENA indicates that the tensile stress in the concrete will be distributed over this large height so
that the tensile stress will remain very small. It should be noted that when a lower height is considered above
the overhang level such that the ULS condition will be determined by exceeding the tensile stresses in the
concrete, it is expected that the reinforcement tie will have a big contribution for the ULS level. The last
mentioned case is however not considered as it is outside the borders of this report as laid down in the
specifications (chapter 2).
Analysis step 18 First crack appears in the direction of the schematized compression diagonal
Analysis step 27 Max. stress is equal to the concrete compressive strength
Analysis step 30 ULS condition is normative
Figure 64: Unreinforced concrete wall with an overhang of 10 m. The red areas show the location where high compressive stresses are found in the concrete. The lines indicate the distribution of the compressive stress over the width of the wall.
For the opening it is observed that the first crack starts at the location where the tension tie is schematized in
the designs. When the loading is increased, cracks start to develop at the locations where the compression
diagonals were schematized, until the concrete in the corner fails in compression. At this instant the maximum
compressive stress in the concrete displaces further into the wall while more cracks start to develop rapidly
until the ultimate load is reached, see figures below. In the calculations with the codes it was assumed that the
tensile stresses in the concrete would be exceeded which would determine the ULS condition. However ATENA
shows that also for the opening the compression stresses in the concrete determine the ULS condition, because
in the specifications (chapter 2) a wall is considered which has a large concrete mass at both sides of the
opening. This concrete mass will offer resistance in the increase of the opening, until the concrete starts to fail
in compression. It should be noted that when the width of the wall near the opening becomes smaller, the ULS
condition may be determined by exceeding the tensile strength of the concrete above the opening. When this
is the case, the reinforcement tie is expected to have a big contribution in the ULS level. The last mentioned
case is however not considered as it is outside the borders of this report as laid down in the specifications
(chapter 2).

Concrete walls, The evaluation of the reinforcement design methods in D-regions around openings and overhangs May 10, 2009
74
Analysis step 12 First crack appears on the location where the tie was schematized in the designs
Analysis step 31 Cracks appear in the direction of the schematized compression diagonal
Analysis step 40 ULS condition is normative
Figure 65: Unreinforced concrete wall with an opening of 10 m. The red areas show the location where high compressive stresses are found in the concrete. The lines indicate the distribution of the compressive stress over the width of the wall.
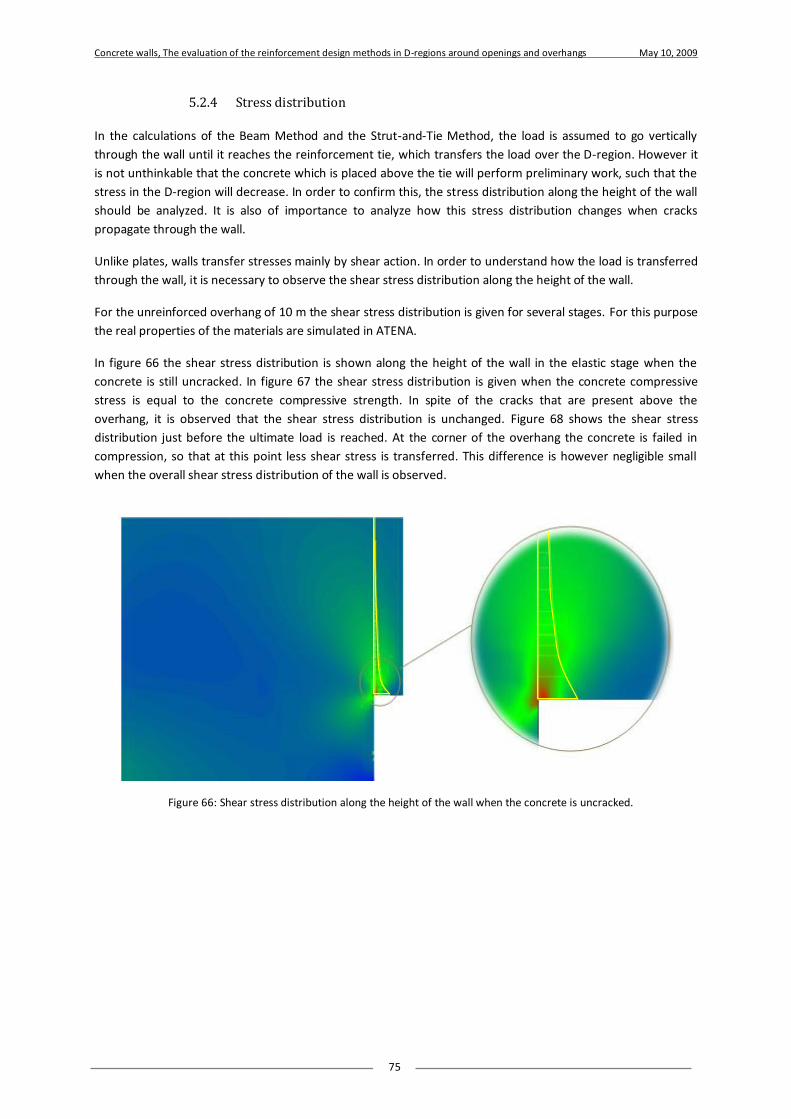
Concrete walls, The evaluation of the reinforcement design methods in D-regions around openings and overhangs May 10, 2009
75
5.2.4 Stress distribution
In the calculations of the Beam Method and the Strut-and-Tie Method, the load is assumed to go vertically
through the wall until it reaches the reinforcement tie, which transfers the load over the D-region. However it
is not unthinkable that the concrete which is placed above the tie will perform preliminary work, such that the
stress in the D-region will decrease. In order to confirm this, the stress distribution along the height of the wall
should be analyzed. It is also of importance to analyze how this stress distribution changes when cracks
propagate through the wall.
Unlike plates, walls transfer stresses mainly by shear action. In order to understand how the load is transferred
through the wall, it is necessary to observe the shear stress distribution along the height of the wall.
For the unreinforced overhang of 10 m the shear stress distribution is given for several stages. For this purpose
the real properties of the materials are simulated in ATENA.
In figure 66 the shear stress distribution is shown along the height of the wall in the elastic stage when the
concrete is still uncracked. In figure 67 the shear stress distribution is given when the concrete compressive
stress is equal to the concrete compressive strength. In spite of the cracks that are present above the
overhang, it is observed that the shear stress distribution is unchanged. Figure 68 shows the shear stress
distribution just before the ultimate load is reached. At the corner of the overhang the concrete is failed in
compression, so that at this point less shear stress is transferred. This difference is however negligible small
when the overall shear stress distribution of the wall is observed.
Figure 66: Shear stress distribution along the height of the wall when the concrete is uncracked.
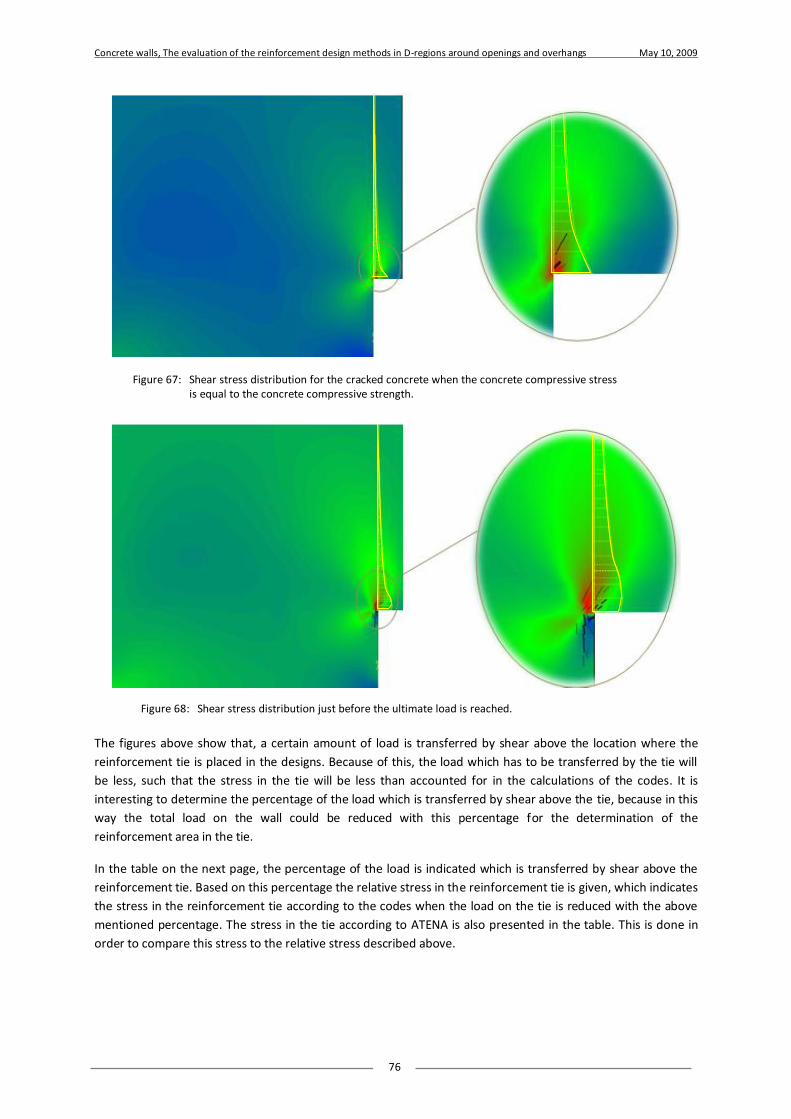
Concrete walls, The evaluation of the reinforcement design methods in D-regions around openings and overhangs May 10, 2009
76
The figures above show that, a certain amount of load is transferred by shear above the location where the
reinforcement tie is placed in the designs. Because of this, the load which has to be transferred by the tie will
be less, such that the stress in the tie will be less than accounted for in the calculations of the codes. It is
interesting to determine the percentage of the load which is transferred by shear above the tie, because in this
way the total load on the wall could be reduced with this percentage for the determination of the
reinforcement area in the tie.
In the table on the next page, the percentage of the load is indicated which is transferred by shear above the
reinforcement tie. Based on this percentage the relative stress in the reinforcement tie is given, which indicates
the stress in the reinforcement tie according to the codes when the load on the tie is reduced with the above
mentioned percentage. The stress in the tie according to ATENA is also presented in the table. This is done in
order to compare this stress to the relative stress described above.
Figure 67: Shear stress distribution for the cracked concrete when the concrete compressive stress is equal to the concrete compressive strength.
Figure 68: Shear stress distribution just before the ultimate load is reached.
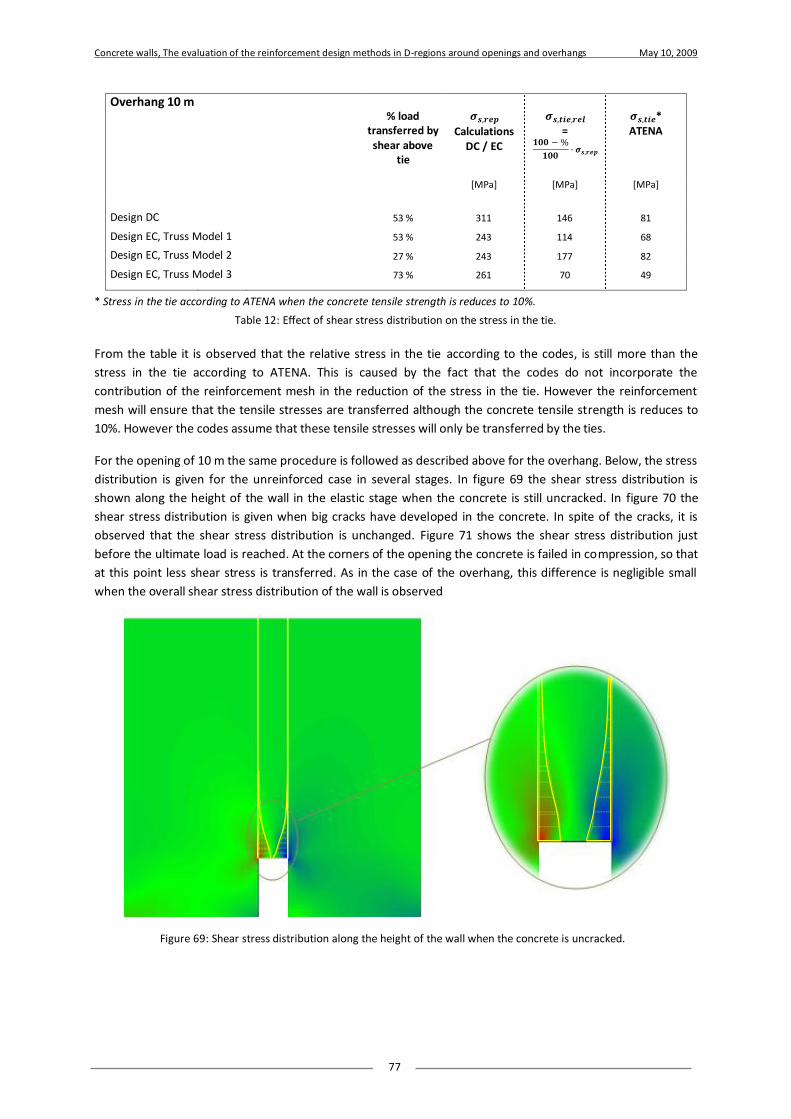
Concrete walls, The evaluation of the reinforcement design methods in D-regions around openings and overhangs May 10, 2009
77
Overhang 10 m
% load
transferred by shear above
tie
𝝈𝒔,𝒓𝒆𝒑
Calculations DC / EC
𝝈𝒔,𝒕𝒊𝒆,𝒓𝒆𝒍
= 𝟏𝟎𝟎 − %
𝟏𝟎𝟎∙ 𝝈𝒔,𝒓𝒆𝒑
𝝈𝒔,𝒕𝒊𝒆* ATENA
[MPa] [MPa] [MPa]
Design DC 53 % 311 146 81
Design EC, Truss Model 1 53 % 243 114 68
Design EC, Truss Model 2 27 % 243 177 82
Design EC, Truss Model 3 73 % 261 70 49
* Stress in the tie according to ATENA when the concrete tensile strength is reduces to 10%.
Table 12: Effect of shear stress distribution on the stress in the tie.
From the table it is observed that the relative stress in the tie according to the codes, is still more than the
stress in the tie according to ATENA. This is caused by the fact that the codes do not incorporate the
contribution of the reinforcement mesh in the reduction of the stress in the tie. However the reinforcement
mesh will ensure that the tensile stresses are transferred although the concrete tensile strength is reduces to
10%. However the codes assume that these tensile stresses will only be transferred by the ties.
For the opening of 10 m the same procedure is followed as described above for the overhang. Below, the stress
distribution is given for the unreinforced case in several stages. In figure 69 the shear stress distribution is
shown along the height of the wall in the elastic stage when the concrete is still uncracked. In figure 70 the
shear stress distribution is given when big cracks have developed in the concrete. In spite of the cracks, it is
observed that the shear stress distribution is unchanged. Figure 71 shows the shear stress distribution just
before the ultimate load is reached. At the corners of the opening the concrete is failed in compression, so that
at this point less shear stress is transferred. As in the case of the overhang, this difference is negligible small
when the overall shear stress distribution of the wall is observed
Figure 69: Shear stress distribution along the height of the wall when the concrete is uncracked.
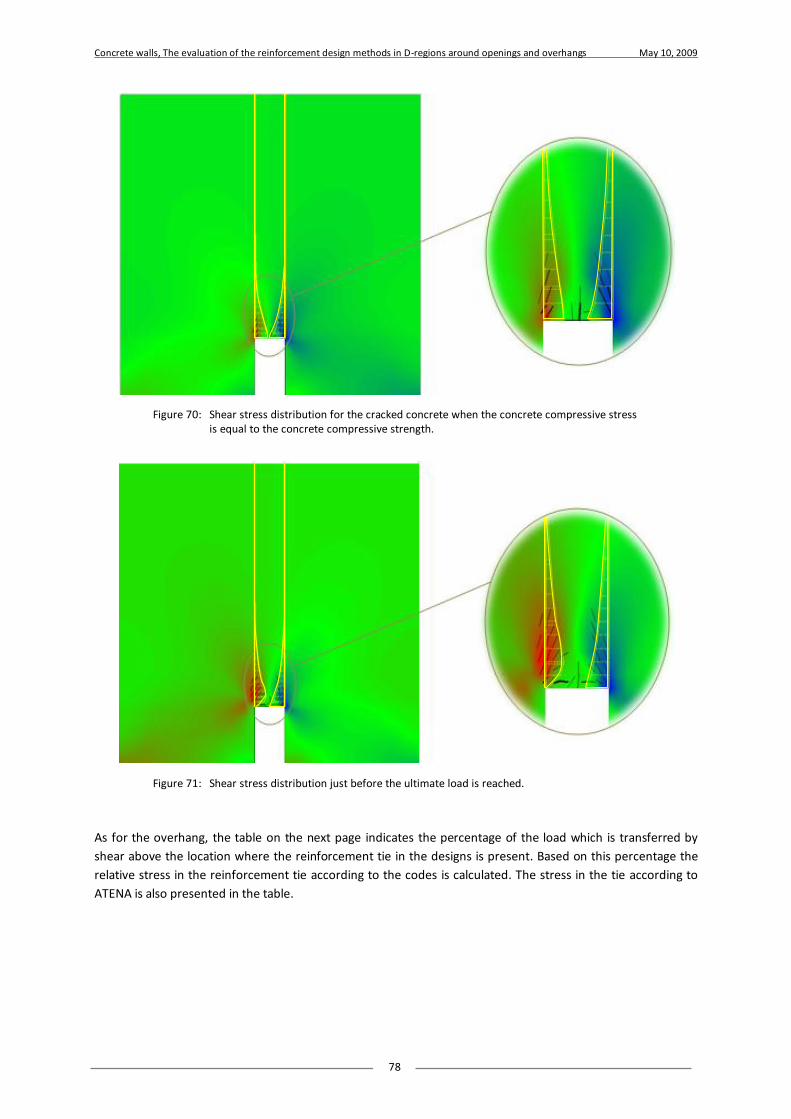
Concrete walls, The evaluation of the reinforcement design methods in D-regions around openings and overhangs May 10, 2009
78
As for the overhang, the table on the next page indicates the percentage of the load which is transferred by
shear above the location where the reinforcement tie in the designs is present. Based on this percentage the
relative stress in the reinforcement tie according to the codes is calculated. The stress in the tie according to
ATENA is also presented in the table.
Figure 70: Shear stress distribution for the cracked concrete when the concrete compressive stress is equal to the concrete compressive strength.
Figure 71: Shear stress distribution just before the ultimate load is reached.

Concrete walls, The evaluation of the reinforcement design methods in D-regions around openings and overhangs May 10, 2009
79
Opening 10 m
% load
transferred by shear above
tie
𝝈𝒔,𝒓𝒆𝒑
Calculations DC / EC
𝝈𝒔,𝒕𝒊𝒆,𝒓𝒆𝒍
= 𝟏𝟎𝟎 − %
𝟏𝟎𝟎∙ 𝝈𝒔,𝒕𝒊𝒆
𝝈𝒔,𝒕𝒊𝒆* ATENA
[MPa] [MPa] [MPa]
Design DC 88 % 314 38 27
Design EC, Truss Model 1 80 % 257 51 25
Design EC, Truss Model 2 89 % 257 28 24
Design EC, Truss Model 3 90 % 241 24 22
Design EC, Truss Model 4 87 % 251 33 24
* Stress in the tie according to ATENA when the concrete tensile strength is reduces to 10%.
Table 13: Effect of shear stress distribution on the stress in the tie.
As for the overhang, the relative stress in the tie according to the codes is still more than the stress in the tie
according to ATENA. As already mentioned, the reinforcement mesh will ensure that the tensile stresses are
transferred although the concrete tensile strength is reduces to 10%. However the codes assume that these
tensile stresses will only be transferred by the ties.
As the table indicates, the difference between the relative stress and the stress indicated by ATENA is for the
opening much smaller than in the case of the overhang. This can be explained by observing the horizontal
tensile stress distribution over the height of the unreinforced wall.
As can be seen in the figures below, for the case of the overhang the tensile stresses in the concrete are very
low as they are distributed over a very large height. In the schematization of the codes, the tensile stresses are
assumed to be transferred by a concentrated reinforcement tie. However, because the horizontal stress is
distributed over such a large height, the tie will not be stressed efficiently.
For the case of the opening the horizontal stress in the concrete is relatively big, because this horizontal stress
is distributed over a much smaller height. For this case the schematization of the codes that the horizontal
stress is transferred by a horizontal reinforcement tie is therefore much better. That is why the relative stresses
indicated in the tables are for the case of the opening much closer to the values obtained by the codes.
Figure 72: Horizontal stress distribution over the height of the wall. Left this is indicated for the overhang, while right this is done for the opening.
Low tensile
stress
Compression
stress
Compression
stress
High tensile
stress

Concrete walls, The evaluation of the reinforcement design methods in D-regions around openings and overhangs May 10, 2009
80
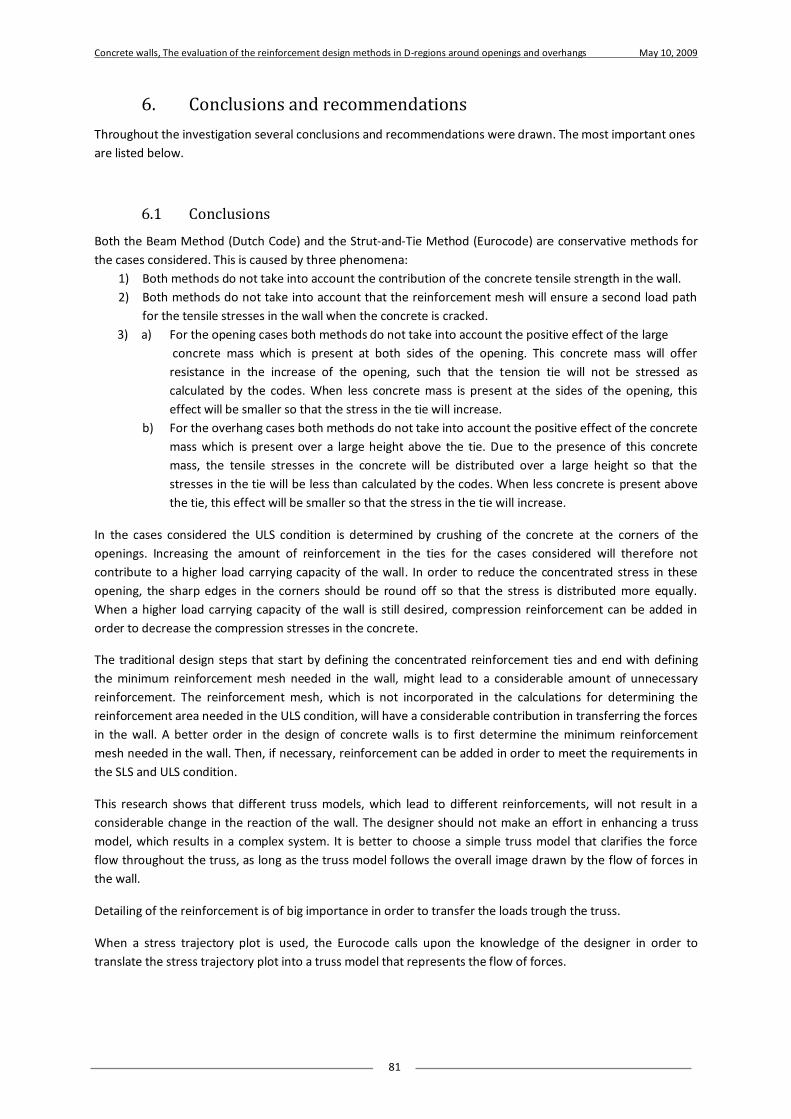
Concrete walls, The evaluation of the reinforcement design methods in D-regions around openings and overhangs May 10, 2009
81
6. Conclusions and recommendations
Throughout the investigation several conclusions and recommendations were drawn. The most important ones
are listed below.
6.1 Conclusions
Both the Beam Method (Dutch Code) and the Strut-and-Tie Method (Eurocode) are conservative methods for
the cases considered. This is caused by three phenomena:
1) Both methods do not take into account the contribution of the concrete tensile strength in the wall.
2) Both methods do not take into account that the reinforcement mesh will ensure a second load path
for the tensile stresses in the wall when the concrete is cracked.
3) a) For the opening cases both methods do not take into account the positive effect of the large
concrete mass which is present at both sides of the opening. This concrete mass will offer
resistance in the increase of the opening, such that the tension tie will not be stressed as
calculated by the codes. When less concrete mass is present at the sides of the opening, this
effect will be smaller so that the stress in the tie will increase.
b) For the overhang cases both methods do not take into account the positive effect of the concrete
mass which is present over a large height above the tie. Due to the presence of this concrete
mass, the tensile stresses in the concrete will be distributed over a large height so that the
stresses in the tie will be less than calculated by the codes. When less concrete is present above
the tie, this effect will be smaller so that the stress in the tie will increase.
In the cases considered the ULS condition is determined by crushing of the concrete at the corners of the
openings. Increasing the amount of reinforcement in the ties for the cases considered will therefore not
contribute to a higher load carrying capacity of the wall. In order to reduce the concentrated stress in these
opening, the sharp edges in the corners should be round off so that the stress is distributed more equally.
When a higher load carrying capacity of the wall is still desired, compression reinforcement can be added in
order to decrease the compression stresses in the concrete.
The traditional design steps that start by defining the concentrated reinforcement ties and end with defining
the minimum reinforcement mesh needed in the wall, might lead to a considerable amount of unnecessary
reinforcement. The reinforcement mesh, which is not incorporated in the calculations for determining the
reinforcement area needed in the ULS condition, will have a considerable contribution in transferring the forces
in the wall. A better order in the design of concrete walls is to first determine the minimum reinforcement
mesh needed in the wall. Then, if necessary, reinforcement can be added in order to meet the requirements in
the SLS and ULS condition.
This research shows that different truss models, which lead to different reinforcements, will not result in a
considerable change in the reaction of the wall. The designer should not make an effort in enhancing a truss
model, which results in a complex system. It is better to choose a simple truss model that clarifies the force
flow throughout the truss, as long as the truss model follows the overall image drawn by the flow of forces in
the wall.
Detailing of the reinforcement is of big importance in order to transfer the loads trough the truss.
When a stress trajectory plot is used, the Eurocode calls upon the knowledge of the designer in order to
translate the stress trajectory plot into a truss model that represents the flow of forces.

Concrete walls, The evaluation of the reinforcement design methods in D-regions around openings and overhangs May 10, 2009
82
The ultimate load on a wall, according to the calculations used in practice, is limited by the 𝜏2-check in such a
way, that it is only a function of the design concrete compressive strength, the thickness of the wall and the
angle of the shear reinforcement.
6.2 Recommendations
The designer should realize that the crack width calculations presented in the codes are based on a bar loaded
in tension. For walls these calculations do not provide solid ground for the determination of the crack widths.
In D-regions the maximum allowable stress in the struts is set to approx. 50% of the concrete design
compressive strength according to the Strut-and-Tie Method of the Eurocode. Outside the D-region the
maximum allowable stress is equal to the concrete design compressive strength. At the border of the D-region
this causes a compatibility problem. Efforts should be made in order to understand the consequence of these
compatibility problems.
In order to apply the Strut-and-Tie Method, it is important to have knowledge of the dimensions of the D-
region for which the Strut-and-Tie Method is applicable. Research should be performed in order to achieve
guidelines for the determination of this D-region in walls.
When high loading is applied, the struts in the Strut-and-Tie Method may become very large. In reality the
compression stresses may not be distributed over such a large width. This might lead to a distorted image of
the force flow through the D-region. Efforts should be made in order to determine the maximum width of the
compression struts.
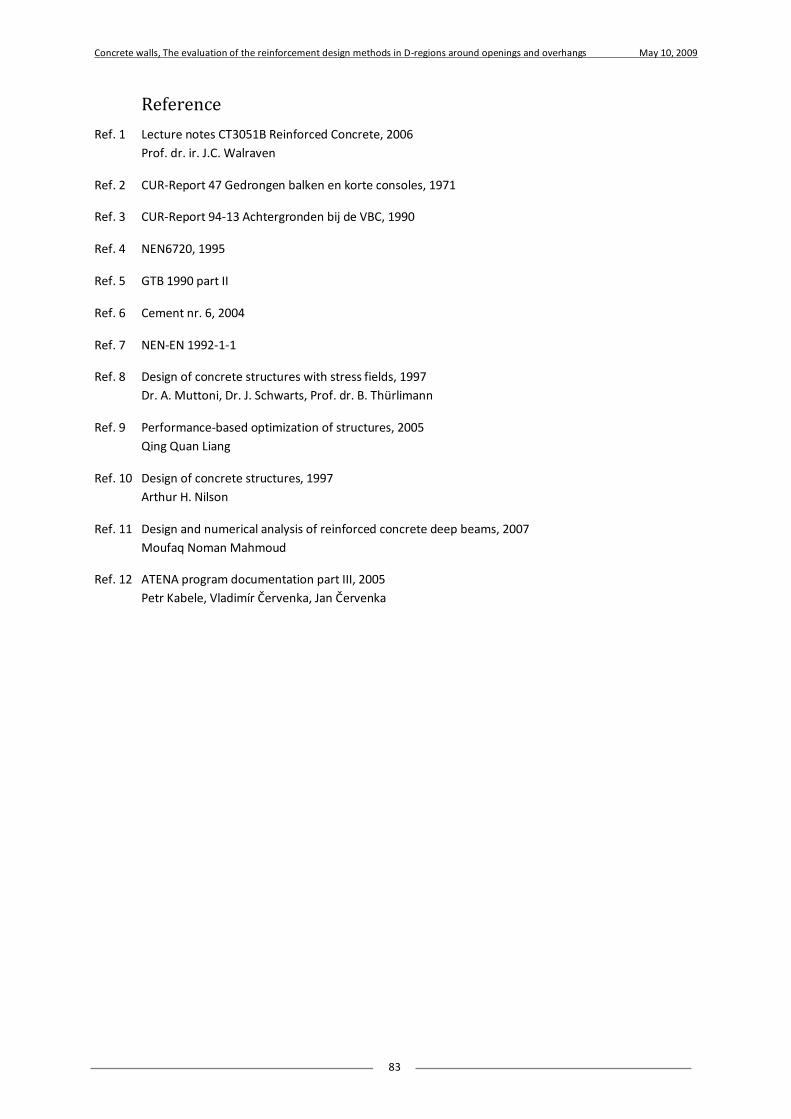
Concrete walls, The evaluation of the reinforcement design methods in D-regions around openings and overhangs May 10, 2009
83
Reference
Ref. 1 Lecture notes CT3051B Reinforced Concrete, 2006
Prof. dr. ir. J.C. Walraven
Ref. 2 CUR-Report 47 Gedrongen balken en korte consoles, 1971
Ref. 3 CUR-Report 94-13 Achtergronden bij de VBC, 1990
Ref. 4 NEN6720, 1995
Ref. 5 GTB 1990 part II
Ref. 6 Cement nr. 6, 2004
Ref. 7 NEN-EN 1992-1-1
Ref. 8 Design of concrete structures with stress fields, 1997
Dr. A. Muttoni, Dr. J. Schwarts, Prof. dr. B. Thürlimann
Ref. 9 Performance-based optimization of structures, 2005
Qing Quan Liang
Ref. 10 Design of concrete structures, 1997
Arthur H. Nilson
Ref. 11 Design and numerical analysis of reinforced concrete deep beams, 2007
Moufaq Noman Mahmoud
Ref. 12 ATENA program documentation part III, 2005
Petr Kabele, Vladimír Červenka, Jan Červenka

Concrete walls, The evaluation of the reinforcement design methods in D-regions around openings and overhangs May 10, 2009
84
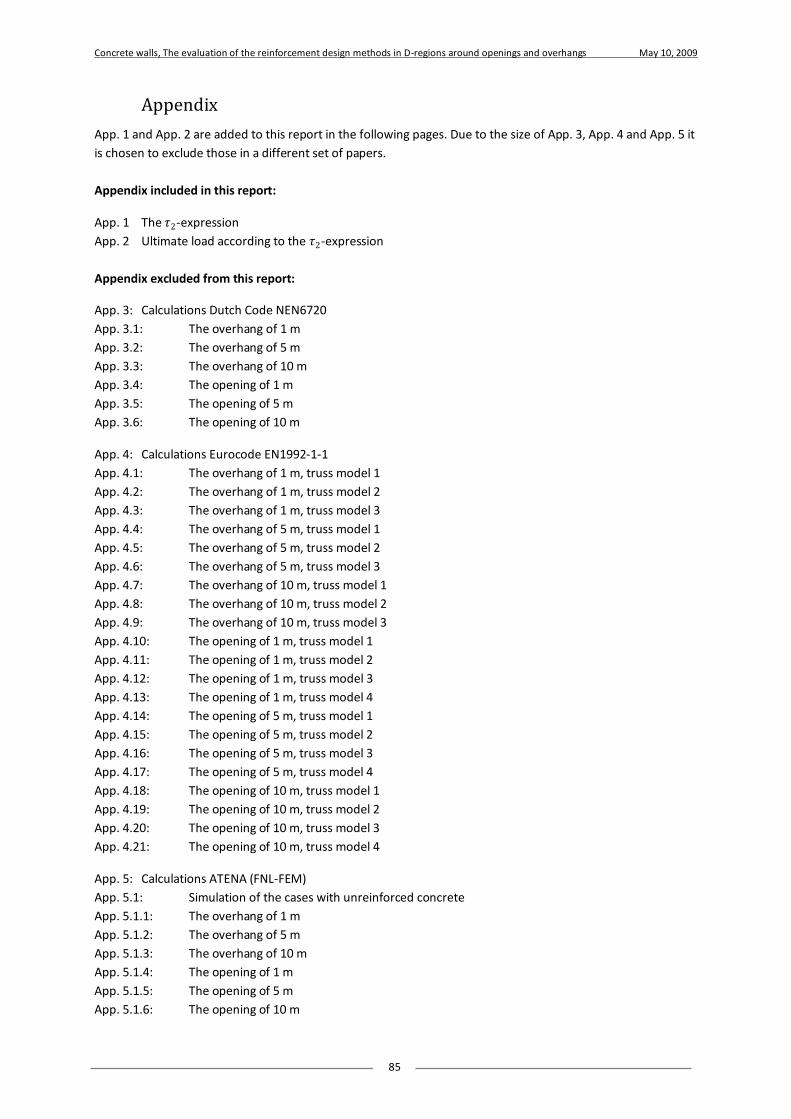
Concrete walls, The evaluation of the reinforcement design methods in D-regions around openings and overhangs May 10, 2009
85
Appendix
App. 1 and App. 2 are added to this report in the following pages. Due to the size of App. 3, App. 4 and App. 5 it
is chosen to exclude those in a different set of papers.
Appendix included in this report:
App. 1 The 𝜏2-expression
App. 2 Ultimate load according to the 𝜏2-expression
Appendix excluded from this report:
App. 3: Calculations Dutch Code NEN6720
App. 3.1: The overhang of 1 m
App. 3.2: The overhang of 5 m
App. 3.3: The overhang of 10 m
App. 3.4: The opening of 1 m
App. 3.5: The opening of 5 m
App. 3.6: The opening of 10 m
App. 4: Calculations Eurocode EN1992-1-1
App. 4.1: The overhang of 1 m, truss model 1
App. 4.2: The overhang of 1 m, truss model 2
App. 4.3: The overhang of 1 m, truss model 3
App. 4.4: The overhang of 5 m, truss model 1
App. 4.5: The overhang of 5 m, truss model 2
App. 4.6: The overhang of 5 m, truss model 3
App. 4.7: The overhang of 10 m, truss model 1
App. 4.8: The overhang of 10 m, truss model 2
App. 4.9: The overhang of 10 m, truss model 3
App. 4.10: The opening of 1 m, truss model 1
App. 4.11: The opening of 1 m, truss model 2
App. 4.12: The opening of 1 m, truss model 3
App. 4.13: The opening of 1 m, truss model 4
App. 4.14: The opening of 5 m, truss model 1
App. 4.15: The opening of 5 m, truss model 2
App. 4.16: The opening of 5 m, truss model 3
App. 4.17: The opening of 5 m, truss model 4
App. 4.18: The opening of 10 m, truss model 1
App. 4.19: The opening of 10 m, truss model 2
App. 4.20: The opening of 10 m, truss model 3
App. 4.21: The opening of 10 m, truss model 4
App. 5: Calculations ATENA (FNL-FEM)
App. 5.1: Simulation of the cases with unreinforced concrete
App. 5.1.1: The overhang of 1 m
App. 5.1.2: The overhang of 5 m
App. 5.1.3: The overhang of 10 m
App. 5.1.4: The opening of 1 m
App. 5.1.5: The opening of 5 m
App. 5.1.6: The opening of 10 m
Concrete walls, The evaluation of the reinforcement design methods in D-regions around openings and overhangs May 10, 2009
86
App. 5.2: Simulation of the design with a concrete tensile strength approaching zero
App. 5.2.1: The overhang of 1 m, Dutch Code
App. 5.2.2: The overhang of 1 m, Truss model 1 Eurocode
App. 5.2.3: The overhang of 1 m, Truss model 2 Eurocode
App. 5.2.4: The overhang of 1 m, Truss model 3 Eurocode
App. 5.2.5: The overhang of 5 m, Dutch Code
App. 5.2.6: The overhang of 5 m, Truss model 1 Eurocode
App. 5.2.7: The overhang of 5 m, Truss model 2 Eurocode
App. 5.2.8: The overhang of 5 m, Truss model 3 Eurocode
App. 5.2.9: The overhang of 10 m, Dutch Code
App. 5.2.10: The overhang of 10 m, Truss model 1 Eurocode
App. 5.2.11: The overhang of 10 m, Truss model 2 Eurocode
App. 5.2.12: The overhang of 10 m, Truss model 3 Eurocode
App. 5.2.13: The opening of 1 m, Dutch Code
App. 5.2.14: The opening of 1 m, Truss model 1 Eurocode
App. 5.2.15: The opening of 1 m, Truss model 2 Eurocode
App. 5.2.16: The opening of 1 m, Truss model 3 Eurocode
App. 5.2.17: The opening of 1 m, Truss model 4 Eurocode
App. 5.2.18: The opening of 5 m, Dutch Code
App. 5.2.19: The opening of 5 m, Truss model 1 Eurocode
App. 5.2.20: The opening of 5 m, Truss model 2 Eurocode
App. 5.2.21: The opening of 5 m, Truss model 3 Eurocode
App. 5.2.22: The opening of 5 m, Truss model 4 Eurocode
App. 5.2.23: The opening of 10 m, Dutch Code
App. 5.2.24: The opening of 10 m, Truss model 1 Eurocode
App. 5.2.25: The opening of 10 m, Truss model 2 Eurocode
App. 5.2.26: The opening of 10 m, Truss model 3 Eurocode
App. 5.2.27: The opening of 10 m, Truss model 4 Eurocode
App. 5.3: Investigating the importance of the reinforcement tie
App. 5.3.1: The overhang of 10 m, Design truss model 1 with Reinforcement tie, Eurocode
App. 5.3.2: The overhang of 10 m, Design truss model 1 without Reinforcement tie, Eurocode
App. 5.3.3: The opening of 10 m, Design truss model 1 with Reinforcement tie, Eurocode
App. 5.3.4: The opening of 10 m, Design truss model 1 without Reinforcement tie, Eurocode
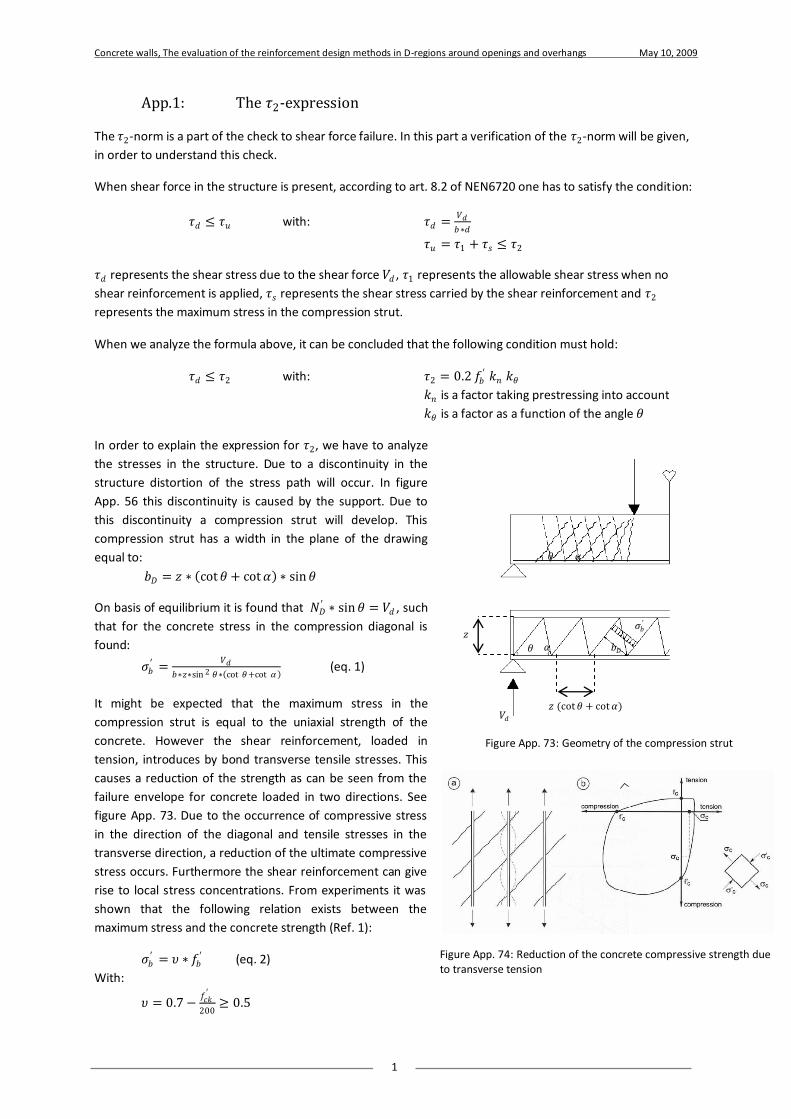
Concrete walls, The evaluation of the reinforcement design methods in D-regions around openings and overhangs May 10, 2009
1
App.1: The 𝜏2-expression
The 𝜏2-norm is a part of the check to shear force failure. In this part a verification of the 𝜏2-norm will be given,
in order to understand this check.
When shear force in the structure is present, according to art. 8.2 of NEN6720 one has to satisfy the condition:
𝜏𝑑 ≤ 𝜏𝑢 with: 𝜏𝑑 =𝑉𝑑
𝑏∗𝑑
𝜏𝑢 = 𝜏1 + 𝜏𝑠 ≤ 𝜏2
𝜏𝑑 represents the shear stress due to the shear force 𝑉𝑑 , 𝜏1 represents the allowable shear stress when no
shear reinforcement is applied, 𝜏𝑠 represents the shear stress carried by the shear reinforcement and 𝜏2
represents the maximum stress in the compression strut.
When we analyze the formula above, it can be concluded that the following condition must hold:
𝜏𝑑 ≤ 𝜏2 with: 𝜏2 = 0.2 𝑓𝑏′ 𝑘𝑛 𝑘𝜃
𝑘𝑛 is a factor taking prestressing into account
𝑘𝜃 is a factor as a function of the angle 𝜃
In order to explain the expression for 𝜏2, we have to analyze
the stresses in the structure. Due to a discontinuity in the
structure distortion of the stress path will occur. In figure
App. 56 this discontinuity is caused by the support. Due to
this discontinuity a compression strut will develop. This
compression strut has a width in the plane of the drawing
equal to:
𝑏𝐷 = 𝑧 ∗ cot𝜃 + cot𝛼 ∗ sin𝜃
On basis of equilibrium it is found that 𝑁𝐷′ ∗ sin𝜃 = 𝑉𝑑 , such
that for the concrete stress in the compression diagonal is
found:
𝜎𝑏′ =
𝑉𝑑
𝑏∗𝑧∗sin 2 𝜃∗ cot 𝜃+cot 𝛼 (eq. 1)
It might be expected that the maximum stress in the
compression strut is equal to the uniaxial strength of the
concrete. However the shear reinforcement, loaded in
tension, introduces by bond transverse tensile stresses. This
causes a reduction of the strength as can be seen from the
failure envelope for concrete loaded in two directions. See
figure App. 73. Due to the occurrence of compressive stress
in the direction of the diagonal and tensile stresses in the
transverse direction, a reduction of the ultimate compressive
stress occurs. Furthermore the shear reinforcement can give
rise to local stress concentrations. From experiments it was
shown that the following relation exists between the
maximum stress and the concrete strength (Ref. 1):
𝜎𝑏′ = 𝜐 ∗ 𝑓𝑏
′ (eq. 2)
With:
𝜐 = 0.7−𝑓𝑐𝑘′
200≥ 0.5
Figure App. 74: Reduction of the concrete compressive strength due to transverse tension
𝑉𝑑
𝜃 𝛼 𝑏𝐷
𝜎𝑏′
𝑧
𝑧 (cot𝜃 + cot𝛼)
𝛼 𝜃
Figure App. 73: Geometry of the compression strut

Concrete walls, The evaluation of the reinforcement design methods in D-regions around openings and overhangs May 10, 2009
2
Substituting eq. 1 and eq. 2 and assuming 𝜐 = 0.5 will result in:
𝑉𝑑
𝑏∗𝑧∗sin 2 𝜃∗ cot 𝜃+cot 𝛼 ≤ 0.5 ∗ 𝑓𝑏
′ (eq. 3)
For ordinary beams it can be assumed that 𝑧 ≅ 0.8 ∗ 𝑑 such that 𝑑 ≅ 1.25 ∗ 𝑧. Substituting this into eq. 3 and
knowing that 𝜏𝑑 =𝑉𝑑
𝑏∗𝑑 will result in:
𝜏𝑑 ≤ 0.4 ∗ 𝑓𝑏′ ∗ sin2 𝜃 ∗ cot𝜃 + cot𝛼 (eq. 4)
Eq. 4 agrees with the requirement formulated in art. 8.2.1 of NEN6720, when the wall is not prestressed in
both directions:
𝜏𝑑 ≤ 𝜏2 with: 𝜏2 = 0.2 ∗ 𝑓𝑏′ ∗ 2 ∗
cot 𝜃+cot 𝛼
1+cot 2 𝜃 (eq. 5)
Choosing vertical stirrups as shear reinforcement we get 𝛼 = 90° and choosing the angle of the compression
diagonal equal to 𝜃 = 45° we get:
For eq. 4: 𝜏𝑑 ≤ 0.20 ∗ 𝑓𝑏′
For eq. 5: 𝜏𝑑 ≤ 0.20 ∗ 𝑓𝑏′
It can be seen that this gives exactly the same answer.
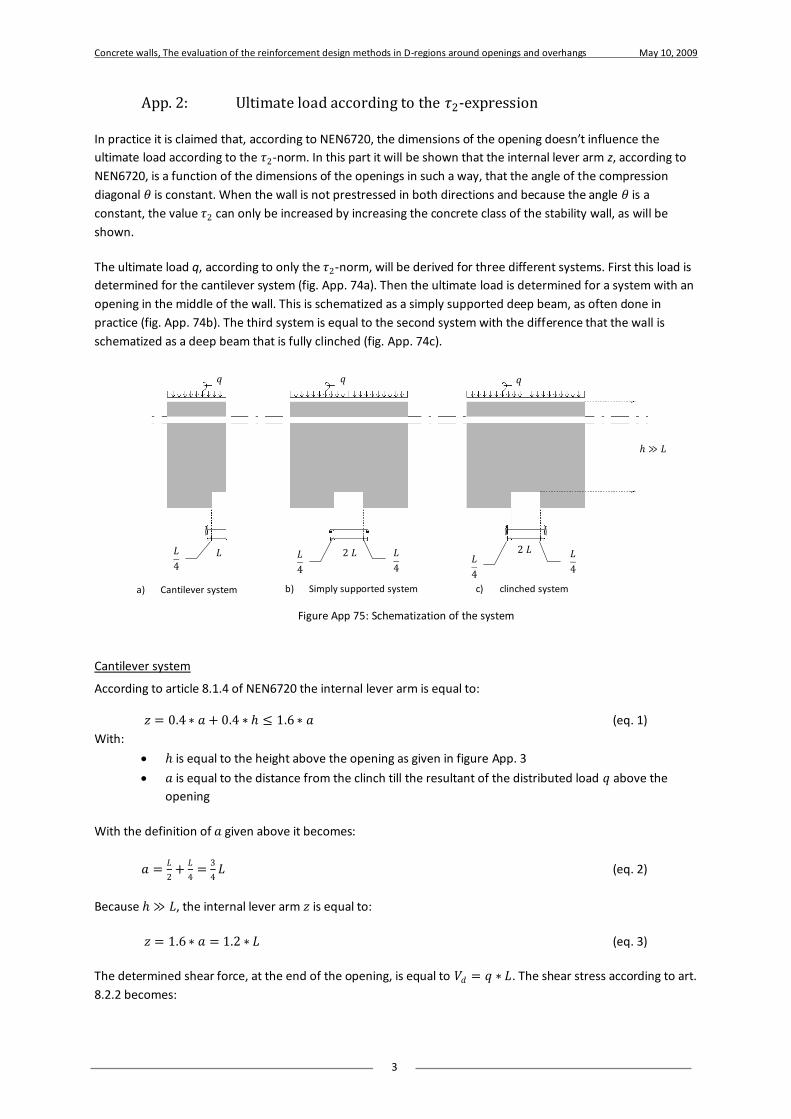
Concrete walls, The evaluation of the reinforcement design methods in D-regions around openings and overhangs May 10, 2009
3
App. 2: Ultimate load according to the 𝜏2-expression
In practice it is claimed that, according to NEN6720, the dimensions of the opening doesn’t influence the
ultimate load according to the 𝜏2-norm. In this part it will be shown that the internal lever arm z, according to
NEN6720, is a function of the dimensions of the openings in such a way, that the angle of the compression
diagonal 𝜃 is constant. When the wall is not prestressed in both directions and because the angle 𝜃 is a
constant, the value 𝜏2 can only be increased by increasing the concrete class of the stability wall, as will be
shown.
The ultimate load q, according to only the 𝜏2-norm, will be derived for three different systems. First this load is
determined for the cantilever system (fig. App. 74a). Then the ultimate load is determined for a system with an
opening in the middle of the wall. This is schematized as a simply supported deep beam, as often done in
practice (fig. App. 74b). The third system is equal to the second system with the difference that the wall is
schematized as a deep beam that is fully clinched (fig. App. 74c).
Cantilever system
According to article 8.1.4 of NEN6720 the internal lever arm is equal to:
𝑧 = 0.4 ∗ 𝑎 + 0.4 ∗ ≤ 1.6 ∗ 𝑎 (eq. 1)
With:
is equal to the height above the opening as given in figure App. 3
𝑎 is equal to the distance from the clinch till the resultant of the distributed load 𝑞 above the
opening
With the definition of 𝑎 given above it becomes:
𝑎 =𝐿
2+
𝐿
4=
3
4𝐿 (eq. 2)
Because ≫ 𝐿, the internal lever arm 𝑧 is equal to:
𝑧 = 1.6 ∗ 𝑎 = 1.2 ∗ 𝐿 (eq. 3)
The determined shear force, at the end of the opening, is equal to 𝑉𝑑 = 𝑞 ∗ 𝐿. The shear stress according to art.
8.2.2 becomes:
Figure App 75: Schematization of the system
a) Cantilever system b) Simply supported system c) clinched system
𝑞 𝑞 𝑞
𝐿
4
𝐿 2 𝐿 2 𝐿 𝐿
4
𝐿
4
≫ 𝐿
𝐿
4
𝐿
4
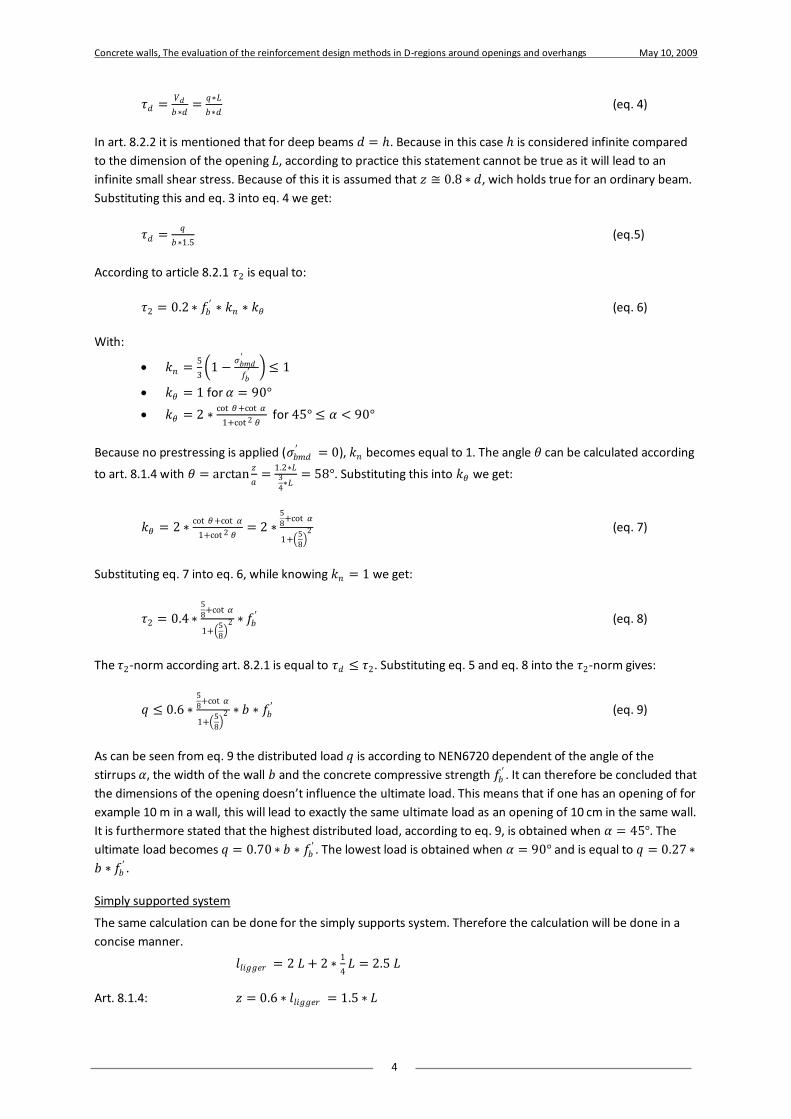
Concrete walls, The evaluation of the reinforcement design methods in D-regions around openings and overhangs May 10, 2009
4
𝜏𝑑 =𝑉𝑑
𝑏∗𝑑=
𝑞∗𝐿
𝑏∗𝑑 (eq. 4)
In art. 8.2.2 it is mentioned that for deep beams 𝑑 = . Because in this case is considered infinite compared
to the dimension of the opening 𝐿, according to practice this statement cannot be true as it will lead to an
infinite small shear stress. Because of this it is assumed that 𝑧 ≅ 0.8 ∗ 𝑑, wich holds true for an ordinary beam.
Substituting this and eq. 3 into eq. 4 we get:
𝜏𝑑 =𝑞
𝑏∗1.5 (eq.5)
According to article 8.2.1 𝜏2 is equal to:
𝜏2 = 0.2 ∗ 𝑓𝑏′ ∗ 𝑘𝑛 ∗ 𝑘𝜃 (eq. 6)
With:
𝑘𝑛 =5
3 1 −
𝜎𝑏𝑚𝑑′
𝑓𝑏′ ≤ 1
𝑘𝜃 = 1 for 𝛼 = 90°
𝑘𝜃 = 2 ∗cot 𝜃+cot 𝛼
1+cot 2 𝜃 for 45° ≤ 𝛼 < 90°
Because no prestressing is applied (𝜎𝑏𝑚𝑑′ = 0), 𝑘𝑛 becomes equal to 1. The angle 𝜃 can be calculated according
to art. 8.1.4 with 𝜃 = arctan𝑧
𝑎=
1.2∗𝐿3
4∗𝐿
= 58°. Substituting this into 𝑘𝜃 we get:
𝑘𝜃 = 2 ∗cot 𝜃+cot 𝛼
1+cot 2 𝜃= 2 ∗
5
8+cot 𝛼
1+ 5
8
2 (eq. 7)
Substituting eq. 7 into eq. 6, while knowing 𝑘𝑛 = 1 we get:
𝜏2 = 0.4 ∗5
8+cot 𝛼
1+ 5
8
2 ∗ 𝑓𝑏′ (eq. 8)
The 𝜏2-norm according art. 8.2.1 is equal to 𝜏𝑑 ≤ 𝜏2. Substituting eq. 5 and eq. 8 into the 𝜏2-norm gives:
𝑞 ≤ 0.6 ∗5
8+cot 𝛼
1+ 5
8
2 ∗ 𝑏 ∗ 𝑓𝑏′ (eq. 9)
As can be seen from eq. 9 the distributed load 𝑞 is according to NEN6720 dependent of the angle of the
stirrups 𝛼, the width of the wall 𝑏 and the concrete compressive strength 𝑓𝑏′ . It can therefore be concluded that
the dimensions of the opening doesn’t influence the ultimate load. This means that if one has an opening of for
example 10 m in a wall, this will lead to exactly the same ultimate load as an opening of 10 cm in the same wall.
It is furthermore stated that the highest distributed load, according to eq. 9, is obtained when 𝛼 = 45°. The
ultimate load becomes 𝑞 = 0.70 ∗ 𝑏 ∗ 𝑓𝑏′ . The lowest load is obtained when 𝛼 = 90° and is equal to 𝑞 = 0.27 ∗
𝑏 ∗ 𝑓𝑏′ .
Simply supported system
The same calculation can be done for the simply supports system. Therefore the calculation will be done in a
concise manner.
𝑙𝑙𝑖𝑔𝑔𝑒𝑟 = 2 𝐿 + 2 ∗1
4𝐿 = 2.5 𝐿
Art. 8.1.4: 𝑧 = 0.6 ∗ 𝑙𝑙𝑖𝑔𝑔𝑒𝑟 = 1.5 ∗ 𝐿
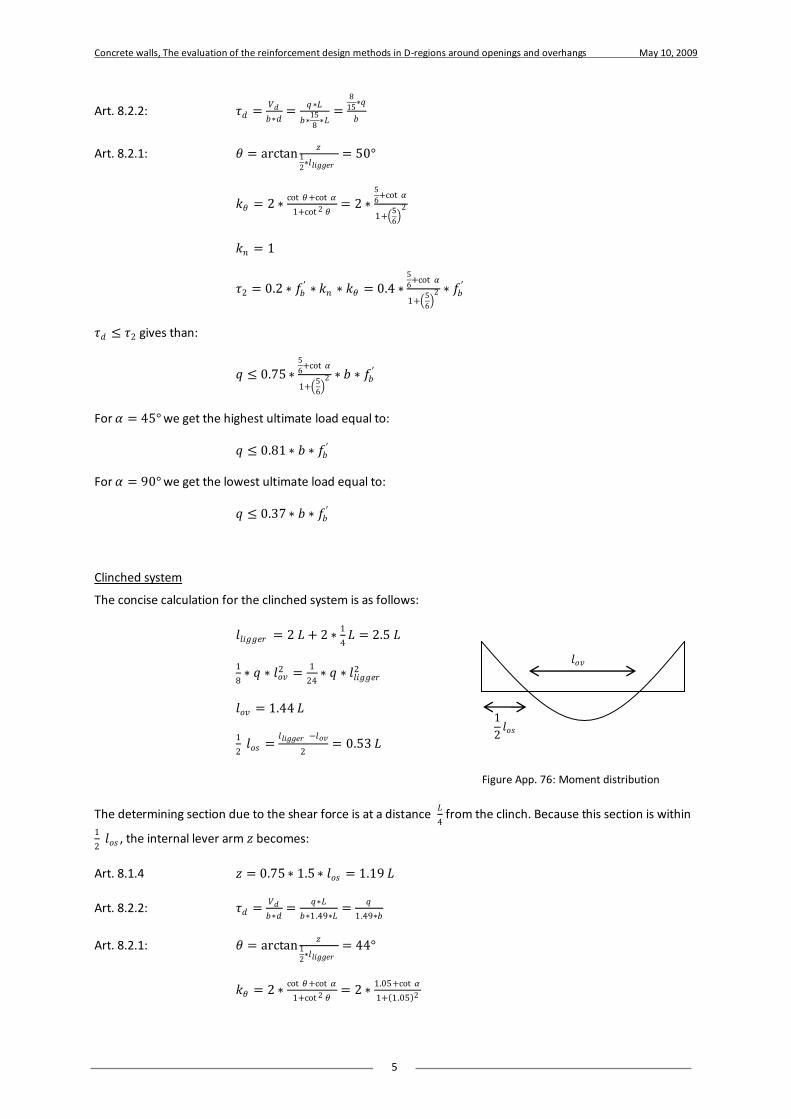
Concrete walls, The evaluation of the reinforcement design methods in D-regions around openings and overhangs May 10, 2009
5
Art. 8.2.2: 𝜏𝑑 =𝑉𝑑
𝑏∗𝑑=
𝑞∗𝐿
𝑏∗15
8∗𝐿
=8
15∗𝑞
𝑏
Art. 8.2.1: 𝜃 = arctan𝑧
1
2∗𝑙𝑙𝑖𝑔𝑔𝑒𝑟
= 50°
𝑘𝜃 = 2 ∗cot 𝜃+cot 𝛼
1+cot 2 𝜃= 2 ∗
5
6+cot 𝛼
1+ 5
6
2
𝑘𝑛 = 1
𝜏2 = 0.2 ∗ 𝑓𝑏′ ∗ 𝑘𝑛 ∗ 𝑘𝜃 = 0.4 ∗
5
6+cot 𝛼
1+ 5
6
2 ∗ 𝑓𝑏′
𝜏𝑑 ≤ 𝜏2 gives than:
𝑞 ≤ 0.75 ∗5
6+cot 𝛼
1+ 5
6
2 ∗ 𝑏 ∗ 𝑓𝑏′
For 𝛼 = 45° we get the highest ultimate load equal to:
𝑞 ≤ 0.81 ∗ 𝑏 ∗ 𝑓𝑏′
For 𝛼 = 90° we get the lowest ultimate load equal to:
𝑞 ≤ 0.37 ∗ 𝑏 ∗ 𝑓𝑏′
Clinched system
The concise calculation for the clinched system is as follows:
𝑙𝑙𝑖𝑔𝑔𝑒𝑟 = 2 𝐿 + 2 ∗1
4𝐿 = 2.5 𝐿
1
8∗ 𝑞 ∗ 𝑙𝑜𝑣
2 =1
24∗ 𝑞 ∗ 𝑙𝑙𝑖𝑔𝑔𝑒𝑟
2
𝑙𝑜𝑣 = 1.44 𝐿
1
2 𝑙𝑜𝑠 =
𝑙𝑙𝑖𝑔𝑔𝑒𝑟 −𝑙𝑜𝑣
2= 0.53 𝐿
The determining section due to the shear force is at a distance 𝐿
4 from the clinch. Because this section is within
1
2 𝑙𝑜𝑠 , the internal lever arm 𝑧 becomes:
Art. 8.1.4 𝑧 = 0.75 ∗ 1.5 ∗ 𝑙𝑜𝑠 = 1.19 𝐿
Art. 8.2.2: 𝜏𝑑 =𝑉𝑑
𝑏∗𝑑=
𝑞∗𝐿
𝑏∗1.49∗𝐿=
𝑞
1.49∗𝑏
Art. 8.2.1: 𝜃 = arctan𝑧
1
2∗𝑙𝑙𝑖𝑔𝑔𝑒𝑟
= 44°
𝑘𝜃 = 2 ∗cot 𝜃+cot 𝛼
1+cot 2 𝜃= 2 ∗
1.05+cot 𝛼
1+ 1.05 2
𝑙𝑜𝑣
1
2𝑙𝑜𝑠
Figure App. 76: Moment distribution
Concrete walls, The evaluation of the reinforcement design methods in D-regions around openings and overhangs May 10, 2009
6
𝑘𝑛 = 1
𝜏2 = 0.2 ∗ 𝑓𝑏′ ∗ 𝑘𝑛 ∗ 𝑘𝜃 = 0.4 ∗
1.05+cot 𝛼
1+ 1.05 2 ∗ 𝑓𝑏′
𝜏𝑑 ≤ 𝜏2 gives than:
𝑞 ≤ 0.60 ∗1.05+cot 𝛼
1+ 1.05 2 ∗ 𝑏 ∗ 𝑓𝑏′
For 𝛼 = 45° we get the highest ultimate load equal to:
𝑞 ≤ 0.59 ∗ 𝑏 ∗ 𝑓𝑏′
For 𝛼 = 90° we get the lowest ultimate load equal to:
𝑞 ≤ 0.30 ∗ 𝑏 ∗ 𝑓𝑏′
Recommended