1
Comprehensive Transcriptome and Mutational Profiling of Endemic Burkitt Lymphoma Reveals EBV Type-specific Differences Yasin Kaymaz1, Cliff I. Oduor2,3, Hongbo Yu4, Juliana A. Otieno5, John Michael Ong’echa2, Ann M. Moormann6, Jeffrey A. Bailey1,7* Affiliations of authors: 1 Program in Bioinformatics and Integrative Biology, University of Massachusetts Medical School, Worcester, MA 2 Center for Global Health Research, Kenya Medical Research Institute, Kisumu, Kenya 3 Department of Biomedical Sciences and Technology, Maseno University, Maseno, Kenya 4 Department of Pathology, University of Massachusetts Medical School, Worcester, MA 5 Jaramogi Oginga Odinga Teaching and Referral Hospital, Ministry of Health, Kisumu, Kenya 6 Program in Molecular Medicine, University of Massachusetts Medical School, Worcester, MA 7 Division of Transfusion Medicine, Department of Medicine, University of Massachusetts Medical School, Worcester, MA *Corresponding Author: Jeffrey A. Bailey, MD PhD [email protected] 368 Plantation St. Albert Sherman Building 4-1077 Worcester, MA 01605 Phone: 508-856-8034 Fax: 508-856-0017 Running Title: Expression and mutational landscape of eBL Key Words: Endemic Burkitt lymphoma, Epstein Barr virus, transcriptome, somatic mutations Financial support:
This study was supported by the US National Institutes of Health, National Cancer Institute R01 CA134051,
R01 CA189806 (AMM) and The Thrasher Research Fund 02833-7 (AMM), UMCCTS Pilot Project Program
U1 LTR000161-04 (YK, JAB, and AMM), Turkish Ministry of National Education Graduate Study Abroad
Program (YK).
Conflict of interest disclosure: The authors disclose no potential conflicts of interest.
Word Count: 6,261 (main text), 262 (abstract).
5 Figures, 2 Tables.
on July 8, 2018. © 2017 American Association for Cancer Research. mcr.aacrjournals.org Downloaded from
Author manuscripts have been peer reviewed and accepted for publication but have not yet been edited. Author Manuscript Published OnlineFirst on January 30, 2017; DOI: 10.1158/1541-7786.MCR-16-0305
2
ABSTRACT
Endemic Burkitt lymphoma (eBL) is the most common pediatric cancer in malaria-endemic equatorial Africa
and nearly always contains Epstein-Barr virus (EBV), unlike sporadic Burkitt Lymphoma (sBL) that occurs
with a lower incidence in developed countries. Given these differences and the variable clinical presentation
and outcomes, we sought to further understand pathogenesis by investigating transcriptomes using RNA
sequencing (RNAseq) from multiple primary eBL tumors compared to sBL tumors. Within eBL tumors,
minimal expression differences were found based on: anatomical presentation site, in-hospital survival rates,
and EBV genome type; suggesting that eBL tumors are homogeneous without marked subtypes. The
outstanding difference detected using surrogate variable analysis was the significantly decreased expression of
key genes in the immunoproteasome complex (PSMB9/β1i, PSMB10/β2i, PSMB8/β5i, and PSME2/PA28β) in
eBL tumors carrying type 2 EBV compared to type 1 EBV. Secondly, in comparison to previously published
pediatric sBL specimens, the majority of the expression and pathway differences was related to the
PTEN/PI3K/mTOR signaling pathway and was correlated most strongly with EBV status rather than
geographic designation. Third, common mutations were observed significantly less frequently in eBL tumors
harboring EBV type 1, with mutation frequencies similar between tumors with EBV type 2 and without EBV.
In addition to the previously reported genes, a set of new genes mutated in BL including TFAP4, MSH6,
PRRC2C, BCL7A, FOXO1, PLCG2, PRKDC, RAD50, and RPRD2 were identified. Overall, these data
establish that EBV, particularly EBV type 1, supports BL oncogenesis alleviating the need for certain driver
mutations in the human genome.
Implications:
Genomic and mutational analyses of Burkitt lymphoma tumors identify key differences based on viral content
and clinical outcomes suggesting new avenues for the development of prognostic molecular biomarkers and
therapeutic interventions.
on July 8, 2018. © 2017 American Association for Cancer Research. mcr.aacrjournals.org Downloaded from
Author manuscripts have been peer reviewed and accepted for publication but have not yet been edited. Author Manuscript Published OnlineFirst on January 30, 2017; DOI: 10.1158/1541-7786.MCR-16-0305
3
INTRODUCTION
Burkitt lymphoma (BL) is a B-cell neoplasm composed of monomorphic, medium sized cells with
basophilic cytoplasm and one of the highest proliferation rates known for human tumors (1). Its histological
appearance is “sky” like with a background of homogeneous tumor cells punctuated by “stars” consisting of
macrophages at apoptotic foci. The World Health Organization recognizes three clinical subtypes of BL:
endemic BL (eBL), sporadic BL (sBL), and immunodeficiency (including HIV)-related BL (idBL) (2).
Aside from geography differences in incidence, eBL tumors are commonly associated with Epstein-
Barr virus (EBV) infection and have been linked to the protozoan parasite Plasmodium falciparum malaria,
presenting in children between 5-9 years of age. It commonly presents in the jaw or facial bones as well as
other extranodal sites such as the GI tract, kidneys, and breasts. In contrast, compared to eBL, pediatric sBL is
found at a 10-fold lower incidence in developed countries where malaria is not endemic and only contains
EBV in around 10-20% of cases. Pediatric sBL tends to afflict a higher proportion of males and adolescents
and present in the abdomen often with disseminated disease (2). sBL incidence has a bimodal age distribution
with peaks in children and older adults suggesting different etiologies. Adult sBL tends to have higher rates of
EBV positivity, nodal presentation, along with poorer outcome, and often more variable pathologic features
leading to designations of plasmacytoid or atypical-BL (3). These differences within sBL have raised the
suggestion that adult sBL should be considered a separate entity (4) EBV positive and EBV negative tumors
are defined separately (5).
The greatest difference in EBV prevalence in BL tumor classifications is seen between endemic (95%)
and pediatric sporadic BL (10%) tumors. EBV positivity is intermediate in id-BL (2,3) and increases with age
in adult sporadic cases (30-50%) (2). Unlike other lymphomas such as Hodgkin's (6) and DLBCL (7), EBV
has not been associated with outcome (2). It does appear that EBV positive tumors may share a similar B cell
origin compared to EBV negative tumors regardless of geographic origin (8). EBV positive eBL cases display
a viral latency I expression profile, which includes EBNA1, EBERs, and the viral microRNAs within the
BART region transcripts (9,10). Of note for eBL, the infecting EBV genome may be either of two divergent
strains, type 1 or type 2, and comparative genomic studies have demonstrated type-specific divergence (11–
13). While type 1 EBV is found globally, type 2 is more commonly found in Africa than other parts of the
on July 8, 2018. © 2017 American Association for Cancer Research. mcr.aacrjournals.org Downloaded from
Author manuscripts have been peer reviewed and accepted for publication but have not yet been edited. Author Manuscript Published OnlineFirst on January 30, 2017; DOI: 10.1158/1541-7786.MCR-16-0305
4
world (14). Although, it has been reported that the transformation efficiency of EBV type 1 is higher compared
to type 2 in lymphoblastoid cell line establishments (15), both strains are frequently found in African eBL
cases and are prevalent within healthy populations in sub Saharan Africa (12,16). However, the expression and
mutational profiles of EBV type 1 and type 2 within primary eBL tumors have not been compared and
contrasted to determine if viral variation influences tumorigenesis.
Clinical features of eBL and response to conventional chemotherapy have not been examined with
regards to expression or mutational profile of the tumor. Endemic BL shows distinctive presentation in either
the jaw or the abdomen (17); among Kenyan children within our larger BL cohort, the tumor presentation sites
were 43% jaw and 50% abdomen (18). In addition, during the study period between 2003 and 2011, 22% of
the admitted patients died in-hospital and 78% completed the course of chemotherapy treatment (18). In this
respect, there was a dramatic difference between the survival rates with 63% of patients with jaw tumors
surviving compared to 33% for abdominal tumors. Attempts to associate antibody titers with tumor
presentation site and prognosis have shown that Anti-Zta IgG levels were elevated in eBL patients with
abdominal tumors compared to patients with jaw tumors (19). However, high throughput expression profiling
and comparative assays applied here better address the question of distinct molecular features specific to tumor
localization and/or survival outcome.
MYC oncogene deregulation and ectopic expression by chromosomal translocations is the key
molecular driver and hallmark of BL. Even though deregulated expression and subsequent mutations of MYC
gene severely alter the DNA binding efficiency of this transcription factor, these do not appear to be sufficient
for tumorigenesis (20). The search for additional driver mutations in sBL has yielded several candidate tumor
suppressors and oncogenes (21–23), however; eBL primary tumor biopsies have not been studied at a genome-
wide level until recently with limited numbers of cases (24). The most common driver mutations in coding
regions appear to occur in the transcription factor TCF3 (E2A) and its inhibitor ID3. Cell cycle regulator gene
CCND3 which encodes for cyclin D3 is another gene frequently mutated, along with the TCF3 and ID3, in
addition to MYC locus alterations especially in sBL cases. Here we investigate the transcriptome and
mutational profiles of 28 eBL and 2 sBL primary tumors by deep sequencing and unlike previous studies, we
on July 8, 2018. © 2017 American Association for Cancer Research. mcr.aacrjournals.org Downloaded from
Author manuscripts have been peer reviewed and accepted for publication but have not yet been edited. Author Manuscript Published OnlineFirst on January 30, 2017; DOI: 10.1158/1541-7786.MCR-16-0305
5
correlated our findings with clinical outcomes. We also explored the viral gene expression activity in EBV
positive BL tumors comparing and contrasting type 1 and type 2 virus.
MATERIALS AND METHODS
Ethical approval and sample collection
Fine needle aspirates (FNA) were prospectively obtained between 2009 and 2012 at time of diagnosis
and prior to commencing chemotherapy at Jaramogi Oginga Odinga Teaching and Referral Hospital
(JOOTRH), a regional referral hospital for pediatric cancer in western Kenya. Tumor FNAs were stained with
Giemsa/May-Grünwald for morphologic diagnosis by microscopy. Morphology was assessed by two
independent pathologists to verify the diagnosis. A second FNA was transferred into RNAlater at the bedside
and subsequently stored at -20C. Written informed consent was obtained from a parent or legal guardian of the
child before enrollment. Ethical approval was obtained from the Institutional Review Board at the University
of Massachusetts Medical School and the Scientific and Ethics Review Unit at the Kenya Medical Research
Institute.
In order to better compare BL subtypes, we also analyzed published RNAseq dataset of sBLs and cell
lines (21). The sequences in fastq format were downloaded through the NCBI (SRP009316) for 28 sBL
primary tumors and 13 long term BL cultures derived from sporadic and endemic cases. In addition, we also
analyzed 89 mRNA sequencing from lymphoblastoid cell lines (LCLs) from healthy individuals involved in
the 1000 genome project (Yoruba, YRI) (ERP001942), which we used to eliminate variant calls likely due to
transcript assembly, mapping artifacts or RNA editing.
Sequencing Library Preparation
Briefly, starting with 1-5ug total RNA, we prepared strand-specific RNAseq libraries following the
protocol from Zhang et al. (25) combined with mRNA enrichment with oligo-dT using Dynabeads mRNA
purification kit (Life Technologies) (Supplementary methods). Final library qualities were confirmed with
Bioanalyzer High sensitivity DNA kit (Agilent) and sequenced with paired end read (2x100bp) using multiple
on July 8, 2018. © 2017 American Association for Cancer Research. mcr.aacrjournals.org Downloaded from
Author manuscripts have been peer reviewed and accepted for publication but have not yet been edited. Author Manuscript Published OnlineFirst on January 30, 2017; DOI: 10.1158/1541-7786.MCR-16-0305
6
lanes of Illumina HiSeq 2000 (Illumina Inc., San Diego, CA, USA). Data can be accessed at dbGAP with
accession number (Pending).
Differential Gene Expression Analysis
After quality assessment and preprocessing the raw sequencing reads, we aligned read pairs to a
transcriptome index built by RSEM (26) using Gencode v19 protein coding transcript annotations and hg19
genomic sequence. For EBV genes, we used GenBank gene annotations from both the type 1 and type 2
reference genomes (NC_007605 and NC_009334, respectively). To perform differential gene expression test,
we used DESeq2 (27) in R computing environment. In order to be able to account for the batch variables and
unknown factors while testing for the differential expression, we estimated the number of latent factors for
every comparison separately using svaseq (28) while preserving the variation of interest. We then incorporated
these surrogate variables into the testing model for DESeq2.
Gene Set Enrichment Analysis
We performed a standard gene set enrichment analysis (GSEA) using the GSEA module implemented
by Broad Institute, Cambridge, MA (29). GSEA was performed on normalized expression data and on data
after surrogate variable analysis. For a ranking metric, we used signal to noise value of each gene, and
performed a permutation test for FDR by permuting sample phenotypes. The analysis included standard gene
sets of hallmark and oncogenic signatures as well as the curated C2 gene sets from the Molecular Signatures
Database (v5.0 MSigDB) (30).
Single Nucleotide Variation Detection
We mapped sequencing reads to human reference genome hg19 using the spliced aligner STAR (31)
after quality trimming and removing the PCR duplicate reads. We followed the standard work flow by GATK
(32) for calling variation within RNAseq data using the HaplotypeCaller module with additional stringency
requirements (Supplementary methods). Variants observed in dbSNP v146 and low quality calls were
excluded. We limited variant calling to translated sequences of protein coding genes in GenCode annotation
v19.
on July 8, 2018. © 2017 American Association for Cancer Research. mcr.aacrjournals.org Downloaded from
Author manuscripts have been peer reviewed and accepted for publication but have not yet been edited. Author Manuscript Published OnlineFirst on January 30, 2017; DOI: 10.1158/1541-7786.MCR-16-0305
7
RESULTS
Case information and sequencing summary
To survey the transcriptome of eBL, we sequenced 28 primary histologically-confirmed tumor FNA
biopsies collected from Kenyan children with median age 8.2 years old (Table 1). We also sequenced two
fresh frozen sBL tumors from diagnostic biopsies at the University of Massachusetts Medical School
(UMMS). For the eBL patients, the tumor presenting site was 43% (12/28) jaw tumors and 57% (16/28)
abdominal tumors. In terms of survival, the eBL samples included 3 patients who died prior to receiving any
treatment, 5 patients who died during the course of treatment, and 16 patients who were able to complete the
recommended chemotherapy treatment with resolution of their tumor and discharged from hospital (18). In-
hospital survival for the children included in this study was 64% (18/28). For each of the samples, we
performed strand-specific RNA sequencing generating on average 14M paired reads per library (range 8.9-
53.7M reads; Supplementary Table S1). All 30 samples in the sequencing set showed high expression of
associate BL markers, including traditional cell surface markers CD19, CD20, CD10 and CD79A/B, and
intracellular markers of MYC and BCL6, consistent with the molecular phenotype of BL (3). All samples,
including re-analyzed sBLs, showed high proportions of B cell specific expression (33) consistent with
adequate aspirates of the tumor cells (Supplementary Fig. S1).
EBV positive eBL tumors are predominantly canonical latency I expression program
In concert with human transcriptome analysis, we first checked if EBV DNA was present in the tumor
isolates using quantitative PCR. As expected, the vast majority of eBLs was positive (93%, 26/28) while only
2 eBLs and the 2 sBLs were negative (34). For EBV positive tumors, viral load assays indicated that tumor
cells contained multiple copies of EBV DNA (mean 4,475 copies/ng tumor DNA; ~30 EBV/cell, median 1,542
copies/ng tumor DNA; ~10 EBV/cell). We also determined the virus type using distinguishing primers against
viral gene EBNA3C. We found that 31% (N=8) of the EBV positive tumors were infected with type 2 EBV
genomes whereas 69% (N=18) of them carried EBV type 1 genomes. We observed no mixed infection of both
types within eBL tumors.
on July 8, 2018. © 2017 American Association for Cancer Research. mcr.aacrjournals.org Downloaded from
Author manuscripts have been peer reviewed and accepted for publication but have not yet been edited. Author Manuscript Published OnlineFirst on January 30, 2017; DOI: 10.1158/1541-7786.MCR-16-0305
8
Given that these two types have divergent genomic sequences for several genes, we mapped the
RNAseq reads to the appropriate viral transcriptome sequences. EBV positive tumors demonstrated significant
viral gene expression, regardless of viral genome type. This expression from the EBV genome ranged across a
continuum with the average around 200 RPM (reads per million) (ranging between 10 to 400 RPM;
Supplementary Fig. S2A). The two EBV negative eBL tumors and two sBL tumors did not demonstrate any
EBV specific reads supporting the absence of the virus based on qPCR. Interestingly, viral DNA copy
numbers did not correlate significantly with overall viral transcriptome activity levels (Supplementary Fig.
S2B). Along with BHRF1, BHLF1 and several EBV latent genes (EBERs, EBNA-1 and LMP2A/B) are
weakly positively correlated with viral DNA levels in individual eBL tumors. On the other hand, BART
transcripts, which are the most abundant transcripts including RPMS1, A73 and LF3, demonstrated no
correlation with viral DNA levels (Supplementary Fig. S2C). This suggests that the observed viral expression
levels within tumor cells are for the most part independent of viral load or lytic replication rates and may be
dependent on other factors. In addition to the eBL tumors, four of the sBL primary tumors that were re-
analyzed were also EBV positive (14%) and carried type 1 EBV genomes. Overall, viral genes in eBL tumors
demonstrated a predominant expression pattern consistent with the latency I. However, hierarchical clustering
of viral genes revealed several potential subgroups (Fig. 1). All sBLs clustered separately and showed latency I
pattern but increased levels of BALF3 and BARF0, unlike eBLs. Within the eBLs there was also a
substructure that appeared to be related to the relative amount of EBER1. The cell lines and three eBL samples
showed higher levels of most genes suggestive of increased viral replication and lytic activity (Supplementary
Fig. S2D). Among these three, two (eBL_02 and eBL_25) with elevated BHLF1 and lytic gene expression
were patients who died in-hospital before receiving any treatment.
In-depth assessment of correlated variation with clinical features and viral type
Our initial question related to the tumor transcriptome was if there were any major expression
differences and if any major differences correlated with the features of anatomical tumor presentation site, in-
hospital survival or EBV type. After normalization of expression, we performed unsupervised hierarchical
clustering based on Pearson correlations on expressed genes with the greatest variation (Fig. 2). The overall
correlations among eBLs were extremely high (r>0.96, average). The sporadic tumors which differed in the
on July 8, 2018. © 2017 American Association for Cancer Research. mcr.aacrjournals.org Downloaded from
Author manuscripts have been peer reviewed and accepted for publication but have not yet been edited. Author Manuscript Published OnlineFirst on January 30, 2017; DOI: 10.1158/1541-7786.MCR-16-0305
9
biopsy collection procedure (surgical biopsy or fine-needle aspirate) and preservation methods (fresh frozen or
RNAlater) still showed a high-degree of correlation (r>0.90) with eBLs although they distinctly clustered
away from eBLs. Similarly, the major principal components showed no discernible separation based on tumor
presentation site, treatment outcome, and viral genome type (Supplementary Fig. S3). Overall, this suggests
that eBL tumors are relatively homogeneous group without overt subtypes based on tumor presentation site,
survival or EBV type.
We then checked individual genes for differential expression between eBL tumors with different
clinical features. For tumor site, only NOS3 showed significantly higher expression in abdominal tumors. This
gene encodes for nitric oxide synthase 3 (aka eNOS) and is known to be more highly expressed in abdominal
endothelial (35). Given the molecular phenotype of eBL tumors appears relatively homogeneous, it may be
that unaccounted variation, biases or stochastic noise may be obscuring the detection of true expression
differences. Thus, we used surrogate variable analysis (SVA) to isolate and remove unaccounted variation
while preserving the variation associated with the feature of interest (28). As a result, we still failed to
determine any significantly differentially expressed genes or pathways between biopsies from two different
clinical tumor presentation sites, jaw and abdomen. However, for in-hospital survival of those who
commenced chemotherapy, we detected 10 significantly differentially expressed genes between tumors of
patients who survived and those who died (Fig. 3A). AGPAT3, CTSL, ISCU, CTSD, and APOE showed greater
relative expression in tumors of patients who survived while TUBB6, SLC25A24, FAM127A, HOMER1, and
SLC12A3 demonstrated greater expression in tumors of patients who died (Supplementary Table S2). Gene set
enrichment and pathway analysis between expression profiles of these patient groups suggested several
hallmark pathways including hypoxia, IL2/STAT5 signaling, MYC targets, and TNFα signaling via NFκβ
(Supplementary Table S3). The leading edge genes (core of the enrichment signal) mutually shared by these
hallmark gene sets are SERPINE1, CD44, ENO2, PLAUR, RHOB, and TNFAIP3. These genes represent
potential prognostic biomarkers requiring further investigation.
Comparison between EBV type 1 and type 2 viral-containing eBL tumors revealed 13 significant,
differentially expressed genes (Fig. 3B). Four out of 8 genes that have significantly higher expression in eBL
tumors with type 1 EBV are coding for the required components of immunoproteasome complex formation;
on July 8, 2018. © 2017 American Association for Cancer Research. mcr.aacrjournals.org Downloaded from
Author manuscripts have been peer reviewed and accepted for publication but have not yet been edited. Author Manuscript Published OnlineFirst on January 30, 2017; DOI: 10.1158/1541-7786.MCR-16-0305
10
PSMB9 (β1i), PSMB10 (β2i), PSMB8 (β5i), and PSME2 (PA28β) (Supplementary Table S2). In addition, all of
the other proteasome gene transcripts showed increased expression on average in eBLs with type 1 EBV
(Supplementary Fig. S4). Consistent with this, our gene set enrichment and pathway analysis revealed several
significant differential gene sets involving MHC class I antigen presenting cascades, ubiquitination and
proteasome degradation, and antigen cross presentation altered between type 1 and 2 (Supplementary Table
S3). This difference in expression of IFN-gamma inducible immunoproteasome complex genes and enriched
pathways suggest that type 1 and type 2 genomes of EBV might differ in the pathogenesis of infection as well
as in their roles promoting oncogenesis.
Human gene expression appears to be more differentiated based on EBV status rather than eBL and
sBL geographic designation
We next investigated whether sBLs differ from eBLs in terms of human gene expression profiles.
While it is inherently challenging to compare samples that have been collected and experimentally processed
with non-identical methods, we attempted to control for collection and processing differences by accounting
for them in the comparison sets using SVA. We included 7 BL cell cultures as well as two sBL primary
biopsies from our sequencing set and observed proper clustering according to their eBL and sBL designations
(Supplementary Fig. S5A). Differential gene expression analysis comparing only eBL and sBL primary biopsy
samples resulted in 504 genes with significantly different expression profiles based on geographic BL subtype
classification (Supplementary Table S2 and Supplementary Table S3). Leading edge analysis following the
GSEA of differentially expressed genes reoccurring in multiple Gene Ontology (GO) gene sets demonstrated
that the genes involving biological processes such as vasculature or blood vessel development (BH Padj = 6.0 ×
10-24) and angiogenesis (BH Padj = 4.0 × 10⁻²³) are the major variation source between our eBL biopsy
collections with FNA and sBLs with FFB. These dominant enrichment sets are likely associated with the
different biopsy collection techniques rather than pathological distinctions. On the other hand, the
differentially expressed genes between eBL tumors and sBL tumors also resulted in significant enrichments in
Hallmark gene sets including apoptosis, IL2/STAT5 signaling, Notch signaling, KRAS signaling, and TNFα
signaling via NFκβ. Leading edge genes in these hallmark sets point to strong differential expression of the
on July 8, 2018. © 2017 American Association for Cancer Research. mcr.aacrjournals.org Downloaded from
Author manuscripts have been peer reviewed and accepted for publication but have not yet been edited. Author Manuscript Published OnlineFirst on January 30, 2017; DOI: 10.1158/1541-7786.MCR-16-0305
11
PI3K-Akt signaling pathway (BH Padj = 3.0 × 10⁻²³) which plays a central role in BL pathogenesis/oncogenesis
(36,37).
Given EBV presence is highly correlated with eBL tumors, we hypothesized that EBV may be a major
determinant affecting differential expression between BL tumor subtypes. Therefore, we stratified our samples
sets by their EBV content. Hierarchical clustering of the sample correlations demonstrates that we successfully
preserved the variation associated with only BL tumors' EBV status and removed other unwanted covariates
(Supplementary Fig. S5B). As a sign of this, three EBV positive BL cell cultures as well as 4 EBV positive
sBL tumors clustered with the rest of the EBV positive eBL tumors. Confirming this stratification, two EBV
negative eBLs and two sBLs from our sequencing set properly clustered with the rest of the negative sBLs. We
then performed differential gene expression and pathway enrichment analysis between the primary BL tumors,
excluding the cell lines. This resulted in 1658 significantly differentially expressed genes between EBV
positive and negative BL tumors (Supplementary Table S2). Increased number of significantly differentially
expressed genes suggests that EBV presence in BL tumor affects host expression profile more dramatically
than subtype designations based on geography. These differentially expressed genes highlighted functions in
biological processes involving DNA replication, mismatch repair as well as cell cycle regulation pathways
(Supplementary Table S3). Interestingly, gene set enrichment of the differentially expressed genes between
EBV positive and negative BL tumors resulted a significant enrichment in one of the oncogenic signature gene
sets which consists of genes down-regulated when PTEN was experimentally knock-down (FDR q=0.096).
Fig. 4A shows the genes that have higher expression in EBV negative BLs compared to EBV positive BLs.
This suggests that EBV positive BLs, regardless of their geographic origin, share a common mechanism in
which PTEN is suppressed. Supporting this, enrichment of another gene set in which genes are upregulated
through activation of mTORC1 (mTOR complex 1) suggests the loss of regulatory role of PTEN on this
signaling pathway in EBV positive BL tumors (Fig. 4B). Combined these suggest increased activity of PI3K
and subsequently AKT/mTOR pathway driving cell cycle and proliferation.
Examination of transcript mutations
We next explored the transcriptome for somatic mutations in eBL and compared it to previously
sequenced sBL in order to investigate whether gene mutation frequencies diverge as well as gene expression
on July 8, 2018. © 2017 American Association for Cancer Research. mcr.aacrjournals.org Downloaded from
Author manuscripts have been peer reviewed and accepted for publication but have not yet been edited. Author Manuscript Published OnlineFirst on January 30, 2017; DOI: 10.1158/1541-7786.MCR-16-0305
12
profiles. After excluding the known genomic variants (SNPs), a total of 2728 putative somatic mutations were
determined across the 56 tumor samples (Supplementary Table S4 and Supplementary Fig. S6). Our carefully
controlled variant detection allowed us to compare the gene mutation frequencies between eBL and sBL and
clinical correlates (Supplementary methods). This resulted a total of 21 genes mutated in 4 or more (>7%) of
the sporadic and endemic tumors. Interestingly, the number of mutations did not differ significantly between
sBL and eBL with an average of per tumor 3.6 vs 4.1 genes mutated in eBL and sBL respectively (P = 0.24, t-
test, 2-tailed). However, for the top ten most commonly mutated genes the difference was significant with 2.5
and 3.5 genes mutated per tumor in eBL and sBL, respectively (P = 0.017, t-test, 2-tailed). Two of the top 3
genes were equally mutated genes including MYC and DDX3X (Fig. 5A, pink-cyan bars). The mutation rates
of the genes ID3, CCND3, TCF3, and SMARCA4 were notably less frequently mutated in eBL tumors
accounting for the difference between eBL and sBL. ID3 was significantly different, mutated in 32% of the
eBL compared to 67% of the sBL (P = 0.007, Fisher's Exact). Also, 36% of the sBLs carried mutations in
CCND3 compared to 14% of eBLs (P = 0.061, Fisher's Exact).
Given that ID3, TCF3 and CCND3 are thought to be key drivers for sBL oncogenesis and eBLs do not
carry mutations as frequent as sBLs, we hypothesized again that EBV may be already affecting these pathways
abrogating the need for additional mutation. While EBV status is strongly correlated with endemic versus
sporadic status, we re-analyzed the tumors based on the viral content to see the effect on the mutational
spectrum. Interestingly, the difference in the frequency of the 10 most common genes differentiated further to
2.4 to 3.7 for EBV positive and negative tumors, respectively. Only 196 out of 10,000 permutations, in which
2 eBLs and 4 sBLs were randomly assigned as virus negative and positive, respectively at each iteration,
equaled or exceed the difference observed between EBV positive and negative tumors (P = 0.0198, t-test, 2-
tailed). While individual genes in the simulation did not reach significance, CCND3, SMARCA4, and TCF3
gene mutation frequencies showed further differentiation and reached significance by Fisher’s exact
comparing EBV positive and negative tumors (P < 0.05 for each) (Fig. 5A, yellow-green bars). Overall, these
findings suggest that the molecular feature of gene mutations correlates better with the presence or absence of
EBV within the tumor. Further supporting this, EBV negative BL tumors carried significantly more TCF3 or
on July 8, 2018. © 2017 American Association for Cancer Research. mcr.aacrjournals.org Downloaded from
Author manuscripts have been peer reviewed and accepted for publication but have not yet been edited. Author Manuscript Published OnlineFirst on January 30, 2017; DOI: 10.1158/1541-7786.MCR-16-0305
13
ID3 or CCND3 mutations (P = 0.0021) and there was only a single occurrence of more than one of these genes
being mutated in EBV positive tumor compared with 11 EBV negative tumors.
Apart from ID3, TCF3 and CCND3, two key genes SMARCA4 and ARID1A involved in chromatin and
nucleosome remodeling as part of the SWI/SNF complex are highly mutated. Interestingly, ARID1A was
mutated in roughly equivalent levels in either categorization. In contrast, SMARCA4 demonstrates decreased
gene mutation when comparing either eBL and sBL or EBV positive and negative. Furthermore, Ras homolog
family member A, RHOA, gene was mutated in 14% of eBL tumors in a mutually exclusive manner with
TCF3/ID3 mutations. In addition, when we examined the mutations of two small GTPases, GNA13 and
GNAI2, which are also recurrently mutated in DLBCL (diffuse large B-cell lymphoma) (38), this mutually
exclusive mutation pattern among the BL tumors could be further extended to include mutations in GNAI2 (P
= 0.005, Fisher’s Exact) but not GNA13. While this potentially suggests an alternative path for tumor drives
other than deregulated ID3/TCF3, CCND3 and RHOA were not mutually exclusive potentially suggesting that
the effects of CCND3 may be independent of TCF3’s drive.
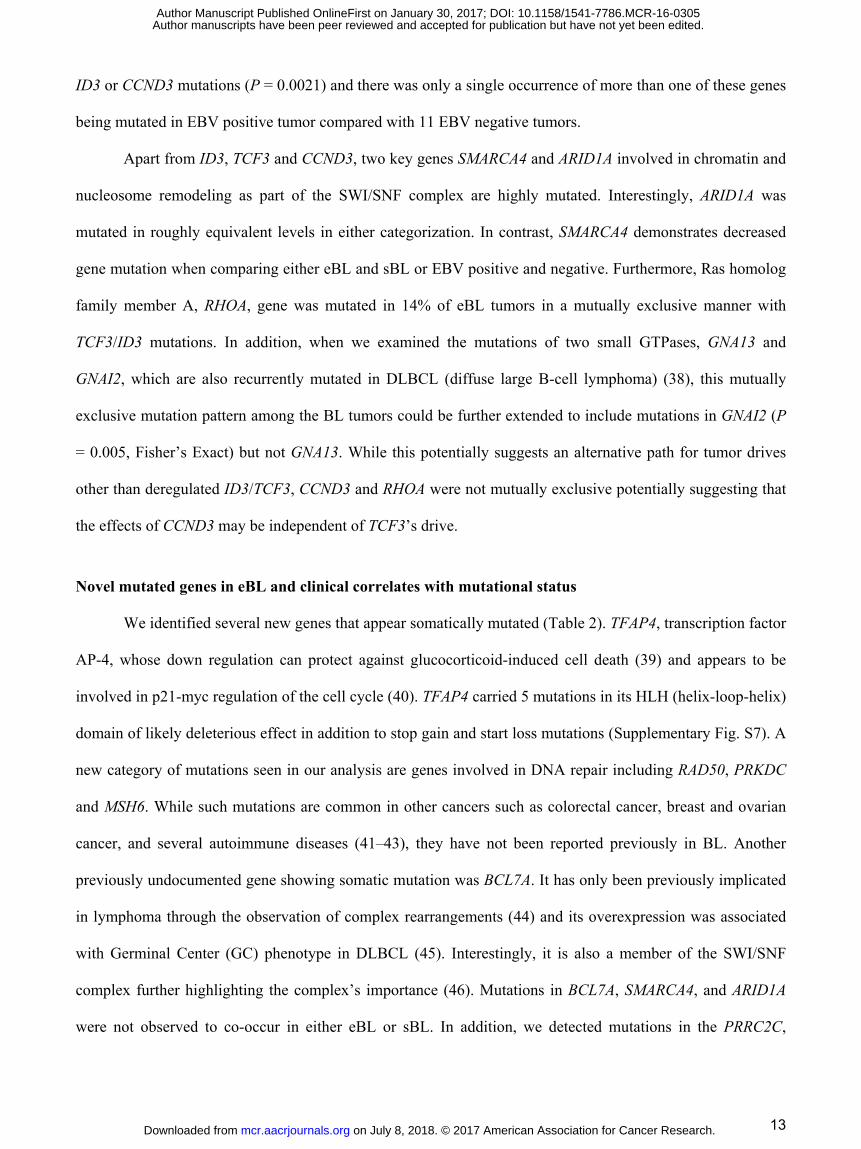
Novel mutated genes in eBL and clinical correlates with mutational status
We identified several new genes that appear somatically mutated (Table 2). TFAP4, transcription factor
AP-4, whose down regulation can protect against glucocorticoid-induced cell death (39) and appears to be
involved in p21-myc regulation of the cell cycle (40). TFAP4 carried 5 mutations in its HLH (helix-loop-helix)
domain of likely deleterious effect in addition to stop gain and start loss mutations (Supplementary Fig. S7). A
new category of mutations seen in our analysis are genes involved in DNA repair including RAD50, PRKDC
and MSH6. While such mutations are common in other cancers such as colorectal cancer, breast and ovarian
cancer, and several autoimmune diseases (41–43), they have not been reported previously in BL. Another
previously undocumented gene showing somatic mutation was BCL7A. It has only been previously implicated
in lymphoma through the observation of complex rearrangements (44) and its overexpression was associated
with Germinal Center (GC) phenotype in DLBCL (45). Interestingly, it is also a member of the SWI/SNF
complex further highlighting the complex’s importance (46). Mutations in BCL7A, SMARCA4, and ARID1A
were not observed to co-occur in either eBL or sBL. In addition, we detected mutations in the PRRC2C,
on July 8, 2018. © 2017 American Association for Cancer Research. mcr.aacrjournals.org Downloaded from
Author manuscripts have been peer reviewed and accepted for publication but have not yet been edited. Author Manuscript Published OnlineFirst on January 30, 2017; DOI: 10.1158/1541-7786.MCR-16-0305
14
RPRD2, FOXO1, PLCG2 that are normally overexpressed in peripheral blood mononuclear cells (PBMCs)
and lymph nodes.
We also examined the correlation of given mutations to clinical and molecular features. Supporting the
lack of expression difference between tumor presentation sites, we observed no suggestive associations with
mutations. A single gene GNAI2 has a potential association with in-hospital survival (P = 0.021) where one
out of 18 survivors had a mutation in GNAI2 compared to three of five who died during initial hospitalization
(Supplementary Table S4).
Rates of Gene Mutations vary greatly based on EBV genome type
EBV and other In terms of EBV type, PRRC2C, SMARCA4, PLCG2, and TFAP4 differed significantly
(P<0.05) (Supplementary Table S4). Interestingly, for these genes, type 2 EBV tumors always had the higher
proportion of mutations compared to eBL tumors containing EBV type 1 (Table 2). All of the mutations that
TFAP4 carried were either deleterious (Met1?, Gln15*, Arg127*, Pro185Leu) or accumulated in the DNA-
binding domain (Arg50Trp, Arg58Trp, Arg60Cys) (Supplementary Table S4). These suggest possible loss of
function for the protein AP4 encoded by this gene mutated mostly in type 2 carrying eBLs (50%). SMARCA4
mutation rates in groups of BLs with type 1, type 2, and negative were roughly 5%, 38%, and 39%,
respectively. Mutations in this gene were located in its important domains SNF2, helicase, and HSA domains
(Supplementary Fig. S7). In general, the average number of mutated genes per tumor (including all 21 genes)
was 2.9 in BL tumors infected with type 1 while 4.9 in BLs with type 2 EBV (P < 0.01, t-test, 2-tailed) (Fig.
5B). This was significant even excluding type 1 tumors that were sporadic and also the overall type 2 mutation
rate was on par with that of EBV negative tumors. The only genes that appear to have significantly lower
mutation rates in type 2 tumors compared to EBV negative tumors was ID3 and TCF3, which were on par with
type 1. Overall, functions of genes with distinct mutation frequencies in these groups, in addition to the
significantly different general mutation rates, supports type 1 EBV’s reputation regarding better transformation
ability compared to type 2, which had almost equivalent levels of mutated genes per tumor as EBV negative
BLs (4.9 and 4.4, respectively).
on July 8, 2018. © 2017 American Association for Cancer Research. mcr.aacrjournals.org Downloaded from
Author manuscripts have been peer reviewed and accepted for publication but have not yet been edited. Author Manuscript Published OnlineFirst on January 30, 2017; DOI: 10.1158/1541-7786.MCR-16-0305
15
DISCUSSION
In this study of Kenyan children diagnosed with eBL, we examined the expression and mutational
spectrum vis-a-vis clinical and molecular features as compared to publicly available data for sBL. We
observed relative homogeneity of expression within tumors collected from our patient population suggesting
no overt subtypes within eBL. We found minimal differences between tumors presenting in the jaw or
abdomen but observed differences in expression that correlated with survival, viral presence and type of EBV.
We also detected previously undescribed somatically mutated genes and showed that the BL mutational
spectrum appears to most greatly differ based on the type of EBV infecting the tumor rather than geographic
origin of the patient. Tumors harboring EBV type 1 display a significantly different host mutational profile
compared to BL tumors with EBV type 2 and without EBV.
Our first major finding is that eBL is a homogenous tumor with highly correlated expression profiles,
regardless of tumor location within the body. This means there is no need to create diagnostic subdivisions
based on tumor presentation site or refine staging based on gene expression profiles. This contradicts previous
expression analyses that suggested greater heterogeneity within eBL compared to sBL or id-BL (47). Our
unsupervised hierarchal clustering did not reveal major clades based on virus, viral type, in-hospital survival or
tumor presentation site. Our analysis of tumor presentation site suggested minimal differences that could be
explained by associated cellular microenvironment (e.g differences in endothelium presence, NOS3). On the
other hand, gene expression comparison of tumors based on survival status of the patients revealed several
candidate genes and gene sets providing potential prognostic biomarkers which are currently lacking for eBL.
Survival rate difference could be attributed to delayed time to diagnosis of abdominal cases compared to more
apparent facial tumors (48). Further studies are required to validate the clinical utility of such markers.
Second, we found that the differences in tumor mutational spectrum were more striking when
categorized by viral presence or absence rather than geographic origin. This was also supported by stronger
differences in expression profiles in key pathways as well as involving likely downregulation of PTEN
affecting the central pathway of PI3K-Akt signaling followed by mTORC1 activation. It has been previously
shown that EBV can modulate mTOR pathway by LMP2A (49). Given the limited viral gene expression in
latency I, EBV could be interacting with key host regulators especially through viral miRNAs (50) or by
on July 8, 2018. © 2017 American Association for Cancer Research. mcr.aacrjournals.org Downloaded from
Author manuscripts have been peer reviewed and accepted for publication but have not yet been edited. Author Manuscript Published OnlineFirst on January 30, 2017; DOI: 10.1158/1541-7786.MCR-16-0305
16
regulating cellular miRNAs expressions (51). It has been recently shown that EBV microRNA Bart6-3p can
inhibit PTEN translation (52). Even though this could be the mechanism by which the virus interferes with key
cellular pathways, the consequences of viral miRNA interactions with PTEN and whether translational
inhibition or mRNA degradation in EBV positive BL needs further clarification. Our data shows that the
mRNA transcription of PTEN itself is not significantly differentially expressed between EBV positive and
negative BLs. However, Ambrosio et al found that protein levels of PTEN are significantly lower in EBV
positive BLs compared to negatives (53). This suggests a mechanism in which viral miRNAs interact with
PTEN causing a translational inhibition. Combined, this suggests that the virus plays a key role in oncogenesis
beyond the likely role in potentiating the translocation. However, further functional assays are needed in order
to validate viral compensation for the less frequent ID3, TCF3 or CCND3 mutations found in EBV positive
eBL tumors.
Third, we discovered new mutations occurring in genes previously not reported in other BL studies.
While many of these additional genes are mutated at low frequencies (<10%), they support the key roles of
previously identified pathways (e.g. BCL7A as another member of SWI/SNF). These genes also implicate
DNA repair in terms of oncogenesis where we identify 3 previously undescribed genes (MSH6, RAD50, and
PRKDC) involved in double strand repair and nonhomologous end joining. The analysis presented here of BL
patients from Kisumu, Kenya was underway when a similar study was published involving 20 Ugandan
patients (24). Therefore, we reevaluated our analysis to determine if we could validate their findings. We
found similar mutation rates in ID3 and TCF3 genes and associated these with the lack of EBV positivity.
However, we observed less frequent RHOA and no CCNF mutations in Kenyan eBL tumors. In contrast to the
Ugandan study, we also failed to detect any significant trace of other herpes viruses such as KSHV or CMV
other than EBV although this may be attributable to our FNAs which decrease the sampling of the connective
tissue were these viruses were mainly present. Their study was also limited in its ability to examine EBV types
for which we found significant differences in expression within our Kenyan tumors.
Fourth, we found that not only does tumor gene mutation rates and distribution vary based on the
presence of EBV but that tumors have different patterns of mutation based on EBV type. We observed that
BLs with type 2 has significantly higher average number of mutated genes relative to type 1 and that this rate
on July 8, 2018. © 2017 American Association for Cancer Research. mcr.aacrjournals.org Downloaded from
Author manuscripts have been peer reviewed and accepted for publication but have not yet been edited. Author Manuscript Published OnlineFirst on January 30, 2017; DOI: 10.1158/1541-7786.MCR-16-0305
17
is on par with viral negative tumors. The only observed consistent mutational difference was a lower rate of
mutations in ID3 and TCF3, which supports the idea that the virus may play a key role regulating these
pathways during oncogenesis by alternatively driving AKT/mTOR signaling. The overall lower mutational
rates in BLs with type 1 virus, suggest that type 1 virus may be providing survival advantages in other ways.
This is consistent with the known ability of type 1 virus to better transform peripheral B cells to create
lymphoblastoid cell lines. Given that previous studies have not seen significant differences in viral types in
tumors relative to population controls, this suggests that many of these driver mutations while offering relative
advantages in tumor growth are not in and of themselves necessary in terms of oncogenesis. Further studies
with greater number of tumors and population controls can help to better understand the distribution of EBV
within the general population in contrast to their role in eBL pathogenesis.
Finally, we observed that the viral expression pattern is consistent with viral latency I where EBV is
essentially quiescent and maintained with EBNA1 expression. However, increased detection of lytic gene
expression was suggestive of poor prognosis. It has been argued that this observed expression pattern may
primarily be due to various levels of lytic reactivation (54). Consistent with the previous reports (55), our
results demonstrated similar heterogeneous viral gene expression in BL suggesting that tumor cells could be
targeted by antiviral immunotherapies. Dysfunctional T cell immunity has been reported for children
diagnosed with eBL who were defective for EBNA1 specific IFN-gamma T cell responses (56). This defect
putatively allows latency I tumors to escape from immune surveillance. Interestingly, we found that one third
of the eBL tumors which carried type 2 EBV genome had significantly suppressed immunoproteasome
complex gene transcriptions compared to eBLs with type 1 EBV. One explanation for this novel observation
could be that type 2 EBV more readily infects immunocompromised individuals. Baarle et al., reported an
increased prevalence of type 2 EBV among HIV patients (57). However, a larger cohort of HIV patients
showed that T-cell impairment does not sensitize individuals for type 2 EBV infections (58). Thus, an alternate
explanation is that type 2 EBV directly interacts with host regulatory components in order to interfere with
immunoproteasome complex formation. Reduced transcriptional expression of these genes in EBV type 2 eBL
tumors implies a mechanism in which viral components (coding or non-coding) suppress JAK/STAT1 mediated
transcription. This could be an additional mechanism by which type 2 EBV is able to escape from immune-
on July 8, 2018. © 2017 American Association for Cancer Research. mcr.aacrjournals.org Downloaded from
Author manuscripts have been peer reviewed and accepted for publication but have not yet been edited. Author Manuscript Published OnlineFirst on January 30, 2017; DOI: 10.1158/1541-7786.MCR-16-0305
18
surveillance by preventing T-cell responses (59). Since we did not observe any viral transcriptional pattern
differences compared to type 1 genes, this phenomenon requires further investigation to confirm.
The mutated genes we observed in BL tumors are also dysregulated or mutated in other cancer types
with viral etiologies. DDX3X is activated by Hepatitis C Virus (HCV) leading to alteration of host cellular
gene expressions (60). RHOA and CCND3 are dysregulated by Human T lymphotropic virus type I (HTLV-I)
(61). For the DNA tumor viruses, KSV tumors appear to be driven by viral programming in settings of
immunocompromised with only a few described driver mutations including interleukin 1 receptor-associated
kinase (IRAK1) in primary effusion lymphoma (62). In HPV-associated squamous cell cervical carcinoma the
most common driver mutations are PIK3CA, EP300, TP53, FBXW7, and MAPK1 (63). PI3K mutations are
common in epithelial derived EBV-positive nasopharyngeal carcinoma, with the most commonly somatically
altered genes being TP53, CDKN2A/B, ARID1A, CCND1, SYNE1 and PI3KCA (64)(65). While these are
comparable with BL the targeting of PI3K pathway, SWI/SNF and p53, the overall differences suggest that
even between EBV malignancies the major factor in determining what genes are the lynch pins between
normalcy and malignancy is the cell lineage and state. This concept is supported by the greater mutational
commonality with other lymphomas and the fact that both virus positive and negative BL tumors have
mutational commonality differing mainly in degree.
In summary, we have illustrated the key pathways implicated in BL oncogenesis integrating our
analytical results with current literature (Fig. 5C). This expanded view of BL oncogenesis more clearly defines
a role for EBV. Driving proliferation through PTEN/PI3K/AKT and CCND3 pathways may be a key step
toward bypassing the lack of mutations in the TCF3/ID3/CCND3 axis that may include SWI/SNF interactions
of SMARCA4 as well. MYC translocation provides the pivotal accelerant while gain of function mutations in
CCND3 strengthens the pressure. Although the mutated genes functioning in B cell development and
chromatin remodeling complexes might be contributing to this signaling, our results in terms of gene
expression and pathway differences suggest a role for viral microRNAs which can inhibit PTEN function and
cause activated BCR signaling via AKT. Other genes frequently mutated in BL play roles in distinct but
relevant pathways such as DNA repair and focal adhesion. Overall, this combined model demonstrates
on July 8, 2018. © 2017 American Association for Cancer Research. mcr.aacrjournals.org Downloaded from
Author manuscripts have been peer reviewed and accepted for publication but have not yet been edited. Author Manuscript Published OnlineFirst on January 30, 2017; DOI: 10.1158/1541-7786.MCR-16-0305

19
pathogenic mechanistic routes to tumorigenesis BL and introduces a defined role for EBV that warrants further
interrogation.
ACKNOWLEDGEMENTS
We thank the children and their families for their participation and the study staff at Jaramogi Oginga Odinga
Teaching and Referral Hospital for their assistance with this study. We thank the Director, Kenya Medical
Research Institute for approving this manuscript for publication.
on July 8, 2018. © 2017 American Association for Cancer Research. mcr.aacrjournals.org Downloaded from
Author manuscripts have been peer reviewed and accepted for publication but have not yet been edited. Author Manuscript Published OnlineFirst on January 30, 2017; DOI: 10.1158/1541-7786.MCR-16-0305

20
REFERENCES
1. Burkitt D, Denis B. MALIGNANT LYMPHOMA IN AFRICAN CHILDREN. Lancet. 1961;277:1410–1.
2. Satou A, Akira S, Naoko A, Atsuko N, Tomoo O, Masahito T, et al. Epstein-Barr Virus (EBV)-positive Sporadic Burkitt Lymphoma. Am J Surg Pathol. 2015;39:227–35.
3. Ferry JA. Burkitt’s lymphoma: clinicopathologic features and differential diagnosis. Oncologist. 2006;11:375–83.
4. Boerma EG, van Imhoff GW, Appel IM, Veeger NJGM, Kluin PM, Kluin-Nelemans JC. Gender and age-related differences in Burkitt lymphoma – epidemiological and clinical data from The Netherlands. Eur J Cancer. 2004;40:2781–7.
5. Chen B-J, Chang S-T, Weng S-F, Huang W-T, Chu P-Y, Hsieh P-P, et al. EBV-associated Burkitt lymphoma in Taiwan is not age-related. Leuk Lymphoma. 2016;57:644–53.
6. Jarrett RF, Stark GL, White J, Angus B, Alexander FE, Krajewski AS, et al. Impact of tumor Epstein-Barr virus status on presenting features and outcome in age-defined subgroups of patients with classic Hodgkin lymphoma: a population-based study. Blood. 2005;106:2444–51.
7. Park S, Lee J, Ko YH, Han A, Jun HJ, Lee SC, et al. The impact of Epstein-Barr virus status on clinical outcome in diffuse large B-cell lymphoma. Blood. 2007;110:972–8.
8. Navari M, Etebari M, De Falco G, Ambrosio MR, Gibellini D, Leoncini L, et al. The presence of Epstein-Barr virus significantly impacts the transcriptional profile in immunodeficiency-associated Burkitt lymphoma. Front Microbiol. 2015;6:556.
9. Rowe M, Rowe DT, Gregory CD, Young LS, Farrell PJ, Rupani H, et al. Differences in B cell growth phenotype reflect novel patterns of Epstein-Barr virus latent gene expression in Burkitt’s lymphoma cells. EMBO J. 1987;6:2743–51.
10. Kelly G, Bell A, Rickinson A. Epstein–Barr virus–associated Burkitt lymphomagenesis selects for downregulation of the nuclear antigen EBNA2. Nat Med. Nature Publishing Group; 2002;8:1098–104.
11. Cohen JI, Wang F, Mannick J, Kieff E. Epstein-Barr virus nuclear protein 2 is a key determinant of lymphocyte transformation. Proceedings of the National Academy of Sciences. 1989;86:9558–62.
12. Rowe M, Young LS, Cadwallader K, Petti L, Kieff E, Rickinson AB. Distinction between Epstein-Barr virus type A (EBNA 2A) and type B (EBNA 2B) isolates extends to the EBNA 3 family of nuclear proteins. J Virol. 1989;63:1031–9.
13. Dambaugh T, Hennessy K, Chamnankit L, Kieff E. U2 region of Epstein-Barr virus DNA may encode Epstein-Barr nuclear antigen 2. Proc Natl Acad Sci U S A. 1984;81:7632–6.
14. Zimber U, Adldinger HK, Lenoir GM, Vuillaume M, Knebel-Doeberitz MV, Laux G, et al. Geographical prevalence of two types of Epstein-Barr virus. Virology. 1986;154:56–66.
15. Rickinson AB, Young LS, Rowe M. Influence of the Epstein-Barr virus nuclear antigen EBNA 2 on the growth phenotype of virus-transformed B cells. J Virol. 1987;61:1310–7.
16. Young LS, Yao QY, Rooney CM, Sculley TB, Moss DJ, Rupani H, et al. New Type B Isolates of Epstein—Barr Virus from Burkitt’s Lymphoma and from Normal Individuals in Endemic Areas. J Gen Virol. Microbiology Society; 1987;68:2853–62.
17. Mwanda OW. Clinical characteristics of Burkitt’s lymphoma seen in Kenyan patients. East Afr Med J. 2004;S78–89.
18. Buckle G, Maranda L, Skiles J, Ong’echa JM, Foley J, Epstein M, et al. Factors influencing survival among Kenyan children diagnosed with endemic Burkitt lymphoma between 2003 and 2011: A historical cohort study. Int J Cancer [Internet]. 2016; Available from: http://dx.doi.org/10.1002/ijc.30170
on July 8, 2018. © 2017 American Association for Cancer Research. mcr.aacrjournals.org Downloaded from
Author manuscripts have been peer reviewed and accepted for publication but have not yet been edited. Author Manuscript Published OnlineFirst on January 30, 2017; DOI: 10.1158/1541-7786.MCR-16-0305
21
19. Asito AS, Piriou E, Odada PS, Fiore N, Middeldorp JM, Long C, et al. Elevated anti-Zta IgG levels and EBV viral load are associated with site of tumor presentation in endemic Burkitt’s lymphoma patients: a case control study. Infect Agent Cancer. 2010;5:13.
20. Janz S, Potter M, Rabkin CS. Lymphoma- and leukemia-associated chromosomal translocations in healthy individuals. Genes Chromosomes Cancer. 2003;36:211–23.
21. Schmitz R, Roland S, Young RM, Michele C, Sameer J, Wenming X, et al. Burkitt lymphoma pathogenesis and therapeutic targets from structural and functional genomics. Nature. 2012;490:116–20.
22. Richter J, Schlesner M, Hoffmann S, Kreuz M, Leich E, Burkhardt B, et al. Recurrent mutation of the ID3 gene in Burkitt lymphoma identified by integrated genome, exome and transcriptome sequencing. Nat Genet. 2012;44:1316–20.
23. Love C, Cassandra L, Zhen S, Dereje J, Guojie L, Jenny Z, et al. The genetic landscape of mutations in Burkitt lymphoma. Nat Genet. 2012;44:1321–5.
24. Abate F, Ambrosio MR, Mundo L, Laginestra MA, Fuligni F, Rossi M, et al. Distinct Viral and Mutational Spectrum of Endemic Burkitt Lymphoma. PLoS Pathog. 2015;11:e1005158.
25. Zhang Z, Theurkauf WE, Weng Z, Zamore PD. Strand-specific libraries for high throughput RNA sequencing (RNA-Seq) prepared without poly(A) selection. Silence. 2012;3:9.
26. Li B, Bo L, Dewey CN. RSEM: accurate transcript quantification from RNA-Seq data with or without a reference genome. BMC Bioinformatics. 2011;12:323.
27. Love MI, Huber W, Anders S. Moderated estimation of fold change and dispersion for RNA-seq data with DESeq2. Genome Biol. 2014;15:550.
28. Leek JT. svaseq: removing batch effects and other unwanted noise from sequencing data. Nucleic Acids Res [Internet]. 2014;42. Available from: http://dx.doi.org/10.1093/nar/gku864
29. Subramanian A, Tamayo P, Mootha VK, Mukherjee S, Ebert BL, Gillette MA, et al. Gene set enrichment analysis: a knowledge-based approach for interpreting genome-wide expression profiles. Proc Natl Acad Sci U S A. 2005;102:15545–50.
30. Liberzon A, Subramanian A, Pinchback R, Thorvaldsdóttir H, Tamayo P, Mesirov JP. Molecular signatures database (MSigDB) 3.0. Bioinformatics. 2011;27:1739–40.
31. Dobin A, Davis CA, Schlesinger F, Drenkow J, Zaleski C, Jha S, et al. STAR: ultrafast universal RNA-seq aligner. Bioinformatics. 2013;29:15–21.
32. McKenna A, Hanna M, Banks E, Sivachenko A, Cibulskis K, Kernytsky A, et al. The Genome Analysis Toolkit: a MapReduce framework for analyzing next-generation DNA sequencing data. Genome Res. 2010;20:1297–303.
33. Abbas AR, Baldwin D, Ma Y, Ouyang W, Gurney A, Martin F, et al. Immune response in silico (IRIS): immune-specific genes identified from a compendium of microarray expression data. Genes Immun. 2005;6:319–31.
34. Lazzi S, Ferrari F, Nyongo A, Palummo N, de Milito A, Zazzi M, et al. HIV-associated malignant lymphomas in Kenya (Equatorial Africa). Hum Pathol. 1998;29:1285–9.
35. Teng B, Murthy KS, Kuemmerle JF, Grider JR, Sase K, Michel T, et al. Expression of endothelial nitric oxide synthase in human and rabbit gastrointestinal smooth muscle cells. Am J Physiol. 1998;275:G342–51.
36. Kawauchi K, Ogasawara T, Yasuyama M, Otsuka K, Yamada O. The PI3K/Akt pathway as a target in the treatment of hematologic malignancies. Anticancer Agents Med Chem. 2009;9:550–9.
37. Rickert RC. New insights into pre-BCR and BCR signalling with relevance to B cell malignancies. Nat Rev Immunol. 2013;13:578–91.
38. Morin RD, Mungall K, Pleasance E, Mungall AJ, Goya R, Huff RD, et al. Mutational and structural analysis of
on July 8, 2018. © 2017 American Association for Cancer Research. mcr.aacrjournals.org Downloaded from
Author manuscripts have been peer reviewed and accepted for publication but have not yet been edited. Author Manuscript Published OnlineFirst on January 30, 2017; DOI: 10.1158/1541-7786.MCR-16-0305
22
diffuse large B-cell lymphoma using whole-genome sequencing. Blood. 2013;122:1256–65.
39. Tsujimoto K, Ono T, Sato M, Nishida T, Oguma T, Tadakuma T. Regulation of the expression of caspase-9 by the transcription factor activator protein-4 in glucocorticoid-induced apoptosis. J Biol Chem. 2005;280:27638–44.
40. Jung P, Hermeking H. The c-MYC-AP4-p21 cascade. Cell Cycle. 2009;8:982–9.
41. Mathieu A-L, Verronese E, Rice GI, Fouyssac F, Bertrand Y, Picard C, et al. PRKDC mutations associated with immunodeficiency, granuloma, and autoimmune regulator-dependent autoimmunity. J Allergy Clin Immunol. 2015;135:1578–88.e5.
42. Okkels H, Lindorff-Larsen K, Thorlasius-Ussing O, Vyberg M, Lindebjerg J, Sunde L, et al. MSH6 mutations are frequent in hereditary nonpolyposis colorectal cancer families with normal pMSH6 expression as detected by immunohistochemistry. Appl Immunohistochem Mol Morphol. 2012;20:470–7.
43. Heikkinen K, Karppinen S-M, Soini Y, Mäkinen M, Winqvist R. Mutation screening of Mre11 complex genes: indication of RAD50 involvement in breast and ovarian cancer susceptibility. J Med Genet. 2003;40:e131.
44. Zani VJ, Asou N, Jadayel D, Heward JM, Shipley J, Nacheva E, et al. Molecular cloning of complex chromosomal translocation t(8;14;12)(q24.1;q32.3;q24.1) in a Burkitt lymphoma cell line defines a new gene (BCL7A) with homology to caldesmon. Blood. 1996;87:3124–34.
45. Blenk S, Engelmann J, Weniger M, Schultz J, Dittrich M, Rosenwald A, et al. Germinal center B cell-like (GCB) and activated B cell-like (ABC) type of diffuse large B cell lymphoma (DLBCL): analysis of molecular predictors, signatures, cell cycle state and patient survival. Cancer Inform. 2007;3:399–420.
46. Kadoch C, Hargreaves DC, Hodges C, Elias L, Ho L, Ranish J, et al. Proteomic and bioinformatic analysis of mammalian SWI/SNF complexes identifies extensive roles in human malignancy. Nat Genet. 2013;45:592–601.
47. Piccaluga PP, De Falco G, Kustagi M, Gazzola A, Agostinelli C, Tripodo C, et al. Gene expression analysis uncovers similarity and differences among Burkitt lymphoma subtypes. Blood. 2011;117:3596–608.
48. Kazembe P, Hesseling PB, Griffin BE, Lampert I, Wessels G. Long term survival of children with Burkitt lymphoma in Malawi after cyclophosphamide monotherapy. Med Pediatr Oncol. 2003;40:23–5.
49. Moody CA, Scott RS, Amirghahari N, Nathan C-A, Young LS, Dawson CW, et al. Modulation of the cell growth regulator mTOR by Epstein-Barr virus-encoded LMP2A. J Virol. 2005;79:5499–506.
50. Yang H-J, Hong-Jie Y, Tie-Jun H, Chang-Fu Y, Li-Xie P, Ran-Yi L, et al. Comprehensive profiling of Epstein-Barr virus-encoded miRNA species associated with specific latency types in tumor cells. Virol J. 2013;10:314.
51. Forte E, Salinas RE, Chang C, Zhou T, Linnstaedt SD, Gottwein E, et al. The Epstein-Barr virus (EBV)-induced tumor suppressor microRNA MiR-34a is growth promoting in EBV-infected B cells. J Virol. 2012;86:6889–98.
52. Cai L, Li J, Zhang X, Lu Y, Wang J, Lyu X, et al. Gold nano-particles (AuNPs) carrying anti-EBV-miR-BART7-3p inhibit growth of EBV-positive nasopharyngeal carcinoma. Oncotarget. 2015;6:7838–50.
53. Ambrosio MR, Navari M, Di Lisio L, Leon EA, Onnis A, Gazaneo S, et al. The Epstein Barr-encoded BART-6-3p microRNA affects regulation of cell growth and immuno response in Burkitt lymphoma. Infect Agent Cancer. 2014;9:12.
54. Fujita S, Buziba N, Kumatori A, Senba M, Yamaguchi A, Toriyama K. Early stage of Epstein-Barr virus lytic infection leading to the “starry sky” pattern formation in endemic Burkitt lymphoma. Arch Pathol Lab Med. 2004;128:549–52.
55. Arvey A, Ojesina AI, Pedamallu CS, Ballon G, Jung J, Duke F, et al. The tumor virus landscape of AIDS-related lymphomas. Blood. 2015;125:e14–22.
56. Moormann AM, Heller KN, Chelimo K, Embury P, Ploutz-Snyder R, Otieno JA, et al. Children with endemic Burkitt lymphoma are deficient in EBNA1-specific IFN-gamma T cell responses. Int J Cancer. 2009;124:1721–6.
on July 8, 2018. © 2017 American Association for Cancer Research. mcr.aacrjournals.org Downloaded from
Author manuscripts have been peer reviewed and accepted for publication but have not yet been edited. Author Manuscript Published OnlineFirst on January 30, 2017; DOI: 10.1158/1541-7786.MCR-16-0305
23
57. van Baarle D, Hovenkamp E, Dukers NH, Renwick N, Kersten MJ, Goudsmit J, et al. High prevalence of Epstein-Barr virus type 2 among homosexual men is caused by sexual transmission. J Infect Dis. 2000;181:2045–9.
58. Yao QY, Croom-Carter DS, Tierney RJ, Habeshaw G, Wilde JT, Hill FG, et al. Epidemiology of infection with Epstein-Barr virus types 1 and 2: lessons from the study of a T-cell-immunocompromised hemophilic cohort. J Virol. 1998;72:4352–63.
59. Sijts A, Sun Y, Janek K, Kral S, Paschen A, Schadendorf D, et al. The role of the proteasome activator PA28 in MHC class I antigen processing. Mol Immunol. 2002;39:165–9.
60. Ariumi Y, Kuroki M, Abe K-I, Dansako H, Ikeda M, Wakita T, et al. DDX3 DEAD-box RNA helicase is required for hepatitis C virus RNA replication. J Virol. 2007;81:13922–6.
61. Marriott SJ, Semmes OJ. Impact of HTLV-I Tax on cell cycle progression and the cellular DNA damage repair response. Oncogene. 2005;24:5986–95.
62. Yang D, Chen W, Xiong J, Sherrod CJ, Henry DH, Dittmer DP. Interleukin 1 receptor-associated kinase 1 (IRAK1) mutation is a common, essential driver for Kaposi sarcoma herpesvirus lymphoma. Proc Natl Acad Sci U S A. 2014;111:E4762–8.
63. Ojesina AI, Lichtenstein L, Freeman SS, Pedamallu CS, Imaz-Rosshandler I, Pugh TJ, et al. Landscape of genomic alterations in cervical carcinomas. Nature. 2014;506:371–5.
64. Lo K-W, Chung GT-Y, To K-F. Deciphering the molecular genetic basis of NPC through molecular, cytogenetic, and epigenetic approaches. Semin Cancer Biol. 2012;22:79–86.
65. Lin D-C, Meng X, Hazawa M, Nagata Y, Varela AM, Xu L, et al. The genomic landscape of nasopharyngeal carcinoma. Nat Genet. 2014;46:866–71.
on July 8, 2018. © 2017 American Association for Cancer Research. mcr.aacrjournals.org Downloaded from
Author manuscripts have been peer reviewed and accepted for publication but have not yet been edited. Author Manuscript Published OnlineFirst on January 30, 2017; DOI: 10.1158/1541-7786.MCR-16-0305
24
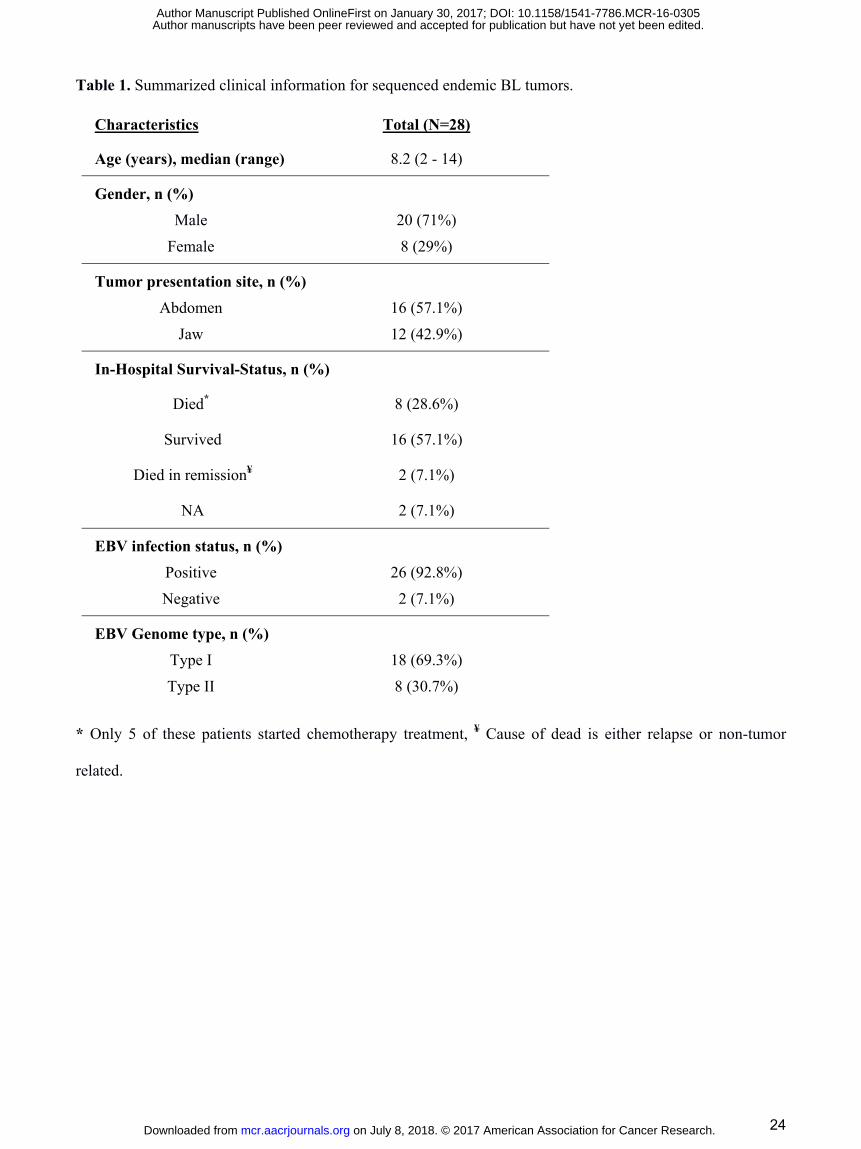
Table 1. Summarized clinical information for sequenced endemic BL tumors.
Characteristics Total (N=28)
Age (years), median (range) 8.2 (2 - 14)
Gender, n (%) Male 20 (71%)
Female 8 (29%)
Tumor presentation site, n (%) Abdomen 16 (57.1%)
Jaw 12 (42.9%)
In-Hospital Survival-Status, n (%)
Died* 8 (28.6%)
Survived 16 (57.1%)
Died in remission¥ 2 (7.1%)
NA 2 (7.1%)
EBV infection status, n (%) Positive 26 (92.8%) Negative 2 (7.1%)
EBV Genome type, n (%) Type I 18 (69.3%) Type II 8 (30.7%)
* Only 5 of these patients started chemotherapy treatment, ¥ Cause of dead is either relapse or non-tumor
related.
on July 8, 2018. © 2017 American Association for Cancer Research. mcr.aacrjournals.org Downloaded from
Author manuscripts have been peer reviewed and accepted for publication but have not yet been edited. Author Manuscript Published OnlineFirst on January 30, 2017; DOI: 10.1158/1541-7786.MCR-16-0305
25
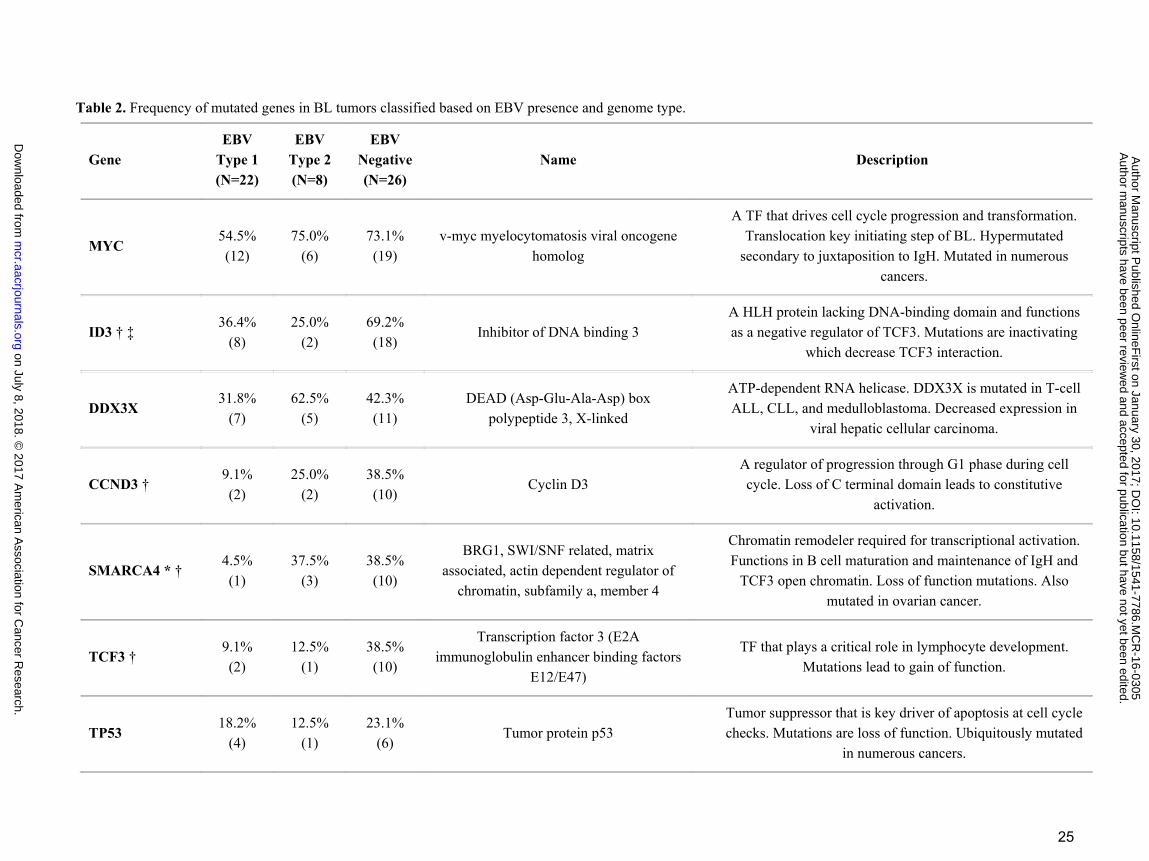
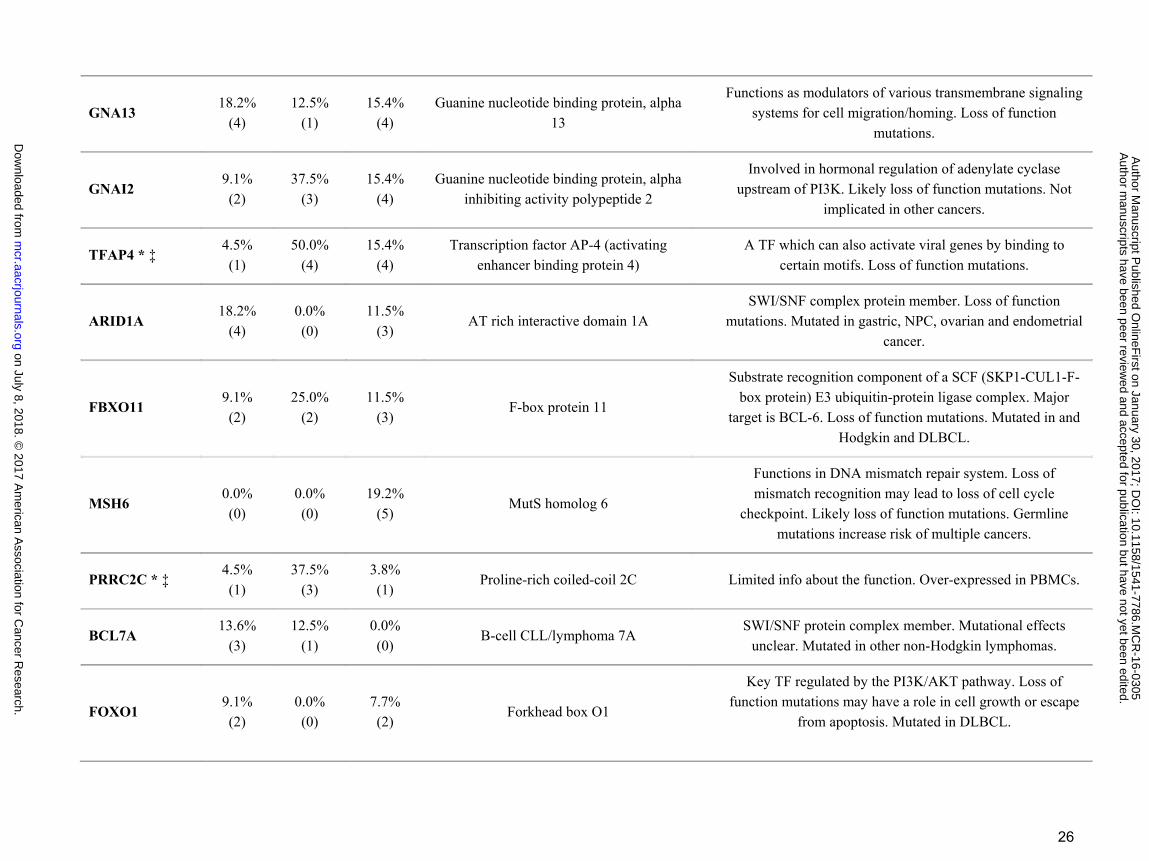
Table 2. Frequency of mutated genes in BL tumors classified based on EBV presence and genome type.
Gene EBV
Type 1 (N=22)
EBV Type 2 (N=8)
EBV Negative (N=26)
Name Description
MYC 54.5% (12)
75.0% (6)
73.1% (19)
v-myc myelocytomatosis viral oncogene homolog
A TF that drives cell cycle progression and transformation. Translocation key initiating step of BL. Hypermutated
secondary to juxtaposition to IgH. Mutated in numerous cancers.
ID3 † ‡ 36.4%
(8) 25.0%
(2) 69.2% (18)
Inhibitor of DNA binding 3 A HLH protein lacking DNA-binding domain and functions as a negative regulator of TCF3. Mutations are inactivating
which decrease TCF3 interaction.
DDX3X 31.8%
(7) 62.5%
(5) 42.3% (11)
DEAD (Asp-Glu-Ala-Asp) box polypeptide 3, X-linked
ATP-dependent RNA helicase. DDX3X is mutated in T-cell ALL, CLL, and medulloblastoma. Decreased expression in
viral hepatic cellular carcinoma.
CCND3 † 9.1% (2)
25.0% (2)
38.5% (10)
Cyclin D3 A regulator of progression through G1 phase during cell cycle. Loss of C terminal domain leads to constitutive
activation.
SMARCA4 * † 4.5% (1)
37.5% (3)
38.5% (10)
BRG1, SWI/SNF related, matrix associated, actin dependent regulator of
chromatin, subfamily a, member 4
Chromatin remodeler required for transcriptional activation. Functions in B cell maturation and maintenance of IgH and
TCF3 open chromatin. Loss of function mutations. Also mutated in ovarian cancer.
TCF3 † 9.1% (2)
12.5% (1)
38.5% (10)
Transcription factor 3 (E2A immunoglobulin enhancer binding factors
E12/E47)
TF that plays a critical role in lymphocyte development. Mutations lead to gain of function.
TP53 18.2%
(4) 12.5%
(1) 23.1%
(6) Tumor protein p53
Tumor suppressor that is key driver of apoptosis at cell cycle checks. Mutations are loss of function. Ubiquitously mutated
in numerous cancers.
on July 8, 2018. © 2017 A
merican A
ssociation for Cancer R
esearch. m
cr.aacrjournals.org D
ownloaded from
Author m
anuscripts have been peer reviewed and accepted for publication but have not yet been edited.
Author M
anuscript Published O
nlineFirst on January 30, 2017; D
OI: 10.1158/1541-7786.M
CR
-16-0305
26
GNA13 18.2%
(4) 12.5%
(1) 15.4%
(4) Guanine nucleotide binding protein, alpha
13
Functions as modulators of various transmembrane signaling systems for cell migration/homing. Loss of function
mutations.
GNAI2 9.1% (2)
37.5% (3)
15.4% (4)
Guanine nucleotide binding protein, alpha inhibiting activity polypeptide 2
Involved in hormonal regulation of adenylate cyclase upstream of PI3K. Likely loss of function mutations. Not
implicated in other cancers.
TFAP4 * ‡ 4.5% (1)
50.0% (4)
15.4% (4)
Transcription factor AP-4 (activating enhancer binding protein 4)
A TF which can also activate viral genes by binding to certain motifs. Loss of function mutations.
ARID1A 18.2%
(4) 0.0% (0)
11.5% (3)
AT rich interactive domain 1A SWI/SNF complex protein member. Loss of function
mutations. Mutated in gastric, NPC, ovarian and endometrial cancer.
FBXO11 9.1% (2)
25.0% (2)
11.5% (3)
F-box protein 11
Substrate recognition component of a SCF (SKP1-CUL1-F-box protein) E3 ubiquitin-protein ligase complex. Major
target is BCL-6. Loss of function mutations. Mutated in and Hodgkin and DLBCL.
MSH6 0.0% (0)
0.0% (0)
19.2% (5)
MutS homolog 6
Functions in DNA mismatch repair system. Loss of mismatch recognition may lead to loss of cell cycle
checkpoint. Likely loss of function mutations. Germline mutations increase risk of multiple cancers.
PRRC2C * ‡ 4.5% (1)
37.5% (3)
3.8% (1)
Proline-rich coiled-coil 2C Limited info about the function. Over-expressed in PBMCs.
BCL7A 13.6%
(3) 12.5%
(1) 0.0% (0)
B-cell CLL/lymphoma 7A SWI/SNF protein complex member. Mutational effects
unclear. Mutated in other non-Hodgkin lymphomas.
FOXO1 9.1% (2)
0.0% (0)
7.7% (2)
Forkhead box O1
Key TF regulated by the PI3K/AKT pathway. Loss of function mutations may have a role in cell growth or escape
from apoptosis. Mutated in DLBCL.
on July 8, 2018. © 2017 A
merican A
ssociation for Cancer R
esearch. m
cr.aacrjournals.org D
ownloaded from
Author m
anuscripts have been peer reviewed and accepted for publication but have not yet been edited.
Author M
anuscript Published O
nlineFirst on January 30, 2017; D
OI: 10.1158/1541-7786.M
CR
-16-0305
27
PLCG2 * 0.0% (0)
25.0% (2)
7.7% (2)
Phospholipase C, gamma 2 A crucial enzyme in BCR signaling upstream of PI3K/AKT
pathway. Mutated frequently in melanoma.
PRKDC 9.1% (2)
12.5% (1)
3.8% (1)
Protein kinase, DNA-activated, catalytic polypeptide
Functions in DSBR and V(D)J recombination and repair of double strand breaks. Mutation effects unclear. Mutated in
DLBCL.
RAD50 4.5% (1)
12.5% (1)
7.7% (2)
Double strand break repair protein
A component of MRN complex which functions in DSBR and through recombination or non-homologous end joining.
Likely loss of function. Mutations observed in breast and ovarian cancer.
RHOA 13.6%
(3) 12.5%
(1) 0.0% (0)
Ras homolog family member A Regulation of signal transduction between membrane receptors and focal adhesion molecules. Likely loss of
function with potential for tumor spread metastasis.
RPRD2 9.1% (2)
0.0% (0)
7.7% (2)
Regulation of nuclear pre-mRNA domain containing 2
Involves in gene expression and transcriptional initiation pathways. Mutation effects unclear. Mutations not observed
in other cancers.
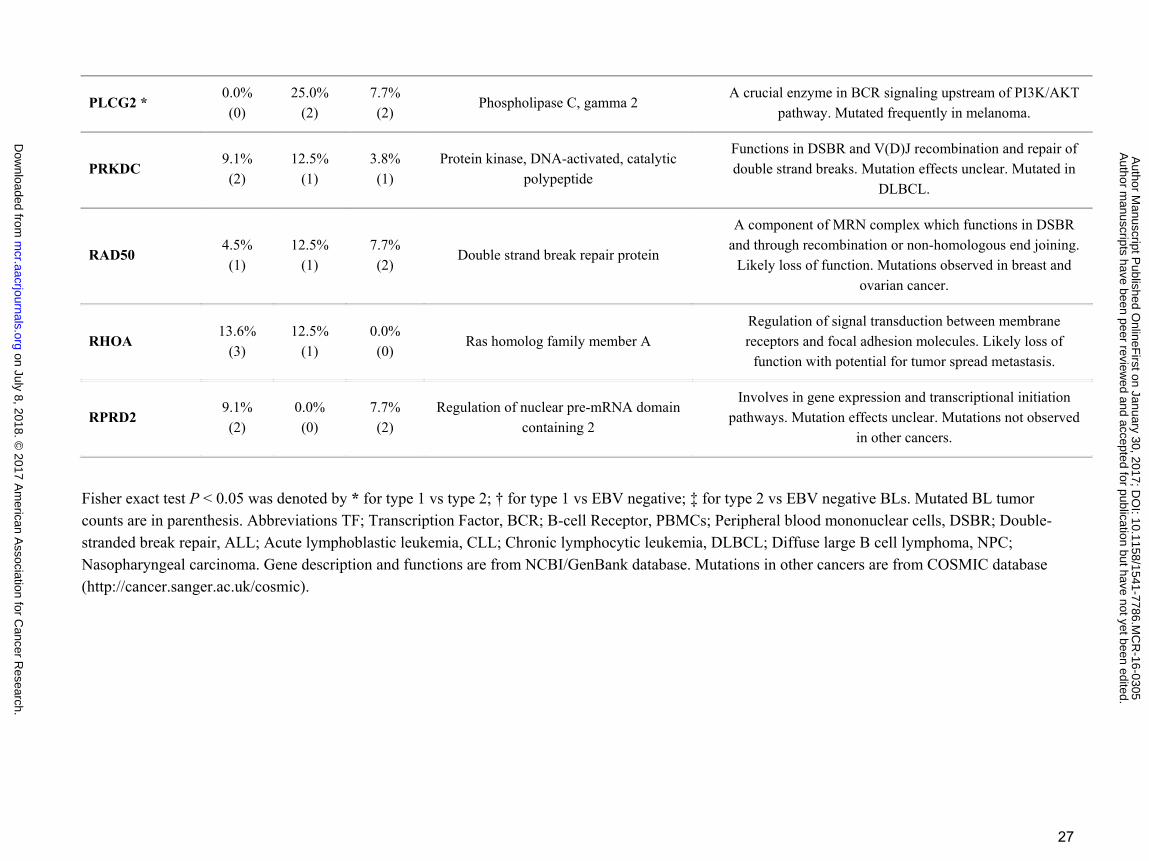
Fisher exact test P < 0.05 was denoted by * for type 1 vs type 2; † for type 1 vs EBV negative; ‡ for type 2 vs EBV negative BLs. Mutated BL tumor counts are in parenthesis. Abbreviations TF; Transcription Factor, BCR; B-cell Receptor, PBMCs; Peripheral blood mononuclear cells, DSBR; Double-stranded break repair, ALL; Acute lymphoblastic leukemia, CLL; Chronic lymphocytic leukemia, DLBCL; Diffuse large B cell lymphoma, NPC; Nasopharyngeal carcinoma. Gene description and functions are from NCBI/GenBank database. Mutations in other cancers are from COSMIC database (http://cancer.sanger.ac.uk/cosmic).
on July 8, 2018. © 2017 A
merican A
ssociation for Cancer R
esearch. m
cr.aacrjournals.org D
ownloaded from
Author m
anuscripts have been peer reviewed and accepted for publication but have not yet been edited.
Author M
anuscript Published O
nlineFirst on January 30, 2017; D
OI: 10.1158/1541-7786.M
CR
-16-0305
28
FIGURE LEGENDS:
Figure 1
Expression heatmap for all known EBV genes for 26 eBL, 4 sBL and 3 long-term BL cultures
(Daudi, Raji, Namalwa) that were found to be EBV positive. This correlation based clustering
heatmap using log2 transformed FPKM values demonstrates a predominant expression pattern
resembling latency I for most of the BLs while two eBLs (eBL_23 and eBL_25) and cell lines
have elevated expression in other genes. eBL_02 and eBL_20 show intermediate level lytic
genes such as BMRF1, BALF2, and BSLF2/BMLF1 in addition to the two eBLs that cluster with
cell lines.
Figure 2
Sample to sample clustering of BL tumors based on expression profiles of top 10,000 genes with
highest correlation of variation (CV) values (calculated using regularized log transformed
expression data). While 2 sBLs (sBL_u1 and sBL_u2) separate out from 28 eBLs, eBL tumor
expression profiles demonstrate greater correlation within eBLs (r > 0.95, Pearson correlation;
Dark red is 1.0) compared to sBLs, which might be due to differences in biopsy and preservation
methods or biology. Overall gene expression correlations between eBLs does not reveal
significant clustering consistent with no major underlying molecular subtypes nor clustering
correlating with tumor presentation site, treatment outcome, or EBV type.
Figure 3
Clustering heatmap of significantly differentially expressed human genes between factors of
phenotypes. Sample wise scaled log2 expression values range between lowest as light green and
on July 8, 2018. © 2017 American Association for Cancer Research. mcr.aacrjournals.org Downloaded from
Author manuscripts have been peer reviewed and accepted for publication but have not yet been edited. Author Manuscript Published OnlineFirst on January 30, 2017; DOI: 10.1158/1541-7786.MCR-16-0305
29
highest as dark red. Clustering dendrogram based on Pearson correlation demonstrates tumor
grouping proper to the phenotype of interest. A) Significantly differentially expressed genes
between Survivors and Nonsurvivors (BH Padj < 0.1). B) Significantly differentially expressed
human genes between eBL tumors carrying EBV Type 1 and eBL tumor with EBV Type 2 (BH
Padj < 0.1).
Figure 4
Gene set enrichment plot and expression heatmap of corresponding genes in the enriched gene
set. Left panels include the running enrichment score throughout the gene set and projection of
genes in the geneset to the complete list of genes rank ordered based on signal to noise ratio.
Leading edge genes that build up the enrichment score of the geneset (RES at the peak) are the
most important genes for these tumor sample comparison. On the expression heatmap (columns
are tumors, rows are genes in the gene set), dark red represent higher expression while dark blue
lower expression. A) Genes in this enrichment have been shown to be downregulated upon
PTEN knockdown, and are observed to be downregulated in EBV positive BLs relative to EBV
negative BLs (ES = 0.438, Nominal P = 0.00, FDR q = 0.0959) and B) Hallmark gene set
enrichment showing mTOR complex 1 signaling genes to be relatively more activated in EBV
positive BLs compared to negative BLs (ES = -0.439, Nominal P = 0.0665, FDR q = 0.151).
Enrichment of genes associated with mTOR activation supports the enrichment of genes linked
to PTEN inhibition.
Figure 5
Mutational landscape of BL tumors. A) This panel demonstrates mutated gene distribution in
each tumor sample (columns) are tumors and rows are top frequently mutated genes (>10% of
on July 8, 2018. © 2017 American Association for Cancer Research. mcr.aacrjournals.org Downloaded from
Author manuscripts have been peer reviewed and accepted for publication but have not yet been edited. Author Manuscript Published OnlineFirst on January 30, 2017; DOI: 10.1158/1541-7786.MCR-16-0305
30
samples mutated at least once). Tumor samples were grouped based on their EBV content and
second color bar shows the subtype of the tumor. Red squares represent mutated gene while blue
is for no mutation detected. Barplot on the right measures the frequency of mutated tumor
samples and compares regarding the subtype of BLs (Percent frequency). Similarly, barplot on
the left compares the mutated tumor frequencies for each gene stratified by EBV status (* P <
0.05, Fisher’s Exact). B) Average number of mutated genes per BL tumor by EBV type. Error
bars represent standard error (*** P < 0.01, t-test). C) Schematic overview of the proposed key
pathways and frequently and mutated genes in eBL pathogenesis. Genes in the boxes are found
to be frequently mutated (gain of function and likely loss of function, represented by green and
light-red boxes, respectively). Likely key interactions with EBV components are shown are in
red connections. Possible interactions are shown in grey.
on July 8, 2018. © 2017 American Association for Cancer Research. mcr.aacrjournals.org Downloaded from
Author manuscripts have been peer reviewed and accepted for publication but have not yet been edited. Author Manuscript Published OnlineFirst on January 30, 2017; DOI: 10.1158/1541-7786.MCR-16-0305
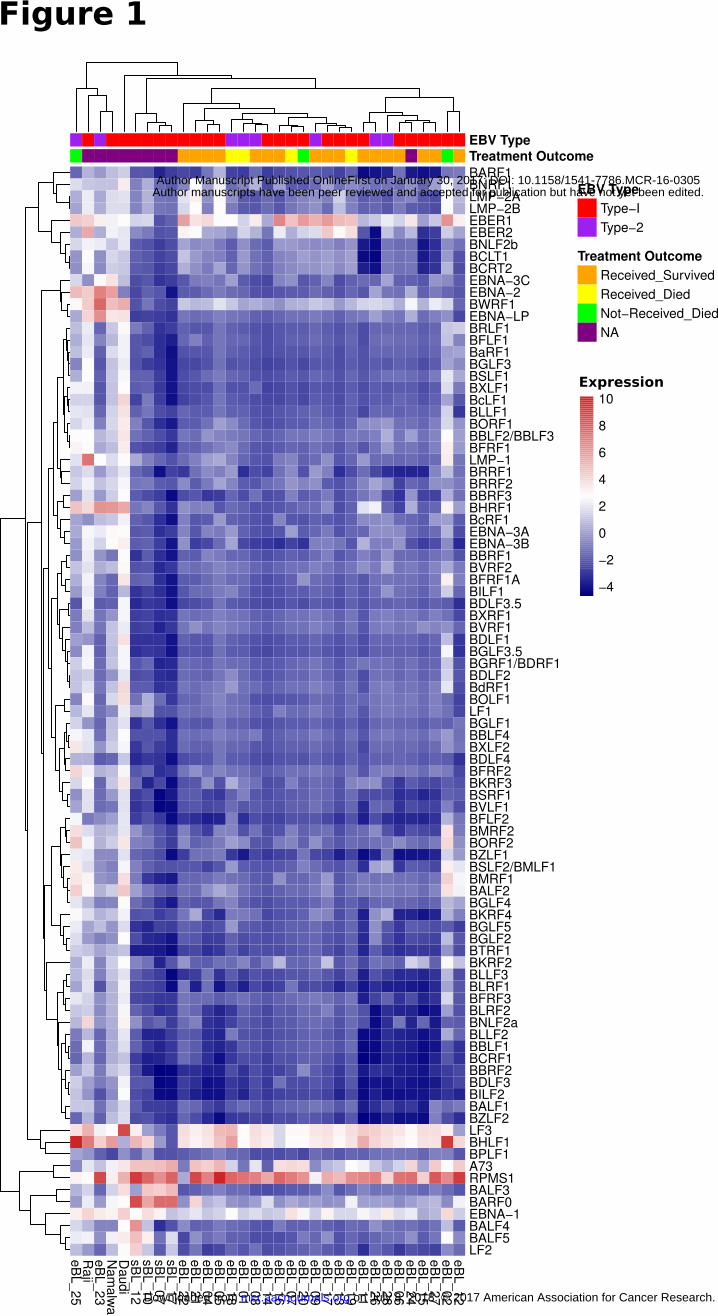
eB
L_25
Raji
eB
L_23
Nam
alw
aD
audi
sB
L_12
sB
L_10
sB
L_07
sB
L_17
eB
L_22
eB
L_21
eB
L_04
eB
L_05
eB
L_18
eB
L_01
eB
L_08
eB
L_14
eB
L_16
eB
L_07
eB
L_20
eB
L_09
eB
L_17
eB
L_13
eB
L_19
eB
L_11
eB
L_26
eB
L_28
eB
L_06
eB
L_24
eB
L_15
eB
L_27
eB
L_02
eB
L_12
BARF1BNRF1LMP−2ALMP−2BEBER1EBER2BNLF2bBCLT1BCRT2EBNA−3CEBNA−2BWRF1EBNA−LPBRLF1BFLF1BaRF1BGLF3BSLF1BXLF1BcLF1BLLF1BORF1BBLF2/BBLF3BFRF1LMP−1BRRF1BRRF2BBRF3BHRF1BcRF1EBNA−3AEBNA−3BBBRF1BVRF2BFRF1ABILF1BDLF3.5BXRF1BVRF1BDLF1BGLF3.5BGRF1/BDRF1BDLF2BdRF1BOLF1LF1BGLF1BBLF4BXLF2BDLF4BFRF2BKRF3BSRF1BVLF1BFLF2BMRF2BORF2BZLF1BSLF2/BMLF1BMRF1BALF2BGLF4BKRF4BGLF5BGLF2BTRF1BKRF2BLLF3BLRF1BFRF3BLRF2BNLF2aBLLF2BBLF1BCRF1BBRF2BDLF3BILF2BALF1BZLF2LF3BHLF1BPLF1A73RPMS1BALF3BARF0EBNA−1BALF4BALF5LF2
Treatment OutcomeEBV Type
EBV Type
Type−I
Type−2
Treatment Outcome
Received_Survived
Received_Died
Not−Received_Died
NA
Figure 1
−4
−2
0
2
4
6
8
10
Expression
on July 8, 2018. © 2017 American Association for Cancer Research. mcr.aacrjournals.org Downloaded from
Author manuscripts have been peer reviewed and accepted for publication but have not yet been edited. Author Manuscript Published OnlineFirst on January 30, 2017; DOI: 10.1158/1541-7786.MCR-16-0305
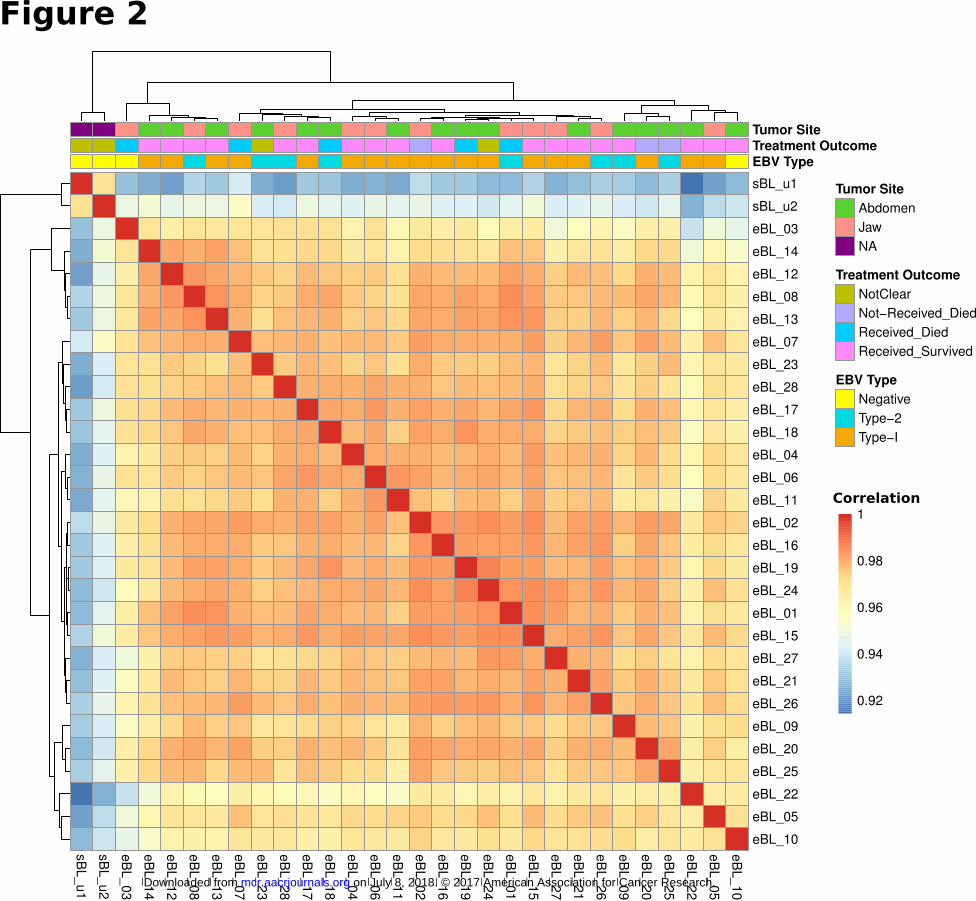
sB
L_u1
sB
L_u2
eB
L_03
eB
L_14
eB
L_12
eB
L_08
eB
L_13
eB
L_07
eB
L_23
eB
L_28
eB
L_17
eB
L_18
eB
L_04
eB
L_06
eB
L_11
eB
L_02
eB
L_16
eB
L_19
eB
L_24
eB
L_01
eB
L_15
eB
L_27
eB
L_21
eB
L_26
eB
L_09
eB
L_20
eB
L_25
eB
L_22
eB
L_05
eB
L_10
sBL_u1
sBL_u2
eBL_03
eBL_14
eBL_12
eBL_08
eBL_13
eBL_07
eBL_23
eBL_28
eBL_17
eBL_18
eBL_04
eBL_06
eBL_11
eBL_02
eBL_16
eBL_19
eBL_24
eBL_01
eBL_15
eBL_27
eBL_21
eBL_26
eBL_09
eBL_20
eBL_25
eBL_22
eBL_05
eBL_10
EBV Type
Treatment OutcomeTumor Site
Tumor Site
Abdomen
Jaw
NA
Treatment Outcome
NotClear
Not−Received_Died
Received_Died
Received_Survived
EBV Type
Negative
Type−2
Type−I
0.92
0.94
0.96
0.98
1Correlation
Figure 2
on July 8, 2018. © 2017 American Association for Cancer Research. mcr.aacrjournals.org Downloaded from
Author manuscripts have been peer reviewed and accepted for publication but have not yet been edited. Author Manuscript Published OnlineFirst on January 30, 2017; DOI: 10.1158/1541-7786.MCR-16-0305
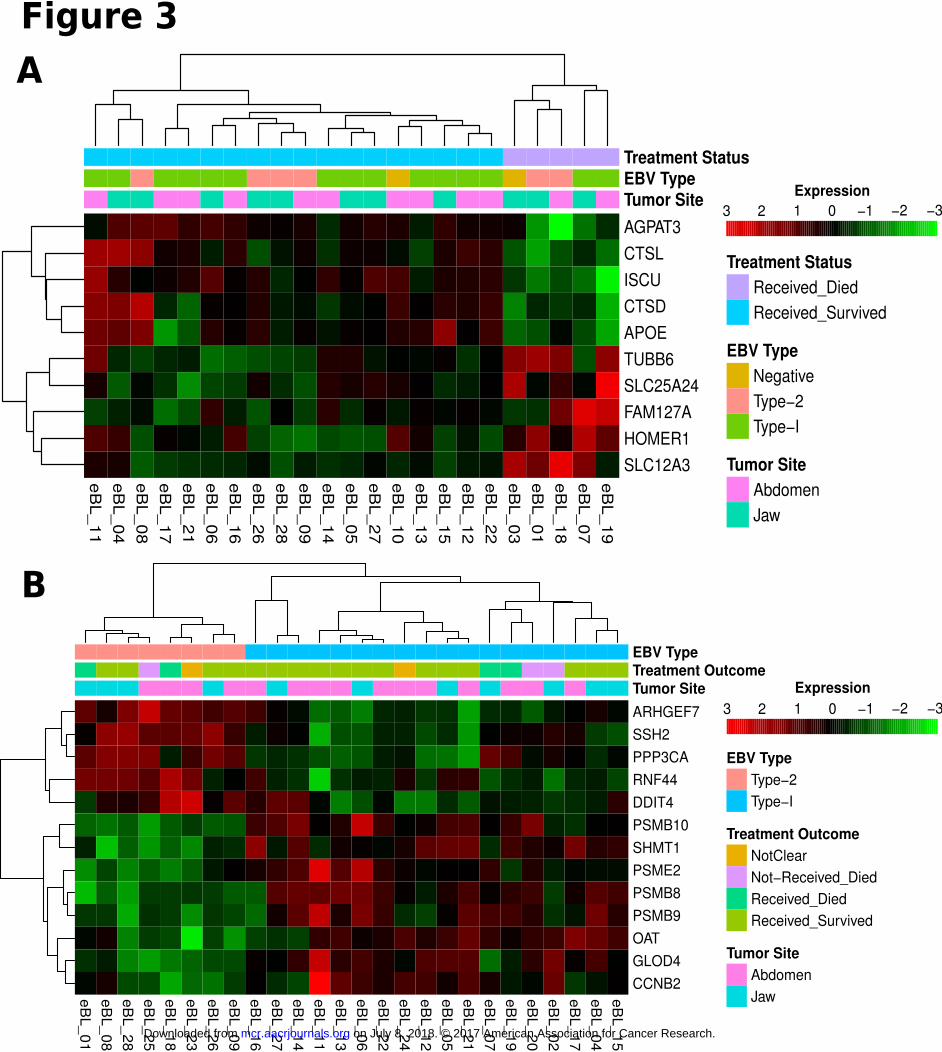
eB
L_11
eB
L_04
eB
L_08
eB
L_17
eB
L_21
eB
L_06
eB
L_16
eB
L_26
eB
L_28
eB
L_09
eB
L_14
eB
L_05
eB
L_27
eB
L_10
eB
L_13
eB
L_15
eB
L_12
eB
L_22
eB
L_03
eB
L_01
eB
L_18
eB
L_07
eB
L_19
AGPAT3
CTSL
ISCU
CTSD
APOE
TUBB6
SLC25A24
FAM127A
HOMER1
SLC12A3
Tumor SiteEBV TypeTreatment Status
Treatment Status
Received_Died
Received_Survived
EBV Type
Negative
Type−2
Type−I
Tumor Site
Abdomen
Jaw
eB
L_
01
eB
L_
08
eB
L_
28
eB
L_
25
eB
L_
18
eB
L_
23
eB
L_
26
eB
L_
09
eB
L_
16
eB
L_
27
eB
L_
14
eB
L_
11
eB
L_
13
eB
L_
06
eB
L_
22
eB
L_
24
eB
L_
12
eB
L_
05
eB
L_
21
eB
L_
07
eB
L_
19
eB
L_
20
eB
L_
02
eB
L_
17
eB
L_
04
eB
L_
15
ARHGEF7
SSH2
PPP3CA
RNF44
DDIT4
PSMB10
SHMT1
PSME2
PSMB8
PSMB9
OAT
GLOD4
CCNB2
Tumor Site
Treatment Outcome
EBV Type
EBV Type
Type−2
Type−I
Treatment Outcome
NotClear
Not−Received_Died
Received_Died
Received_Survived
Tumor Site
Abdomen
Jaw
−3−2−10123
Expression
−3−2−10123
Expression
A
B
Figure 3
on July 8, 2018. © 2017 American Association for Cancer Research. mcr.aacrjournals.org Downloaded from
Author manuscripts have been peer reviewed and accepted for publication but have not yet been edited. Author Manuscript Published OnlineFirst on January 30, 2017; DOI: 10.1158/1541-7786.MCR-16-0305
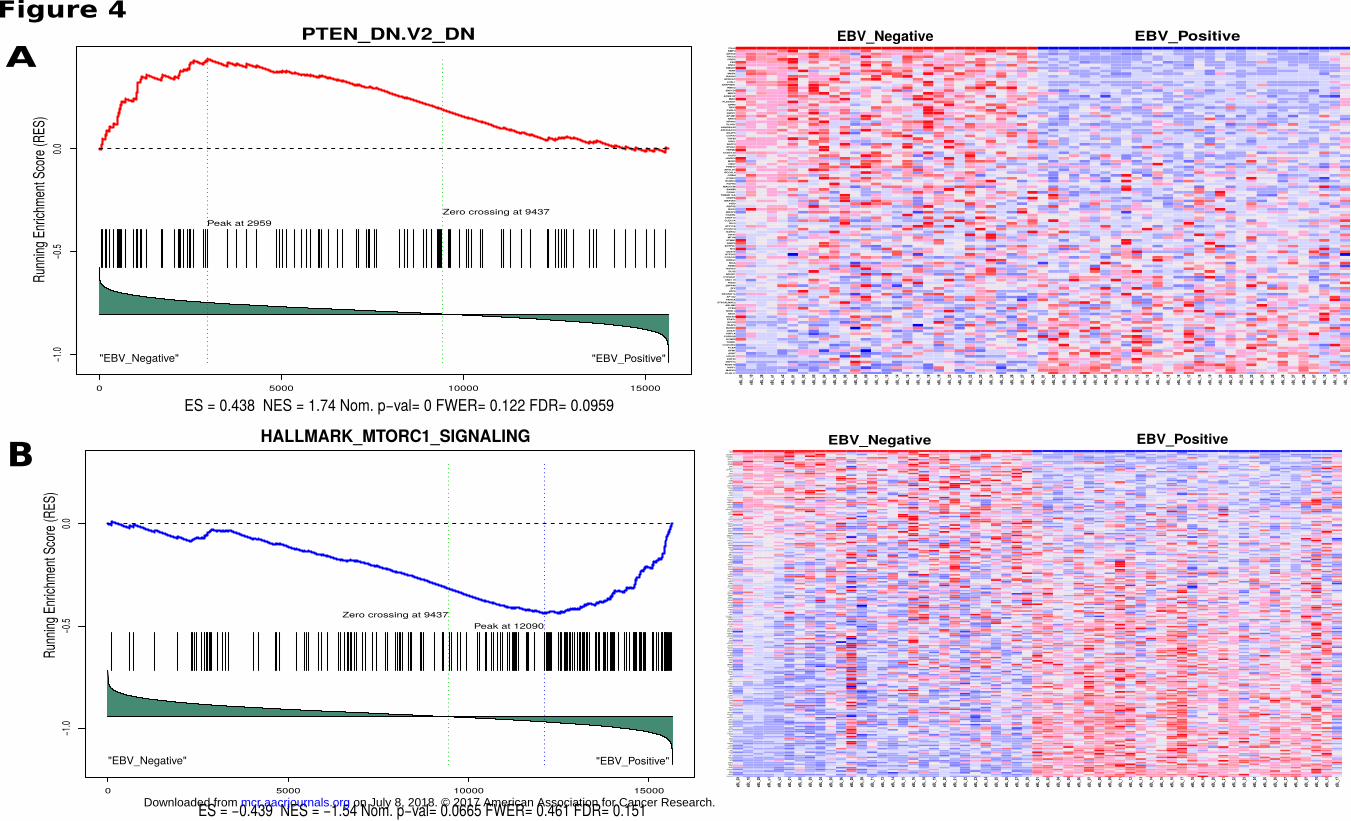
0 5000 10000 15000
−1.
0−
0.5
0.0
PTEN_DN.V2_DN
ES = 0.438 NES = 1.74 Nom. p−val= 0 FWER= 0.122 FDR= 0.0959
Run
ning
Enr
ichm
ent S
core
(RE
S)
"EBV_Negative" "EBV_Positive"
Peak at 2959
Zero crossing at 9437
KLHL11
MAPK3
WIPF1
NUDT18
ZNF574
KRT23
HCLS1
ASB7
GFM1
FCAR
CCDC88C
TUBB1
KCNE2
CORO2B
HNF1A
DDX31
BARD1
TRAF2
BCOR
FRAT1
ADCK3
NEO1
NIPAL3
PTEN
ABLIM2
ST6GALNAC2
FANCA
AP1G2
RPGRIP1L
ATF5
ZFY
ZNF446
RGS2
UNC119
CYP20A1
NDOR1
DLX2
HOXC5
RBM4
MGA
DHRS2
CCDC53
GTF3C5
DDX3Y
NVL
ENTPD7
FABP6
STMN1
MT1M
KRT7
BARX2
PCSK1N
ATP11B
RIC3
CLEC7A
CHST12
OGDHL
MEGF8
NOS3
REPS2
PIDD
MAP3K5
CEBPA
TMEM176A
FOXH1
BAMBI
MAGOHB
FGFR3
IZUMO4
DYRK4
CRBN
RECQL4
APOLD1
PRMT7
CBX7
MXD3
HIVEP3
UCP3
CCDC132
TRPM4
SPHK1
BATF3
SGK1
TGFBI
COPZ2
AKAP5
ARHGAP33
ARHGEF40
PLAG1
NR4A2
NRTN
AP4M1
SEPP1
PVRL3
TBX3
GPR3
PLEKHO1
MID1
APBB1IP
MRC2
ZNF124
RIBC2
SERPINH1
LOXL1
GPRC5C
RASA3
MAFK
TERT
SMAD7
ENC1
FES
CRIP2
TACC2
AHSA2
BMP4
Class
eBL_
03
eBL_
10
eBL_
29
sBL_
u1
sBL_
u2
sBL_
01
sBL_
02
sBL_
03
sBL_
04
sBL_
05
sBL_
06
sBL_
08
sBL_
09
sBL_
11
sBL_
13
sBL_
14
sBL_
15
sBL_
16
sBL_
18
sBL_
19
sBL_
20
sBL_
21
sBL_
22
sBL_
23
sBL_
24
sBL_
25
sBL_
26
sBL_
27
sBL_
28
eBL_
01
eBL_
02
eBL_
04
eBL_
05
eBL_
06
eBL_
07
eBL_
08
eBL_
09
eBL_
11
eBL_
12
eBL_
13
eBL_
14
eBL_
15
eBL_
16
eBL_
17
eBL_
18
eBL_
19
eBL_
20
eBL_
21
eBL_
22
eBL_
23
eBL_
24
eBL_
25
eBL_
26
eBL_
27
eBL_
28
sBL_
07
sBL_
10
sBL_
12
sBL_
17
EBV_Negative EBV_Positive
0 5000 10000 15000
−1.
0−
0.5
0.0
HALLMARK_MTORC1_SIGNALING
ES = −0.439 NES = −1.54 Nom. p−val= 0.0665 FWER= 0.461 FDR= 0.151
Run
ning
Enr
ichm
ent S
core
(RE
S)
"EBV_Negative" "EBV_Positive"
Peak at 12090
Zero crossing at 9437
FAM129A
GAPDH
PSPH
RPA1
MTHFD2
MCM2
BUB1
SHMT2
CCNG1
LDLR
FDXR
ACACA
GOT1
CTH
MCM4
AK4
SLC1A4
PSAT1
IFI30
TUBA4A
TPI1
TRIB3
PDK1
GPI
M6PR
CORO1A
NFYC
ALDOA
RRM2
LDHA
HSPA4
TUBG1
HSPA9
STIP1
CDC25A
TBK1
POLR3G
ATP2A2
PPA1
RRP9
DDIT3
PNP
EPRS
ENO1
CCNF
ACLY
GTF2H1
LTA4H
PSME3
PNO1
ELOVL5
PFKL
CYB5B
GGA2
IMMT
TXNRD1
HPRT1
PPIA
HK2
G6PD
ACTR3
ATP5G1
PGK1
DHFR
SLC1A5
TMEM97
GBE1
RPN1
WARS
ABCF2
DHCR24
EBP
SLC6A6
DHCR7
BCAT1
DDX39A
ACTR2
SLC37A4
GSK3B
CANX
ADD3
ADIPOR2
HSPD1
PSMD14
SLC7A5
CDKN1A
AURKA
ETF1
CACYBP
CCT6A
NAMPT
CXCR4
TOMM40
SLC9A3R1
XBP1
P4HA1
SCD
PSMA4
PITPNB
EIF2S2
CTSC
NUP205
NUPR1
HMGCR
PSMG1
PSMA3
SQSTM1
NUFIP1
PLK1
UNG
UBE2D3
SKAP2
SORD
PSMC4
FGL2
SEC11A
DAPP1
NFKBIB
ME1
SSR1
COPS5
UCHL5
HSPE1
EEF1E1
PSMB5
GSR
SERP1
USO1
PDAP1
NMT1
CALR
CD9
SQLE
FADS1
HSPA5
PIK3R3
DDIT4
SRD5A1
YKT6
PSMD12
HMGCS1
EDEM1
FADS2
ERO1L
RAB1A
ACSL3
PSMC2
CYP51A1
GLA
INSIG1
PGM1
IDI1
SYTL2
PRDX1
TES
PPP1R15A
STARD4
RDH11
ARPC5L
PSMD13
PSMC6
ATP6V1D
SLC2A3
VLDLR
IDH1
NFIL3
PLOD2
ITGB2
SDF2L1
ELOVL6
FKBP2
GLRX
LGMN
CFP
HSP90B1
IFRD1
STC1
SLA
MTHFD2L
QDPR
UFM1
IGFBP5
EGLN3
PHGDH
MLLT11
TM7SF2
SERPINH1
BHLHE40
RIT1
Class
eBL_
03
eBL_
10
eBL_
29
sBL_
u1
sBL_
u2
sBL_
01
sBL_
02
sBL_
03
sBL_
04
sBL_
05
sBL_
06
sBL_
08
sBL_
09
sBL_
11
sBL_
13
sBL_
14
sBL_
15
sBL_
16
sBL_
18
sBL_
19
sBL_
20
sBL_
21
sBL_
22
sBL_
23
sBL_
24
sBL_
25
sBL_
26
sBL_
27
sBL_
28
eBL_
01
eBL_
02
eBL_
04
eBL_
05
eBL_
06
eBL_
07
eBL_
08
eBL_
09
eBL_
11
eBL_
12
eBL_
13
eBL_
14
eBL_
15
eBL_
16
eBL_
17
eBL_
18
eBL_
19
eBL_
20
eBL_
21
eBL_
22
eBL_
23
eBL_
24
eBL_
25
eBL_
26
eBL_
27
eBL_
28
sBL_
07
sBL_
10
sBL_
12
sBL_
17
EBV_Negative EBV_Positive
A
B
Figure 4
on July 8, 2018. © 2017 American Association for Cancer Research. mcr.aacrjournals.org Downloaded from
Author manuscripts have been peer reviewed and accepted for publication but have not yet been edited. Author Manuscript Published OnlineFirst on January 30, 2017; DOI: 10.1158/1541-7786.MCR-16-0305
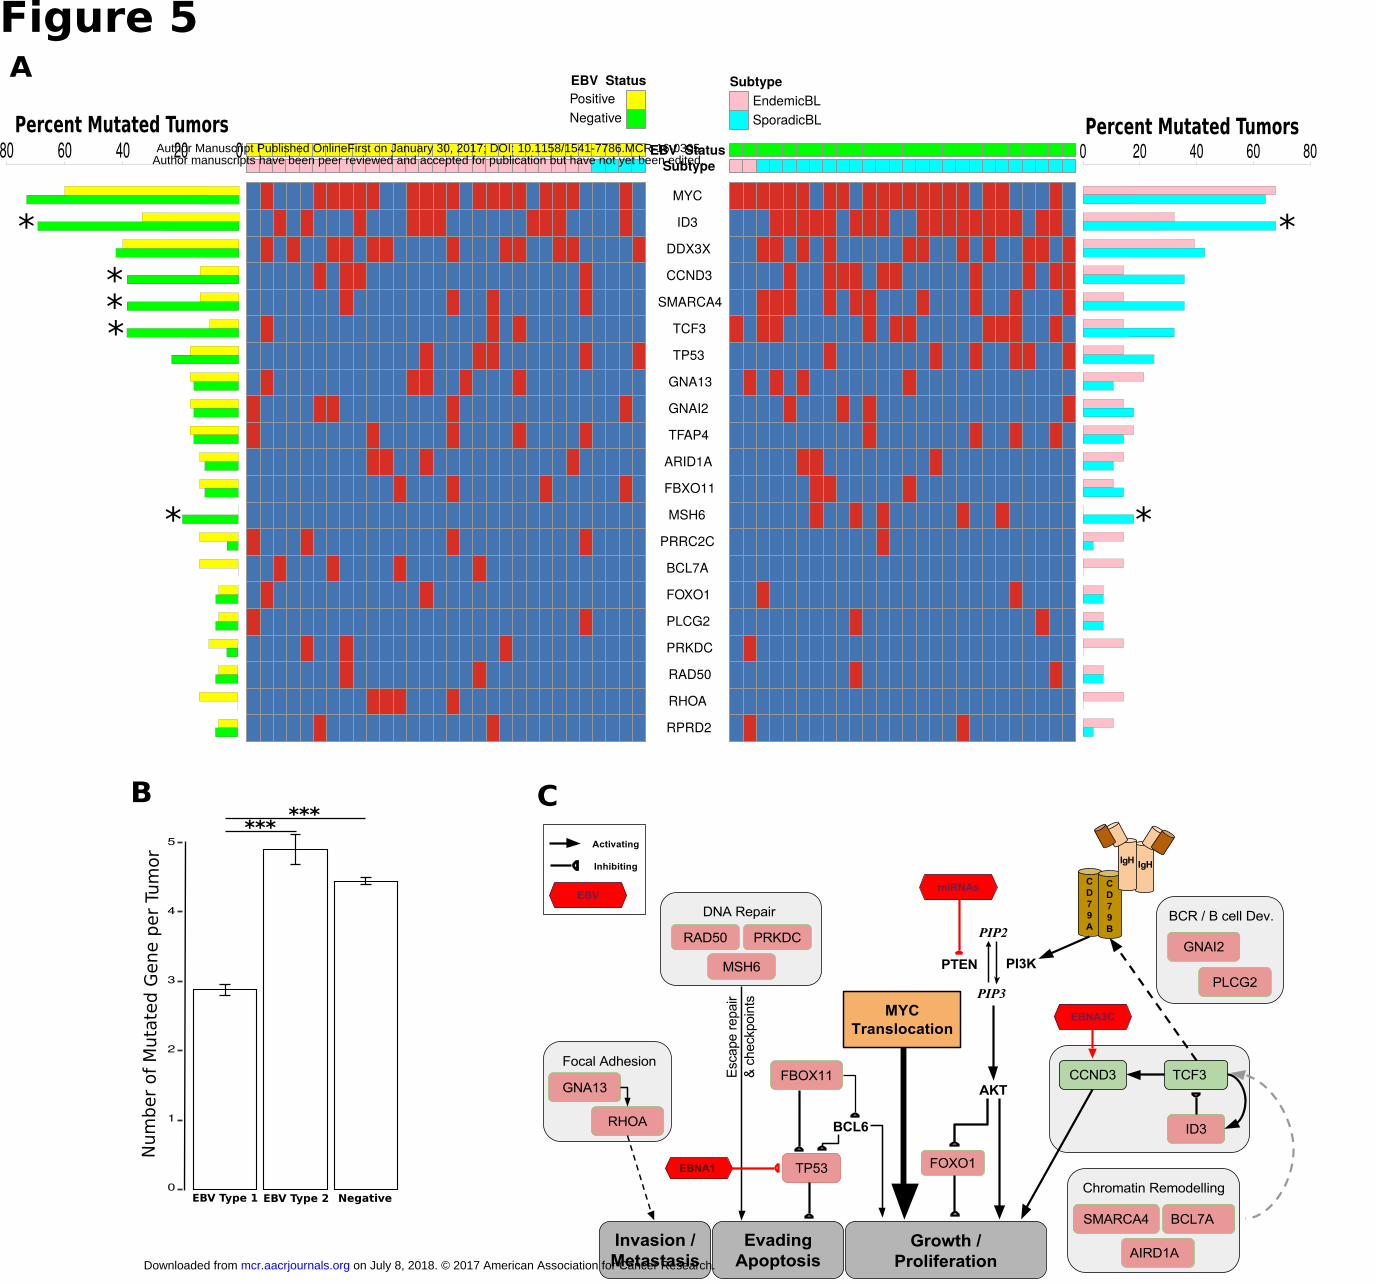
MYC
ID3
DDX3X
CCND3
SMARCA4
TCF3
TP53
GNA13
GNAI2
TFAP4
ARID1A
FBXO11
MSH6
PRRC2C
BCL7A
FOXO1
PLCG2
PRKDC
RAD50
RHOA
RPRD2
SubtypeEBV Status
EBV Status
Positive
Negative
Subtype
EndemicBL
SporadicBL Percent Mutated Tumors0 20 40 60 8080 60 40 20 0
Percent Mutated Tumors
*
***
*
*
*
Figure 5
f
0
1
2
3
4
5
Num
ber
of
Muta
ted G
ene p
er
Tum
or
B***
***
A
C
EBV Type 1 EBV Type 2 Negative
on July 8, 2018. © 2017 American Association for Cancer Research. mcr.aacrjournals.org Downloaded from
Author manuscripts have been peer reviewed and accepted for publication but have not yet been edited. Author Manuscript Published OnlineFirst on January 30, 2017; DOI: 10.1158/1541-7786.MCR-16-0305
Published OnlineFirst January 30, 2017.Mol Cancer Res Yasin Kaymaz, Cliff I. Oduor, Hongbo Yu, et al. Burkitt Lymphoma Reveals EBV Type-specific DifferencesComprehensive Transcriptome and Mutational Profiling of Endemic
Updated version
10.1158/1541-7786.MCR-16-0305doi:
Access the most recent version of this article at:
Material
Supplementary
http://mcr.aacrjournals.org/content/suppl/2017/07/12/1541-7786.MCR-16-0305.DC2
http://mcr.aacrjournals.org/content/suppl/2017/06/21/1541-7786.MCR-16-0305.DC1Access the most recent supplemental material at:
Manuscript
Author Author manuscripts have been peer reviewed and accepted for publication but have not yet been edited.
E-mail alerts related to this article or journal.Sign up to receive free email-alerts
Subscriptions
Reprints and
To order reprints of this article or to subscribe to the journal, contact the AACR Publications Department at
Permissions
Rightslink site. Click on "Request Permissions" which will take you to the Copyright Clearance Center's (CCC)
.http://mcr.aacrjournals.org/content/early/2017/01/28/1541-7786.MCR-16-0305To request permission to re-use all or part of this article, use this link
on July 8, 2018. © 2017 American Association for Cancer Research. mcr.aacrjournals.org Downloaded from
Author manuscripts have been peer reviewed and accepted for publication but have not yet been edited. Author Manuscript Published OnlineFirst on January 30, 2017; DOI: 10.1158/1541-7786.MCR-16-0305
Recommended