
May 2018
Complaint snapshot: Debt collection

1 COMPLAINT SNAPSHOT: DEBT COLLECTION BUREAU OF CONSUMER FINANCIAL PROTECTION
Table of contents Table of contents ....................................................................................................... 1
1. Complaint volume .............................................................................................. 2
1.1 By product ................................................................................................. 3
1.2 By state ...................................................................................................... 8
2. Product spotlight: Debt collection ................................................................ 11
2.1 Complaints by type ................................................................................. 12
2.2 Complaints by state ..................................................................................15
Appendix A ............................................................................................................... 18

2 COMPLAINT SNAPSHOT: DEBT COLLECTION BUREAU OF CONSUMER FINANCIAL PROTECTION
1. Complaint volume One of the primary functions of the Bureau of Consumer Financial Protection (“Bureau”) is
collecting, investigating, and responding to consumer complaints.1 Created as a result of the
Dodd-Frank Wall Street Reform and Consumer Protection Act (“Dodd-Frank Act”), the Office of
Consumer Response (“Consumer Response”)2 hears directly from consumers3 about the
challenges they face in the marketplace, answers their inquiries about consumer financial
products and services, brings their concerns to the attention of companies, and assists in
addressing their complaints.4
This Complaint Snapshot provides a high-level overview of trends in consumer complaints and
supplements the Consumer Response Annual Report with more recent information about
monthly changes in complaint volume.5 This Complaint Snapshot uses a three-month rolling
average, comparing the current average to the same period in the prior year where appropriate,
to account for monthly and seasonal fluctuations. In some cases, this Complaint Snapshot uses
month-to-month comparisons to highlight more immediate trends.
1 See Dodd-Frank Wall Street Reform and Consumer Protection Act of 2010, Pub. L. No. 111-203 (“Dodd-Frank Act”) Section 1021(c)(2).
2 Id. § 1013(b)(3)(A).
3 Id. § 1002(4) (“The term ‘consumer’ means an individual or an agent, trustee, or representative acting on behalf of an individual.”). To protect consumer privacy, companies generally confirm with the consumer that any complaint submitted on their behalf by a third party was authorized. Companies alert the Bureau if they determine that a complaint was submitted by an unauthorized third party. Such complaints are not published in the Consumer Complaint Database.
4 Consumer complaints are submissions that express dissatisfaction with, or communicate suspicion of wrongful conduct by, an identifiable entity related to a consumer’s personal experience with a financial product or service.
5 Section 1013(b)(3)(C) of the Dodd-Frank Act requires an annual report on the complaints received by the Bureau regarding consumer financial products and services. See Bureau of Consumer Financial Protection, Consumer Response Annual Report (Mar. 2018), available at http://www.consumerfinance.gov/documents/6406/cfpb_consumer-response-annual-report_2017.pdf.

3 COMPLAINT SNAPSHOT: DEBT COLLECTION BUREAU OF CONSUMER FINANCIAL PROTECTION
In March 2018, the Bureau published a Request for Information (RFI) about the Bureau’s public
reporting of consumer complaints.6 In April 2018, the Bureau published a RFI about the
Bureau’s consumer complaint and consumer inquiry handling processes.7 For both RFIs, the
Bureau encourages comments from all interested members of the public.
Visit consumerfinance.gov/complaint to learn about how we handle complaints. Visit our
Consumer Complaint Database at consumerfinance.gov/complaintdatabase to search, sort,
filter, and export complaints.
1.1 By product As of April 1, 2018, the Bureau had received approximately 1,492,600 complaints, including
approximately 30,300 complaints in March 2018. Table 1 shows the percentage change in
complaint volume by product, comparing January 2017 - March 2017 with January 2018 -
March 2018.8
6 Request for Information Regarding Bureau Public Reporting Practices of Consumer Complaint Information, 83 FR 9499 (Mar. 6, 2018), available at https://www.consumerfinance.gov/about-us/newsroom/cfpb-issues-request-information-consumer-complaint-reporting/.
7 Request for Information Regarding the Bureau’s Consumer Complaint and Inquiry Handling Processes, 83 FR 16839 (April 17, 2018), available at https://www.consumerfinance.gov/about-us/newsroom/cfpb-issues-request-information-consumer-complaint-inquiry/.
8 Complaint totals reflect complaints received by the Bureau with product breakdowns focusing on the most-complained-about consumer financial products and services.
4 COMPLAINT SNAPSHOT: DEBT COLLECTION BUREAU OF CONSUMER FINANCIAL PROTECTION
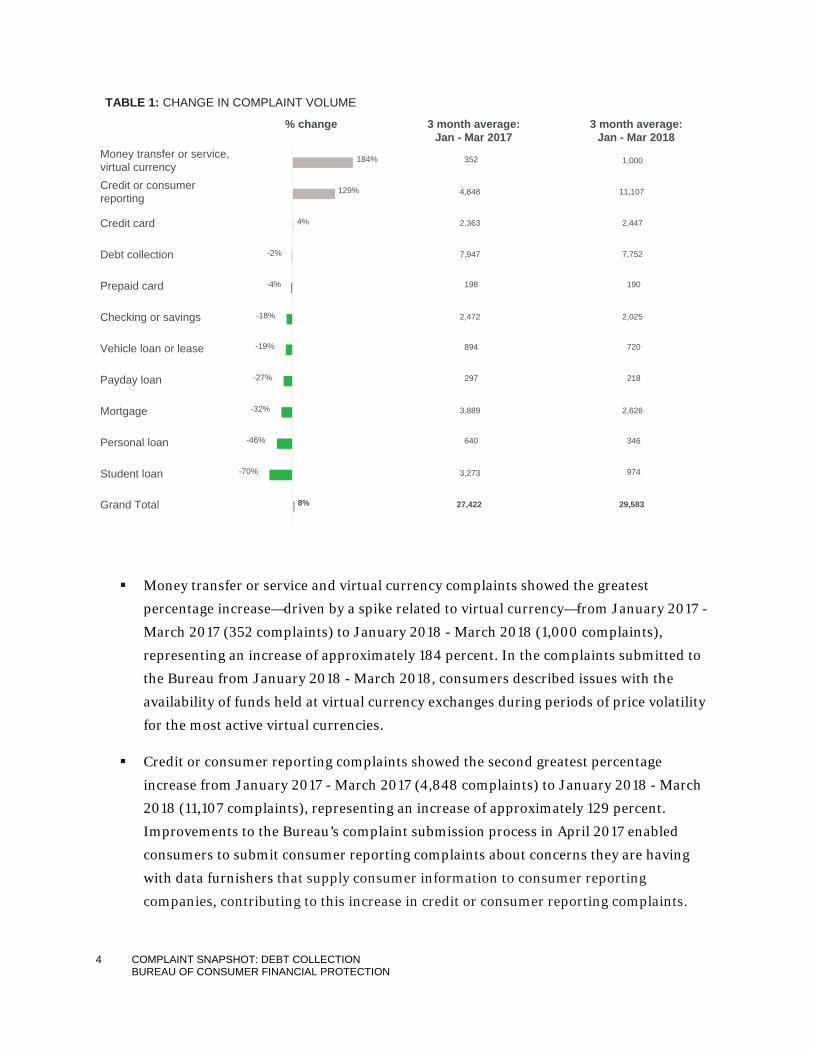
TABLE 1: CHANGE IN COMPLAINT VOLUME
Money transfer or service and virtual currency complaints showed the greatest
percentage increase—driven by a spike related to virtual currency—from January 2017 -
March 2017 (352 complaints) to January 2018 - March 2018 (1,000 complaints),
representing an increase of approximately 184 percent. In the complaints submitted to
the Bureau from January 2018 - March 2018, consumers described issues with the
availability of funds held at virtual currency exchanges during periods of price volatility
for the most active virtual currencies.
Credit or consumer reporting complaints showed the second greatest percentage
increase from January 2017 - March 2017 (4,848 complaints) to January 2018 - March
2018 (11,107 complaints), representing an increase of approximately 129 percent.
Improvements to the Bureau’s complaint submission process in April 2017 enabled
consumers to submit consumer reporting complaints about concerns they are having
with data furnishers that supply consumer information to consumer reporting
companies, contributing to this increase in credit or consumer reporting complaints.
% change 3 month average:Jan - Mar 2017
3 month average:Jan - Mar 2018
Money transfer or service,virtual currencyCredit or consumerreporting
Credit card
Debt collection
Prepaid card
Checking or savings
Vehicle loan or lease
Payday loan
Mortgage
Personal loan
Student loan
Grand Total
184%
129%
-18%
-19%
-27%
-32%
-46%
-70%
-2%
-4%
4%
8% Ab
Ab
Ab
Ab
Ab
Ab
Ab
Ab
Ab
Ab
Ab
Ab
27,422
3,273
640
3,889
297
894
2,472
198
7,947
2,363
4,848
352
Abc
Abc
Abc
Abc
Abc
Abc
Abc
Abc
Abc
Abc
Abc
Abc
29,583
974
346
2,626
218
720
2,025
190
7,752
2,447
11,107
1,000
5 COMPLAINT SNAPSHOT: DEBT COLLECTION BUREAU OF CONSUMER FINANCIAL PROTECTION
Student loan complaints showed the greatest percentage decrease from January 2017 -
March 2017 (monthly average of 3,273 complaints) to January 2018 - March 2018
(monthly average of 974 complaints), representing a decline of approximately 70
percent. This year-over-year decline is likely because student loan complaint volume was
elevated in 2017 following the Bureau’s enforcement action against a student loan
servicer.9
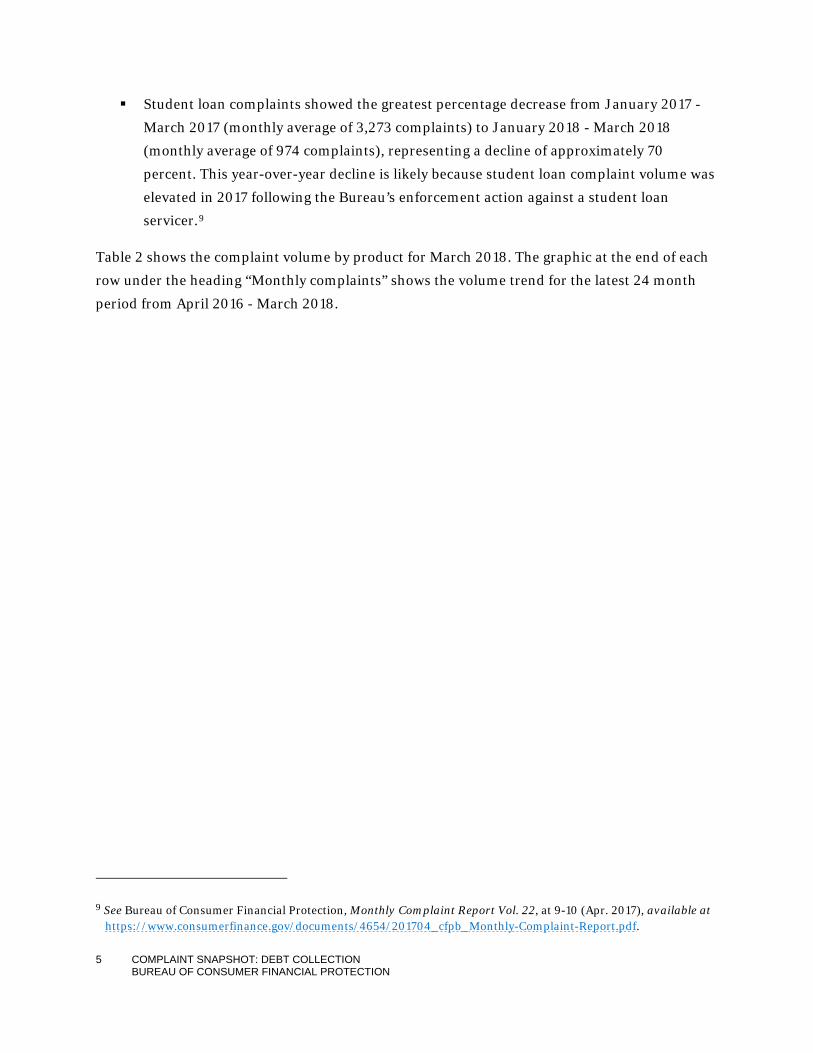
Table 2 shows the complaint volume by product for March 2018. The graphic at the end of each
row under the heading “Monthly complaints” shows the volume trend for the latest 24 month
period from April 2016 - March 2018.
9 See Bureau of Consumer Financial Protection, Monthly Complaint Report Vol. 22, at 9-10 (Apr. 2017), available at https://www.consumerfinance.gov/documents/4654/201704_cfpb_Monthly-Complaint-Report.pdf.

6 COMPLAINT SNAPSHOT: DEBT COLLECTION BUREAU OF CONSUMER FINANCIAL PROTECTION
TABLE 2: MONTHLY PRODUCT AND SERVICE TRENDS10
Credit or consumer reporting complaints represented approximately 37 percent of
complaints submitted in March 2018.
Debt collection complaints represented approximately 27 percent of complaints
submitted in March 2018.
10 Gray bars show +/- 1 standard deviation for monthly complaints from April 2016 - March 2018. Total complaints column includes approximately 8,900 complaints where no specific consumer financial product or service was selected by consumers, 1,600 credit repair complaints, and 1,500 title loan complaints.
analyticalproductComplaintsthis month
% change vslast month
Rolling 24monthaverage Total complaints .
Credit or consumerreporting 11,347 3% 7,291 314,068
Debt collection 8,265 14% 7,236 400,465
Mortgage 2,804 11% 3,444 309,476
Credit card 2,505 8% 2,272 145,593
Checking or savings 2,022 3% 2,211 138,240
Student loan 988 11% 1,367 57,348
Vehicle loan or lease 708 7% 742 38,695
Money transfer or service,virtual currency 696 -14% 521 21,569
Personal loan 307 -19% 478 25,956
Payday loan 212 3% 280 20,152
Prepaid card 212 21% 190 9,003
2017 2018
Total 30,263 7% 26,256 1,492,595
Monthlycomplaints
7 COMPLAINT SNAPSHOT: DEBT COLLECTION BUREAU OF CONSUMER FINANCIAL PROTECTION
Prepaid card complaints showed the greatest month-over-month percentage increase (21
percent).
Personal loan complaints showed the greatest month-over-month percentage decrease (-
19 percent).
Credit or consumer reporting, debt collection, and mortgage were the top three most-
complained-about consumer financial products and services, collectively representing
approximately 74 percent of complaints submitted in March 2018.
8 COMPLAINT SNAPSHOT: DEBT COLLECTION BUREAU OF CONSUMER FINANCIAL PROTECTION
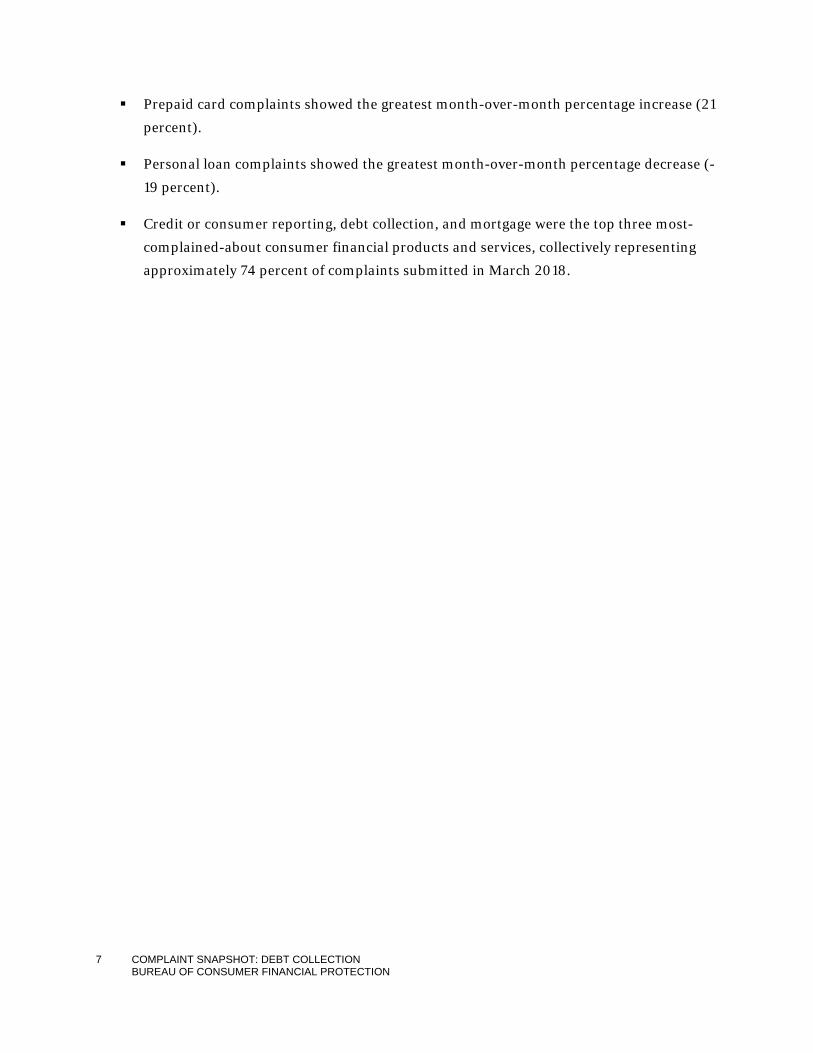
1.2 By state TABLE 3: COMPLAINT VOLUME BY STATE THROUGH MARCH 31, 2018
Complaints per 100K population Total complaints
DCDEMDFLGANVNJVACANYAZCTCONHTXILSCNCRIPAWAOROHMALATNMINMALVTMEMOHIIDMNMSWIUTKSOKINKYNEAKWYMTSDARWVIAND
1,199758
716
674669
616
600525
507470464
452436435
435425
424420416
400397
388385380
376375
364355354
353344
343339
296
291286
286285276
272266265
256255
253249246
239222
213208
8,319
7,292
43,361
141,448
69,790
18,467
54,023
44,443
200,295
93,199
32,555
16,231
24,454
5,844
122,994
54,408
21,297
43,173
4,403
51,270
29,376
16,078
44,842
26,085
17,616
25,160
36,271
7,411
17,267
2,199
4,595
20,971
4,843
5,077
16,241
8,530
16,565
8,826
8,048
10,707
17,753
11,796
4,914
1,883
1,468
2,613
2,141
7,189
4,032
6,707
1,569

9 COMPLAINT SNAPSHOT: DEBT COLLECTION BUREAU OF CONSUMER FINANCIAL PROTECTION
TABLE 4: CHANGE IN COMPLAINT VOLUME BY STATE
% change 3 month average:Jan 2017 - Mar 2017
3 month average:Jan 2018 - Mar 2018
MSAKLAUTARALFLILNCTXNJNYGAMOCASCNVTNAZOHDCMIPAIAKYVAWIHIIDCODEKSNHMDVTINCTOKWVMTMAMNWAWYRINMNEORMENDSD Abc
Abc
Abc
Abc
Abc
Abc
Abc
Abc
Abc
Abc
Abc
Abc
Abc
Abc
Abc
Abc
Abc
Abc
Abc
Abc
Abc
Abc
Abc
Abc
Abc
Abc
Abc
Abc
Abc
Abc
Abc
Abc
Abc
Abc
Abc
Abc
Abc
Abc
Abc
Abc
Abc
Abc
Abc
Abc
Abc
Abc
Abc
Abc
Abc
Abc
Abc
-0.5%
-16%-16%-18%
-19%
-21%-21%
-18%
-21%
-22%-23%
-24%-25%-26%
-26%-26%
-28%
-30%
-31%
-14%
-35%
-41%-47%
-53%
-12%
-29%
-14%-15%
0.1%0.2%
0.0%
29%18%
13%13%
12%
10%11%
30%
-4%-5%-6%
-8%
-8%-8%-9%
-9%
-8%
6%4%
1%
5036
88
312
95
12183
29599
323
495
55
74216333
372
38
783
95
145138
47685
77299
782
211
112992
667
148847
627
501
339
4493,525
4291,482
1,643
9622,430
8251,044
2,414
338
134
151
328
32
170
23
19
52204
66
85
59
21
441238
366
41
56167
259
293
30
618
78119
114397
7165
257
675
186
102
903
612
136
778577469
321
4293,508
4291,483
1,647
9752,526
8741,145
2,675
378
151
171387
42
221

10 COMPLAINT SNAPSHOT: DEBT COLLECTION BUREAU OF CONSUMER FINANCIAL PROTECTION
States with the greatest complaint volume percentage increase from January 2017 -
March 2017 to January 2018 - March 2018 were Mississippi (30 percent), Alaska (29
percent), and Louisiana (18 percent).
States with the greatest complaint volume percentage decrease from January 2017 -
March 2017 to January 2018 - March 2018 were South Dakota (-53 percent), North
Dakota (-47 percent), and Maine (-41 percent).
Of the five most populated states, Florida (11 percent) had the greatest complaint volume
percentage increase and Pennsylvania (-9 percent) had the greatest complaint volume
percentage decrease from January 2017 - March 2017 to January 2018 - March 2018. 11
11 Complaints per 100k population are defined as cumulative complaints divided by Census estimated 2017
population. Census population data available at https://www.census.gov/data/datasets/2017/demo/popest/state-
total.html.

11 COMPLAINT SNAPSHOT: DEBT COLLECTION BUREAU OF CONSUMER FINANCIAL PROTECTION
2. Product spotlight: Debt collection The Bureau received approximately 400,500 debt collection complaints since July 21, 2011,
representing 27 percent of total complaints. Debt collection has consistently been among the
most-complained-about consumer financial products and services.
From July 21, 2011, through March 31, 2018, the Bureau sent approximately 196,800 (or 49
percent) of all debt collection complaints to companies for review and response. The remaining
complaints were referred to other regulatory agencies, incomplete, or are pending with the
Bureau or the consumer.
The Bureau referred approximately 40 percent of the debt collection complaints it received to
other regulators. The Bureau typically refers debt collection complaints to other regulators when
consumers submit complaints about first-party debt collectors where the source of the debt was
not a financial product or service (e.g., complaints about medical providers, telecommunications
companies, utilities) or when the company about which the consumer complained does not
appear to be a third-party collector of a financial product or service-related debt.
The Bureau found approximately 10 percent of the debt collection complaints it received to be
incomplete. When consumers submit complaints without enough information to send the
complaint to a company for response or to refer the complaint to another regulator, the Bureau
prompts consumers to provide additional information. If consumers do not provide the
information needed within the time provided, the Bureau deems those complaints to be
incomplete.12
12 Unlike other products where consumers proactively seek out the product or service, debt collectors are engaged by
creditors. Many creditors engage third parties to collect debts on their behalf or sell uncollected debts to third-party debt buyers, which then collect the debts internally or through a third party. In 2016, approximately 8,500 debt collection businesses were in operation. See Bureau of Consumer Financial Protection, The Consumer Credit Card

12 COMPLAINT SNAPSHOT: DEBT COLLECTION BUREAU OF CONSUMER FINANCIAL PROTECTION
As of April 1, 2018, complaints not sent to companies for response, referred to another
regulator, or found to be incomplete were either pending with the Bureau (0.3 percent) or the
consumer (0.2 percent).
Complaints received by the Bureau help its work to regulate consumer financial products or
services under existing federal consumer financial laws, enforce those laws judiciously, and
educate and empower consumers to make better informed financial decisions.
2.1 Complaints by type The Bureau continually strives to collect reliable complaint data while ensuring the system’s
ease-of-use and effectiveness for consumers and companies. When consumers submit
complaints, the Bureau’s complaint form prompts them to select the consumer financial product
or service with which they have a problem as well as the type of problem they are having with
that product or service. For debt collection complaints, the Bureau also prompts the consumer
to select the type of debt underlying their complaint. The Bureau uses these consumer selections
to group the financial products and services and concerns about which consumers complain to
the Bureau for public reports like this Complaint Snapshot.
Debt collection complaints submitted by consumers can be more meaningful when considered
in context with other data, such as the number of consumers who have an account in collection.
According to the Bureau’s most recent annual Fair Debt Collection Practices Act Report, the
debt collection industry “affects millions of Americans” and, according to the Bureau’s
Consumer Credit Panel, about 26 percent of consumers with a credit file have a third-party
collection tradeline listed.13 Third-party debt collectors collect debts that originated from a
variety of industries, including financial services, healthcare, retail, and telecommunications.
Market, at 303-304 (Dec. 2017), available at https://www.consumerfinance.gov/documents/5950/cfpb_consumer-credit-card-market-report_2017.pdf.
13 Bureau of Consumer Financial Protection, Fair Debt Collection Practices Act: BCFP Annual Report 2018 8 (Mar. 2018), available at https://www.consumerfinance.gov/documents/6346/cfpb_fdcpa_annual-report-congress_03-2018.pdf (citations omitted).

13 COMPLAINT SNAPSHOT: DEBT COLLECTION BUREAU OF CONSUMER FINANCIAL PROTECTION
Our complaint process reflects this reality by allowing consumers to select the type of debt
underlying their complaint.14 The Bureau’s complaint form requires consumers to select the type
of debt from a list of options: auto debt, credit card debt, federal student loan debt, medical debt, mortgage debt, payday loan debt, private student loan debt, other debt, and I don’t know. The other debt category includes types of debt that are not listed on the Bureau’s
complaint form. Figure 1 shows the types of debt underyling the debt collection complaints
consumers submitted as a percentage of debt collection complaints received to date. For more
than half of the debt collection complaints submitted to the Bureau, consumers selected other debt (33 percent) or I don’t know (23 percent).
FIGURE 1: TYPES OF DEBT ABOUT WHICH CONSUMERS COMPLAIN
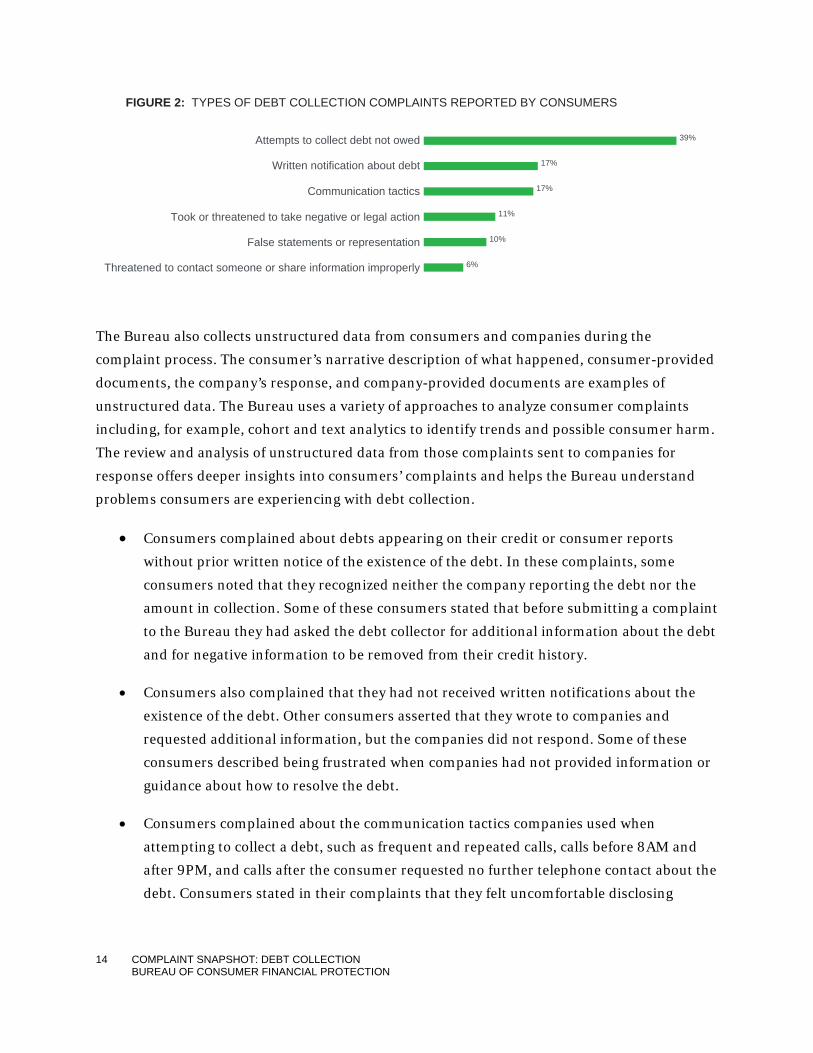
Figure 2 shows the types of debt collection complaints consumers submitted as a percentage of
debt collection complaints received to date. The most common concerns identified by
consumers are attempts to collect debt not owed (39 percent), written notification about debt
(17 percent), and communication tactics (17 percent).
14 See Bureau of Consumer Financial Protection, Consumer Response Annual Report (Mar. 2018), available at www.consumerfinance.gov/documents/6406/cfpb_consumer-response-annual-report_2017.pdf.
Other debt
I do not know
Medical debt
Credit card debt
Payday loan debt
Mortgage debt
Auto debt
Federal student loan debt
Private student loan debt
33%
23%
14%
14%
9%
2%
2%
2%
1%
14 COMPLAINT SNAPSHOT: DEBT COLLECTION BUREAU OF CONSUMER FINANCIAL PROTECTION
FIGURE 2: TYPES OF DEBT COLLECTION COMPLAINTS REPORTED BY CONSUMERS
The Bureau also collects unstructured data from consumers and companies during the
complaint process. The consumer’s narrative description of what happened, consumer-provided
documents, the company’s response, and company-provided documents are examples of
unstructured data. The Bureau uses a variety of approaches to analyze consumer complaints
including, for example, cohort and text analytics to identify trends and possible consumer harm.
The review and analysis of unstructured data from those complaints sent to companies for
response offers deeper insights into consumers’ complaints and helps the Bureau understand
problems consumers are experiencing with debt collection.
• Consumers complained about debts appearing on their credit or consumer reports
without prior written notice of the existence of the debt. In these complaints, some
consumers noted that they recognized neither the company reporting the debt nor the
amount in collection. Some of these consumers stated that before submitting a complaint
to the Bureau they had asked the debt collector for additional information about the debt
and for negative information to be removed from their credit history.
• Consumers also complained that they had not received written notifications about the
existence of the debt. Other consumers asserted that they wrote to companies and
requested additional information, but the companies did not respond. Some of these
consumers described being frustrated when companies had not provided information or
guidance about how to resolve the debt.
• Consumers complained about the communication tactics companies used when
attempting to collect a debt, such as frequent and repeated calls, calls before 8AM and
after 9PM, and calls after the consumer requested no further telephone contact about the
debt. Consumers stated in their complaints that they felt uncomfortable disclosing
Attempts to collect debt not owed
Written notification about debt
Communication tactics
Took or threatened to take negative or legal action
False statements or representation
Threatened to contact someone or share information improperly
39%
17%
17%
11%
10%
6%

15 COMPLAINT SNAPSHOT: DEBT COLLECTION BUREAU OF CONSUMER FINANCIAL PROTECTION
personal information to people who called asking for it because they were not sure
whether the person calling was a legitimate collector.
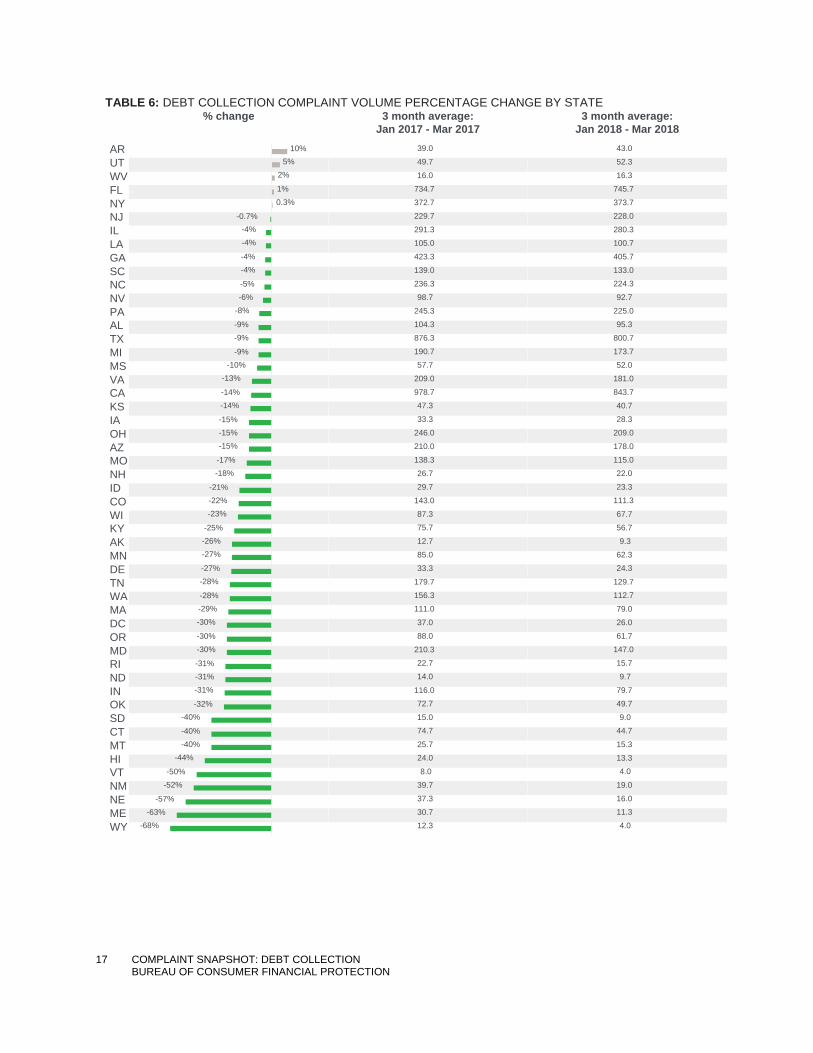
2.2 Complaints by state Table 6 shows the debt collection complaint volume percentage change by state.15 Some of the
highlights include:
States with the greatest percentage increase in debt collection complaints from January
2017 - March 2017 to January 2018 - March 2018 were Arkansas (10 percent), Utah (5
percent), and West Virginia (2 percent).
States with the greatest percentage decrease in debt collection complaints from January
2017 - March 2017 to January 2018 - March 2018 were Wyoming (-68 percent), Maine (-
63 percent), and Nebraska (-57 percent).
Of the five most populated states, Florida (1 percent) had the greatest percentage
increase and California (-14 percent) had the greatest percentage decrease in debt
collection complaints from January 2017 - March 2017 to January 2018 - March 2018.
15 Three-month averages are rounded, and percentage changes are based on non-rounded averages.
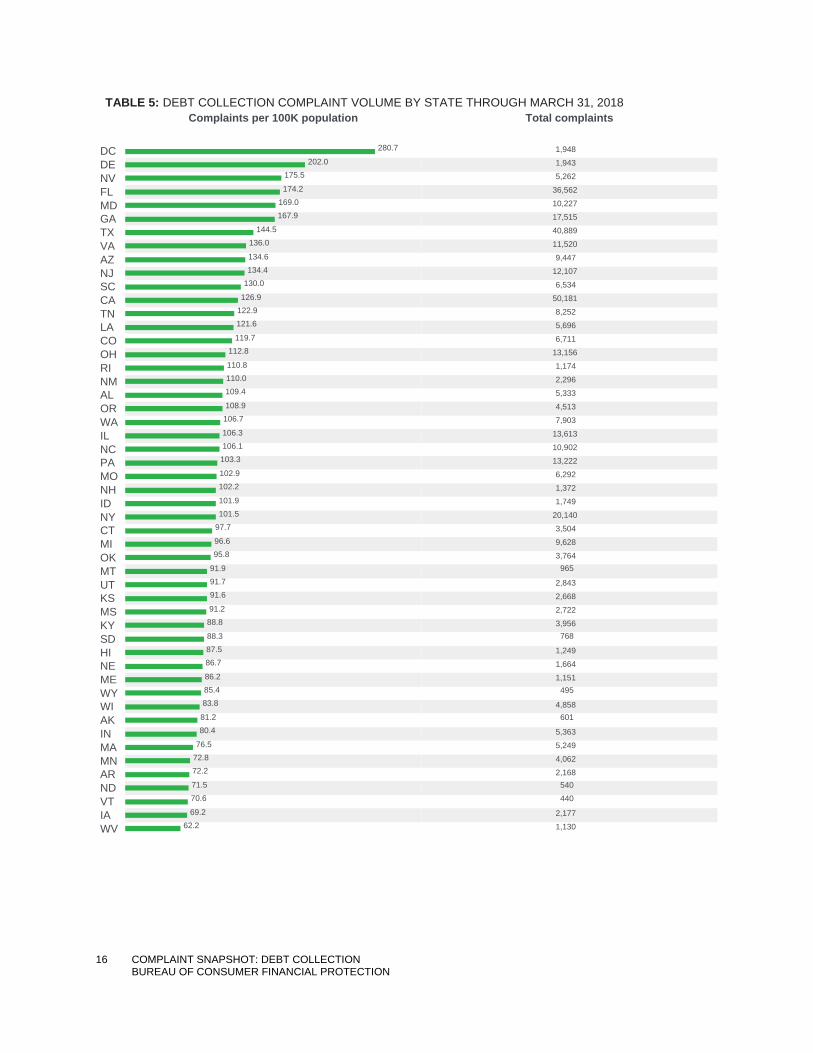
16 COMPLAINT SNAPSHOT: DEBT COLLECTION BUREAU OF CONSUMER FINANCIAL PROTECTION
TABLE 5: DEBT COLLECTION COMPLAINT VOLUME BY STATE THROUGH MARCH 31, 2018
Complaints per 100K population Total complaints
DCDENVFLMDGATXVAAZNJSCCATNLACOOHRINMALORWAILNCPAMONHIDNYCTMIOKMTUTKSMSKYSDHINEMEWYWIAKINMAMNARNDVTIAWV
280.7
202.0175.5
174.2169.0167.9
144.5136.0
134.6134.4
130.0
126.9122.9121.6
119.7112.8
110.8110.0109.4
108.9106.7
106.3106.1103.3
102.9102.2
101.9101.5
97.7
96.695.8
91.991.791.6
91.288.8
88.387.586.7
86.285.483.8
81.280.4
76.572.872.2
71.570.6
69.262.2
1,948
1,943
5,262
36,562
10,227
17,515
40,889
11,520
9,447
12,107
6,534
50,181
8,252
5,696
6,711
13,156
1,174
2,296
5,333
4,513
7,903
13,613
10,902
13,222
6,292
1,372
1,749
20,140
3,504
9,628
3,764965
2,843
2,668
2,722
3,956768
1,249
1,664
1,151495
4,858601
5,363
5,249
4,062
2,168540440
2,177
1,130
17 COMPLAINT SNAPSHOT: DEBT COLLECTION BUREAU OF CONSUMER FINANCIAL PROTECTION
TABLE 6: DEBT COLLECTION COMPLAINT VOLUME PERCENTAGE CHANGE BY STATE
% change 3 month average:Jan 2017 - Mar 2017
3 month average:Jan 2018 - Mar 2018
ARUTWVFLNYNJILLAGASCNCNVPAALTXMIMSVACAKSIAOHAZMONHIDCOWIKYAKMNDETNWAMADCORMDRINDINOKSDCTMTHIVTNMNEMEWY Abc
Abc
Abc
Abc
Abc
Abc
Abc
Abc
Abc
Abc
Abc
Abc
Abc
Abc
Abc
Abc
Abc
Abc
Abc
Abc
Abc
Abc
Abc
Abc
Abc
Abc
Abc
Abc
Abc
Abc
Abc
Abc
Abc
Abc
Abc
Abc
Abc
Abc
Abc
Abc
Abc
Abc
Abc
Abc
Abc
Abc
Abc
Abc
Abc
Abc
Abc
-0.7%
-30%-30%
-31%-31%-31%
-21%
-32%-40%
-40%
-44%
-50%-52%
-57%-63%
-68%
-10%-13%
-14%-14%
-15%-15%-15%
-17%-18%
-40%
-22%-23%
-25%-26%-27%
-27%-28%
-28%-29%-30%
0.3%
10%
-4%
-4%-4%
-5%-6%
-8%
-9%-9%
-9%
-4%
5%2%
1%
12.330.7
37.3
39.7
8.0
24.025.7
74.715.0
72.7116.0
14.0
22.7210.3
88.0
37.0
111.0156.3
179.7
33.3
85.0
12.7
75.787.3
143.0
29.7
26.7
138.3
210.0
246.0
33.3
47.3978.7
209.0
57.7190.7
876.3
104.3
245.3
98.7
236.3
139.0
423.3
105.0
291.3
229.7
372.7
734.7
16.0
49.7
39.0
4.0
11.316.0
19.0
4.013.3
15.3
44.79.0
49.7
79.7
9.7
15.7
147.061.7
26.0
79.0
112.7129.7
24.362.3
9.3
56.7
67.7
111.323.3
22.0115.0
178.0
209.0
28.3
40.7
843.7
181.0
52.0
173.7
800.7
95.3
225.0
92.7
224.3133.0
405.7
100.7
280.3
228.0
373.7
745.7
16.3
52.3
43.0
18 COMPLAINT SNAPSHOT: DEBT COLLECTION BUREAU OF CONSUMER FINANCIAL PROTECTION
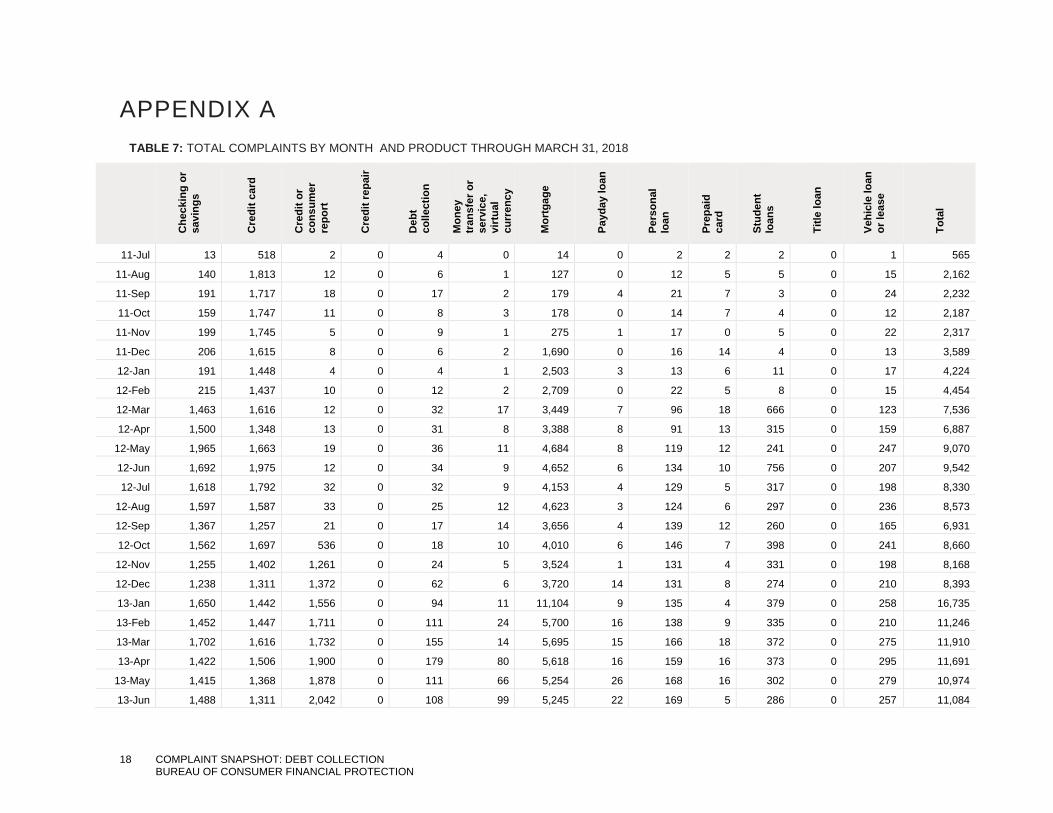
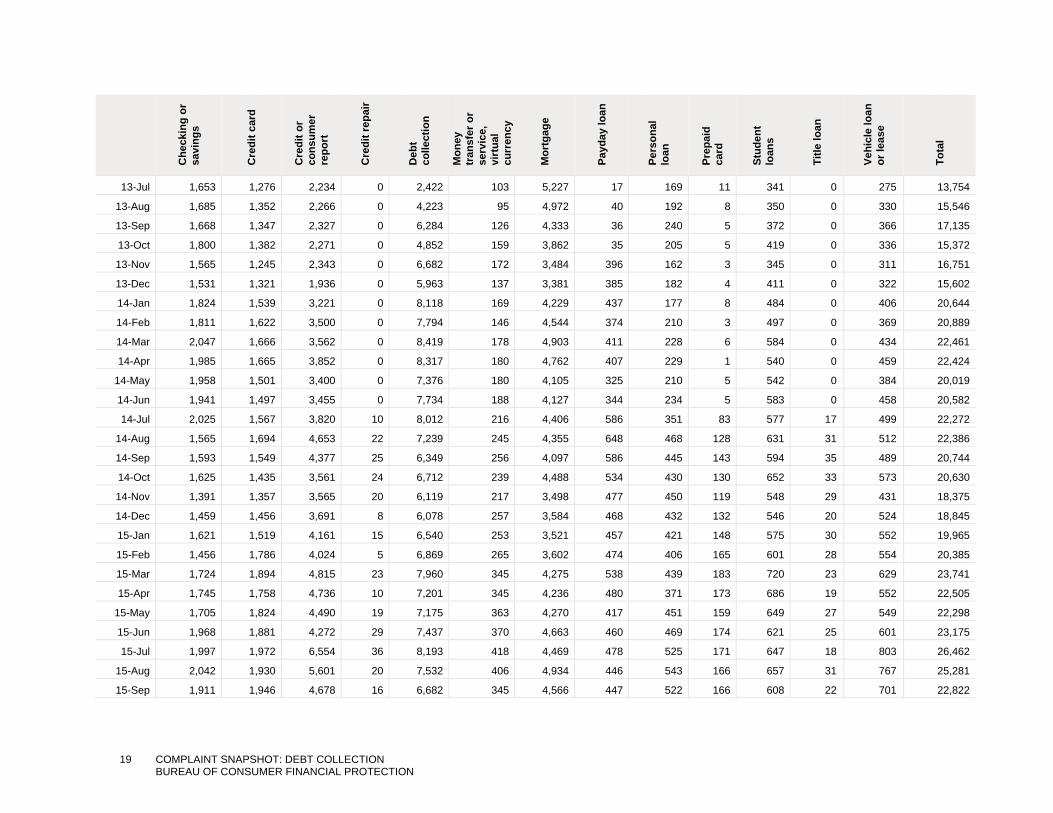
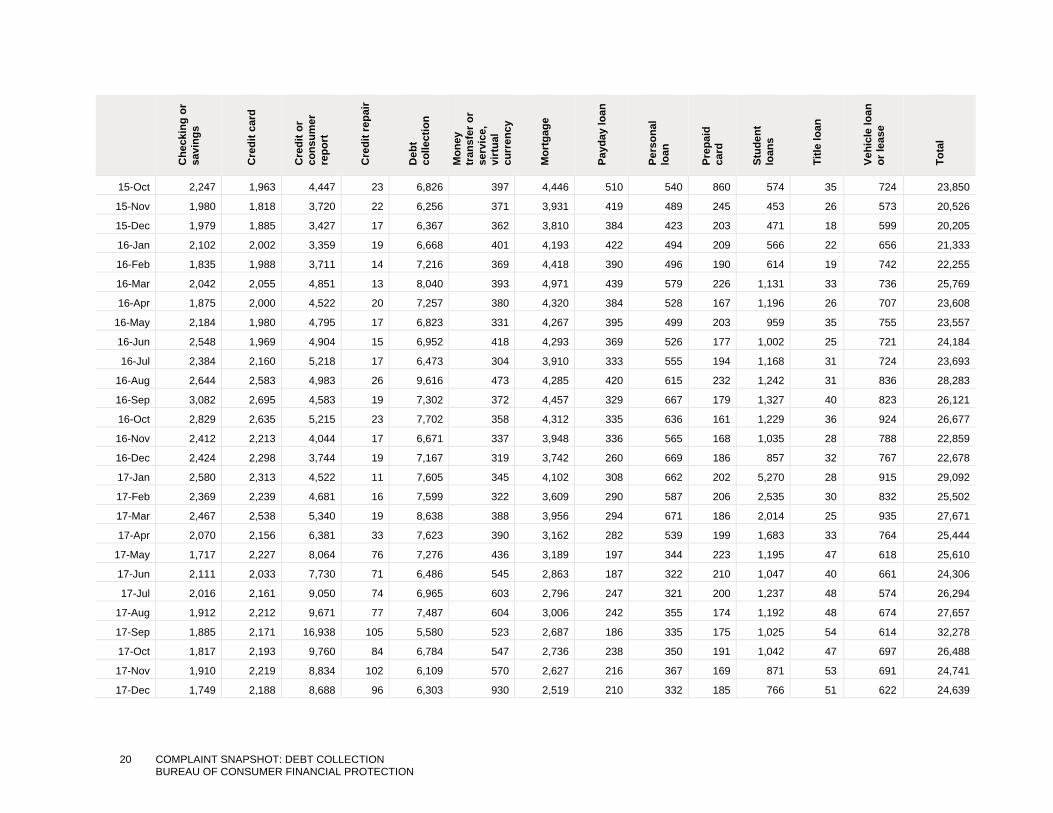
APPENDIX A TABLE 7: TOTAL COMPLAINTS BY MONTH AND PRODUCT THROUGH MARCH 31, 2018
Che
ckin
g or
sa
ving
s
Cre
dit c
ard
Cre
dit o
r co
nsum
er
repo
rt
Cre
dit r
epai
r
Deb
t co
llect
ion
Mon
ey
tran
sfer
or
serv
ice,
vi
rtua
l cu
rren
cy
Mor
tgag
e
Payd
ay lo
an
Pers
onal
lo
an
Prep
aid
ca
rd
Stud
ent
loan
s
Title
loan
Vehi
cle
loan
or
leas
e
Tota
l
11-Jul 13 518 2 0 4 0 14 0 2 2 2 0 1 565
11-Aug 140 1,813 12 0 6 1 127 0 12 5 5 0 15 2,162
11-Sep 191 1,717 18 0 17 2 179 4 21 7 3 0 24 2,232
11-Oct 159 1,747 11 0 8 3 178 0 14 7 4 0 12 2,187
11-Nov 199 1,745 5 0 9 1 275 1 17 0 5 0 22 2,317
11-Dec 206 1,615 8 0 6 2 1,690 0 16 14 4 0 13 3,589
12-Jan 191 1,448 4 0 4 1 2,503 3 13 6 11 0 17 4,224
12-Feb 215 1,437 10 0 12 2 2,709 0 22 5 8 0 15 4,454
12-Mar 1,463 1,616 12 0 32 17 3,449 7 96 18 666 0 123 7,536
12-Apr 1,500 1,348 13 0 31 8 3,388 8 91 13 315 0 159 6,887
12-May 1,965 1,663 19 0 36 11 4,684 8 119 12 241 0 247 9,070
12-Jun 1,692 1,975 12 0 34 9 4,652 6 134 10 756 0 207 9,542
12-Jul 1,618 1,792 32 0 32 9 4,153 4 129 5 317 0 198 8,330
12-Aug 1,597 1,587 33 0 25 12 4,623 3 124 6 297 0 236 8,573
12-Sep 1,367 1,257 21 0 17 14 3,656 4 139 12 260 0 165 6,931
12-Oct 1,562 1,697 536 0 18 10 4,010 6 146 7 398 0 241 8,660
12-Nov 1,255 1,402 1,261 0 24 5 3,524 1 131 4 331 0 198 8,168
12-Dec 1,238 1,311 1,372 0 62 6 3,720 14 131 8 274 0 210 8,393
13-Jan 1,650 1,442 1,556 0 94 11 11,104 9 135 4 379 0 258 16,735
13-Feb 1,452 1,447 1,711 0 111 24 5,700 16 138 9 335 0 210 11,246
13-Mar 1,702 1,616 1,732 0 155 14 5,695 15 166 18 372 0 275 11,910
13-Apr 1,422 1,506 1,900 0 179 80 5,618 16 159 16 373 0 295 11,691
13-May 1,415 1,368 1,878 0 111 66 5,254 26 168 16 302 0 279 10,974
13-Jun 1,488 1,311 2,042 0 108 99 5,245 22 169 5 286 0 257 11,084
19 COMPLAINT SNAPSHOT: DEBT COLLECTION BUREAU OF CONSUMER FINANCIAL PROTECTION
Che
ckin
g or
sa
ving
s
Cre
dit c
ard
Cre
dit o
r co
nsum
er
repo
rt
Cre
dit r
epai
r
Deb
t co
llect
ion
Mon
ey
tran
sfer
or
serv
ice,
vi
rtua
l cu
rren
cy
Mor
tgag
e
Payd
ay lo
an
Pers
onal
lo
an
Prep
aid
ca
rd
Stud
ent
loan
s
Title
loan
Vehi
cle
loan
or
leas
e
Tota
l
13-Jul 1,653 1,276 2,234 0 2,422 103 5,227 17 169 11 341 0 275 13,754
13-Aug 1,685 1,352 2,266 0 4,223 95 4,972 40 192 8 350 0 330 15,546
13-Sep 1,668 1,347 2,327 0 6,284 126 4,333 36 240 5 372 0 366 17,135
13-Oct 1,800 1,382 2,271 0 4,852 159 3,862 35 205 5 419 0 336 15,372
13-Nov 1,565 1,245 2,343 0 6,682 172 3,484 396 162 3 345 0 311 16,751
13-Dec 1,531 1,321 1,936 0 5,963 137 3,381 385 182 4 411 0 322 15,602
14-Jan 1,824 1,539 3,221 0 8,118 169 4,229 437 177 8 484 0 406 20,644
14-Feb 1,811 1,622 3,500 0 7,794 146 4,544 374 210 3 497 0 369 20,889
14-Mar 2,047 1,666 3,562 0 8,419 178 4,903 411 228 6 584 0 434 22,461
14-Apr 1,985 1,665 3,852 0 8,317 180 4,762 407 229 1 540 0 459 22,424
14-May 1,958 1,501 3,400 0 7,376 180 4,105 325 210 5 542 0 384 20,019
14-Jun 1,941 1,497 3,455 0 7,734 188 4,127 344 234 5 583 0 458 20,582
14-Jul 2,025 1,567 3,820 10 8,012 216 4,406 586 351 83 577 17 499 22,272
14-Aug 1,565 1,694 4,653 22 7,239 245 4,355 648 468 128 631 31 512 22,386
14-Sep 1,593 1,549 4,377 25 6,349 256 4,097 586 445 143 594 35 489 20,744
14-Oct 1,625 1,435 3,561 24 6,712 239 4,488 534 430 130 652 33 573 20,630
14-Nov 1,391 1,357 3,565 20 6,119 217 3,498 477 450 119 548 29 431 18,375
14-Dec 1,459 1,456 3,691 8 6,078 257 3,584 468 432 132 546 20 524 18,845
15-Jan 1,621 1,519 4,161 15 6,540 253 3,521 457 421 148 575 30 552 19,965
15-Feb 1,456 1,786 4,024 5 6,869 265 3,602 474 406 165 601 28 554 20,385
15-Mar 1,724 1,894 4,815 23 7,960 345 4,275 538 439 183 720 23 629 23,741
15-Apr 1,745 1,758 4,736 10 7,201 345 4,236 480 371 173 686 19 552 22,505
15-May 1,705 1,824 4,490 19 7,175 363 4,270 417 451 159 649 27 549 22,298
15-Jun 1,968 1,881 4,272 29 7,437 370 4,663 460 469 174 621 25 601 23,175
15-Jul 1,997 1,972 6,554 36 8,193 418 4,469 478 525 171 647 18 803 26,462
15-Aug 2,042 1,930 5,601 20 7,532 406 4,934 446 543 166 657 31 767 25,281
15-Sep 1,911 1,946 4,678 16 6,682 345 4,566 447 522 166 608 22 701 22,822
20 COMPLAINT SNAPSHOT: DEBT COLLECTION BUREAU OF CONSUMER FINANCIAL PROTECTION
Che
ckin
g or
sa
ving
s
Cre
dit c
ard
Cre
dit o
r co
nsum
er
repo
rt
Cre
dit r
epai
r
Deb
t co
llect
ion
Mon
ey
tran
sfer
or
serv
ice,
vi
rtua
l cu
rren
cy
Mor
tgag
e
Payd
ay lo
an
Pers
onal
lo
an
Prep
aid
ca
rd
Stud
ent
loan
s
Title
loan
Vehi
cle
loan
or
leas
e
Tota
l
15-Oct 2,247 1,963 4,447 23 6,826 397 4,446 510 540 860 574 35 724 23,850
15-Nov 1,980 1,818 3,720 22 6,256 371 3,931 419 489 245 453 26 573 20,526
15-Dec 1,979 1,885 3,427 17 6,367 362 3,810 384 423 203 471 18 599 20,205
16-Jan 2,102 2,002 3,359 19 6,668 401 4,193 422 494 209 566 22 656 21,333
16-Feb 1,835 1,988 3,711 14 7,216 369 4,418 390 496 190 614 19 742 22,255
16-Mar 2,042 2,055 4,851 13 8,040 393 4,971 439 579 226 1,131 33 736 25,769
16-Apr 1,875 2,000 4,522 20 7,257 380 4,320 384 528 167 1,196 26 707 23,608
16-May 2,184 1,980 4,795 17 6,823 331 4,267 395 499 203 959 35 755 23,557
16-Jun 2,548 1,969 4,904 15 6,952 418 4,293 369 526 177 1,002 25 721 24,184
16-Jul 2,384 2,160 5,218 17 6,473 304 3,910 333 555 194 1,168 31 724 23,693
16-Aug 2,644 2,583 4,983 26 9,616 473 4,285 420 615 232 1,242 31 836 28,283
16-Sep 3,082 2,695 4,583 19 7,302 372 4,457 329 667 179 1,327 40 823 26,121
16-Oct 2,829 2,635 5,215 23 7,702 358 4,312 335 636 161 1,229 36 924 26,677
16-Nov 2,412 2,213 4,044 17 6,671 337 3,948 336 565 168 1,035 28 788 22,859
16-Dec 2,424 2,298 3,744 19 7,167 319 3,742 260 669 186 857 32 767 22,678
17-Jan 2,580 2,313 4,522 11 7,605 345 4,102 308 662 202 5,270 28 915 29,092
17-Feb 2,369 2,239 4,681 16 7,599 322 3,609 290 587 206 2,535 30 832 25,502
17-Mar 2,467 2,538 5,340 19 8,638 388 3,956 294 671 186 2,014 25 935 27,671
17-Apr 2,070 2,156 6,381 33 7,623 390 3,162 282 539 199 1,683 33 764 25,444
17-May 1,717 2,227 8,064 76 7,276 436 3,189 197 344 223 1,195 47 618 25,610
17-Jun 2,111 2,033 7,730 71 6,486 545 2,863 187 322 210 1,047 40 661 24,306
17-Jul 2,016 2,161 9,050 74 6,965 603 2,796 247 321 200 1,237 48 574 26,294
17-Aug 1,912 2,212 9,671 77 7,487 604 3,006 242 355 174 1,192 48 674 27,657
17-Sep 1,885 2,171 16,938 105 5,580 523 2,687 186 335 175 1,025 54 614 32,278
17-Oct 1,817 2,193 9,760 84 6,784 547 2,736 238 350 191 1,042 47 697 26,488
17-Nov 1,910 2,219 8,834 102 6,109 570 2,627 216 367 169 871 53 691 24,741
17-Dec 1,749 2,188 8,688 96 6,303 930 2,519 210 332 185 766 51 622 24,639

21 COMPLAINT SNAPSHOT: DEBT COLLECTION BUREAU OF CONSUMER FINANCIAL PROTECTION
Che
ckin
g or
sa
ving
s
Cre
dit c
ard
Cre
dit o
r co
nsum
er
repo
rt
Cre
dit r
epai
r
Deb
t co
llect
ion
Mon
ey
tran
sfer
or
serv
ice,
vi
rtua
l cu
rren
cy
Mor
tgag
e
Payd
ay lo
an
Pers
onal
lo
an
Prep
aid
ca
rd
Stud
ent
loan
s
Title
loan
Vehi
cle
loan
or
leas
e
Tota
l
18-Jan 2,092 2,526 10,962 115 7,761 1,494 2,557 237 353 183 1,046 55 792 30,181
18-Feb 1,961 2,309 11,012 94 7,231 811 2,517 205 377 175 889 49 660 28,306
18-Mar 2,022 2,505 11,347 97 8,265 696 2,804 212 307 212 988 50 708 30,263
Total16 138,240 145,593 314,068 1,633 400,465 21,569 309,476 20,152 25,956 9,003 57,348 1,483 38,695 1,492,595
16 Total column includes approximately 8,900 complaints where consumers did not select a specific consumer financial product or service.

22 COMPLAINT SNAPSHOT: DEBT COLLECTION BUREAU OF CONSUMER FINANCIAL PROTECTION
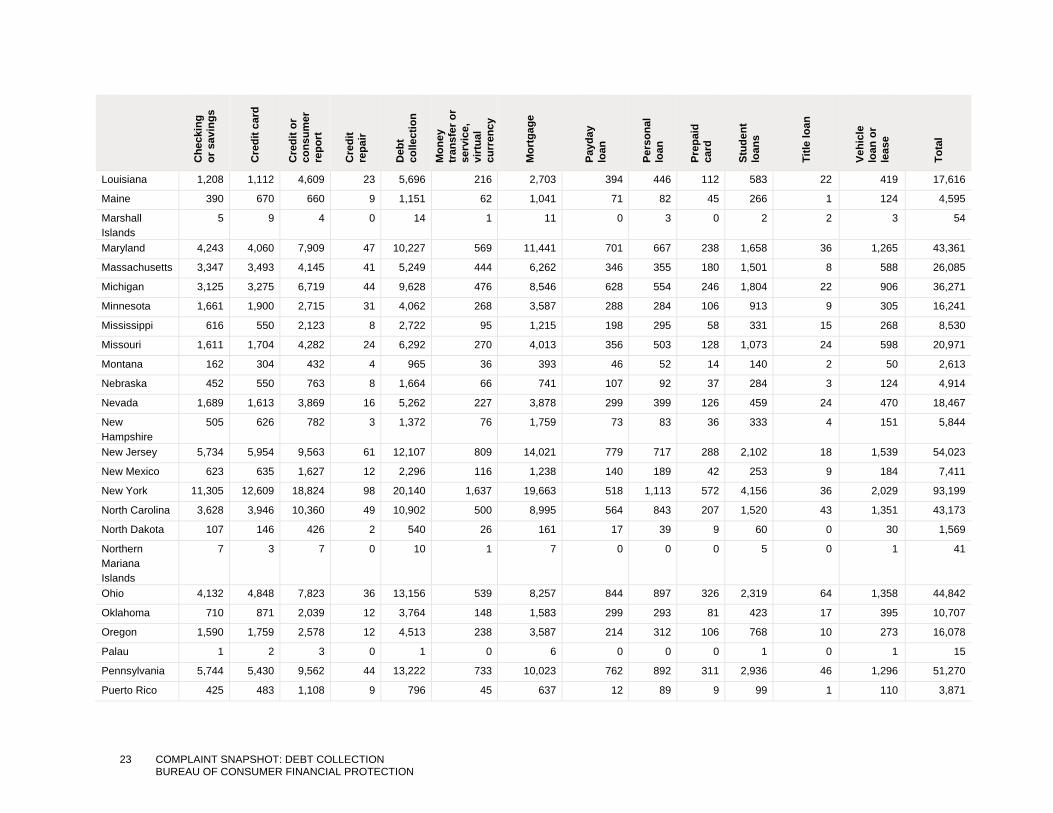
TABLE 8: TOTAL COMPLAINTS BY LOCALITY AND PRODUCT
Che
ckin
g or
sav
ings
Cre
dit c
ard
Cre
dit o
r co
nsum
er
repo
rt
Cre
dit
repa
ir
Deb
t co
llect
ion
Mon
ey
tran
sfer
or
serv
ice,
vi
rtua
l cu
rren
cy
Mor
tgag
e
Payd
ay
loan
Pers
onal
lo
an
Prep
aid
card
Stud
ent
loan
s
Title
loan
Vehi
cle
loan
or
leas
e
Tota
l
Alabama 1,358 1,167 4,308 29 5,333 195 2,473 396 521 128 669 23 539 17,267
Alaska 161 240 339 2 601 44 288 37 37 8 84 0 35 1,883
American Samoa
11 6 6 0 16 1 7 0 1 0 3 0 1 53
Arizona 2,952 3,233 5,917 28 9,447 426 7,094 297 514 192 1,118 81 1,038 32,555
Arkansas 598 634 1,744 9 2,168 90 1,056 87 137 40 322 7 257 7,189
Armed Forces Middle East
0 1 0 0 2 1 0 0 0 0 0 0 0 4
California 18,483 19,559 39,008 197 50,181 2,966 51,539 2,139 3,183 1,342 6,061 283 4,395 200,295
Colorado 2,126 2,658 4,781 25 6,711 318 5,215 272 356 143 1,034 13 668 24,454
Connecticut 1,896 2,066 2,935 32 3,504 247 3,615 204 247 110 820 9 437 16,231
Delaware 809 894 1,356 8 1,943 81 1,414 125 149 33 198 4 244 7,292
District of Columbia
1,054 942 1,460 5 1,948 159 1,593 138 127 61 549 6 194 8,319
Federated States of Micronesia
6 16 11 0 18 3 16 2 1 0 1 0 1 75
Florida 12,257 12,465 33,975 137 36,562 1,570 32,495 1,421 1,857 607 3,746 91 3,477 141,448
Georgia 5,521 4,862 18,553 74 17,515 716 15,680 491 1,244 394 2,272 106 2,042 69,790
Guam 19 25 68 7 51 15 35 4 6 3 8 1 11 253
Hawaii 354 572 930 4 1,249 54 1,254 47 74 18 159 1 104 4,843
Idaho 337 546 927 2 1,749 55 882 81 117 21 222 3 108 5,077
Illinois 5,629 5,317 12,736 48 13,613 673 10,900 701 840 372 2,086 21 1,211 54,408
Indiana 1,454 1,545 3,693 24 5,363 243 2,786 413 396 116 1,107 17 502 17,753
Iowa 489 737 1,355 12 2,177 112 906 146 128 55 376 6 173 6,707
Kansas 707 825 1,586 7 2,668 106 1,140 137 160 61 364 18 212 8,048
Kentucky 868 938 2,578 20 3,956 155 1,790 241 244 73 542 12 319 11,796
23 COMPLAINT SNAPSHOT: DEBT COLLECTION BUREAU OF CONSUMER FINANCIAL PROTECTION
Che
ckin
g or
sav
ings
Cre
dit c
ard
Cre
dit o
r co
nsum
er
repo
rt
Cre
dit
repa
ir
Deb
t co
llect
ion
Mon
ey
tran
sfer
or
serv
ice,
vi
rtua
l cu
rren
cy
Mor
tgag
e
Payd
ay
loan
Pers
onal
lo
an
Prep
aid
card
Stud
ent
loan
s
Title
loan
Vehi
cle
loan
or
leas
e
Tota
l
Louisiana 1,208 1,112 4,609 23 5,696 216 2,703 394 446 112 583 22 419 17,616
Maine 390 670 660 9 1,151 62 1,041 71 82 45 266 1 124 4,595
Marshall Islands
5 9 4 0 14 1 11 0 3 0 2 2 3 54
Maryland 4,243 4,060 7,909 47 10,227 569 11,441 701 667 238 1,658 36 1,265 43,361
Massachusetts 3,347 3,493 4,145 41 5,249 444 6,262 346 355 180 1,501 8 588 26,085
Michigan 3,125 3,275 6,719 44 9,628 476 8,546 628 554 246 1,804 22 906 36,271
Minnesota 1,661 1,900 2,715 31 4,062 268 3,587 288 284 106 913 9 305 16,241
Mississippi 616 550 2,123 8 2,722 95 1,215 198 295 58 331 15 268 8,530
Missouri 1,611 1,704 4,282 24 6,292 270 4,013 356 503 128 1,073 24 598 20,971
Montana 162 304 432 4 965 36 393 46 52 14 140 2 50 2,613
Nebraska 452 550 763 8 1,664 66 741 107 92 37 284 3 124 4,914
Nevada 1,689 1,613 3,869 16 5,262 227 3,878 299 399 126 459 24 470 18,467
New Hampshire
505 626 782 3 1,372 76 1,759 73 83 36 333 4 151 5,844
New Jersey 5,734 5,954 9,563 61 12,107 809 14,021 779 717 288 2,102 18 1,539 54,023
New Mexico 623 635 1,627 12 2,296 116 1,238 140 189 42 253 9 184 7,411
New York 11,305 12,609 18,824 98 20,140 1,637 19,663 518 1,113 572 4,156 36 2,029 93,199
North Carolina 3,628 3,946 10,360 49 10,902 500 8,995 564 843 207 1,520 43 1,351 43,173
North Dakota 107 146 426 2 540 26 161 17 39 9 60 0 30 1,569
Northern Mariana Islands
7 3 7 0 10 1 7 0 0 0 5 0 1 41
Ohio 4,132 4,848 7,823 36 13,156 539 8,257 844 897 326 2,319 64 1,358 44,842
Oklahoma 710 871 2,039 12 3,764 148 1,583 299 293 81 423 17 395 10,707
Oregon 1,590 1,759 2,578 12 4,513 238 3,587 214 312 106 768 10 273 16,078
Palau 1 2 3 0 1 0 6 0 0 0 1 0 1 15
Pennsylvania 5,744 5,430 9,562 44 13,222 733 10,023 762 892 311 2,936 46 1,296 51,270
Puerto Rico 425 483 1,108 9 796 45 637 12 89 9 99 1 110 3,871

24 COMPLAINT SNAPSHOT: DEBT COLLECTION BUREAU OF CONSUMER FINANCIAL PROTECTION
Che
ckin
g or
sav
ings
Cre
dit c
ard
Cre
dit o
r co
nsum
er
repo
rt
Cre
dit
repa
ir
Deb
t co
llect
ion
Mon
ey
tran
sfer
or
serv
ice,
vi
rtua
l cu
rren
cy
Mor
tgag
e
Payd
ay
loan
Pers
onal
lo
an
Prep
aid
card
Stud
ent
loan
s
Title
loan
Vehi
cle
loan
or
leas
e
Tota
l
Rhode Island 535 543 609 9 1,174 67 946 103 69 29 175 5 119 4,403
South Carolina 1,452 1,547 5,114 21 6,534 235 3,749 330 607 108 829 27 653 21,297
South Dakota 167 264 317 4 768 34 277 41 51 10 108 1 88 2,141
Tennessee 2,007 1,948 5,261 29 8,252 307 4,096 568 662 160 989 32 732 25,160
Texas 8,881 9,386 34,219 130 40,889 1,355 15,475 1,863 2,354 632 3,454 143 3,604 122,994
United States Minor Outlying Islands
0 0 2 0 1 0 0 1 0 0 0 0 0 4
U.S. Armed Forces – Americas
8 3 4 0 7 1 8 1 3 1 3 0 0 40
U.S. Armed Forces – Europe
51 47 118 0 140 16 108 1 11 2 48 0 20 563
U.S. Armed Forces – Pacific
24 54 86 1 118 5 64 3 8 1 21 0 15 400
Utah 588 858 1,779 4 2,843 119 1,723 144 166 38 295 13 209 8,826
Vermont 259 329 337 2 440 33 482 27 34 20 152 1 74 2,199
Virgin Islands 40 39 82 0 56 7 55 4 6 1 7 0 4 304
Virginia 3,998 4,646 8,944 29 11,520 718 9,444 640 857 295 1,732 38 1,321 44,443
Washington 2,547 2,856 5,201 32 7,903 449 7,049 353 423 188 1,602 25 587 29,376
West Virginia 359 411 901 6 1,130 95 568 37 58 31 259 2 129 4,032
Wisconsin 1,480 2,004 2,721 15 4,858 248 3,160 325 313 127 780 21 409 16,565
Wyoming 91 144 258 1 495 27 248 37 25 6 66 0 54 1,468
Unspecified 5,644 4,714 6,917 87 10,811 2,025 6,078 639 771 300 1,098 57 871 40,879
Grand Total 138,240 145,593 314,068 1,633 400,465 21,569 309,476 20,152 25,956 9,003 57,348 1,483 38,695 1,492,595
Recommended


![ACCOUNT STATED RESURRECTED: THE FICTION OF IMPLIED ASSENT IN CONSUMER DEBT COLLECTION · 2017-03-22 · 2013] The Fiction of Implied Assent in Consumer Debt Collection 341 pay the](https://img.pdfslide.us/doc/110x75/5e631ba2fd6177546f04abfc/account-stated-resurrected-the-fiction-of-implied-assent-in-consumer-debt-collection.jpg)