Compensation, Retirement, and Benefits Trends Report
© Newport Group, Inc. 2020. All rights reserved.
2019/2020 Edition
January 22, 2020
Rena SomersanManaging Principal, Compensation Consulting Services
Kevin BachlerDirector, Non-Qualified Projects and Technical Solutions

4FOR INFORMATIONAL PURPOSES ONLY.
Before we begin...
Which of these programs takes up the most of your mental bandwidth? (keeps you up at night!)
Quick Poll
A. Health and welfare plan costs
B. Wage-related costs (wages, overtime, paid time off, etc.)
C. Retirement plan costs
Stay tuned for the results!

5FOR INFORMATIONAL PURPOSES ONLY.
Agenda
CRB Survey Demographics
Compensation Practices
Retirement Plans
Health and Welfare Benefits
Questions
Wrap-up

6FOR INFORMATIONAL PURPOSES ONLY. 6
Demographics2019/2020 Compensation, Retirement and Benefit Trends Report

7FOR INFORMATIONAL PURPOSES ONLY.
Background
The annual Newport Compensation, Retirement and Benefits Trends Report is designed to reveal key
trends across a full range of compensation, retirement, health and welfare benefits and employee
rewards programs. The result is a comprehensive view of firms' total employee rewards programs that is
rarely available from a single source.
The 2019/2020 survey includes information from more than 467 organizations across the country, and
spanning a range of industries, with the highest response rates from manufacturing, not-for-profit,
healthcare, finance and professional service sectors.
Key Definitions• N: total number of respondents• Median: statistical point at which half of all reported responses are above, half are below• Average: total of all reported data divided by number of responses

8FOR INFORMATIONAL PURPOSES ONLY.
DemographicsKey Definitions
Northeast New England: Connecticut, Maine, Massachusetts, New Hampshire, Rhode Island, and Vermont
Middle Atlantic: New Jersey, New York and Pennsylvania
Midwest East North Central: Illinois, Indiana, Michigan, Ohio and Wisconsin
West North Central: Iowa, Kansas, Minnesota, Missouri, Nebraska, North Dakota and South Dakota
South South Atlantic: Delaware, District of Columbia,Florida, Georgia, Maryland, North Carolina, South Carolina, Virginia and West Virginia
East South Central: Alabama, Kentucky, Mississippi and Tennessee
West South Central: Arkansas, Louisiana, Oklahoma and Texas
West Mountain: Arizona, Colorado, Idaho, Montana, Nevada, New Mexico, Utah and Wyoming
Pacific: Alaska, California, Hawaii, Oregon and Washington
N=437
Some employers are located in multiple regions
23%
53%36%
26%
Location
Northeast Midwest South West

9FOR INFORMATIONAL PURPOSES ONLY.
Demographics
N=440
25%
35%
11%
8%
7%
14%
Annual Gross Revenue
<$10M $11M - $50M $51M - $100M
$101M - $250M $251M - $750M >$751M
45%
20%
14%
6%
15%
Full-Time Equivalent (FTEs)
<100 101-250 251-750 751-1500 >1500
N=467
10FOR INFORMATIONAL PURPOSES ONLY.
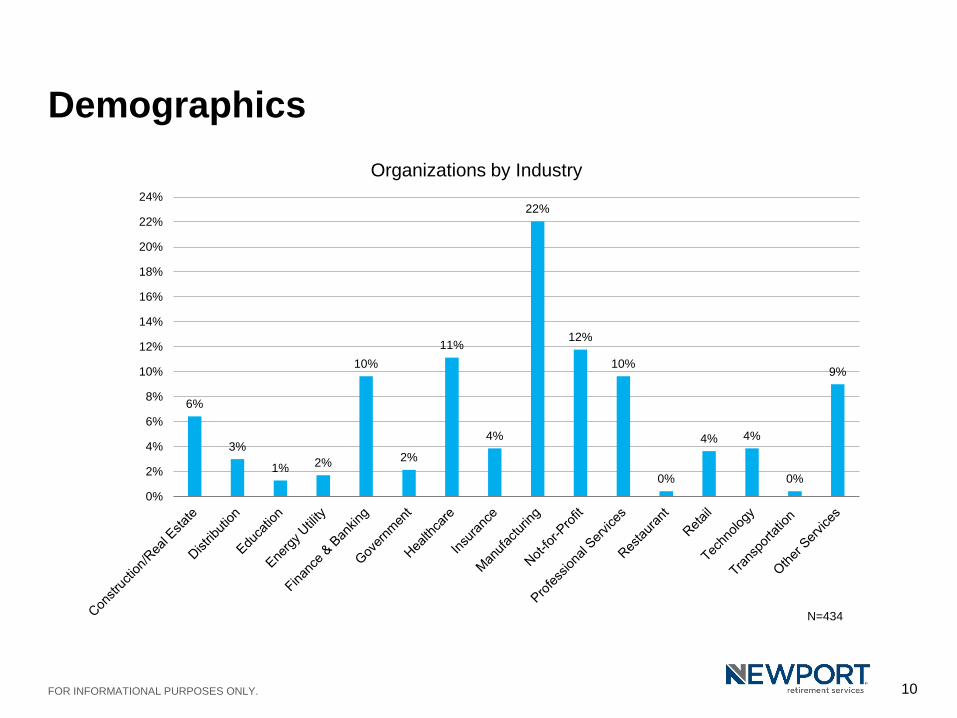
Demographics
N=434
6%
3%
1% 2%
10%
2%
11%
4%
22%
12%
10%
0%
4% 4%
0%
9%
0%
2%
4%
6%
8%
10%
12%
14%
16%
18%
20%
22%
24%
Organizations by Industry

11FOR INFORMATIONAL PURPOSES ONLY. 11
Compensation Practices2019/2020 Compensation, Retirement and Benefit Trends Report

12FOR INFORMATIONAL PURPOSES ONLY.
Total Compensation PhilosophyQUESTION: What is your organization’s total compensation philosophy?
When considering which areas of the Total Compensation philosophy to differentiate, the greatest emphasis is placed on Health & Welfare Benefits or Retirement Benefits to be at levels above the market.
N=228
14%
25%
39%
36%
76%
53%
54%
49%
7%
2%
2%
4%
4%
21%
5%
11%
0% 10% 20% 30% 40% 50% 60% 70% 80% 90% 100%
Base Salary
Incentive Compensation
Health & Welfare Benefits
Retirement Benefits
Position above market Position at market Position below market No formal philosophy

13FOR INFORMATIONAL PURPOSES ONLY.
Base Salary IncreasesQUESTION: Please indicate the AVERAGE percentage amount allocated for base salary increases in 2019 and the amount anticipated for 2020, as a percent of base pay.
Median base salary increases for executive, salaried exempt and hourly non-exempt stayed consistent with the past several years at 3.0%. Projected 2020 increases for all groups are highest in the Manufacturing and Distribution sector along with Construction & Real Estate. The West region is again projecting higher increases for all job categories compared to other regions.
N=408
3.16%
3.60%
3.77%
3.08%
3.49%
3.68%
2.00%
2.25%
2.50%
2.75%
3.00%
3.25%
3.50%
3.75%
4.00%
Executives Salaried (Exempt) Hourly (Non-Exempt)
Budget Salary Increase (Average)
2019 2020
3.00% 3.00% 3.00%3.00% 3.00% 3.00%
2.00%
2.25%
2.50%
2.75%
3.00%
3.25%
3.50%
3.75%
4.00%
Executives Salaried (Exempt) Hourly (Non-Exempt)
Base Salary Increases (Median)
2019 2020

14FOR INFORMATIONAL PURPOSES ONLY.
Base Salary Increases Projected for 2020 by IndustryQUESTION: Please indicate the AVERAGE percentage amount anticipated for 2020, as a percent of base pay.
Overall
Manufacturing, Distribution,
Utilities, Technology, & Transportation
Not-for-Profit, Education, & Government
Construction & Real Estate
Other Services, Professional
Services, Restaurant, &
Retail
Finance, Banking, & Insurance Healthcare
Executives % % % % % % %
Average 3.08 3.32 2.83 3.31 3.02 3.25 2.51
Median 3.00 3.00 3.00 3.00 3.00 3.00 3.00
Salaried (Exempt)
Average 3.49 3.78 2.78 5.23 3.24 3.69 2.94
Median 3.00 3.00 3.00 3.00 3.00 3.00 3.00
Hourly (Non-exempt)
Average 3.68 3.81 2.92 7.17 3.35 3.47 3.22
Median 3.00 3.00 3.00 3.00 3.00 3.00 3.00
Base 441 137 68 27 103 57 49

15FOR INFORMATIONAL PURPOSES ONLY.
Salary StructureQUESTION: Do you have a formal salary structure (i.e., ranges with a minimum and maximum) to manage compensation across levels within the organization?
A slight majority of organizations utilize a formal salary structure with grades (minimums, midpoints and maximums) to manage compensation. As organization size grows (FTE count), the more likely they are to have utilize a formal structure. From a industry perspective, Healthcare, Not-for-Profit, and Finance, Banking & Insurance sectors are more likely than other groups to have a formal salary structure to manage their compensation investment.
N=467
56%44%
Yes No
Overall 100 or Fewer 101-250 251-750 751-1,500 1,500 or More
Yes 56% 40% 57% 65% 85% 80%
No 44% 60% 43% 35% 15% 20%
Base 467 210 95 66 27 69
Salary Structure by FTEs

16FOR INFORMATIONAL PURPOSES ONLY.
Salary Range/Structure MovementQUESTION: Please indicate the percentage salary range/structure movement for 2019 and the amount anticipated for 2020.
Projected median increases are expected to be similar to 2019 increases of 2.0%, with a slight uptick for salaried exempt populations. The West region and the Services sector are projecting the highest median structure movement within their respective categories.
N=185
2.22%
2.10%
2.27%
2.22% 2.24%
2.34%
1.80%
1.90%
2.00%
2.10%
2.20%
2.30%
2.40%
Executives Salaried (Exempt) Hourly (Non-Exempt)
Salary Range/Salary Structure Movement (Average)
2019 2020
2.00% 2.00% 2.00%2.00% 2.00% 2.00%
1.80%
1.90%
2.00%
2.10%
2.20%
2.30%
2.40%
2.50%
Executives Salaried (Exempt) Hourly (Non-Exempt)
Salary Range/Salary Structure Movement (Median)
2019 2020

17FOR INFORMATIONAL PURPOSES ONLY.
Pay for Performance IncreasesQUESTION: In general, please indicate the average base salary increases in 2019 for each of the following categories:
Increasingly, dollars continue to be allocated to differentiate high performers and less money is being utilized, as a percent of payroll, to reward low performers. While salary budgets increased 3%, higher performers received approximately a 4.65% average adjustment.
QUESTION: In general, please indicate the median base salary increases in 2019 for each of the following categories:
N=382
4.65%
2.88%
1.39%
0.00% 0.50% 1.00% 1.50% 2.00% 2.50% 3.00% 3.50% 4.00% 4.50% 5.00%
High Performers
Satisfactory Performers
Low Performers
4.00%
3.00%
1.00%
0.00% 0.50% 1.00% 1.50% 2.00% 2.50% 3.00% 3.50% 4.00% 4.50% 5.00%
High Performers
Satisfactory Performers
Low Performers

18FOR INFORMATIONAL PURPOSES ONLY.
32%
23%
23%
22%
0% 5% 10% 15% 20% 25% 30% 35%
We have a formal program with a performance rating that is mathematically calculated
We have a formal program with a performance rating that is not mathematically calculated
We formally assess performance, but do not assign a performance rating
No, we do not formally assess performance
Employee Performance Management ProgramQUESTION: Do you have a formal employee performance management program, resulting in a performance rating or score that is shared with the employee?
When assessing performance, the greatest number of employers utilized a mathematically calculated formula. Approximately one-third of employers assessed performance but did not assign a performance rating.
N=414

19FOR INFORMATIONAL PURPOSES ONLY.
26%
8%
26%
25%
10%
4%
0% 5% 10% 15% 20% 25% 30%
Increases are based only on the individual employee's performance
Increases are an equal percentage across all positions
Increases are based on a formal salary increase matrix where recommended increase amount depends on both performance level and
position in range
Managers have flexibility based on budgetary guidance in determining salary increase amounts as long as they remain within an overall budget
Increases are based on another method
No guidance provided
Salary Increase RecommendationsQUESTION: What guidance does your organization provide to managers making salary increase recommendations/decisions?
When making salary increase decisions, three methods were used with similar frequency: individual employee performance; giving managers flexibility within an overall budget; salary matrix.
N=382

20FOR INFORMATIONAL PURPOSES ONLY.
Short-Term Incentive by IndustryQUESTION: Which employee groups are eligible to participate in a short-term incentive or bonus program?
Overall
Manufacturing, Distribution,
Utilities, Technology, & Transportation
Not-for-Profit, Education, & Government
Construction & Real Estate
Other Services, Professional
Services, Restaurant, &
Retail
Finance, Banking, & Insurance Healthcare
Hourly Production 67% 75% 63% 63% 60% 65% 47%
Office Professional 74% 73% 78% 75% 71% 82% 43%
Supervisory 78% 79% 72% 88% 71% 90% 50%
Management 90% 88% 84% 83% 83% 94% 90%
Executive 85% 81% 78% 83% 76% 92% 90%
Base 315 113 32 24 75 51 30

21FOR INFORMATIONAL PURPOSES ONLY.
3.0%
5.0%
5.0%
10.0%
20.0%
0% 5% 10% 15% 20%
Hourly Production
Office Professional
Supervisory
Management
Executive
Target Short-Term Incentive Pay Opportunity for 2019 (Median)
4.5%
5.5%
7.7%
12.3%
22.3%
0% 5% 10% 15% 20% 25%
Hourly Production
Office Professional
Supervisory
Management
Executive
Target Short-Term Incentive Pay Opportunity for 2019 (Average)
Short-Term Incentive Pay OpportunityQUESTION: What is the targeted short-term incentive pay opportunity at your company for 2019?
Targeted levels of short-term incentive for 2019 are highest for executives with an average of 22.3% of base pay. Hourly production employees had an average target opportunity of 4.5%.
N=258

22FOR INFORMATIONAL PURPOSES ONLY.
Long-Term Incentive Vehicles by IndustryQUESTION: Which long-term incentive vehicles are offered to eligible employees?
Overall
Manufacturing, Distribution,
Utilities, Technology, & Transportation
Not-for-Profit, Education, & Government
Construction & Real Estate
Other Services, Professional
Services, Restaurant, &
Retail
Finance, Banking, & Insurance Healthcare
Stock Options 6% 8% 2% 0% 6% 15% 3%
Stock Appreciation Rights 2% 3% 0% 0% 3% 2% 3%
Phantom Stock 3% 4% 2% 0% 0% 6% 6%
Performance Units 8% 12% 0% 5% 9% 15% 3%
Restricted Stock 12% 11% 0% 10% 10% 35% 6%
No Long Term Incentive Offered 61% 55% 85% 57% 66% 33% 72%
Other 19% 21% 13% 33% 15% 19% 19%
Base 355 117 54 21 79 48 36
23FOR INFORMATIONAL PURPOSES ONLY.
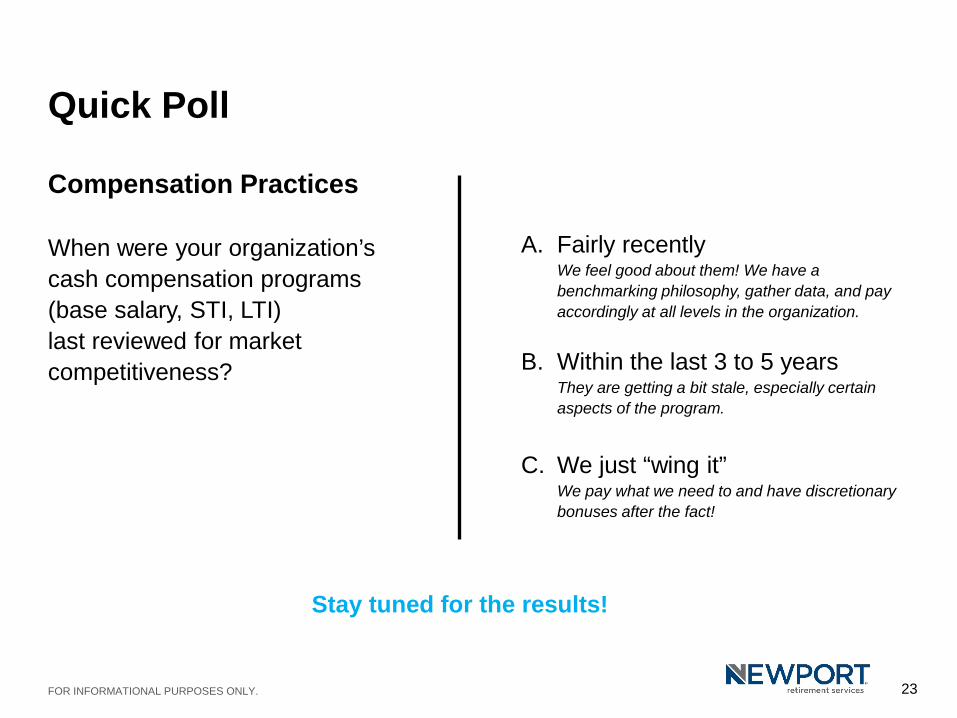
Compensation Practices
When were your organization’s cash compensation programs (base salary, STI, LTI) last reviewed for market competitiveness?
Quick Poll
A. Fairly recentlyWe feel good about them! We have a benchmarking philosophy, gather data, and pay accordingly at all levels in the organization.
B. Within the last 3 to 5 yearsThey are getting a bit stale, especially certain aspects of the program.
C. We just “wing it” We pay what we need to and have discretionary bonuses after the fact!
Stay tuned for the results!

24FOR INFORMATIONAL PURPOSES ONLY. 24
Retirement and Non-Qualified Plans2019/2020 Compensation, Retirement and Benefit Trends Report

25FOR INFORMATIONAL PURPOSES ONLY.
Retirement Plan OptionsQUESTION: What type of qualified retirement plan(s) do you offer?
The results of the 2019-2020 survey are consistent with past findings, showing most employers (90%) offer some type of defined contribution plan.
N=387
51%
39%
10%
2%
2%
6%
3%
0% 10% 20% 30% 40% 50% 60%
Matched Defined Contribution - Requires EE Contribution
Defined Contribution - Does Not Require EE Contribution
Defined Benefit - Traditional
Defined Benefit - Hybrid
ESOP - EE Contribution
ESOP - No EE Contribution
Simple

26FOR INFORMATIONAL PURPOSES ONLY.
Retirement Plan Matching Contributions by FTEsQUESTION: Does your company offer matching contributions?
Overall 100 or Fewer 101-250 251-750 751-1,500 1,500 or More
Yes, qualified 74% 67% 68% 70% 96% 85%
Yes, non-qualified 12% 6% 8% 5% 29% 36%
No, but planning to next year 1% 1% 4% 0% 0% 0%
No, but considering for the future 7% 9% 4% 6% 0% 6%
No, and not considering for the future 14% 18% 20% 5% 4% 6%
Base 392 175 85 66 24 53
QUESTION: How does the projected retirement plan contribution compare to last year? (Please select one)

27FOR INFORMATIONAL PURPOSES ONLY.
Retirement Plan Matching ContributionsQUESTION: For the defined contribution plan, your organization contributes the following amount:
Approximately 62% of organizations currently offer matching contributions over 3% of compensation. An additional 17% reported they are matching over 6% of compensation.
N=387
13%
11%
15%
19%
14%
12%
17%
0% 2% 4% 6% 8% 10% 12% 14% 16% 18% 20%
No amount contributed
Up to 2% of compensation
Between 2% and 3% of compensation
Between 3% and 4% of compensation
Between 4% and 5% of compensation
Between 5% and 6% of compensation
Over 6% of compensation

28FOR INFORMATIONAL PURPOSES ONLY.
Retirement Plan Automatic EnrollmentQUESTION: Does your plan have an automatic enrollment feature?
Close to half (42%) reported that their plan currently has an automatic enrollment feature, with an additional 16% of those not currently utilizing automatic enrollment either planning to add the feature next year, or considering it for the future.
N=467
42%
1%
15%
42%
0% 5% 10% 15% 20% 25% 30% 35% 40% 45%
Yes
No, but planning to next year
No, but considering for future
No, and not considering for the future

29FOR INFORMATIONAL PURPOSES ONLY.
Retirement Plan Automatic EnrollmentQUESTION: What percentage do you automatically enroll at in the qualified plan?
Most organizations (46%) use a 3% contribution rate as the default enrollment level with 12% enrolling at a 6% contribution rate.
N=193
46%
10%
9%
12%
23%
3%
4%
5%
6%
Other
0% 5% 10% 15% 20% 25% 30% 35% 40% 45% 50%

30FOR INFORMATIONAL PURPOSES ONLY.
Retirement Plan Automatic Escalation QUESTION: If you have or are planning to add an automatic enrollment feature, will your auto enrollment include an automatic escalation feature?
The survey found 44% of plans that include an automatic enrollment feature also have an automatic escalation feature, and an additional 18% are considering adding automatic escalation for the future.
N=195
44%
2%
16%
38%
0% 5% 10% 15% 20% 25% 30% 35% 40% 45% 50%
Plan has automatic escalation
No, but planning to add next year
No, but considering for the future
No, not considering for the future

31FOR INFORMATIONAL PURPOSES ONLY.
Retirement Plan Automatic Escalation QUESTION: If “yes,” for automatic enrollment and/or automatic escalation, what percent are you considering escalating each year?
Overwhelmingly, automatic escalation is targeted at +1% with low variance based on employee size or industry sector.
N=83
89%
4%
4%
4%
0% 10% 20% 30% 40% 50% 60% 70% 80% 90% 100%
1%
2%
3%
Other

32FOR INFORMATIONAL PURPOSES ONLY.
58%26%
3%
7%6%
More than five years
Between one and five years
One year or less
We don't work with an outside advisor
Don't know
Outside Advisor InvolvementQUESTION: How long have you been working with the same outside advisor?
Over 58% of respondents have been working with the same advisor for more than five years, with only 7% reporting they do not work with an outside advisor.
N=392

33FOR INFORMATIONAL PURPOSES ONLY.
Fiduciary GuidanceQUESTION: For the defined contribution plan, what approach has your organization taken for fiduciary guidance?
Plan sponsors have retained an independent advisor in 71% of organizations with 3% considering for the future.
N=384
11%
71%
3%
15%
0% 10% 20% 30% 40% 50% 60% 70% 80%
No steps taken
Retained an independent advisor
Considering an independent advisor
Utilizing internal resource

34FOR INFORMATIONAL PURPOSES ONLY.
22%
1%
6%
31%
39%
0% 5% 10% 15% 20% 25% 30% 35% 40% 45%
Yes, already use provider for 3(16) administrative fiduciary services
Yes, considering this for next year
Yes, considering this for future
No, and not considering for the future
Don't know
3(16) Administrative FiduciaryQUESTION: Would the services of 3(16) administrative fiduciary be of interest to you?
In 2019, plan sponsors used a provider for 3(16) services in 22% of organizations with 7% considering for the future.
N=388

35FOR INFORMATIONAL PURPOSES ONLY.
Evaluating Retirement Plan Services QUESTION: Which of the following factors is MOST important in evaluating retirement plan offerings?
In 2019, 39% of employers focused most on the level and quality of services offered. The cost of investments follow close behind in importance to employers.
Note: can have multiple factors as "MOST" important. N=364
29%
20%
39%
6%
18%
13%
0% 5% 10% 15% 20% 25% 30% 35% 40% 45%
Cost of Investments
Cost of Service
Level/Quality of Service
Number of Investment Options
Reputation of the Provider
Recommendation of Advisor

36FOR INFORMATIONAL PURPOSES ONLY.
Non-Qualified Deferred Compensation PlansQUESTION: Do you offer a Non-Qualified Deferred Compensation, Non-Qualified Benefit, or other Key Person benefit plan?
Thirty-three percent of organizations offer a non-qualified deferred compensation or benefit program to their employees. This is a slight decrease over last year when 37% of companies offered non-qualified plans.
Note that use increases significantly and percentages essentially reverse as organization size grows, with prevalence at 74% when size exceeds 1,500 FTEs. This increase in percentage is consistent with our non-qualified survey which indicates that 92% of Fortune 1500 companies offer deferred compensation plans.
N=467
33%
67%
Yes No
Overall 100 or Fewer 101-250 251-750 751-1,500 1,500 or More
Yes 33% 18% 25% 33% 63% 74%
No 67% 82% 75% 67% 37% 26%
Base 467 210 95 66 27 69

37FOR INFORMATIONAL PURPOSES ONLY.
Non-Qualified Deferred Compensation Plans EligibilityQUESTION: What specific positions are eligible to participate in the plan?
As anticipated, due to the importance of the leadership responsibilities, eligibility in a non-qualified plan is most often for those in the CEO and Vice-President roles.
N=141
88%
81%
24%
50%
32%
22%
0% 10% 20% 30% 40% 50% 60% 70% 80% 90% 100%
President and CEO
Vice Presidents
Board of Directors
Director level
Division or Unit Managers
Other

38FOR INFORMATIONAL PURPOSES ONLY.
N=137
Non-Qualified Deferred Plan AlternativesQUESTION: Does your company offer the following non-qualified benefit programs? (Check all that apply)
When a non-qualified benefit program is offered, a voluntary deferred compensation program was utilized most often by 77% of responding organizations.
77%
16%
28%
36%
25%
14%
0% 10% 20% 30% 40% 50% 60% 70% 80% 90%
Voluntary Deferred Compensation (Salary deferral, bonus deferrral, etc)
Supplemental Executive Retirement Plan (SERP)
Mandatory Deferred Compensation via Company Contribution (deferred signing bonus, deferrred performance bonus, etc)
Key person life insurance
Key person disability
Key person medical insurance
Note: For tax-exempts or government agencies, this could include: 457(b); 457(f); or other insurance or annuity programs where the key person receives rights to the asset.

39FOR INFORMATIONAL PURPOSES ONLY.
14%
16%
5%
9%
3%
3%
31%
36%
40%
34%
14%
18%
27%
22%
27%
26%
18%
30%
9%
9%
6%
9%
6%
18%
20%
16%
22%
22%
59%
30%
0% 10% 20% 30% 40% 50% 60% 70%
Executive Recruiting
Executive Retention
Financial Planning tool for Executives
More tax-efficient compensation vehicle
Increase company stock ownership or defer taxes on performance units
Remove personal financial distractions for executives
Critical
Very Important
Somewhat Important
Not Important
Not Applicable
Non-Qualified Deferred Compensation Plans ImportanceQUESTION: How important are each of the following for your non-qualified benefit programs? (Check one box for each row)
Over half of organizations found the use of non-qualified programs to be “critical” or “very important” as a tool for executive retention and executive recruiting. Also of high importance as a financial planning tool for executives and the tax efficiencies offered were noted according to respondents.
N=152

40FOR INFORMATIONAL PURPOSES ONLY.
9%
12%
6%
7%
5%
11%
8%
45%
47%
37%
53%
45%
49%
42%
34%
28%
41%
21%
24%
24%
33%
1%
2%
2%
2%
3%
2%
3%
11%
11%
14%
17%
23%
14%
14%
0% 10% 20% 30% 40% 50% 60% 70% 80% 90% 100%
Overall understanding of plan
Valued component of overall benefit package
Plan education and materials
Investment choices
Website experience
Impact on retirement preparedness
Impact on current tax planning
Extremely Satisfied Very Satisfied Somewhat Satisfied Not Satisfied Not Applicable
Non-Qualified Deferred Compensation Plans Participant SatisfactionQUESTION: How satisfied do you think PARTICIPANTS are with the following aspects of your non-qualified benefit programs?
Overall most organizations believe participants are “very or extremely satisfied” with all aspects of their non-qualified programs. The least satisfaction was in the area of plan education and materials.
N=152

41FOR INFORMATIONAL PURPOSES ONLY.
Non-Qualified Deferred Compensation Plans Informal FundingQUESTION: Does your company set aside company assets to informally fund non-qualified plan liabilities? (Check all that apply)
For the 45% of organizations that set aside company assets to informally fund non-qualified plan liabilities, the favored option is to use life insurance (30%) to accomplish that purpose. This was significantly higher for larger organizations with over 1,500 employees (76%).
N=132
14%
30%
55%
11%
0%
10%
20%
30%
40%
50%
60%
Mutual Funds Life Insurance Does not set asideassets
Other

42FOR INFORMATIONAL PURPOSES ONLY.
Financial Wellness Programs by FTEsQUESTION: Has your company implemented "financial wellness" (financial literacy and education) programs to help employees prepare for current and future financial needs—whether separately or as part of the overall health and wellness program?
Overall 100 or Fewer 101-250 251-750 751-1,500 1,500 or More
Yes, have already implemented 45% 37% 42% 45% 64% 68%
No, but planning to implement 21% 20% 19% 30% 20% 21%
No, no plans to implement 34% 43% 39% 25% 16% 11%
Base 390 173 83 56 25 53

43FOR INFORMATIONAL PURPOSES ONLY. 43
Health And Welfare Benefits2019/2020 Compensation, Retirement and Benefit Trends Report

44FOR INFORMATIONAL PURPOSES ONLY.
Health Insurance Plan Options by IndustryQUESTION: Which of the following plans do you offer as health insurance options?
Overall
Manufacturing, Distribution,
Utilities, Technology, & Transportation
Not-for-Profit, Education, & Government
Construction & Real Estate
Other Services, Professional
Services, Restaurant, &
Retail
Finance, Banking, & Insurance Healthcare
Preferred Provider Organization (PPO) Plan 77% 81% 73% 67% 72% 88% 68%
High Deductible Health Plan (HDHP) with HSAs or HRAs 60% 64% 48% 62% 57% 64% 61%
Health Maintenance Organization (HMO) Plan 27% 22% 36% 29% 30% 21% 24%
Traditional Indemnity Plan 5% 2% 3% 0% 10% 7% 5%
Do not Offer Health Insurance 1% 1% 0% 0% 1% 2% 0%
Supplemental Medical Plan for Executives 2% 3% 2% 0% 2% 0% 0%
Retiree Medical Plan for all Employees 5% 6% 5% 0% 1% 13% 0%
Retiree Medical Plan for Executives 2% 2% 0% 0% 4% 0% 0%
Other 3% 3% 2% 5% 4% 2% 5%
Base 385 121 64 21 82 56 41

45FOR INFORMATIONAL PURPOSES ONLY.
Health Insurance Plan PreferenceQUESTION: For your most recent open enrollment, which of the following health insurance options was selected by the largest number of employees?
Similar to recent years, PPOs continue to be the most popular option among employees although less frequently. Overall, 49% selected PPOs during the most recent open enrollment period. High Deductible Health Plans continue to remain popular with over one-third choosing this option.
N=372
49%
36%
13%
2%
0% 10% 20% 30% 40% 50% 60%
Preferred Provider Organization (PPO) Plan
High Deductible Health Plan with HSAs or HRAs
Health Maintenance Organization (HMO) Plan
Traditional Indemnity Plan

46FOR INFORMATIONAL PURPOSES ONLY.
Health Insurance Percentage Change for 2019QUESTION: What was the average percentage change in your health insurance plan costs for the 2019 plan year?
While most employers (83%) saw an increase in health plan costs in 2019, the largest percentage of employers (31%) reported increases from 4.1% up to 8%.
N=373
6%
11%
27%
31%
14%
6%
3%
3%
0% 5% 10% 15% 20% 25% 30% 35%
Decreased
No Change
.1% - 4%
4.1% - 8%
8.1% - 12%
12.1% - 16%
16.1% - 20%
Over 20%

47FOR INFORMATIONAL PURPOSES ONLY.
Health Insurance Premium Amount by IndustryQUESTION: For the health insurance option selected by the majority of your employees, what is your average total premium amount? What percentage do your employees contribute to the premium amount?
Overall
Manufacturing, Distribution,
Utilities, Technology, & Transportation
Not-for-Profit, Education, & Government
Construction & Real Estate
Other Services, Professional
Services, Restaurant, &
Retail
Finance, Banking, & Insurance Healthcare
Average Monthly Premium
Family $1,708 $1,611 $1,925 $1,515 $1,626 $1,799 $1,751
Employee + One (Spouse or Child) $1,229 $1,154 $1,413 $1,114 $1,169 $1,251 $1,272
Employee + Children $1,138 $1,103 $1,287 $1,148 $1,080 $1,081 $1,158
Employee Only $585 $554 $653 $557 $556 $578 $646
Employee Share of Premium
Family 27% 27% 25% 19% 31% 30% 25%
Employee + One (Spouse or Child) 27% 27% 24% 18% 32% 29% 24%
Employee + Children 26% 26% 23% 17% 31% 29% 23%
Employee Only 17% 19% 12% 11% 21% 20% 12%
Base 276 98 54 16 62 43 32

48FOR INFORMATIONAL PURPOSES ONLY.
Plans to Address Health Care CostsQUESTION: What actions do you plan to take for the 2020 plan year to address healthcare costs?
Requiring employees to pay a greater share of healthcare costs through increased premium payments and raising deductibles arethe most common method of addressing healthcare costs among organizations of all sizes. However, the largest firms with 750 or more employees continue to implement wellness programs as a way to address costs.
N=362
32.9%
18.8%
15.5%
9.4%
3.6%
0.3%
4.7%
1.4%
0.3%
0.3%
0.0%
1.4%
51.1%
0.0% 10.0% 20.0% 30.0% 40.0% 50.0% 60.0%
Raise Employee Portion of Premium Payment
Raise Employee Deductibles
Implement Wellness Program
Offer Consumer Driven Health Care Option
Conduct Dependent Audit
Discontinue Coverage to Dependents
Offer Opt-Out Incentive
Pursue Coverage through a Private Exchange
Discontinue Coverage to Part-Time Employees
Discontinue Retiree Medical
Discontinue Coverage in State or Federal Exchange
Institute On-Site Health Center
No Actions Planned

49FOR INFORMATIONAL PURPOSES ONLY.
97%
94%
87%
82%
88%
51%
18%
10%
7%
0% 10% 20% 30% 40% 50% 60% 70% 80% 90% 100%
Dental
Life
Long-term Disability
Short-term Disability
Vision
Wellness Programs
Long-term Care Insurance
Retiree Medical
On-site Health Center
Benefits OfferedQUESTION: Which of the following benefits do you currently offer?
The majority of organizations offer various types of health and wellness benefits to their employees. Wellness programs are offered at 51% of organizations regardless of employee size or industry, except in the healthcare sector where 59% offer this benefit along with the highest use of an on-site health center.
N=373

50FOR INFORMATIONAL PURPOSES ONLY.
Benefits by FTEsQUESTION: Which of the following benefits do you currently offer?
Overall 100 or Fewer 101-250 251-750 751-1,500 1,500 or More
Dental 97% 93% 99% 98% 100% 100%
Life 94% 90% 94% 100% 100% 100%
Long-term Disability 87% 79% 86% 94% 96% 98%
Short-term Disability 82% 74% 83% 89% 96% 96%
Vision 88% 82% 88% 96% 96% 98%
Wellness Programs 51% 29% 58% 64% 70% 87%
Long-term Care Insurance 18% 13% 15% 17% 30% 30%
Retiree Medical 10% 6% 4% 11% 17% 28%
On-site Health Center 7% 1% 5% 4% 17% 26%
Base 373 164 80 53 23 53

51FOR INFORMATIONAL PURPOSES ONLY. 51
For More InformationA copy of our CRB Trends Report Executive Summary is available for you to download in the “Handouts” section of your control panel.
For a copy of our full report, or questions about our services, please contact your Newport relationship manager.
To learn more about our Compensation Consulting team, contact:
Rena Somersan, Managing Principal414-312-8189 [email protected]
Questions and Answers

52FOR INFORMATIONAL PURPOSES ONLY.
Notice of Confidentiality and DisclosureThe attached material was prepared by Newport. The format and substance of the material contained in this report were developed by and constitute the confidential work product of Newport. This report is provided solely for the use of the recipient and any other use, dissemination or distribution of such, including dissemination or distribution to outside consultants or advisors, without the prior written consent of Newport is prohibited.
© Newport Group, Inc. 2020. All rights reserved.
Newport Group, Inc. and its affiliates provide recordkeeping, plan administration, trust and custody, consulting, fiduciary consulting, insurance and brokerage services. Investment Advisory and fiduciary consulting services are offered through Newport Group Consulting, LLC, a registered investment adviser and wholly owned subsidiary of Newport Group, Inc. For more information about Newport Group Consulting and its services, please visit newportgroup.com or refer to our Form ADV Part 2, which is available by contacting us at 407-333-2905, or visiting our website at www.newportgroup.com.
Newport and its affiliates do not provide tax, legal or accounting advice. This material has been prepared for informational purposes only, and is not intended to provide, and should not be relied on for, tax, legal or accounting advice. You should consult your own tax, legal and accounting advisors before making any decisions.
20200115-1054613-3181425

Recommended