Comparisons of TES v002 Nadir Ozone with GEOS-Chem
by Ray Nassar & Jennifer Logan
Thanks to:Lin Zhang, Inna Megretskaia, Bob Yantosca, Phillipe LeSager,
Helen Worden & the TES Team
GEOS-Chem Meeting, Harvard University, 2007 April 11-13
Tropospheric Emission Spectrometer (TES)
Ray Nassar
GEOS-Chem Meeting, Harvard University, 2007 April 11-13
High resolution Fourier transform spectrometer (FTS) on Aura satellite
launched 2004 July 15, ~705 km sun-synch orbit, equator crossing ~13:45
Global Survey
16 orbits (~26 hrs)
Nadir footprint:
5.3 km x 8.3 km
Special observations:
Step & stare, Transect, Stare,
etc.
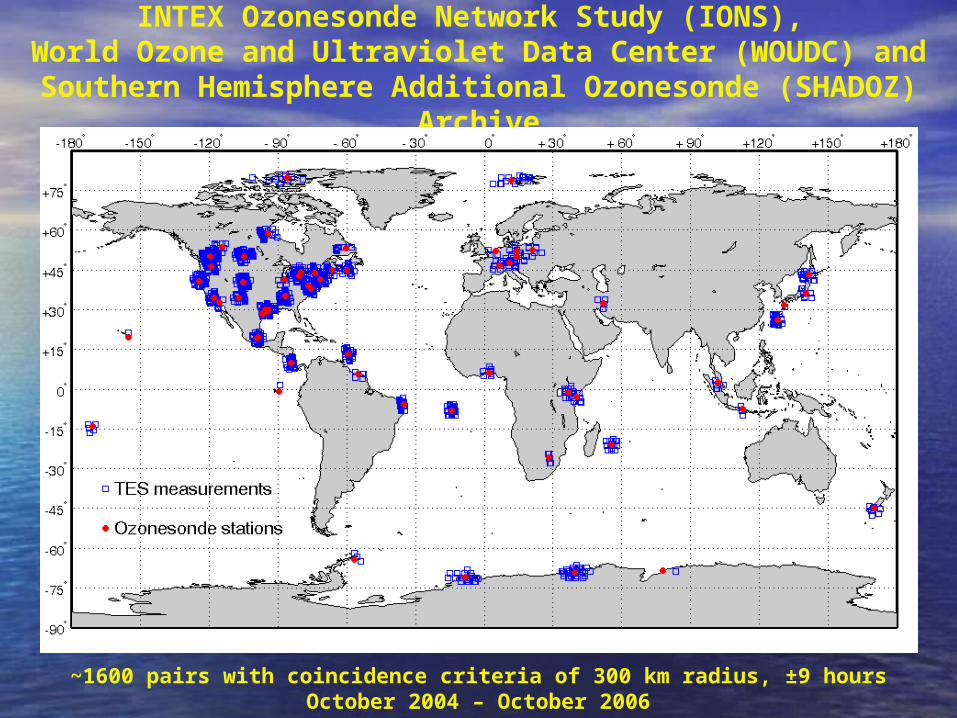
INTEX Ozonesonde Network Study (IONS), World Ozone and Ultraviolet Data Center (WOUDC) and Southern
Hemisphere Additional Ozonesonde (SHADOZ) Archive
~1600 pairs with coincidence criteria of 300 km radius, ±9 hoursOctober 2004 – October 2006
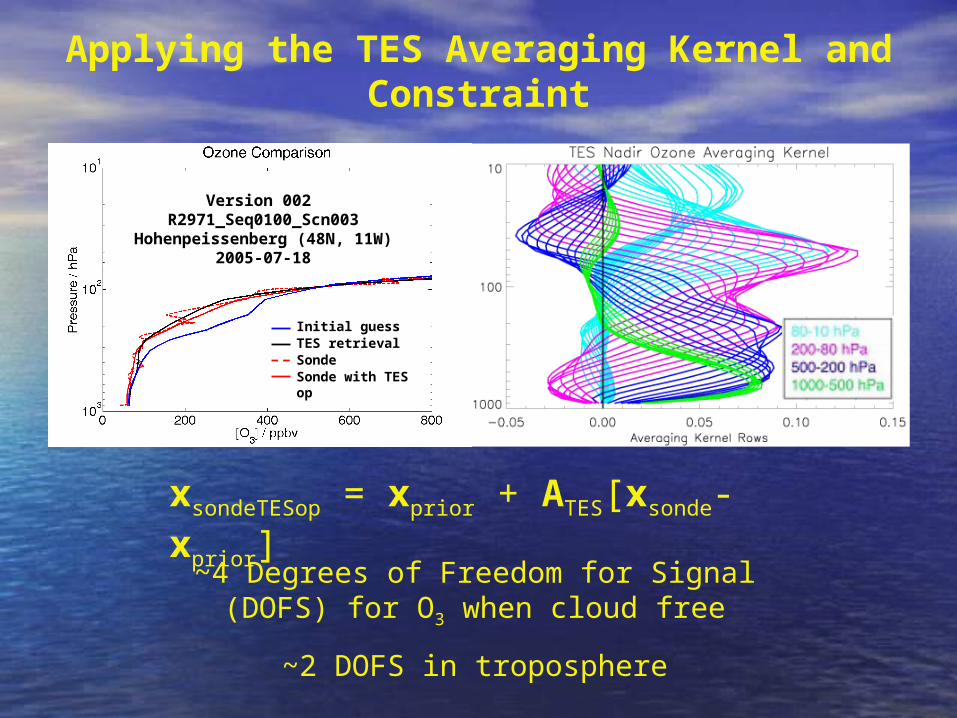
Applying the TES Averaging Kernel and Constraint
Version 002 R2971_Seq0100_Scn003
Hohenpeissenberg (48N, 11W)2005-07-18
~4 Degrees of Freedom for Signal (DOFS) for O3 when cloud free
~2 DOFS in troposphere
Initial guessTES retrievalSondeSonde with TES op
xsondeTESop = xprior + ATES[xsonde-xprior]
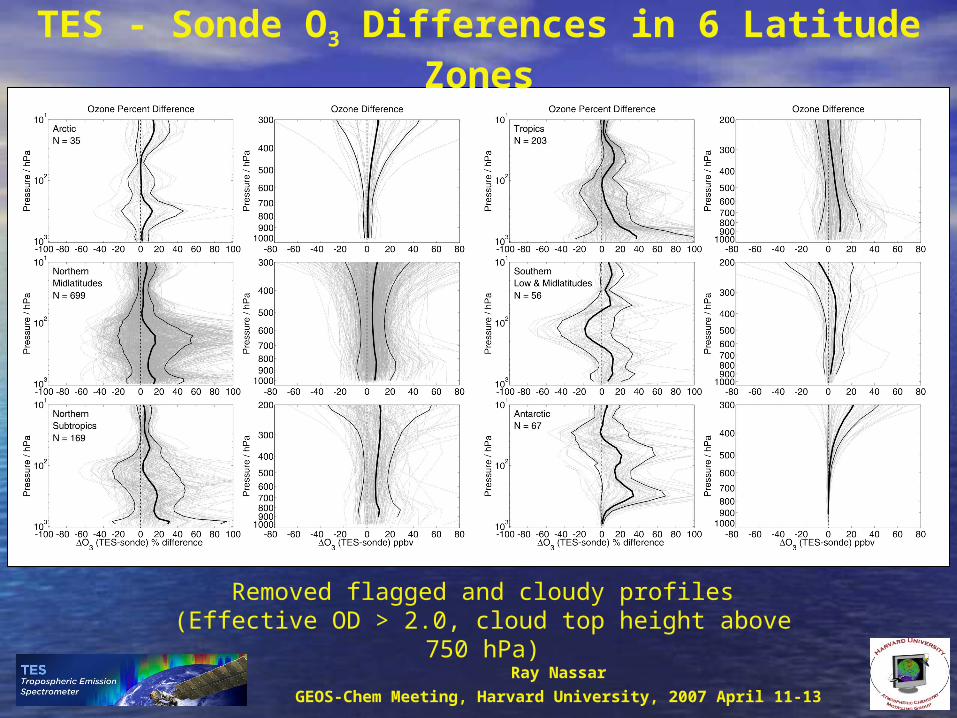
TES - Sonde O3 Differences in 6 Latitude Zones
Ray Nassar
GEOS-Chem Meeting, Harvard University, 2007 April 11-13
Removed flagged and cloudy profiles (Effective OD > 2.0, cloud top height above 750 hPa)
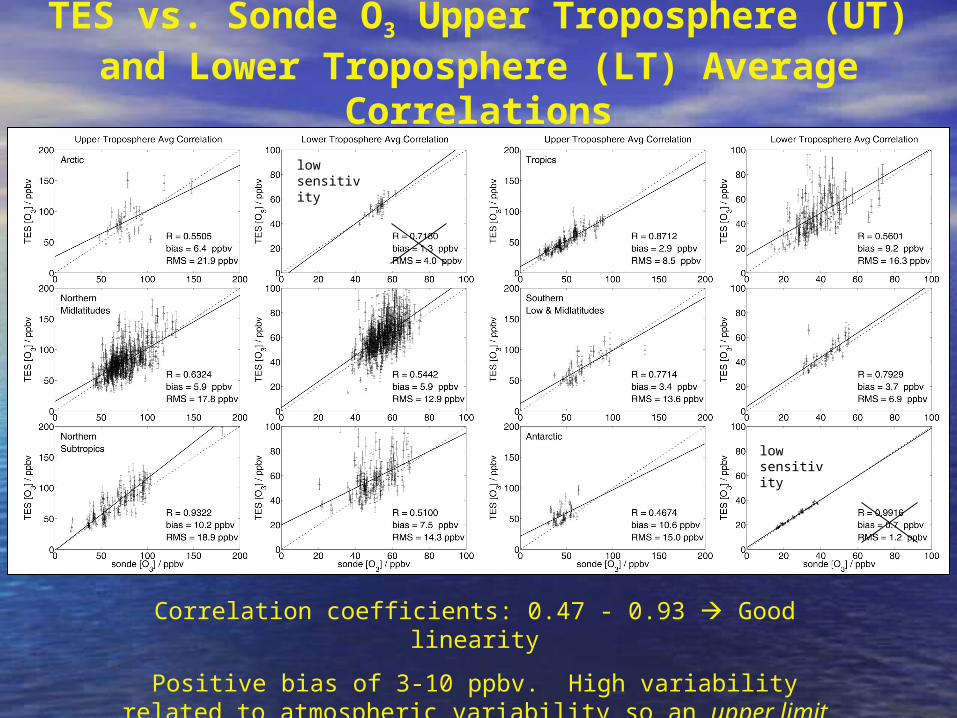
TES vs. Sonde O3 Upper Troposphere (UT) and Lower Troposphere (LT) Average Correlations
Correlation coefficients: 0.47 - 0.93 Good linearity
Positive bias of 3-10 ppbv. High variability related to atmospheric variability so an upper limit for of 7-16
ppbv
low sensitivity
low sensitivity
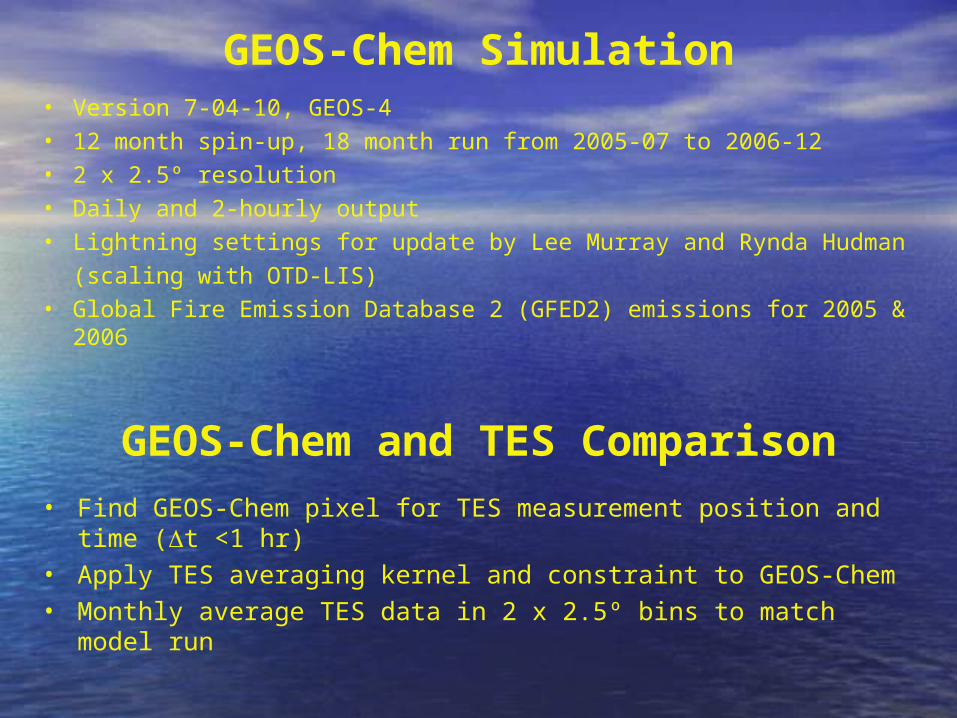
GEOS-Chem Simulation• Version 7-04-10, GEOS-4• 12 month spin-up, 18 month run from 2005-07 to 2006-12• 2 x 2.5º resolution• Daily and 2-hourly output • Lightning settings for update by Lee Murray and Rynda Hudman
(scaling with OTD-LIS)• Global Fire Emission Database 2 (GFED2) emissions for 2005 & 2006
GEOS-Chem and TES Comparison
• Find GEOS-Chem pixel for TES measurement position and time (t <1 hr) • Apply TES averaging kernel and constraint to GEOS-Chem• Monthly average TES data in 2 x 2.5º bins to match model run
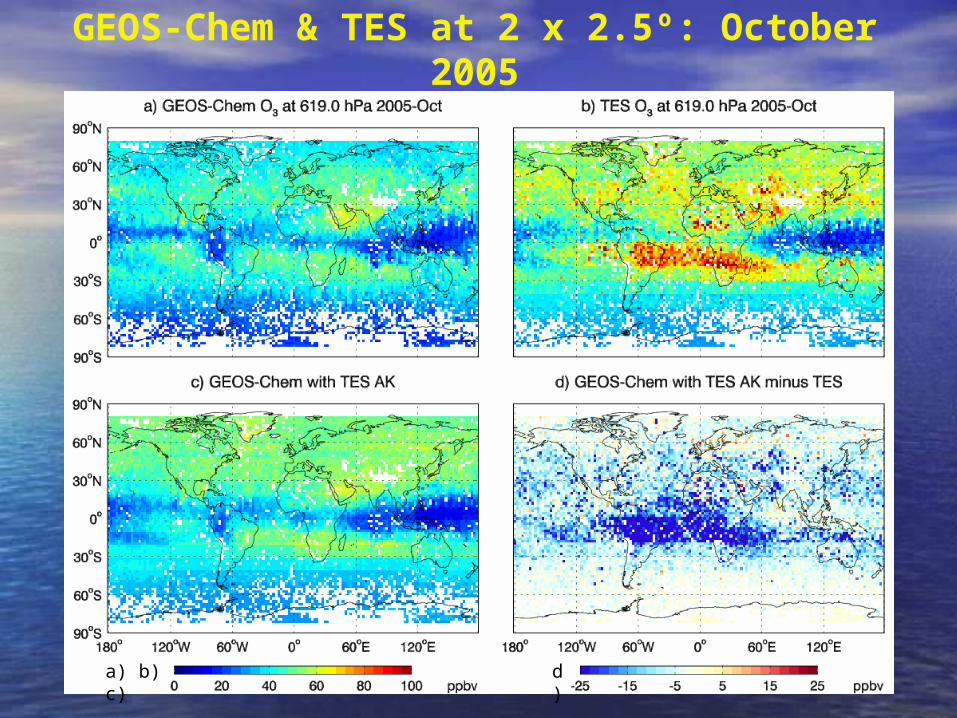
GEOS-Chem & TES at 2 x 2.5º: October 2005
a) b) c) d)
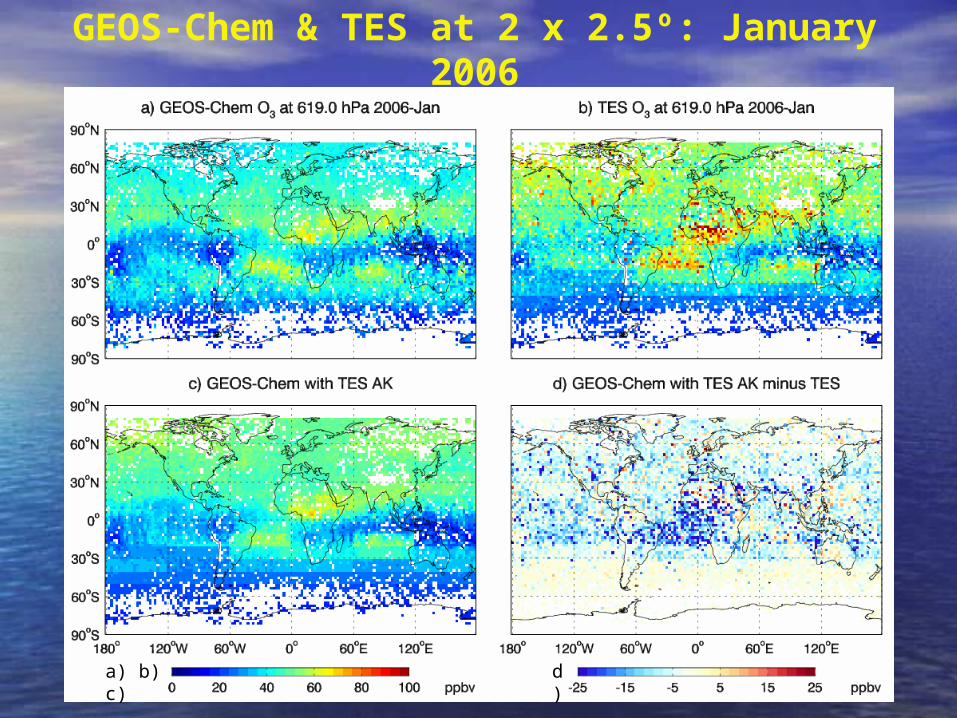
GEOS-Chem & TES at 2 x 2.5º: January 2006
a) b) c) d)
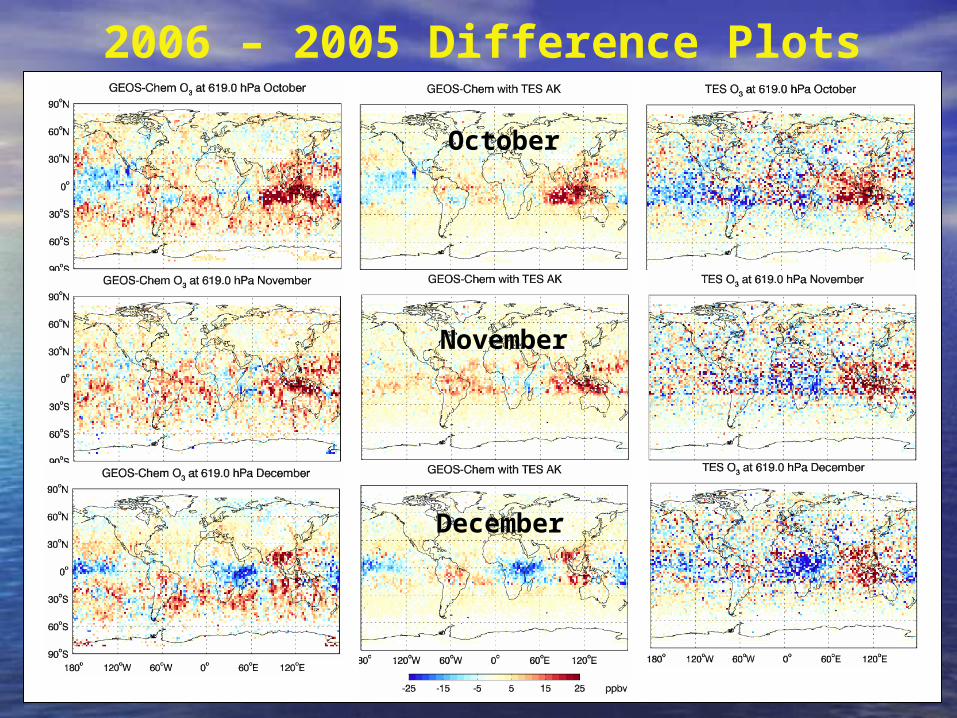
2006 – 2005 Difference Plots
October
November
December
Conclusions
• TES V002 nadir ozone profiles typically have a high bias of 3-10 ppbv in all latitude zones relative to ozonesondes
• High variability related to atmospheric variability so an upper limit for of 7-16 ppbv, relative variations in ozone measured by TES are meaningful
• GEOS-Chem underestimates tropical ozone relative to TES, especially in the southern tropical biomass burning season, but qualitatively good
• TES and GEOS-Chem show differences between 2006 and 2005 which likely relate to changes in biomass burning and/or lightning patterns due to the 2006 El Nino but requires further investigation
Future Work
• Screen TES ozone data using “emission layer” flag
• Apply vertical averaging over multiple layers to increase information content
• Re-run GEOS-Chem with different emissions, lightning parameters
• Determine if ozone is ‘conserved’
• Investigate whether higher ozone correlates with CO or lightning
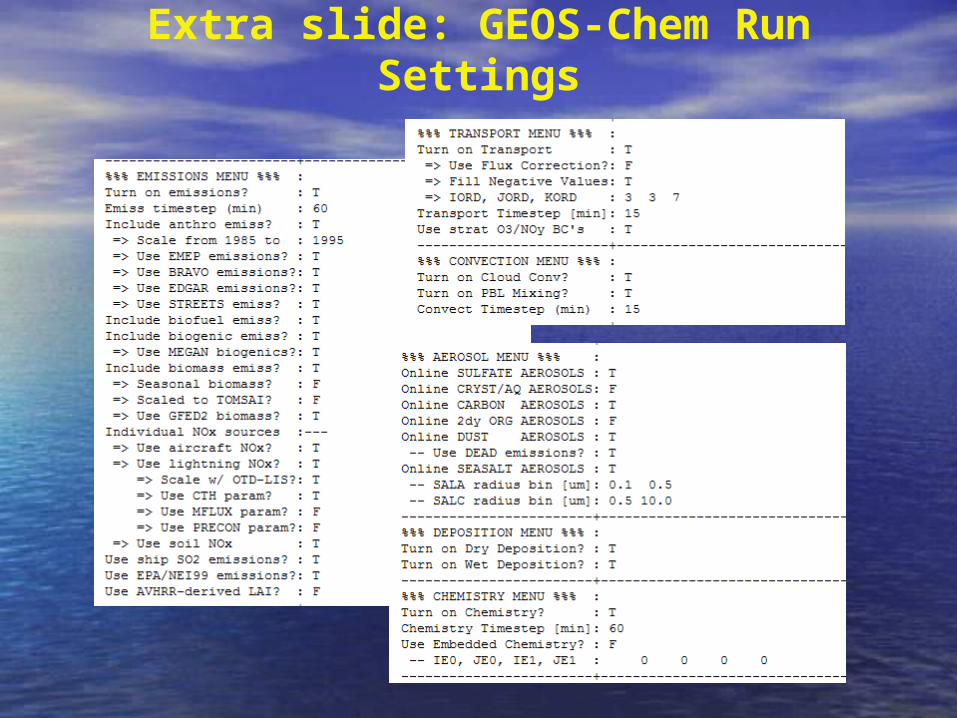
Extra slide: GEOS-Chem Run Settings
Recommended