This is a repository copy of Comparing the predictive ability of the Revised Minimum Dataset Mortality Risk Index (MMRI-R) with nurses' predictions of mortality among frail older people: a cohort study..
White Rose Research Online URL for this paper:https://eprints.whiterose.ac.uk/145503/
Version: Accepted Version
Article:
Cole, A., Arthur, A. and Seymour, J. orcid.org/0000-0002-9384-2551 (2019) Comparing thepredictive ability of the Revised Minimum Dataset Mortality Risk Index (MMRI-R) with nurses' predictions of mortality among frail older people: a cohort study. Age and Ageing, 48 (3). pp. 394-400. ISSN 0002-0729
https://doi.org/10.1093/ageing/afz011
This is a pre-copyedited, author-produced version of an article accepted for publication in Age and Ageing following peer review. The version of record Andy Cole, Antony Arthur, Jane Seymour, Comparing the predictive ability of the Revised Minimum Dataset Mortality Risk Index (MMRI-R) with nurses’ predictions of mortality among frail older people: a cohort study, Age and Ageing is available online at: https://doi.org/10.1093/ageing/afz011.
[email protected]://eprints.whiterose.ac.uk/
Reuse
Items deposited in White Rose Research Online are protected by copyright, with all rights reserved unless indicated otherwise. They may be downloaded and/or printed for private study, or other acts as permitted by national copyright laws. The publisher or other rights holders may allow further reproduction and re-use of the full text version. This is indicated by the licence information on the White Rose Research Online record for the item.
Takedown
If you consider content in White Rose Research Online to be in breach of UK law, please notify us by emailing [email protected] including the URL of the record and the reason for the withdrawal request.

For Review O
nlyComparing the predictive ability of the Revised Minimum
Dataset Mortality Risk Index (MMRI-R) with nurses’
predictions of mortality among frail older people: a cohort
study.
Journal: Age and Ageing
Manuscript ID AA-18-0654.R1
Manuscript Category: Research Paper
Keywords:End of life care, Older people, Community nurse, Mortality, Advance care
planning
Keypoints:
Identifying patients who are approaching the end of their lives can
facilitate advance care planning, Prognostication is challenging amongst
frail older patients with multiple progressive and fluctuating long-term
conditions, The MMRI-R is comparable to community nurses’ intuition at
identifying patients approaching end of life, The MMRI-R and nurses
predictions performed better in combination than alone, Case-
management nurses such as UK community matrons should be trusted
to initiate the early implementation of anticipatory care

For Review O
nly
1
Comparing the predictive ability of the Revised Minimum
Dataset Mortality Risk Index (MMRI-R) with nurses’ predictions
of mortality among frail older people: a cohort study.
Abstract
Objectives
To establish the accuracy of community nurses’ predictions of mortality among older people with
multiple long-term conditions, to compare these with a mortality rating index and to assess the
incremental value of nurses’ predictions to the prognostic tool.
Design
A prospective cohort study using questionnaires to gather clinical information about patients case
managed by community nurses. Nurses estimated likelihood of mortality for each patient on a 5-
point rating scale. The dataset was randomly split into derivation and validation cohorts. Cox
proportional hazard models were used to estimate risk equations for the MMRI-R and nurses’
predictions of mortality individually and combined. Measures of discrimination and calibration were
calculated and compared within the validation cohort.
Setting
Two NHS Trusts in England providing case-management services by nurses for frail older people with
multiple long-term conditions.
Participants
867 patients on the caseload of 35 case-management nurses. 433 and 434 patients were assigned to
the derivation and validation cohorts respectively. Patients were followed up for 12 months.
Results
249 patients died (28.72%). In the validation cohort MMRI-R demonstrated good discrimination
(Harrell’s c-index 0.71) and nurses’ predictions similar discrimination (Harrell’s c-index 0.70). There
was no evidence of superiority in performance of either method individually (p=0.83) but the MMRI-
R and nurses’ predictions together were superior to nurses’ predictions alone (p=0.01).
Conclusions
Patient mortality is associated with higher MMRI-R scores and nurses’ predictions of 12-month
mortality. The MMRI-R enhanced nurses’ predictions and may improve nurses’ confidence in initiating
anticipatory care interventions.
Page 1 of 30
1
2
3
4
5
6
7
8
9
10
11
12
13
14
15
16
17
18
19
20
21
22
23
24
25
26
27
28
29
30
31
32
33
34
35
36
37
38
39
40
41
42
43
44
45
46
47
48
49
50
51
52
53
54
55
56
57
58
59
60
For Review O
nly
2
Introduction
The identification of people requiring palliative and supportive care underpins national and
international strategies to improve the quality of end of life care [1-5]. Identifying patients who are
approaching the end of their lives can facilitate advance care planning to align future care to patients’
wishes and preferences [6]. Identifying patients in need of supportive or palliative care is challenging,
particularly for frail older patients with multiple progressive and fluctuating long-term conditions due
to the complex interplay between pathology, clinical findings, therapeutic response, co-morbidities,
psychosocial factors, and rate of decline [7]. The evidence suggests that doctors tend to overestimate
survival and feel inadequately prepared to make predictions [8].
A number of clinician-administered identification tools, such as the Prognostic Indicator Guide [9],
have been developed to support primary care teams to recognise patients who may require palliative
care but few have been validated in primary care settings [10]. The Palliative Prognostic Score [11]
includes clinicians’ prediction of survival as a significant predictor of mortality, although the validity of
this has recently been challenged [12]. A small exploratory randomised controlled trial of general
practitioners in Australia demonstrated that the use of the Supportive and Palliative Care Indicators
Tool as a screening tool was better at predicting actual death than unguided clinical intuition but
incurred a higher false positive rate [13]. Most mortality risk indices for community dwelling older
adults have limited clinical value as they have been developed on samples with low mortality rates or
do not assess short-term mortality [14].
Less attention has been afforded to the role of nurses in identifying patients in need of supportive and
palliative care [15, 16] despite the increasing number of primary care nurses who case manage older
adults with frailty at high risk of clinical deterioration, hospitalisation and death. In the UK, case-
management nurses, known as community matrons, were introduced in 2005 to coordinate and
manage the care of older adults in their own homes or care homes [17, 18]. Supporting patient choice
around end of life care through anticipatory care planning is considered a key responsibility of
community matrons [18] but it is unclear whether this role has been adopted in practice.
With an increasing emphasis on identifying older people with advanced frailty for whom a supportive
or palliative care approach to case management may be beneficial we assessed the ability of
community nurses to recognise patients who may be approaching the end of life and compared this
to an existing mortality risk index. The Minimum Dataset Mortality Index (MMRI) [19] was developed
using routinely collected data from a large sample of nursing home residents in the United States of
whom 23% died within six months. The index encompasses demographic data, comorbidities,
symptoms, cognition and functional status. It demonstrated very good discrimination and calibration
across a wide range of mortality risk levels and has subsequently been simplified [20] and validated
within the UK [21] without significant reduction in performance.
Methods
Objectives, study design and source of data
A prospective cohort study was undertaken to establish the accuracy of community nurses’
predictions of mortality among older people with multiple long-term conditions, to compare these
with the MMRI-R and to assess the incremental value of nurses’ predictions to the MMRI-R. All
Page 2 of 30
1
2
3
4
5
6
7
8
9
10
11
12
13
14
15
16
17
18
19
20
21
22
23
24
25
26
27
28
29
30
31
32
33
34
35
36
37
38
39
40
41
42
43
44
45
46
47
48
49
50
51
52
53
54
55
56
57
58
59
60
For Review O
nly
3
community nurses employed by two neighbouring NHS Trusts in the East Midlands, who provided a
case-management service to older people living in the community, were invited to participate.
Predictor variables
The nurses completed an electronic questionnaire for each patient on their caseload to provide
demographic information (age and gender) and clinical information relating to comorbidities (cancer,
renal failure and heart failure), symptoms (shortness of breath, dehydration, loss of appetite and
cognition), functional dependency and recent admission to a care home. Nurses were also asked to
estimate the likelihood of mortality within 12 months for each patient using a 5-point Likert scale
(highly unlikely, unlikely, unsure, likely, highly likely). Data was pseudonymised in a secure NHS data
warehouse prior to analysis.
Outcome:
The outcome of the study was all-cause mortality determined through cross-reference with a national
database of deaths derived from information contained within the electronic patient record. Each
patient was followed up for a minimum of 12 months.
Sample size:
In the two participating NHS Trusts, 45 case-management nurses had an estimated total caseload of
1400 patients. We estimated non-response from 20% of nurses and that 15% of patients would die
over a 12-month period based on retrospective analysis of caseload data. The dataset was stratified
according to 12-month survival and randomly split into derivation and validation cohorts of equal size.
Model derivation:
MMRI-R scores were calculated from the published bedside scoring tool (Supplementary table 1
available at Age and Ageing online) [21]. The maximum score possible was 85 with increasing scores
indicating greater mortality risk. Nurses’ predictions of death were rated on a five-point scale with
five indicating that the patient was highly likely to be in the last year of life. Cox proportional hazard
models were used to define three separate risk equations. Coefficients were estimated for the MMRI-
R and the nurses’ predictions of survival separately and then in combination. Risk groups were created
to facilitate the comparison of observed survival probabilities. Cut-points were 25th and 75th centile of
each prognostic index in the derivation cohort indicating low, intermediate and high mortality risk.
Kaplan-Meier survival estimates were calculated across risk groups for each model.
Model validation:
Discrimination, the ability to separate those at high risk from those at low risk, was assessed using
two measures. Royston-Sauerbrei R2D is based on prognostic separation and is a measure of explained
variation on the log relative hazard scale [22]. Harrell’s c-index measures concordance by quantifying
the rank correlation between predicted risk and observed survival times [23]. Values of 0.5 indicate
no predictive discrimination whilst a value of 1 indicates perfect separation of patients with different
outcomes [24]. Differences in Harrell’s c-indices were calculated in order to compare predictive
performance of each risk equation [25].
Calibration, or how accurately estimated survival reflected actual survival, was assessed according to
methods outlined by Royston [26]. The predicted mean survival curves were compared with the
Page 3 of 30
1
2
3
4
5
6
7
8
9
10
11
12
13
14
15
16
17
18
19
20
21
22
23
24
25
26
27
28
29
30
31
32
33
34
35
36
37
38
39
40
41
42
43
44
45
46
47
48
49
50
51
52
53
54
55
56
57
58
59
60

For Review O
nly
4
Kaplan-Meier survival curves for each risk group within the validation dataset. Stata Version 14.2 was
used for all analyses.
Ethical Approval and Funding
Ethical approval was granted by Nottingham 2 Medical Research Ethics Committee (12/EM/0322
09/11/2012). Site specific approval and research and development approval was obtained from both
participating NHS Trusts (DHRD/2012/071). This study was supported by a Learning Beyond
Registration Doctoral Scholarship awarded to AC by the East Midlands Professional Deanery and was
sponsored by the University of Nottingham.
Results
Participants
A total of 45 nurses case-managing 1330 predominantly older patients with multiple long-term
conditions were invited to complete electronic questionnaires for each of their patients. Of these, 10
nurses declined or were unable to participate leaving 35 community case-management nurses (77%)
submitting individual questionnaires for a total of 883 patients (mean 25 patients, SD 14.4). Eight
questionnaires were duplicated and were eliminated from analysis. A further eight patients with
incomplete identification details were lost to follow-up and were also excluded from analysis. A total
of 867 patients were randomly assigned to the derivation cohort (n=433) or validation cohort (n=434)
(Supplementary figure 1 available at Age and Ageing online). Questionnaires were submitted between
July and September 2013. Survival was determined on 1st October 2014, one year after receipt of the
last questionnaire.
The characteristics of the patients assigned to the derivation and validation cohorts are reported in
Table 1. MMRI-R scores ranged from 2 to 62 (mean 22.5, SD 10.6). Characteristics of the matrons are
reported in Supplementary Table 2 available at Age and Ageing online). Almost two thirds of the
matrons had worked previously as a district nurse.
Outcomes
A total of 249 deaths were recorded giving an overall mortality of 29%. Among those who died deaths
occurred between 1 and 435 days. The minimum follow-up time for survivors was 366 days and
maximum follow-up time was 454 days.
Page 4 of 30
1
2
3
4
5
6
7
8
9
10
11
12
13
14
15
16
17
18
19
20
21
22
23
24
25
26
27
28
29
30
31
32
33
34
35
36
37
38
39
40
41
42
43
44
45
46
47
48
49
50
51
52
53
54
55
56
57
58
59
60

For Review O
nly
5
Table 1. Demographic and health characteristics of derivation and validation cohorts
CharacteristicsDerivation Cohort
n (%)
Validation Cohort
n (%)
Total n=867
n (%)
Male Gender 190 (43.9) 178 (41.0) 368 (42.4)
Comorbid conditions
Heart Failure 140 (32.3) 154 (35.5) 294 (33.9)
Cancer 37 (8.9) 32 (7.4) 69 (8,0)
Renal Failure 118 (27.3) 131 (30.2) 249 (28.7)
Cognitive Impairment 59 (13.6) 63 (14.5) 122 (14.1)
Symptoms
Weight loss 89 (20.5) 78 (18.0) 167 (19.3)
Dehydrated 23 (5.3) 23 (5.3) 46 (5.3)
Loss of appetite 143 (33.0) 128 (29.5) 271 (31.3)
Shortness of breath 270 (62.4) 273 (62.9) 543 (62.6)
Care Home Admission in last
6 months19 (4.4) 23 (5.3) 42 (4.8)
ADL Dependencies
Mean ADL score (SD) 4.1 (5.1) 3.8 (5.0) 4.0 (5.0)
Mean Age (SD) 78.9 (11.5) 79.0 (11.0) 79.0 (11.5)
MMRI-R Score (SD) 22.78 (10.9) 22.30 (10.3) 22.5 (10.6)
Likelihood of Death (%)
Highly Unlikely 21 (4.9) 23 (5.3) 44 (5.0)
Unlikely 148 (34.2) 152 (35.0) 300 (34.6)
Unsure 121 (27.9) 125 (28.8) 246 (28.4)
Likely 112 (25.9) 101 (23.3) 213 (24.6)
Highly Likely 31 (7.2) 33 (7.6) 64 (7.4)
Died 124 (28.6) 125 (28.8) 249 (28.7)
Model Development and Specification
In the derivation cohort the MMRI-R and nurses’ predictions were associated with mortality both
individually and in combination (Table 2). A global test of the proportional hazards assumption in the
derivation dataset using scaled Schoenfeld residuals demonstrated no apparent violation.
Kaplan–Meier curves (Supplementary Figure 2 available at Age and Ageing online) demonstrated that
low, intermediate and high risk groups were well separated across all equations with greater mortality
observed with increasing risk score, suggesting good discrimination. Depending on which equation
was used, between 42% and 52% of patients in the high risk group were alive at follow-up with
between 79% and 85% survivors in the low risk group.
Model Validation
Discrimination
Harrell’s c-index and Royston and Sauerbrei’s R2D (Table 2) indicated good discrimination for the
MMRI-R and for nurses’ predictions. Calculation of the differences in the Harrell’s c-index between
equations, indicated that MMRI-R was not significantly different from the nurses’ predictions alone
(p=0.83). The addition of MMRI-R significantly improved nurses predictions alone (p=0.01), as did the
addition of nurses’ predictions to MMRI-R alone (p=0.03).
Page 5 of 30
1
2
3
4
5
6
7
8
9
10
11
12
13
14
15
16
17
18
19
20
21
22
23
24
25
26
27
28
29
30
31
32
33
34
35
36
37
38
39
40
41
42
43
44
45
46
47
48
49
50
51
52
53
54
55
56
57
58
59
60

For Review O
nly
6
Calibration
The predicted mean survival curves were compared with the observed Kaplan-Meier survival curves
in each risk group for the validation set (Figure 1). The curves indicated that actual survival was worse
than predicted in the high risk group particularly within the combined MMRI-R and Nurses’ Predictions
equation suggesting a degree of miscalibration. The Kaplan-Meier survival estimates indicated that
risk groups are well separated across each equation within the validation set.
Discussion
Community nurses’ predictions are comparable to the MMRI-R at identifying older people who are at
low, intermediate and high risk of death. The findings of our analysis indicate that combining nurses’
predictions with the MMRI-R improved the accuracy of each model at identifying older people at risk
of death within 12 months. A previous study benchmarked the clinical predictions of specialist
Table 2. Hazard Ratios and measures of discrimination
Derivation Cohort Validation Cohort
Royston & Sauerbrei’s R2D (SE)
Model
Hazard
Ratio
95% CI p-value Harrell’s
C-index (SE) R2 D
MMRI-R 1.06 1.04-1.08 <0.001 0.706 (0.022) 0.271 (0.049) 1.248 (0.154)
Nurses’ Predictions 1.81 1.52-2.16 <0.001 0.701 (0.023) 0.300 (0.051) 1.339 (0.163)
1.04 1.02-1.06 <0.001MMRI-R &
Nurses’ Predictions 1.43 1.16-1.76 <0.0010.734 (0.022) 0.355 (0.049) 1.519 (0.161)
HRs refer to a 1 point increase in each scores: MMRI -2-85; Nurses’ Predictions 0-4 (higher scores indicate worsening prognosis)
Figure 1. Predicted and observed risk of mortality in the validation dataset
0.00
0.25
0.50
0.75
1.00
0 90 180 270 360 450Analysis Time in Days
MMRI-R
0.00
0.25
0.50
0.75
1.00
0 90 180 270 360 450Analysis Time in Days
Nurses' Predictions
0.00
0.25
0.50
0.75
1.00
0 90 180 270 360 450Analysis Time in Days
MMRI-R & Nurses' Predictions
Page 6 of 30
1
2
3
4
5
6
7
8
9
10
11
12
13
14
15
16
17
18
19
20
21
22
23
24
25
26
27
28
29
30
31
32
33
34
35
36
37
38
39
40
41
42
43
44
45
46
47
48
49
50
51
52
53
54
55
56
57
58
59
60
For Review O
nly
7
palliative care doctors and nurses within a cohort of 1018 patients with advanced cancer against two
objective prognostic models [27]. In that study, specialist nurses’ predictions demonstrated very good
discrimination comparable to both objective models. In our study, the less accurate discrimination of
community case-management nurses may be attributable to their unique role within a generalist
setting, caring for patients with multiple long-term conditions and less predictable disease trajectories
than patients with advanced cancer. In practice, nurses may use subjective estimations of the need to
adjust patients’ goals of care to initiate discussions about advance planning and end of life care
preferences. Our findings suggest that nurses’ predictions of mortality present a potentially useful
screening tool for assessment of the timeliness of end of life care planning.
We have demonstrated that the MMRI-R retains good performance within this heterogenous cohort
of patients. The c-index indicated slightly poorer performance than the original study which reported
very good discrimination in predicting six-month mortality among long-term care home residents [20].
Differences in discrimination measures are likely attributable to differences in baseline characteristics
of the populations. The MMRI-R was developed within a population of care home residents in the
United States, whilst our patient sample were predominantly living in their own homes. Additionally
over half of the original sample were aged 85 years or over, compared with one third aged over 85 in
this UK sample. However, despite these differences, mortality in each study is similar which suggests
a comparable burden of illness and mortality risk.
The MMRI-R may improve community case-management nurses’ understanding of the determinants
of the clinical course and outcomes of their patients [28]. However, mortality rating indices only
provide a snapshot assessment of a patient’s mortality risk and do not take into account the rapidity
of a patient’s deterioration or any potential for reversibility of signs and symptoms. The MMRI-R
should not be used to replace clinical judgement or person-centred communication as a trigger to
initiate advance care planning, rather as an adjunct to clinical decision making by providing an
objective estimate of risk to be considered alongside other relevant clinical information.
We found that community case-management nurses recognise patients who are approaching the end
of their lives with reasonably good accuracy, yet the extent to which their patients engaged with
advance care planning is unknown. Future studies should explore the impact of community case-
management nurses on meeting the desired goals and expectations of patients and the cost of
healthcare at the end of life through advance care planning. Since the data for this study was collected
a sustained increase in the aged population continues to place mounting pressure on primary care
resources. Discussing patients’ preferences for clinical care and treatment is therefore assuming a
greater prominence in order to prevent unnecessary hospitalisation at the end of life and to support
people to die in their preferred place of care. The use of a mortality risk index as an adjunct to clinical
decision making may help nurses to prioritise patients for whom advance care planning may be
appropriate. Mortality risk indices do not appear to have been adopted widely in practice and further
research is needed to explore their potential benefits and limitations to identify patients who may
benefit from advance care planning.
Application of the Prediction Models
The following example illustrates how the MMRI-R and nurses’ predictions assesses survival. An 83
year old man with heart failure, chronic kidney disease stage 4 and a creatinine greater than 3mg/dL
has shortness of breath on exertion and poor mobility. He is dependent on carers who visit his home
three times daily to assist with washing and meal preparation. His appetite has recently declined and
Page 7 of 30
1
2
3
4
5
6
7
8
9
10
11
12
13
14
15
16
17
18
19
20
21
22
23
24
25
26
27
28
29
30
31
32
33
34
35
36
37
38
39
40
41
42
43
44
45
46
47
48
49
50
51
52
53
54
55
56
57
58
59
60

For Review O
nly
8
his community case-management nurse thinks that he is likely to be in his last year of life. His MMRI-
R is calculated as 39 (Supplementary table 1 available at Age and Ageing online). Both MMRI-R and
nurses’ predictions place him in the high risk group and estimates that he has between a 48% and 57%
chance of survival at 12 months.
Limitations
In order to assess the additive value of nurses’ predictions to the MMRI-R a cross-validation design
was adopted in which the data was partitioned into derivation and validation sets. This approach
resulted in two smaller samples and may contribute to an over-optimistic assessment of model
performance [29].
Conclusion
Community case-management nurses can identify patients who are likely to die within 12 months with
reasonable accuracy. The MMRI-R demonstrated comparable discrimination in identifying those at
high or low risk of mortality and the addition of nurses’ predictions improved its performance. Nurses’
estimates of survival may trigger an objective assessment of mortality risk among those patients
considered to be most likely to die within twelve months. An objective assessment, using the MMRI-
R, a simple assessment tool that can be administered in the patient’s own home, has the potential to
improve nurses’ confidence in their clinical decision making and encourage community case-
management nurses to initiate timely conversations with frail older people and those close to them
to determine end of life care preferences.
Conflicts of Interests
All authors declare they have nothing to disclose.
Key PointsIdentifying patients who are approaching the end of their lives can facilitate advance care planning and align future care to patients’ preferences.
Prognostication is challenging among frail older patients with multiple progressive and fluctuating long-term conditions.
The MMRI-R is comparable to community nurses’ intuition at identifying patients approaching end of life.
The MMRI-R and nurses predictions performed better in combination than alone.
Case-management nurses such as UK community matrons should be trusted to initiate the early implementation of anticipatory care interventions.
Key Words:
Older people, end of life care, community nurse, mortality, advance care planning
Page 8 of 30
1
2
3
4
5
6
7
8
9
10
11
12
13
14
15
16
17
18
19
20
21
22
23
24
25
26
27
28
29
30
31
32
33
34
35
36
37
38
39
40
41
42
43
44
45
46
47
48
49
50
51
52
53
54
55
56
57
58
59
60

For Review O
nly
9
References
[1] Department of Health, One Year On: The Government Response to the Review of Choice in End
of Life Care, gov.uk, London, 2017.
[2] National Palliative and End of Life Care Partnership, Ambitions for Palliative and End of Life Care:
A National Framework for Local Action 2015-2020, Online, 2015.
[3] Department of Health, End of Life Care Strategy: Promoting High Quality Care for All Adults at the
End of Life, Department of Health, London, 2008.
[4] K. Thomas, H. Corner, M. Stobbart-Rowlands, National primary care audit in end of life care and
ACP and recommendations for improvement, British Medical Journal Supportive and Palliative Care
2(2) (2012) 192-192.
[5] World Health Assembly, Strengthening palliative care as a component of comprehensive care
throughout the life course, Sixty-seventh World Health Assembly, 2014, p. Agenda Item 15.5.
[6] K. Thomas, B. Lobo, K. Detering, Advance Care Planning in End of Life Care, 2nd ed., Oxford
University Press, Oxford, 2017.
[7] K. Boyd, S.A. Murray, Recognising and managing key transitions in end of life care, British Medical
Journal 341 (2010) c4863.
[8] N.A. Christakis, T.J. Iwashyna, Attitude and self-reported practice regarding prognostication in a
national sample of internists, Archives of Internal Medicine 158(21) (1998) 2389-2395.
[9] National Gold Standards Framework Centre, Prognostic Indicator Guidance, 2008.
http://www.goldstandardsframework.org.uk/Resources/Gold%20Standards%20Framework/PDF%20
Documents/PrognosticIndicatorGuidancePaper.pdf. (Accessed 23/11/11 2011).
[10] E.A. Maas, S.A. Murray, Y. Engels, C. Campbell, What tools are available to identify patients with
palliative care needs in primary care: a systematic literature review and survey of European practice,
British Medical Journal Supportive and Palliative Care 3(4) (2013) 444-451.
[11] M. Maltoni, M. Pirovano, E. Scarpi et al, Prediction of survival of patients terminally ill with
cancer: Results of an Italan prospective multicentric study, Cancer 75(10) (1995) 2613-2622
[12] D. Hui, M. Park, D. Liu et al, Clinician prediction of survival versus the Palliative Prognostic Score:
Which approach is more accurate? European Journal of Cancer 64 (2016) 89-95
[13] G.K. Mitchell, H.E. Senior, J.J. Rhee et al, Using intuition or a formal palliative care needs
assessment screening process in general practice to predict death within 12 months: A randomised
controlled trial, Palliative Medicine 32(2) (2017) 384-394.
[14] L. Yourman, S.J. Lee, M.A. Schonberg, E.W. Widera, A.K. Smith, Prognostic indices for older
adults: a systematic review, Journal of the American Medical Association 307(2) (2012) 182-192
[15] D. Schulman-Green, R. McCorkle, E. Cherlin, R. Johnson-Hurzeler, E. Bradley, Nurses’
communications of prognosis and implications for hospice referral: A study of nurses caring for
terminally ill hospitalised patients, American Journal of Critical Care 14(1) (2005) 64-70.
Page 9 of 30
1
2
3
4
5
6
7
8
9
10
11
12
13
14
15
16
17
18
19
20
21
22
23
24
25
26
27
28
29
30
31
32
33
34
35
36
37
38
39
40
41
42
43
44
45
46
47
48
49
50
51
52
53
54
55
56
57
58
59
60

For Review O
nly
10
[16] D. Porock, D. Parker-Oliver, Recognizing dying by staff in long-term care, Journal of Hospice and
Palliative Nursing 9(5) (2007) 270-278.
[17] Department of Health, Supporting People with Long-Term Conditions: Liberating the Talent of
Nurses Who Care for People with Long-Term Conditions, Department of Health, London, 2005.
[18] NHS Modernisation Agency and Skills for Health, Case Management Competencies Framework,
Department of Health, London, 2005.
[19] D. Porock, D. Parker-Oliver, S. Zweig et al, Predicting death in the nursing home: development
and validation of the 6-month Minimum Data Set mortality risk index, Journals of Gerontology Series
A-Biological Sciences & Medical Sciences 60(4) (2005) 491-8.
[20] D. Porock, D. Parker-Oliver, G. Petroski, M. Rantz, The MDS Mortality Risk Index: the evolution
of a method for predicting 6-month mortality in nursing home residents, BMC Research Notes 3(200)
(2010).
[21] Dutta, R., Hooper, J. & Dutta, D. 2015. Use of the MMRI-R prognostic tool for older patients
discharged to nursing homes from hospital: a prospective cohort study. Age and Ageing, 44, 673-
676.
[22] P. Royston, W. Sauerbrei, A new measure of prognostic separation in survival data, Statistics in
Medicine 23(5) (2004) 723-48.
[23] M.S. Rahman, G. Ambler, B. Choodari-Oskooei, R.Z. Omar, Review and evaluation of
performance measures for survival prediction models in external validation settings, BMC Medical
Research Methodology 17(1) (2017) 60.
[24] F.E. Harrell, K.L. Lee, D.B. Mark, Multivariable prognostic models: issues in developing models,
evaluating assumptions and adequacy, and measuring and reducing errors, Statistics in Medicine 15
(1996) 361-387.
[25] R.B. Newson, Comparing the predictive powers of survival models using Harrell’s C or Somers’ D,
The Stata Journal 10(3) (2010) 339–358.
[26] P. Royston, Tools for checking calibration of a Cox model in external validation: Prediction of
population-averaged survival curves based on risk groups, The Stata Journal 15(1) (2015) 275–291.
[27] B. Gwilliam, V. Keeley, C. Todd et al, Development of Prognosis in Palliative care Study (PiPS)
predictor models to improve prognostication in advanced cancer: prospective cohort study, British
Medical Journal 343(d4920) (2011) 1-15.
[28] K.G. Moons, P. Royston, Y Vergouwe, D.E. Grobbee, D.G. Altman, Prognosis and prognostic
research: what, why, and how? British Medical Journal, 338:b375 (2009)
[29] J. Subramanian, R. Simon, Overfitting in prediction models - is it a problem only in high
dimensions?, Contemporary Clinical Trials 36(2) (2013) 636-41.
Page 10 of 30
1
2
3
4
5
6
7
8
9
10
11
12
13
14
15
16
17
18
19
20
21
22
23
24
25
26
27
28
29
30
31
32
33
34
35
36
37
38
39
40
41
42
43
44
45
46
47
48
49
50
51
52
53
54
55
56
57
58
59
60

For Review O
nly
1
Comparing the predictive ability of the Revised Minimum
Dataset Mortality Risk Index (MMRI-R) with nurses’ predictions
of mortality among frail older people: a cohort study.
Abstract
Objectives
To establish the accuracy of community nurses’ predictions of mortality among older people with
multiple long-term conditions, to compare these with a mortality rating index and to assess the
incremental value of nurses’ predictions to the prognostic tool.
Design
A prospective cohort study using questionnaires to gather clinical information about patients case
managed by community nurses. Nurses estimated likelihood of mortality for each patient on a 5-
point rating scale. The dataset was randomly split into derivation and validation cohorts. Cox
proportional hazard models were used to estimate risk equations for the MMRI-R and nurses’
predictions of mortality individually and combined. Measures of discrimination and calibration were
calculated and compared within the validation cohort.
Setting
Two NHS Trusts in England providing case-management services by nurses for frail older people with
multiple long-term conditions.
Participants
867 patients on the caseload of 35 case-management nurses. 433 and 434 patients were assigned to
the derivation and validation cohorts respectively. Patients were followed up for 12 months.
Results
249 patients died (28.72%). In the validation cohort MMRI-R demonstrated good discrimination
(Harrell’s c-index 0.71) and nurses’ predictions similar discrimination (Harrell’s c-index 0.70). There
was no evidence of superiority in performance of either method individually (p=0.83) but the MMRI-
R and nurses’ predictions together were superior to nurses’ predictions alone (p=0.01). The addition
of nurses’ predictions of death demonstrated significant improvement in the performance of the
MMRI-R (Harrell’s c-index 0.73, p=0.03).
Conclusions
Patient mortality is associated with higher MMRI-R scores and nurses’ predictions of 12-month
mortality. The MMRI-R enhanced nurses’ predictions and may improve nurses’ confidence in decision-
making. Minimal differences in performance suggest that nurses’ judgement can be trusted to
initiating anticipatory care interventions whilst avoiding an over-reliance on objective measures.
Page 11 of 30
1
2
3
4
5
6
7
8
9
10
11
12
13
14
15
16
17
18
19
20
21
22
23
24
25
26
27
28
29
30
31
32
33
34
35
36
37
38
39
40
41
42
43
44
45
46
47
48
49
50
51
52
53
54
55
56
57
58
59
60

For Review O
nly
2
Page 12 of 30
1
2
3
4
5
6
7
8
9
10
11
12
13
14
15
16
17
18
19
20
21
22
23
24
25
26
27
28
29
30
31
32
33
34
35
36
37
38
39
40
41
42
43
44
45
46
47
48
49
50
51
52
53
54
55
56
57
58
59
60

For Review O
nly
3
Introduction
The identification of people requiring palliative and supportive care underpins national and
international strategies to improve the quality of end of life care [1-5]. Identifying patients who are
approaching the end of their lives can facilitate advance care planning to align future care to patients’
wishes and preferences [6]. Identifying patients in need of supportive or palliative care is challenging,
particularly for frail older patients with multiple progressive and fluctuating long-term conditions due
to the complex interplay between pathology, clinical findings, therapeutic response, co-morbidities,
psychosocial factors, and rate of decline [7]. The evidence suggests that doctors tend to overestimate
survival and feel inadequately prepared to make predictions [8].
A number of clinician-administered identification tools, such as the Prognostic Indicator Guide [9],
have been developed to support primary care teams to recognise patients who may require palliative
care but few have been validated in primary care settings [10]. The Palliative Prognostic Score [11]
includes clinicians’ prediction of survival as a significant predictor of mortality, although the validity of
this has recently been challenged [12]. A small exploratory randomised controlled trial of general
practitioners in Australia demonstrated that the use of the Supportive and Palliative Care Indicators
Tool as a screening tool was better at predicting actual death than unguided clinical intuition but
incurred a higher false positive rate [13]. Most mortality risk indices for community dwelling older
adults have limited clinical value as they have been developed on samples with low mortality rates or
do not assess short-term mortality [14]are often cumbersome and have not been widely adopted in
clinical practice. The Minimum Dataset Mortality Index (MMRI) [10] was developed and validated
using routinely collected data from a large sample of nursing home residents in the United States. This
bedside prognostic tool has subsequently been revised and simplified with no significant reduction in
performance [11].
Few studies have compared prognostic tools with clinicians’ predictions of survival [12]. Studies to
date have primarily focussed on the prognostic skills of medical staff who tend to overestimate
survival and feel inadequately prepared to make predictions [13]. A small exploratory randomised
controlled trial of general practitioners in Australia demonstrated that the use of the Supportive and
Palliative Care Indicators Tool as a screening tool was better at predicting actual death than unguided
clinical intuition but incurred a higher false positive rate [14]. Less attention has been afforded to the
role of nurses in identifying patients in need of supportive and palliative care [15, 16] despite the
increasing number of primary care nurses who case manage older adults with frailty at high risk of
clinical deterioration, hospitalisation and death. In the UK, case-management nurses, known as
community matrons, were introduced in 2005 to coordinate and manage the care of older adults in
their own homes or care homes [17, 18]. Supporting patient choice around end of life care through
anticipatory care planning is considered a key responsibility of community matrons [18] but it is
unclear whether this role has been adopted in practice.
With an increasing emphasis on identifying older people with advanced frailty for whom a supportive
or palliative care approach to case management may be beneficial we assessed the ability of
community nurses to recognise patients who may be approaching the end of life and compared this
to an existing mortality risk index. The Minimum Dataset Mortality Index (MMRI) [19] was developed
using routinely collected data from a large sample of nursing home residents in the United States of
whom 23% died within six months. The index encompasses demographic data, comorbidities,
Page 13 of 30
1
2
3
4
5
6
7
8
9
10
11
12
13
14
15
16
17
18
19
20
21
22
23
24
25
26
27
28
29
30
31
32
33
34
35
36
37
38
39
40
41
42
43
44
45
46
47
48
49
50
51
52
53
54
55
56
57
58
59
60
For Review O
nly
4
symptoms, cognition and functional status. It demonstrated very good discrimination and calibration
across a wide range of mortality risk levels and has subsequently been simplified [20] and validated
within the UK [21] without significant reduction in performance.
Methods
Objectives, study design and source of data
A prospective cohort study was undertaken to establish the accuracy of community nurses’
predictions of mortality among older people with multiple long-term conditions, to compare these
with the MMRI-R and to assess the incremental value of nurses’ predictions to the MMRI-R. compare
the performance of the MMRI-R and nurses’ judgement in predicting 12-month mortality among a
community-based sample of older people with multiple long-term conditions. All community nurses
employed by two neighbouring NHS Trusts in the East Midlands, who provided a case-management
service to older people living in the community, were invited to participate.
Predictor variables
The nurses completed an electronic questionnaire for each patient on their caseload to provide
demographic information (age and gender) and clinical information relating to comorbidities (cancer,
renal failure and heart failure), symptoms (shortness of breath, dehydration, loss of appetite and
cognition), functional dependency and recent admission to a care home. Nurses were also asked to
estimate the likelihood of mortality within 12 months for each patient using a 5-point Likert scale
(highly unlikely, unlikely, unsure, likely, highly likely). Data was pseudonymised in a secure NHS data
warehouse prior to analysis.
Outcome:
The outcome of the study was all-cause mortality determined through cross-reference with a national
database of deaths derived from information contained within the electronic patient record. Each
patient was followed up for a minimum of 12 months.
Sample size:
In the two participating NHS Trusts, 45 case-management nurses had an estimated total caseload of
1400 patients. We estimated non-response from 20% of nurses and that 15% of patients would die
over a 12-month period based on retrospective analysis of caseload data. The dataset was stratified
according to 12-month survival and randomly split into derivation and validation cohorts of equal size.
Based on retrospective analysis of nurses’ caseloads we estimated 15% of our patient sample would
die over a 12-month period. We calculated that a sample size of 800 was needed to provide a
minimum ratio of 10 events (deaths) based on the 12 predictor variables comprising the MMRI-R. The
dataset was stratified according to 12-month survival and randomly split into derivation and validation
cohorts of equal size.
Model derivation:
MMRI-R scores were calculated from the published bedside scoring tool (Supplementary table 1
available at Age and Ageing online) [21]. The maximum score possible was 85 with increasing scores
indicating greater mortality risk. Nurses’ predictions of death were rated on a five-point scale with
five indicating that the patient was highly likely to be in the last year of life. Cox proportional hazard
models were used to define three separate risk equations. Coefficients were estimated for the MMRI-
Page 14 of 30
1
2
3
4
5
6
7
8
9
10
11
12
13
14
15
16
17
18
19
20
21
22
23
24
25
26
27
28
29
30
31
32
33
34
35
36
37
38
39
40
41
42
43
44
45
46
47
48
49
50
51
52
53
54
55
56
57
58
59
60
For Review O
nly
5
R and the nurses’ predictions of survival separately and then in combination. Prognostic indices were
calculated from post estimation linear predictions from each fitted model and used to create rRisk
groups were created to facilitate the comparison of observed survival probabilities and predicted
survival. Cut-points were 25th and 75th centile of each prognostic index in the derivation cohort
indicating low, intermediate and high mortality risk. Kaplan-Meier survival estimates were calculated
across risk groups for each model.
Model validation:
Discrimination, the ability to separate those at high risk from those at low risk, was assessed using
two measures. Royston-Sauerbrei R2D is based on prognostic separation and is a measure of explained
variation on the log relative hazard scale [22]. Harrell’s c-index measures concordance by quantifying
the rank correlation between predicted risk and observed survival times [23]. Values of 0.5 indicate
no predictive discrimination whilst a value of 1 indicates perfect separation of patients with different
outcomes [24]. Differences in Harrell’s c-indices were calculated in order to compare predictive
performance of each risk equation [25].
Calibration, or how accurately estimated survival reflected actual survival, was assessed according to
methods outlined by Royston [26]. Fractional polynomial regression was used to approximate the log
baseline cumulative hazard function and estimation of the coefficients by ordinary least squares
regression in the derivation dataset. The predicted mean survival curves were compared with the
Kaplan-Meier survival curves for each risk group within the validation dataset. Stata Version 14.2 was
used for all analyses.
Ethical Approval and Funding
Ethical approval was granted by Nottingham 2 Medical Research Ethics Committee (12/EM/0322
09/11/2012). Site specific approval and research and development approval was obtained from both
participating NHS Trusts (DHRD/2012/071). This study was supported by a Learning Beyond
Registration Doctoral Scholarship awarded to AC by the East Midlands Professional Deanery and was
sponsored by the University of Nottingham.
Results
Participants
A total of 45 nurses case-managing 1330 predominantly older patients with multiple long-term
conditions were invited to complete electronic questionnaires for each of their patients. Of these, 10
nurses declined or were unable to participate leaving 35 community case-management nurses (77%)
submitting individual questionnaires for a total of 883 patients (mean 25 patients, SD 14.4). Eight
questionnaires were duplicated and were eliminated from analysis. A further eight patients with
incomplete identification details were lost to follow-up and were also excluded from analysis. A total
of 867 patients were randomly assigned to the derivation cohort (n=433) or validation cohort (n=434)
(Supplementary figure 1 available at Age and Ageing online). Questionnaires were submitted between
July and September 2013. Survival was determined on 1st October 2014, one year after receipt of the
last questionnaire.
The characteristics of the patients assigned to the derivation and validation cohorts are reported in
Table 1. MMRI-R scores ranged from 2 to 62 (mean 22.5, SD 10.6). Characteristics of the matrons are
Page 15 of 30
1
2
3
4
5
6
7
8
9
10
11
12
13
14
15
16
17
18
19
20
21
22
23
24
25
26
27
28
29
30
31
32
33
34
35
36
37
38
39
40
41
42
43
44
45
46
47
48
49
50
51
52
53
54
55
56
57
58
59
60

For Review O
nly
6
reported in Supplementary Table 2 available at Age and Ageing online). Almost two thirds of the
matrons had worked previously as a district nurse.
Outcomes
A total of 249 deaths were recorded giving an overall mortality of 29%. Among those who died deaths
occurred between 1 and 435 days. The minimum follow-up time for survivors was 366 days and
maximum follow-up time was 454 days.
Table 1. Demographic and health characteristics of derivation and validation cohorts
CharacteristicsDerivation Cohort
n (%)
Validation Cohort
n (%)
Total n=867
n (%)
Male Gender 190 (43.9) 178 (41.0) 368 (42.4)
Comorbid conditions
Heart Failure 140 (32.3) 154 (35.5) 294 (33.9)
Cancer 37 (8.9) 32 (7.4) 69 (8,0)
Renal Failure 118 (27.3) 131 (30.2) 249 (28.7)
Cognitive Impairment 59 (13.6) 63 (14.5) 122 (14.1)
Symptoms
Weight loss 89 (20.5) 78 (18.0) 167 (19.3)
Dehydrated 23 (5.3) 23 (5.3) 46 (5.3)
Loss of appetite 143 (33.0) 128 (29.5) 271 (31.3)
Shortness of breath 270 (62.4) 273 (62.9) 543 (62.6)
Care Home Admission in last
6 months19 (4.4) 23 (5.3) 42 (4.8)
ADL Dependencies
Mean ADL score (SD) 4.1 (5.1) 3.8 (5.0) 4.0 (5.0)
Mean Age (SD) 78.9 (11.5) 79.0 (11.0) 79.0 (11.5)
MMRI-R Score (SD) 22.78 (10.9) 22.30 (10.3) 22.5 (10.6)
Likelihood of Death (%)
Highly Unlikely 21 (4.9) 23 (5.3) 44 (5.0)
Unlikely 148 (34.2) 152 (35.0) 300 (34.6)
Unsure 121 (27.9) 125 (28.8) 246 (28.4)
Likely 112 (25.9) 101 (23.3) 213 (24.6)
Highly Likely 31 (7.2) 33 (7.6) 64 (7.4)
Died 124 (28.6) 125 (28.8) 249 (28.7)
Model Development and Specification
In the derivation cohort the MMRI-R and nurses’ predictions were associated with mortality both
individually and in combination (Table 2). A global test of the proportional hazards assumption in the
derivation dataset using scaled Schoenfeld residuals demonstrated no apparent violation.
Kaplan–Meier curves (Supplementary Figure 2 available at Age and Ageing online) demonstrated that
low, intermediate and high risk groups were well separated across all equations with greater mortality
observed with increasing risk score, suggesting good discrimination. Depending on which equation
was used, between 42% and 52% of patients in the high risk group were alive at follow-up with
between 79% and 85% survivors in the low risk group.
Page 16 of 30
1
2
3
4
5
6
7
8
9
10
11
12
13
14
15
16
17
18
19
20
21
22
23
24
25
26
27
28
29
30
31
32
33
34
35
36
37
38
39
40
41
42
43
44
45
46
47
48
49
50
51
52
53
54
55
56
57
58
59
60

For Review O
nly
7
Model Validation
Discrimination
Harrell’s c-index and Royston and Sauerbrei’s R2D (Table 2) indicated good discrimination for the
MMRI-R and for nurses’ predictions. The addition of nurses’ predictions conferred a small but
significant improvement in discrimination of the MMRI-R. Calculation of the differences in the
Harrell’s c-index between equations, indicated that MMRI-R was not significantly different from the
nurses’ predictions alone (p=0.83). The addition of MMRI-R significantly improved nurses predictions
alone (p=0.01), as did the addition of nurses’ predictions to MMRI-R alone (p=0.03).
Calibration
The predicted mean survival curves were compared with the observed Kaplan-Meier survival curves
in each risk group for the validation set (Figure 1). The curves indicated that actual survival was worse
than predicted in the high risk group particularly within the combined MMRI-R and Nurses’ Predictions
equation suggesting a degree of miscalibration. The Kaplan-Meier survival estimates indicated that
risk groups are well separated across each equation within the validation set.
Table 2. Hazard Ratios and measures of discrimination
Derivation Cohort Validation Cohort
Royston & Sauerbrei’s R2D (SE)
Model
Hazard
Ratio
95% CI p-value Harrell’s
C-index (SE) R2 D
MMRI-R 1.06 1.04-1.08 <0.001 0.706 (0.022) 0.271 (0.049) 1.248 (0.154)
Nurses’ Predictions 1.81 1.52-2.16 <0.001 0.701 (0.023) 0.300 (0.051) 1.339 (0.163)
1.04 1.02-1.06 <0.001MMRI-R &
Nurses’ Predictions 1.43 1.16-1.76 <0.0010.734 (0.022) 0.355 (0.049) 1.519 (0.161)
HRs refer to a 1 point increase in each scores: MMRI -2-85; Nurses’ Predictions 0-4 (higher scores indicate worsening prognosis)
Figure 1. Predicted and observed risk of mortality in the validation dataset
0.00
0.25
0.50
0.75
1.00
0 90 180 270 360 450Analysis Time in Days
MMRI-R
0.00
0.25
0.50
0.75
1.00
0 90 180 270 360 450Analysis Time in Days
Nurses' Predictions
0.00
0.25
0.50
0.75
1.00
0 90 180 270 360 450Analysis Time in Days
MMRI-R & Nurses' Predictions
Page 17 of 30
1
2
3
4
5
6
7
8
9
10
11
12
13
14
15
16
17
18
19
20
21
22
23
24
25
26
27
28
29
30
31
32
33
34
35
36
37
38
39
40
41
42
43
44
45
46
47
48
49
50
51
52
53
54
55
56
57
58
59
60

For Review O
nly
8
Discussion
Community nurses’ predictions are comparable to the MMRI-R at identifying older people who are at
low, intermediate and high risk of death. The findings of our analysis indicate that combining nurses’
predictions conferred little incremental predictive value to thewith the MMRI-R improved the
accuracy of each model atfor identifying older people at risk of deathwho are likely to die within 12
months and demonstrated moderately good discrimination of patients’ risk of death. A previous study
benchmarked the clinical predictions of specialist palliative care doctors and nurses within a cohort of
1018 patients with advanced cancer against two objective prognostic models [27]. In that study,
specialist nurses’ predictions demonstrated very good discrimination comparable to both objective
models. In our study, the less accurate discrimination of community case-management nurses may be
attributable to their unique role within a generalist setting, caring for patients with multiple long-term
conditions and less predictable disease trajectories than patients with advanced cancer. In practice,
nurses may use subjective estimations of the need to adjust patients’ goals of care to initiate
discussions about advance planning and end of life care preferences. Our findings suggest that nurses’
predictions of mortality present a potentially useful screening tool for assessment of the timeliness of
end of life care planning.
A recent study in England investigated the performance of an electronic frailty index (eFI) generated
from primary care data of 13,149 older people at predicting mortality [24]. The study demonstrated
modest discrimination (c-statistic 0.69) and concluded that the eFI is a strong predictor of mortality at
a population level but its usefulness for individuals may be limited. The eFI relies upon extraction of
electronic data from the patient record and may be compromised by inaccurate or absent coding of
clinical signs and symptoms such as weight loss and poor mobility. The c-statistic reported for the eFI
is comparable to that of our community case management nurses, suggesting that nurses’ clinical
assessments may be as good as a risk score generated by an index of frailty. Our MMRI-R [11] model
achieved better discrimination than that reported by the eFI [24] and is straightforward to calculate
during a patient consultation from twelve easily obtainable variables which may offer a practical
advantage over a more complex eFI based on a cumulative deficit model.
We have demonstrated that the MMRI-R retains good performance within this heterogenous cohort
of patients. The c-index indicated slightly poorer performance than the original study which reported
very good discrimination in predicting six-month mortality among long-term care home residents [20].
Differences in discrimination measures are likely attributable to differences in baseline characteristics
of the populations. The MMRI-R was developed within a population of care home residents in the
United States, whilst our patient sample were predominantly living in their own homes. Additionally
over half of the original sample were aged 85 years or over, compared with one third aged over 85 in
this UK sample. However, despite these differences, mortality in each study is similar which suggests
a comparable burden of illness and mortality risk.
The MMRI-R may improve community case-management nurses’ understanding of the determinants
of the clinical course and outcomes of their patients [28]. However, mortality rating indices only
provide a snapshot assessment of a patient’s mortality risk and do not take into account the rapidity
of a patient’s deterioration or any potential for reversibility of signs and symptoms. The MMRI-R
should not be used to replace clinical judgement or person-centred communication as a trigger to
Page 18 of 30
1
2
3
4
5
6
7
8
9
10
11
12
13
14
15
16
17
18
19
20
21
22
23
24
25
26
27
28
29
30
31
32
33
34
35
36
37
38
39
40
41
42
43
44
45
46
47
48
49
50
51
52
53
54
55
56
57
58
59
60

For Review O
nly
9
initiate advance care planning, rather as an adjunct to clinical decision making by providing an
objective estimate of risk to be considered alongside other relevant clinical information.
We found that community case-management nurses recognise patients who are approaching the end
of their lives with reasonably good accuracy, yet the extent to which their patients engaged with
advance care planning is unknown. Future studies should explore the impact of community case-
management nurses on meeting the desired goals and expectations of patients and the cost of
healthcare at the end of life through advance care planning. Since the data for this study was collected
a sustained increase in the aged population continues to place mounting pressure on primary care
resources. Discussing patients’ preferences for clinical care and treatment is therefore assuming a
greater prominence in order to prevent unnecessary hospitalisation at the end of life and to support
people to die in their preferred place of care. The use of a mortality risk index as an adjunct to clinical
decision making may help nurses to prioritise patients for whom advance care planning may be
appropriate. Mortality risk indices do not appear to have been adopted widely in practice and further
research is needed to explore their potential benefits and limitations to identify patients who may
benefit from advance care planning.
Application of the Prediction Models
The following example illustrates how the MMRI-R and nurses’ predictions assesses survival. An 83
year old man with heart failure, chronic kidney disease stage 4 and a creatinine greater than 3mg/dL
has shortness of breath on exertion and poor mobility. He is dependent on carers who visit his home
three times daily to assist with washing and meal preparation. His appetite has recently declined and
his community case-management nurse thinks that he is likely to be in his last year of life. His MMRI-
R is calculated as 39 (Supplementary table 1 available at Age and Ageing online). Both MMRI-R and
nurses’ predictions place him in the high risk group and estimates that he has between a 48% and 57%
chance of survival at 12 months.
Limitations
In order to assess the additive value of nurses’ predictions to the MMRI-R a cross-validation design
was adopted in which the data was partitioned into derivation and validation sets. This approach
resulted in two smaller samples and may contribute to an over-optimistic assessment of model
performance [29].
Conclusion
Mortality amongst community based frail older people is associated with an increasing MMRI-R score.
Community case-management nurses can identify patients who are likely to die within 12 months with
reasonable accuracy. The MMRI-R demonstrated comparable discrimination in identifying those at
high or low risk of mortality and the addition of nurses’ predictions improved its performance. Nurses’
estimates of survival may trigger an objective assessment of mortality risk among those patients
considered to be most likely to die within twelve months. An objective assessment, using the MMRI-
R, a simple assessment tool that can be administered in the patient’s own home, has the potential to
improve nurses’ confidence in their clinical decision making and encourage community case-
management nurses to initiate timely conversations with frail older people and those close to them
to determine end of life care preferences. However, the difference in performance between MMRI-R
and nurses’ predictions appears sufficiently small to suggest that nurses’ judgement can be trusted to
implement anticipatory care interventions at an early stage whilst avoiding an over-reliance on
objective measures.
Page 19 of 30
1
2
3
4
5
6
7
8
9
10
11
12
13
14
15
16
17
18
19
20
21
22
23
24
25
26
27
28
29
30
31
32
33
34
35
36
37
38
39
40
41
42
43
44
45
46
47
48
49
50
51
52
53
54
55
56
57
58
59
60

For Review O
nly
10
Conflicts of Interests
All authors declare they have nothing to disclose.
Key PointsIdentifying patients who are approaching the end of their lives can facilitate advance care planning and align future care to patients’ preferences.
Prognostication is challenging among frail older patients with multiple progressive and fluctuating long-term conditions.
The MMRI-R is comparable to community nurses’ intuition at identifying patients approaching end of life.
The MMRI-R and nurses predictions performed better in combination than alone.
Case-management nurses such as UK community matrons Community nurses’ judgement should be trusted to initiate the early implementation of anticipatory care interventions.
Key Words:
Older people, end of life care, community nurse, mortality, advance care planning
Page 20 of 30
1
2
3
4
5
6
7
8
9
10
11
12
13
14
15
16
17
18
19
20
21
22
23
24
25
26
27
28
29
30
31
32
33
34
35
36
37
38
39
40
41
42
43
44
45
46
47
48
49
50
51
52
53
54
55
56
57
58
59
60
For Review O
nly
11
References
[1] Department of Health, One Year On: The Government Response to the Review of Choice in End
of Life Care, gov.uk, London, 2017.
[2] National Palliative and End of Life Care Partnership, Ambitions for Palliative and End of Life Care:
A National Framework for Local Action 2015-2020, Online, 2015.
[3] Department of Health, End of Life Care Strategy: Promoting High Quality Care for All Adults at the
End of Life, Department of Health, London, 2008.
[4] K. Thomas, H. Corner, M. Stobbart-Rowlands, National primary care audit in end of life care and
ACP and recommendations for improvement, British Medical Journal Supportive and Palliative Care
2(2) (2012) 192-192.
[5] World Health Assembly, Strengthening palliative care as a component of comprehensive care
throughout the life course, Sixty-seventh World Health Assembly, 2014, p. Agenda Item 15.5.
[6] K. Thomas, B. Lobo, K. Detering, Advance Care Planning in End of Life Care, 2nd ed., Oxford
University Press, Oxford, 2017.
[7] K. Boyd, S.A. Murray, Recognising and managing key transitions in end of life care, British Medical
Journal 341 (2010) c4863.
[8] N.A. Christakis, T.J. Iwashyna, Attitude and self-reported practice regarding prognostication in a
national sample of internists, Archives of Internal Medicine 158(21) (1998) 2389-2395.
[9] National Gold Standards Framework Centre, Prognostic Indicator Guidance, 2008.
http://www.goldstandardsframework.org.uk/Resources/Gold%20Standards%20Framework/PDF%20
Documents/PrognosticIndicatorGuidancePaper.pdf. (Accessed 23/11/11 2011).
[10] E.A. Maas, S.A. Murray, Y. Engels, C. Campbell, What tools are available to identify patients with
palliative care needs in primary care: a systematic literature review and survey of European practice,
British Medical Journal Supportive and Palliative Care 3(4) (2013) 444-451.
[11] M. Maltoni, M. Pirovano, E. Scarpi et al, Prediction of survival of patients terminally ill with
cancer: Results of an Italan prospective multicentric study, Cancer 75(10) (1995) 2613-2622
[12] D. Hui, M. Park, D. Liu et al, Clinician prediction of survival versus the Palliative Prognostic Score:
Which approach is more accurate? European Journal of Cancer 64 (2016) 89-95
[13] G.K. Mitchell, H.E. Senior, J.J. Rhee et al, Using intuition or a formal palliative care needs
assessment screening process in general practice to predict death within 12 months: A randomised
controlled trial, Palliative Medicine 32(2) (2017) 384-394.
[14] L. Yourman, S.J. Lee, M.A. Schonberg, E.W. Widera, A.K. Smith, Prognostic indices for older
adults: a systematic review, Journal of the American Medical Association 307(2) (2012) 182-192
[15] D. Schulman-Green, R. McCorkle, E. Cherlin, R. Johnson-Hurzeler, E. Bradley, Nurses’
communications of prognosis and implications for hospice referral: A study of nurses caring for
terminally ill hospitalised patients, American Journal of Critical Care 14(1) (2005) 64-70.
Page 21 of 30
1
2
3
4
5
6
7
8
9
10
11
12
13
14
15
16
17
18
19
20
21
22
23
24
25
26
27
28
29
30
31
32
33
34
35
36
37
38
39
40
41
42
43
44
45
46
47
48
49
50
51
52
53
54
55
56
57
58
59
60
For Review O
nly
12
[16] D. Porock, D. Parker-Oliver, Recognizing dying by staff in long-term care, Journal of Hospice and
Palliative Nursing 9(5) (2007) 270-278.
[17] Department of Health, Supporting People with Long-Term Conditions: Liberating the Talent of
Nurses Who Care for People with Long-Term Conditions, Department of Health, London, 2005.
[18] NHS Modernisation Agency and Skills for Health, Case Management Competencies Framework,
Department of Health, London, 2005.
[19] D. Porock, D. Parker-Oliver, S. Zweig et al, Predicting death in the nursing home: development
and validation of the 6-month Minimum Data Set mortality risk index, Journals of Gerontology Series
A-Biological Sciences & Medical Sciences 60(4) (2005) 491-8.
[20] D. Porock, D. Parker-Oliver, G. Petroski, M. Rantz, The MDS Mortality Risk Index: the evolution
of a method for predicting 6-month mortality in nursing home residents, BMC Research Notes 3(200)
(2010).
[21] Dutta, R., Hooper, J. & Dutta, D. 2015. Use of the MMRI-R prognostic tool for older patients
discharged to nursing homes from hospital: a prospective cohort study. Age and Ageing, 44, 673-
676.
[22] P. Royston, W. Sauerbrei, A new measure of prognostic separation in survival data, Statistics in
Medicine 23(5) (2004) 723-48.
[23] M.S. Rahman, G. Ambler, B. Choodari-Oskooei, R.Z. Omar, Review and evaluation of
performance measures for survival prediction models in external validation settings, BMC Medical
Research Methodology 17(1) (2017) 60.
[24] F.E. Harrell, K.L. Lee, D.B. Mark, Multivariable prognostic models: issues in developing models,
evaluating assumptions and adequacy, and measuring and reducing errors, Statistics in Medicine 15
(1996) 361-387.
[25] R.B. Newson, Comparing the predictive powers of survival models using Harrell’s C or Somers’ D,
The Stata Journal 10(3) (2010) 339–358.
[26] P. Royston, Tools for checking calibration of a Cox model in external validation: Prediction of
population-averaged survival curves based on risk groups, The Stata Journal 15(1) (2015) 275–291.
[27] B. Gwilliam, V. Keeley, C. Todd et al, Development of Prognosis in Palliative care Study (PiPS)
predictor models to improve prognostication in advanced cancer: prospective cohort study, British
Medical Journal 343(d4920) (2011) 1-15.
[28] K.G. Moons, P. Royston, Y Vergouwe, D.E. Grobbee, D.G. Altman, Prognosis and prognostic
research: what, why, and how? British Medical Journal, 338:b375 (2009)
[29] J. Subramanian, R. Simon, Overfitting in prediction models - is it a problem only in high
dimensions?, Contemporary Clinical Trials 36(2) (2013) 636-41.
Page 22 of 30
1
2
3
4
5
6
7
8
9
10
11
12
13
14
15
16
17
18
19
20
21
22
23
24
25
26
27
28
29
30
31
32
33
34
35
36
37
38
39
40
41
42
43
44
45
46
47
48
49
50
51
52
53
54
55
56
57
58
59
60

For Review O
nly
Revision Sheet
Instructions for authors:
1. In the first column please briefly summarise each point raised by the referee or editor.2. In the second column, briefly explain how you have responded to each point. 3. In the third column, give the location in the text of the modification – with page and
paragraph number reference.4. Please upload this form to Manuscript Central alongside your revised paper.
Manuscript title:
Comparing the predictive ability of the Revised Minimum Dataset Mortality Risk Index
(MMRI-R) with nurses’ predictions of mortality among frail older people: a cohort study.
Referee 1
Point raised by referee (please summarise)
Response by author (briefly explain) Location in text:Page and paragraph reference *
1.1 Nurse predictions conferred little benefit to the MMRI-R tool but the reverse is also true
We have reworded this finding to provide clarity for the reader, emphasising that combining MMRI-R with clinical prediction of survival improved the performance of each model.
Discussion: Page 6, paragraph 2
1.2 There is no critique of the MMRI-R tool which fails to take account of the speed of clinical deterioration or reversible causes. These are serious flaws of the tool.
The reviewer highlights a very important limitation that is applicable to most prognostic indices. We have amended our discussion to emphasise adopting a cautionary approach to using a prognostic index and the potential value of clinical prediction of survival to validate a prognostic score with the aim of prioritising advance care planning conversations.
Discussion: Page 7, paragraph 3
1.3 The risk of using the MMRI-R instead of effective person-centred communication to identify patients as a trigger to discuss advance care planning are not acknowledged.
The importance of person-centred communication as a trigger to advance care planning is acknowledged in the restructured discussion (see point 1.2).
Discussion: Page 7, paragraph 3
1.4 Areas for future research are not identified.
We agree with both reviewers and have amended the discussion section to include areas for future research.
Discussion:Page 7, paragraph 4
*Page numbers and paragraph references refer to the revision copy with no tracked changes.
age and ageingPage 23 of 30
1
2
3
4
5
6
7
8
9
10
11
12
13
14
15
16
17
18
19
20
21
22
23
24
25
26
27
28
29
30
31
32
33
34
35
36
37
38
39
40
41
42
43
44
45
46
47
48
49
50
51
52
53
54
55
56
57
58
59
60
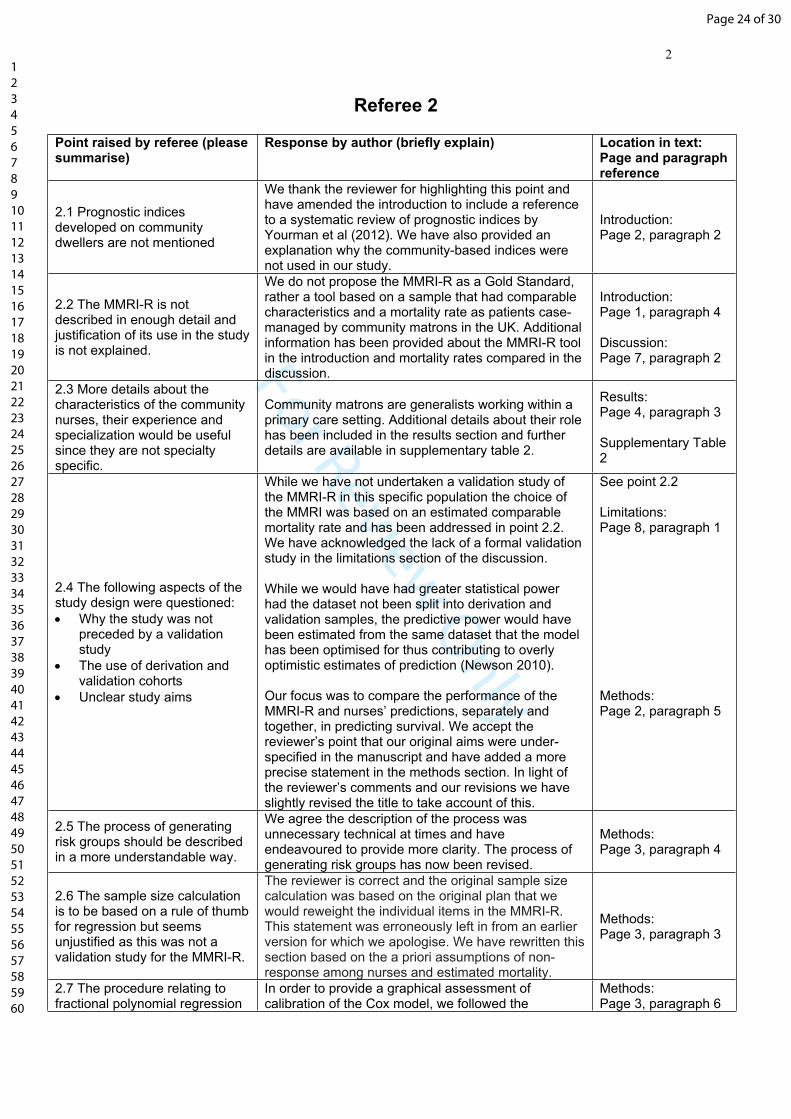
For Review O
nly
2
Referee 2
Point raised by referee (please summarise)
Response by author (briefly explain) Location in text:Page and paragraph reference
2.1 Prognostic indices developed on community dwellers are not mentioned
We thank the reviewer for highlighting this point and have amended the introduction to include a reference to a systematic review of prognostic indices by Yourman et al (2012). We have also provided an explanation why the community-based indices were not used in our study.
Introduction:Page 2, paragraph 2
2.2 The MMRI-R is not described in enough detail and justification of its use in the study is not explained.
We do not propose the MMRI-R as a Gold Standard, rather a tool based on a sample that had comparable characteristics and a mortality rate as patients case-managed by community matrons in the UK. Additional information has been provided about the MMRI-R tool in the introduction and mortality rates compared in the discussion.
Introduction:Page 1, paragraph 4
Discussion:Page 7, paragraph 2
2.3 More details about the characteristics of the community nurses, their experience and specialization would be useful since they are not specialty specific.
Community matrons are generalists working within a primary care setting. Additional details about their role has been included in the results section and further details are available in supplementary table 2.
Results:Page 4, paragraph 3
Supplementary Table 2
2.4 The following aspects of the study design were questioned:
Why the study was not preceded by a validation study
The use of derivation and validation cohorts
Unclear study aims
While we have not undertaken a validation study of the MMRI-R in this specific population the choice of the MMRI was based on an estimated comparable mortality rate and has been addressed in point 2.2. We have acknowledged the lack of a formal validation study in the limitations section of the discussion.
While we would have had greater statistical power had the dataset not been split into derivation and validation samples, the predictive power would have been estimated from the same dataset that the model has been optimised for thus contributing to overly optimistic estimates of prediction (Newson 2010).
Our focus was to compare the performance of the MMRI-R and nurses’ predictions, separately and together, in predicting survival. We accept the reviewer’s point that our original aims were under-specified in the manuscript and have added a more precise statement in the methods section. In light of the reviewer’s comments and our revisions we have slightly revised the title to take account of this.
See point 2.2
Limitations:Page 8, paragraph 1
Methods:Page 2, paragraph 5
2.5 The process of generating risk groups should be described in a more understandable way.
We agree the description of the process was unnecessary technical at times and have endeavoured to provide more clarity. The process of generating risk groups has now been revised.
Methods:Page 3, paragraph 4
2.6 The sample size calculation is to be based on a rule of thumb for regression but seems unjustified as this was not a validation study for the MMRI-R.
The reviewer is correct and the original sample size calculation was based on the original plan that we would reweight the individual items in the MMRI-R. This statement was erroneously left in from an earlier version for which we apologise. We have rewritten this section based on the a priori assumptions of non-response among nurses and estimated mortality.
Methods:Page 3, paragraph 3
2.7 The procedure relating to fractional polynomial regression
In order to provide a graphical assessment of calibration of the Cox model, we followed the
Methods:Page 3, paragraph 6
Page 24 of 30
1
2
3
4
5
6
7
8
9
10
11
12
13
14
15
16
17
18
19
20
21
22
23
24
25
26
27
28
29
30
31
32
33
34
35
36
37
38
39
40
41
42
43
44
45
46
47
48
49
50
51
52
53
54
55
56
57
58
59
60

For Review O
nly
3
is not explained in sufficient detail.
procedure proposed by Royston (2015) and Royston & Altman (2013) which approximates the log cumulative hazard function using fractional polynomial regression on the continuous variable of the aggregate prognostic score. On consideration of the reviewer's comments we recognise that a sufficiently technical description of this procedure is not possible within the word limit and might detract from the readability of the paper. We have therefore simplified this section.
2.8 The rationale for developing a model using a combination of the tool and clinical prediction of survival is unclear.
The reviewer has previously identified that the study aims could have been clearer. We have therefore amended the objectives as outlined in 2.4 to make the assessment of the incremental value of nurses' predictions of mortality on the MMRI-R explicit. We have additionally provided further justification for our decision in the introduction.
Methods:Page 2, paragraph 5
Introduction:Page 2, paragraph 2
2.9 The authors conclusion in relation to better performance of the combined model are inconsistent with the conclusion that it is sufficient to use nurses prediction alone. This could be rewritten to make the point better.
We thank the reviewer for bringing this inconsistent message to our attention. We have reviewed the abstract, discussion and conclusion in order to provide clarity and consistency in our conclusions.
Abstract:Page 1, paragraph 6
Discussion:Page 7, paragraph 1
Conclusion:Page 8, paragraph 2
2.10 The last key point does not describe the type of nurse whose judgements the authors refer to specifically.
We have amended the last key point in order to clarify that we are referring to community case-management nurses
Key Point:Page 8, point 5
2.11 Frailty has not been measured in their patients so the discussion about the electronic frailty index , which is not a mortality prediction tool, appears out of place and of no relevance.
Originally we intended to reflect that Stow et al's (2018) dataset was derived electronically from the patient electronic record demonstrated comparable accuracy to our dataset that was clinician-reported. On reconsideration we accept the reviewer and editor's comments that the inclusion of the study by Stow et al (2018) may create confusion for the reader and was designed to predict 3-month mortality rather than mortality at 1 year. We have therefore removed reference to the study from the discussion.
Discussion:Page 7, paragraph 2
2.12 Areas for future research are not identified.
We agree with both reviewers and have amended the discussion section to include areas for future research.
Discussion:Page 7, paragraph 4
Page 25 of 30
1
2
3
4
5
6
7
8
9
10
11
12
13
14
15
16
17
18
19
20
21
22
23
24
25
26
27
28
29
30
31
32
33
34
35
36
37
38
39
40
41
42
43
44
45
46
47
48
49
50
51
52
53
54
55
56
57
58
59
60

For Review O
nly
4
Associate Editor
Point raised by referee (please summarise)
Response by author (briefly explain) Location in text:Page and paragraph reference
3.1 The work validating the MMI-R in a UK population is not referred to within the paper.
We thank the associate editor for highlighting our omission and have made reference to Dutta and Dutta (2015) in the introduction to support our decision to test the MMRI-R in a community-based sample.
Introduction:Page 1, paragraph 4
3.2 The landscape of community nursing and advanced care planning may have changed since data collection 5 years ago
In response to the associate editor’s comments we have revised the discussion section to indicate a greater prominence of advance care planning in light of the ageing population and increasing demands on primary care.
Discussion:Page 7, paragraph 4
3.3 Frailty has not been measured in their patients so the discussion about the electronic frailty index , which is not a mortality prediction tool, appears out of place and of no relevance.
Originally we intended to reflect that Stow et al's (2018) dataset was derived electronically from the patient electronic record demonstrated comparable accuracy to our dataset that was clinician-reported. On reconsideration we accept the reviewer and editor's comments that the inclusion of the study by Stow et al (2018) may create confusion for the reader and was designed to predict 3-month mortality rather than mortality at 1 year. We have therefore removed reference to the study from the discussion.
Discussion:Page 7, paragraph 2
3.4 The figures do not project in black and white/greyscale
Figure 1 and supplementary figure 2 have been amended accordingly.
Results:Page 6, Figure 1
Supplementary DataPage 4, Figure 2
Page 26 of 30
1
2
3
4
5
6
7
8
9
10
11
12
13
14
15
16
17
18
19
20
21
22
23
24
25
26
27
28
29
30
31
32
33
34
35
36
37
38
39
40
41
42
43
44
45
46
47
48
49
50
51
52
53
54
55
56
57
58
59
60

For Review O
nly
1
Supplementary Data
Supplementary Table 1. MMRI-R Scoring Sheet [1]
Yes No Points
Admission to nursing home in the past three months 8
Lost weight unintentionally in the last three months 5
Renal failure 6
Chronic heart failure 4
Poor appetite 4
Male 5
Dehydrated 4
Short of breath 8
Cancer (if yes – see Age and Cancer worksheet; if no continue)
Age of patient/resident at last birthday ____
Age score
without
cancer
2-9
Age score
with cancer13-20
Deteriorated cognitive skills or status in the past three months
ADL score
without
cognitive
decline
0-16
ADL score
with cognitive
decline
-2-21
TOTAL MMRI-R SCORE 0-85
[1] D. Porock, D. Parker-Oliver, G. Petroski, M. Rantz, The MDS Mortality Risk Index: the evolution of
a method for predicting 6-month mortality in nursing home residents, BMC Research Notes 3(200)
(2010).
Page 27 of 30
1
2
3
4
5
6
7
8
9
10
11
12
13
14
15
16
17
18
19
20
21
22
23
24
25
26
27
28
29
30
31
32
33
34
35
36
37
38
39
40
41
42
43
44
45
46
47
48
49
50
51
52
53
54
55
56
57
58
59
60

For Review O
nly
2
Supplementary Figure 1: Participant flow diagram
Total Population:
45 Community matrons (1330 patients)
Participated:
35 Community matrons (883 patients)
Declined to participate:
10 Community matrons (447 patients)
Final Sample:
867 patient questionnaires
8 duplicate questionnaires excluded
8 patients lost to follow-up
Censored:
309
Died:
124
Derivation cohort:
433 patients
Censored:
309
Died:
125
Validation cohort:
434 patients
Page 28 of 30
1
2
3
4
5
6
7
8
9
10
11
12
13
14
15
16
17
18
19
20
21
22
23
24
25
26
27
28
29
30
31
32
33
34
35
36
37
38
39
40
41
42
43
44
45
46
47
48
49
50
51
52
53
54
55
56
57
58
59
60
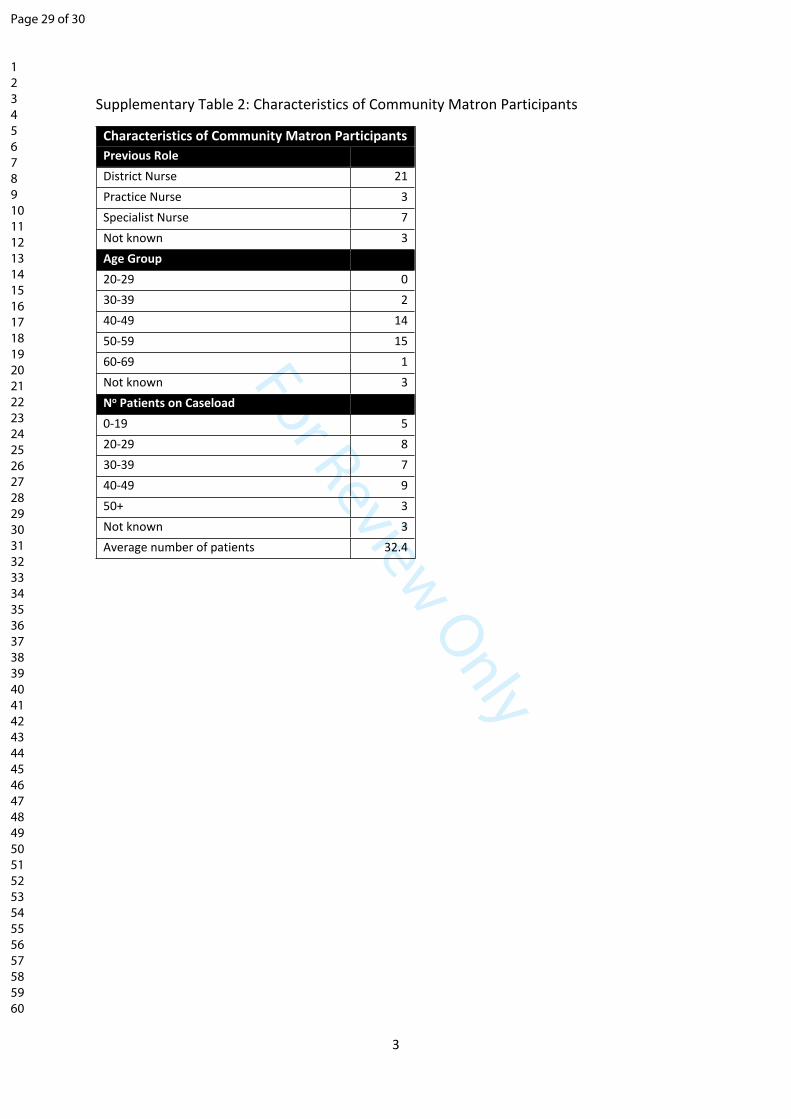
For Review O
nly
3
Supplementary Table 2: Characteristics of Community Matron Participants
Characteristics of Community Matron Participants
Previous Role
District Nurse 21
Practice Nurse 3
Specialist Nurse 7
Not known 3
Age Group
20-29 0
30-39 2
40-49 14
50-59 15
60-69 1
Not known 3
No Patients on Caseload
0-19 5
20-29 8
30-39 7
40-49 9
50+ 3
Not known 3
Average number of patients 32.4
Page 29 of 30
1
2
3
4
5
6
7
8
9
10
11
12
13
14
15
16
17
18
19
20
21
22
23
24
25
26
27
28
29
30
31
32
33
34
35
36
37
38
39
40
41
42
43
44
45
46
47
48
49
50
51
52
53
54
55
56
57
58
59
60
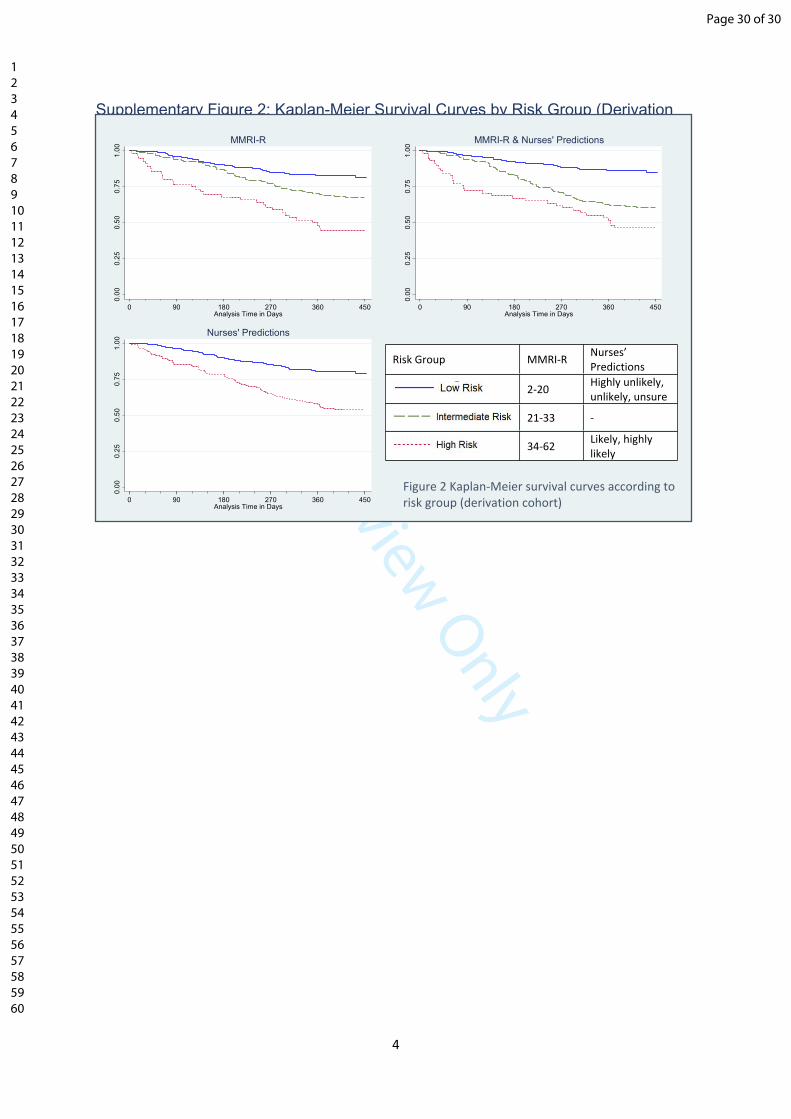
For Review O
nly
4
Supplementary Figure 2: Kaplan-Meier Survival Curves by Risk Group (Derivation
Cohort)
Figure 2 Kaplan-Meier survival curves according to
risk group (derivation cohort)
0.0
00
.25
0.5
00
.75
1.0
0
0 90 180 270 360 450Analysis Time in Days
MMRI-R
Risk Group MMRI-RNurses’
Predictions
2-20Highly unlikely,
unlikely, unsure
21-33 -
34-62Likely, highly
likely
0.0
00
.25
0.5
00
.75
1.0
0
0 90 180 270 360 450Analysis Time in Days
MMRI-R & Nurses' Predictions
0.0
00
.25
0.5
00
.75
1.0
0
0 90 180 270 360 450Analysis Time in Days
Nurses' Predictions
Page 30 of 30
1
2
3
4
5
6
7
8
9
10
11
12
13
14
15
16
17
18
19
20
21
22
23
24
25
26
27
28
29
30
31
32
33
34
35
36
37
38
39
40
41
42
43
44
45
46
47
48
49
50
51
52
53
54
55
56
57
58
59
60
Recommended