Bucknell UniversityBucknell Digital Commons
Honors Theses Student Theses
2011
Comparative Study of Informal Health CareNetworks and Elderly Health Status in Argentinaand CubaAva GinsbergBucknell University
Follow this and additional works at: https://digitalcommons.bucknell.edu/honors_theses
Part of the Economics Commons
This Honors Thesis is brought to you for free and open access by the Student Theses at Bucknell Digital Commons. It has been accepted for inclusion inHonors Theses by an authorized administrator of Bucknell Digital Commons. For more information, please contact [email protected].
Recommended CitationGinsberg, Ava, "Comparative Study of Informal Health Care Networks and Elderly Health Status in Argentina and Cuba" (2011).Honors Theses. 53.https://digitalcommons.bucknell.edu/honors_theses/53

COMPARATIVE STUDY OF INFORMAL HEALTH CARE
NETWORKS AND ELDERLY HEALTH STATUS IN
ARGENTINA AND CUBA
by
Ava Beth Ginsberg
Honors Thesis Submitted to the Honors Council
For Honors in the Economics Department
April 20, 2011
Approved by:
_________________________________
Adviser: Amy Wolaver
_________________________________
Department Chairperson: Thomas Kinnaman
_________________________________


Acknowledgements
I would like to acknowledge the advice, guidance and patience of Professor Amy
Wolaver, my Honors Thesis adviser, without whom this lengthy process would have been
much more difficult. I would also like to thank Professor Thomas Kinnaman, Department
Chair, for strongly encouraging me to pursue an Honors Thesis. I would also like to pay
tribute to Professor Michael Moohr for his advice and guidance over the first three years
of my Bucknell career. In addition, I would like to thank my Argentine host mother, Alba
Ovando Gaméz, for her inspiration, care and amazing cooking. Lastly, I would like to
thank my parents for all of their support and love, and for consistently reassuring me of
my capabilities as a student. This entire experience has truly been remarkable, and one I
know will influence me for years to come.

Abstract
Objectives: The objective of this study is to evaluate the impact of informal care support
networks on the health status, life satisfaction, happiness and anxiety of elderly
individuals in Argentina and Cuba. Recent economic changes, demographic changes, the
structure of families and changes in women‟s labor participation have affected the
availability of informal care. Additionally, the growing number of elderly as a percentage
of total population has significant implications for both formal and informal care in
Argentina and Cuba. Methods: The SABE - Survey on Health, Well-Being, and Aging in
Latin America and the Caribbean, 2000 was used as the data source. The survey has a
sample of 10,656 individuals aged 60 years and older residing in private households
occupied by permanent dwellers in 7 cities in the Latin American and Caribbean region.
My study will focus on the Buenos Aires and Havana samples in which there were 1043
individuals and 1905 individuals respectively. General sampling design was used to
establish comparability between countries. Individuals requiring assistance are surveyed
on their source of help and the relative impact of informal versus paid help is measured
for this group. Other measures of social support (number of living children,
companionship and number of individuals living in the same dwelling) are used to
measure networks for the full sample. Multivariate probit regression analyses were run
separately for Cuba and for Argentina to evaluate the marginal impacts of the types of
social support on health status, life satisfaction, happiness and anxiety. Results: For
Argentina, almost all of the family help variables positively impact good health. Getting
help from most other members of the family negatively impacts satisfaction with life.
Happiness is affected differently by each of the family help variables but community
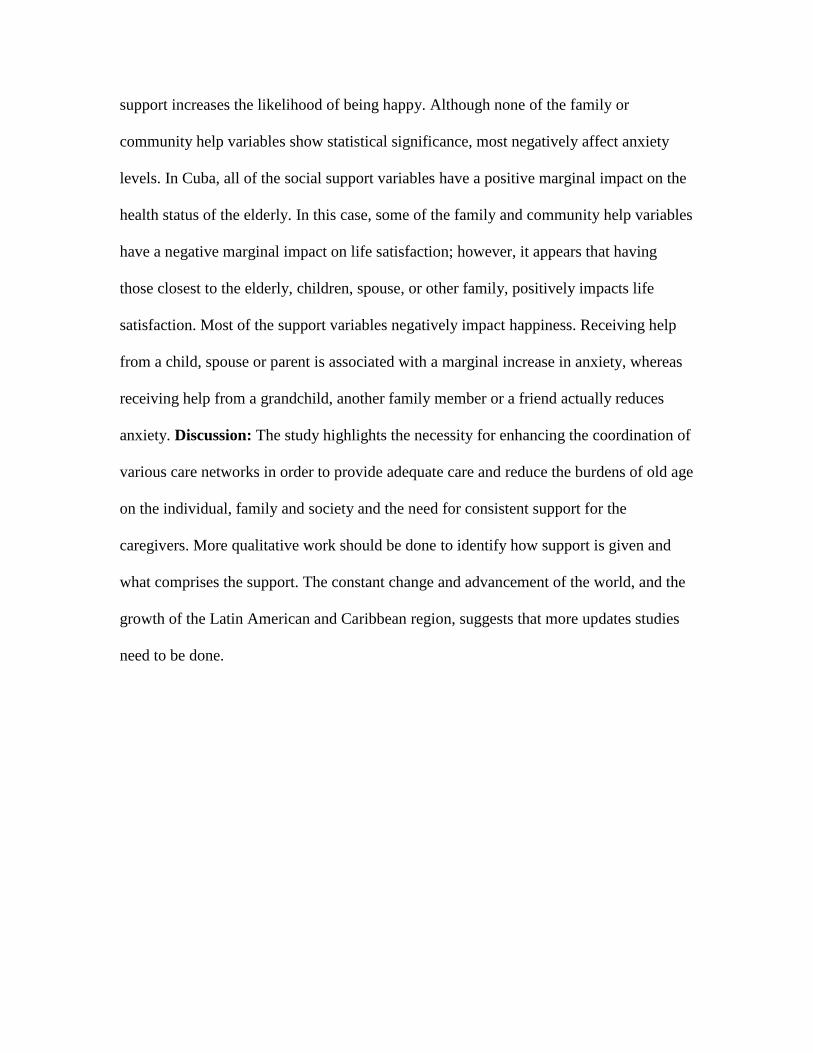
support increases the likelihood of being happy. Although none of the family or
community help variables show statistical significance, most negatively affect anxiety
levels. In Cuba, all of the social support variables have a positive marginal impact on the
health status of the elderly. In this case, some of the family and community help variables
have a negative marginal impact on life satisfaction; however, it appears that having
those closest to the elderly, children, spouse, or other family, positively impacts life
satisfaction. Most of the support variables negatively impact happiness. Receiving help
from a child, spouse or parent is associated with a marginal increase in anxiety, whereas
receiving help from a grandchild, another family member or a friend actually reduces
anxiety. Discussion: The study highlights the necessity for enhancing the coordination of
various care networks in order to provide adequate care and reduce the burdens of old age
on the individual, family and society and the need for consistent support for the
caregivers. More qualitative work should be done to identify how support is given and
what comprises the support. The constant change and advancement of the world, and the
growth of the Latin American and Caribbean region, suggests that more updates studies
need to be done.

iii
Table of Contents
I. Introduction ................................................................................................................... 6
II. Background .................................................................................................................. 7
Argentina......................................................................................................................... 8
Cuba .............................................................................................................................. 11
General Trends and Implications for Argentina and Cuba ........................................... 14
III. Literature Review ..................................................................................................... 16
IV. Theory ........................................................................................................................ 20
V. Production Function of Health Status and Social Support .................................... 23
VI. Data ............................................................................................................................ 28
VII. Descriptive Statistics: Sample ................................................................................ 30
VIII. Methods and Hypothesis ....................................................................................... 35
IX. Results ........................................................................................................................ 38
Results: Argentina ......................................................................................................... 38
Results: Cuba ................................................................................................................ 43
Statistical Differences Between Argentina and Cuba ................................................... 46
Social Support: Argentina and Cuba............................................................................. 47
X. Discussion .................................................................................................................... 49
References ........................................................................................................................ 52
Appendix A: Tests of Robustness and Goodness of Fit and Full Sample Results .... 71
Robustness and Goodness of Fit Tests ......................................................................... 71
Degree of Variation Explained by the Models: Argentina ........................................... 71
Degree of Variation Explained by the Models: Cuba ................................................... 72
Results: Argentina ......................................................................................................... 72
Results: Cuba ................................................................................................................ 77
Results: Ordinary Least Square Regression of Social Support on General Well
Being ............................................................................................................................. 80
Only Those Who Need Help ..................................................................................... 80
Full Sample ............................................................................................................... 80

iv
List of Tables
Table 1: Descriptive Statistics .......................................................................................... 60 Table 2: Impact of Social Support on Self-Reported Health, For Those Who Need
Help .................................................................................................................................. 61 Table 3: Impact of Social Support on Life Satisfaction, For Those Who Need Help ...... 62 Table 4: Impact of Social Support on Happiness, Only Those Who Need Help .............. 63 Table 5: Impact of Social Support on Anxiety, Only Those Who Need Help .................. 64 Table 6: Impact of Living Arrangement and Support on Self-Reported Health Status,
Full Sample ....................................................................................................................... 65 Table 7: Impact of Living Arrangement and Support on Life Satisfaction, Full
Sample ............................................................................................................................ 66
Table 8: Impact of Living Arrangement and Support on Anxiety, Full Sample .............. 67 Table 9: Impact of Living Arrangement and Support on Happiness, Full Sample........... 68 Table 10: Mean Comparison Tests Cuba and Argentina of Those Who Need Help ........ 69
Table 11: Mean Comparison Tests Cuba and Argentina of the Full Sample ................... 70 Table 12: Impact of Types of Social Support on Self-Reported Health Status, Full
Sample............................................................................................................................... 82 Table 13: Impact of Types of Social Support on Life Satisfaction, Full Sample ............. 83 Table 14: Impact of Types of Social Support on Happiness, Full Sample ....................... 84
Table 15: Impact of Types of Social Support on Anxiety, Full Sample ........................... 85 Table 16: Impact of Social Support on General Well-Being, Only Those Who Need
Help ................................................................................................................................... 86
Table 17: Impact of Social Support on General Well-Being, Full Sample ...................... 87

v
List of Figures
Figure 1: Total Product of Social Support ........................................................................ 26 Figure 2: Total Product of Social Support ........................................................................ 26
Figure 3: Total Product of Social Support ........................................................................ 27 Figure 4: Diminishing Marginal Product of Health .......................................................... 27

6
I. Introduction
This study explores familial and friend support networks and living arrangements
among elderly individuals in Latin America and the Caribbean and the impact that this
type of support has on the health of the elderly individuals in Cuba and Argentina. Using
data from the Survey on Health and Well-Being of Elders (SABE) from 1999-2000, I
explore which type of support has a larger impact on overall health. I also measure
differences in unmet needs for certain health services. This topic is particularly
interesting because it will help to uncover what policies are best for aiding in the
healthcare of the elderly in aging population. Lastly, the investigation of this topic allows
me to draw conclusions about the most effective means of social and public policy for the
elderly community and provide me with information about the role of both informal
provisions of support from family and friends, and formal provisions of support from the
government.
My primary focus is on Argentina, using Buenos Aires as the sample city, and
Cuba, using Havana as the sample city. Argentina is particularly interesting to me
because of my abroad experience and homestay experience with an older Argentine
woman who lived alone but depended upon her family for many healthcare needs,
doctors‟ visits and general well-being. In Argentina, I experienced a different form of
living than I am used to in the United States, where many older individuals or couples
live in nursing homes or in assisted living facilities, rather than alone or with family.
Both Argentina and Cuba have rapidly aging populations, lower GDP per capita than the
industrialized world and vast inequalities present among its citizens. However, Argentina
and Cuba have extremely different political, economic and cultural situations. Comparing
7
the two countries further allows me to compare correlations between health and the
existence of support networks under different environments, as well as provide me with
information to make more general claims that may be of use in the United States. The
changing economic climate of the two countries coupled with labor patterns of women
returning to work at rapid rates, a group of daughters or wives who have provided
informal support in the past, indicates that policies cannot just rely on either the formal or
informal sector but require a combination of the two sectors working together.
This paper will first give background on the difference in the economies and the
health care systems in Argentina and Cuba and will show why it interesting to study and
compare these two countries. I will then discuss the health status of the elderly in each
population as well as discuss the informal care networks and the role of family in each
country. This section will then be followed by a description of the data and methods used.
I will end by drawing conclusions about the study and the outcomes, and then I will
attempt to make suggestions about effective health care policies for the elderly.
II. Background
Argentina and Cuba differ remarkably in their political atmosphere as well as
many of their cultural practices. Additionally, the two countries have economic,
geographic and population differences, but Argentina and Cuba have similar literacy
rates: 98% in Argentina and 100% in Cuba (World Bank, 2008). They also have similar
rates of aging populations.

8
Argentina
Demographics and Health Care
Life expectancy in Argentina is high for Latin American standards, at 76.95 years
of age and the life expectancy of 73.71 years for males and 80.36 years for females (CIA
World Fact Book, 2011.) Another way to describe demographics is the age structure of a
country, and 10.8% of Argentina‟s population is 65 years or older (CIA World Fact
Book, 2010.) Consequently, Argentina has a large percentage of citizens who are
between the ages of 15-64, a group regarded as the capable caregivers: 63.5% of
Argentines are 15-64 years old (CIA World Fact Book, 2010.) Thus, the age of the
population has consequences on the provisions and accessibility of healthcare in the
country. As of 2006, according to the World Health Organization, the Argentine
government spends 10.1% of GDP on health, which figures out to $1,665 (International
$) per capita
Although substantial resources are spent on health care, the health care system in
Argentina is highly fragmented, consisting of three subsystems: publicly funded
healthcare, social insurance funds and private healthcare. The publicly funded healthcare
is decentralized and financing varies considerably among the different provinces in
Argentina. While there are over 200 different social insurance funds (obras sociales), and
although coverage is relatively high for Latin American standards, there is little
regulation of the funds. To provide for the large and increasing elderly population, the
Argentine state established the Programa de Atención Médica Integral (PAMI), or the
Integral Health Care Program, which provides social services and health care to a large
percentage of elderly in Argentina, a program similar to Medicare in the United States.

9
Geography
As the survey data is from the largest urban area in Argentina, the city of Buenos
Aires, comparing the sample to the general population is useful. Argentina is an
urbanized nation; geographic studies show that 92% of the Argentine population lives in
urban areas (CIA World Factbook, 2010), so the sample used should reflect the urbanity
of the country‟s population.
Economy and Politics
The age of neo-liberalism between 1991 and 1997 severely damaged Argentina‟s
economy and caused the underemployment rate to reach 18% in Buenos Aires by 1995
(Fried and Gaydos, 2002 .) The expansion of the informal sector and the extreme
disparity of wealth are also fixtures of Argentine life. Gasparini (2002) concluded that in
the region of greater Buenos Aires the Gini coefficient, which is a measure of inequality
within a nation, rose from 0.38 in 1980 to 0.53 in 2002. During the neoliberal crisis and
economic restructuring, the Gini index fluctuated from a low of 40.0 in 1991 to a high of
47.4 in 1998 (Gasparini, 2002.) A higher Gini index indicates a more unequal income
distribution within a country. Compared to the 1997 United States Gini index of 40.8,
Argentina‟s 1998 Index showed vast inequality (CIA World Factbook, 2010). There is,
therefore, a large disparity between high and low income sectors.
As a result of the recent economic changes and recent neo-liberal restructuring of
the economy, women have begun to enter the workforce at increasingly high rates in
response to the economic crisis. This trend is occurring at all levels of economic and
marital status, displaying a change in the traditionally patriarchal family composition. In

10
2002, explain Adam and Trost (2005b), households with two primary providers grew to
45.3% from 25.5% of households, showing the importance of women as wage earners.
Accordingly, Argentina‟s recent economic and workforce changes represent a
major change in the country that has put a great deal of strain on the family organization.
The increasingly high unemployment rates, high poverty and extreme wealth gap that
affects almost half of the population causes family to become a refuge for struggling
members who live in impoverished or depressed conditions. However, as cited by Adam
and Trost (2005b), the role of family and informal networks plays little or no role in the
implementation of public policy.
Family and Informal Care Networks
Labor force participation rates for women, especially in Buenos Aires, have
shown extreme growth over the past 20 years. Between the years 1991 and 1994, the
labor force participation rate grew from 38% in 1991 to 46% in 1995, during the same
time as the implementation of neoliberal policies and structural readjustment (Cerruti,
2000). Cerruti (2000) also identified that female heads of households are more likely to
be in the labor force, due to the necessity to maintain a steady income.
Partly due to the increase of women entering the workforce in Argentina, a
country in the past associated with large family size, the size of its family has decreased
steadily over the past 50 years. In 1947, the average family size was 4.3 members and
decreased to 3.86 members in 1980, and in 2001 it decreased to 3.57 persons per
household. Consequently, single person households have increased over the past decade.
In 2001 in Buenos Aires, single person households represented 26.2% of total

11
households, which, according to Adam and Trost (2005b), reflects the increase of the
aging population in Buenos Aires, as the life expectancy differentials between men and
women, and a societal shift in the acceptance of single person households. There was also
an increase in the percent of households with only one parental figure. In 2001, in 84% of
these cases the lone parent was the mother (Adam and Trost, 2005b).
Cuba
Demographics and Health Care
Similar to Argentina, Cuba has a rapidly aging population, which requires the
state to establish efficient programs to ensure that the elderly obtain health services. Fried
and Gayods (2002) examine world health systems and cite that Cuba has one of the oldest
populations in the Caribbean with 12.7% of its citizens 60 years or older, an age category
that is expected to make up 21% of Cuba by 2025. The life expectancy at birth in Cuba is
75.46 years for males and 80.08 years for females, and the projected life expectancy at
birth of the total population is 77.7 years of age, one of the highest life expectancy rates
in the Caribbean and world (CIA World Factbook, 2011). Consequently, 11.2% of the
population is 65 years or older. Once again, a rapidly aging nation requires caregivers,
and 70.4% of Cubans are 15-64 years old (CIA World Factbook, 2010). As reported by
WHO (2008), Cuba spends 7.1% of GDP on health, which totals to $363 (International $)
per capita, but, unlike Argentina, the Cuban government maintains full responsibility of
the health care system, ensuring that everyone is provided for regardless of economic
status, location, or race.

12
Since the 1959 Cuban Revolution, Cuba has achieved a system of universal and
equitable healthcare. However, Cuba is currently limited by its poor relationship with
United States hinders the importation of key medical resources. Additionally, the high
rates of poverty and housing shortages create unsanitary living conditions for Cubans in
general. Coupled with water supply shortages and poor trash collection, the conditions in
Cuba are not equitable with good health.
Geography
Cuba is a less urbanized nation than Argentina, with an urbanized population rate
of 72% (CIA World Fact Book, 2010). Therefore, as the study looks at a sample of the
impact of social capital in two major cities of each country, Buenos Aires and Havana,
there may be a better measure of the overall impact of social capital on health in
Argentina than in Cuba, as the study may not translate to the remaining quarter of the
Cuban population.
Economy and Politics
Cuba‟s economic and social history is different than that of Argentina, and,
consequently, has a different impact on family organization. “The Special Period” is a
period that characterized the economic crisis that began in the 1990s after the collapse of
the Soviet Union and the tightening of the U.S. economic blockade. During this time,
Cuba lost 85% of foreign trade and experienced a 51% decline in foreign aid (Fried and
Gaydos, 2002). During the same period, the disparity in income grew to extremes, from a
difference of 829 to 1 in 1995 to a difference of 12,500 to 1 in 2002, meaning that the

13
wealthiest members of the Cuban population earned $12,500 for every $1 that a poor
Cuban earned (Mesa-Lago, 2002).
Concurrently, Cuba‟s GDP was greatly affected and, consequently, many
components of the social safety network began to unravel. The decline in access to day-
care, medicine, clothing, food, skilled labor and housing was difficult on families,
causing the restricting and redefinition of the role of family networks.
Although one of Castro‟s first goals as president was to attempt to eliminate the
housing crisis by cutting rents, lowering electricity rates and limiting evictions, and at the
end of the 1960s, 40% of households were overcrowded with families living in four-
generation households. Through various incentives and government expenditures, new
homes were built; however, housing shortages and dangerous living conditions are still
persistent in Cuba (Adams and Trost, 2005a). Coupled with high divorce rates, the
ubiquitously deplorable housing conditions have been a constant in Cuban life for
decades. Housing conditions are usually cramped and inadequate, but also provide more
immediate in-home informal care for the elderly.
Family and Informal Care Networks
Members of the Cuban population recognized the need to introduce women into
the workforce and encourage the equality of women in the workplace. The Federation of
Cuban Women (FMC) was fundamental in spearheading the introduction of women to
the labor market, and acknowledged that women had been oppressed by being confined
to the home, excluded from a broader social life and remained economically dependent
on their husbands. By 1969, women began to adopt professional careers and contribute to

14
the family as wage earners. Consequently, Cuba‟s socialist government recognized the
need for women to be equal in the household, especially in a time of economic crisis, and
therefore the 1975 Family Code was introduced to replace pre-revolutionary laws on
marriage, divorce, adoption and alimony equality of women in marriage and also
stipulated that men should share in housework and childcare.
As mentioned earlier, Cuba has one of the highest divorce rates in the world,
particularly among younger couples, and in 1991, one in every 2.3 marriages ended in
divorce. Consequently, the formation of female-headed households in Cuba has increased
from 14% in 1953 to 28.1% in 1981, showing the greater role of women as both bread-
winners and child-caregivers (Adams and Trost, 2005a).
These trends highlight how family networks are vital in ensuring the prosperity of
its members. Although Cuba is socialist country, providing insurance for all of its citizens
equally, there are obvious holes in governmental provisions where family is obligated to
step in and help. The four-generational housing conditions are indicative of a housing
shortage and of the role that family plays in such a crisis. However, as single mother-
headed households are becoming more common, the availability of mothers to care for an
extra member of the family while continuing to work and support her nuclear family is
declining, leaving the elderly without a constant, or even consistent, care network. Thus,
community and friend networks in Cuba, like those in Argentina, must assume the role as
care-givers and sources of social stimulation.
General Trends and Implications for Argentina and Cuba
Argentina and Cuba have extremely different political, economic, health and
cultural institutions. Argentina is a democratic state whereas Cuba is socialist. These

15
factors can lead to interesting comparisons about how the impact of living arrangements
and social networks on health vary across countries with different systems and
ideologies.
Both Cuba and Argentina maintain a large elderly population, with increasing
rates of aging. Although based upon the aging population and Medicaid reform in the
United States, Victor Fuchs (1999) identifies how health care expenditures on the elderly
are significantly higher and faster growing than health care expenditures on any other
population group. Therefore, the rapidly aging populations in both Argentina and Cuba
may be a cause for concern for the health care budgets of each country as well as a strain
on family resources.
Family is fundamental to both countries, although present day economic and
social changes have put pressure on the traditional nuclear family. Adams and Trost
(2005a, 2005b) argue that family structure is undeniably linked to the economic,
sociodemographic and cultural changes present in a country or society, and can also be
impacted by changes in formal governmental policies and provisions. Trends such as an
increasing divorce rates, the aging of a population and economic changes all put pressure
on the family as a unit, forcing members to change their traditional roles or routines.
Under certain dynamic economic and social conditions, social networks and community
members become increasingly important in filling in the role that family typically
performs.
Economic crises have larger effects on a country‟s female population, because
women are overrepresented among the world‟s poor (Jennissen and Lundy, 2001). As
low wage earners and unpaid caretakers, women are part of both the formal and informal

16
work sector. Their responsibilities lie both with bringing in extra income and caring for
the home, children, husbands and elders in the family. Therefore, when health care cost
cutting practices are implemented, women are burdened with additional responsibilities
as the informal caregivers of sick relatives.
The shifts in family composition, undoubtedly, will impact the type, frequency
and availability of informal care networks for elderly. The demographic trend of
increases in the percentage of women entering the labor force means that women are in
the home much less during the day and have less time at their disposal to help their
elderly relatives. Additionally, the need for women to enter the labor force indicates a
necessity for another wage earner to supply sufficient income to the family, thus a
possible indicator that families have less disposable income to use on caring for their
elderly. The decrease in family size would also illustrate that fewer family members are
available to supply care for elderly members. Thus, as changes in a country‟s
demographic and economic trends burden families, it becomes increasingly more
important for community and friend networks to fill in the gaps.
III. Literature Review
Researchers have found that informal care, which is defined as “unpaid long-term
care usually provided by a relative or family member,” is fundamental to the healthcare
of the elderly population (Anderson and Hussey 196, 2000). Elderly individuals are those
most in need of long-term healthcare (LTC), which is the most costly form of health care
when administered by hospitals. However, hospice and home health programs are
significantly less costly than hospital or nursing home care. Additionally, research has

17
shown that home health care and hospice care can be substituted for with unpaid informal
care, provided by family and friend networks. Among OECD nations, Yoo et al. (2004)
showed that spousal support in the form of care reduce long term health care spending by
$29,000, and that formal and informal LTC are close substitutes for each other.
Family
According to Cantor (1989), for elderly individuals support from a spouse or a
child is preferred as the cornerstone of the support system. Friends and neighbors
compose the next preferred tier of support, while eventually government and other formal
organizations are ordered last in the hierarchy.
Among the eight industrialized countries in their study, Anderson and Hussey
(1997) found that 50% of the elderly in Japan lived with their adult children, and 10-20%
of elderly in the other seven countries, Australia, Canada, France, Germany, New
Zealand, the United Kingdom, and the United States, lived with an adult child. Van
Houtven and Norton (2008) conducted a study of single elderly individuals and their
children caregivers to study the impact of the hours of care given by children on the
health of their parents. The study found that informal care reduces the need and use of
home health care as well as reduces the likelihood of needing these types of care.
Steinbach (1992) argues that there is strong evidence that informal support
networks and familial ties are the best prevention for elderly from being institutionalized
and claims that lack of social ties are “associated with increased risk of mortality”
(S183). Mortality risk is a factor of declining health, and this study in particular examines
how the health status and mortality risk of individuals relates to their social networks,

18
living arrangements and kinship ties. A similar study conducted by Chow (1983) on the
importance of family for the care of elderly in Hong Kong identifies the fundamental
attributes of family in caring for elderly. The inadequacies of both community and public
support and services would be amplified if it were not for the presence of family and
social networks. Additionally, Chow (1983) found that although the family networks had
begun to erode, family support and family care “remains the most significant factor in
preventing an elderly person from living in poverty” (587). The adverse health effects of
poverty are quite obvious, ranging from lack of adequate nutritional intake to
inaccessibility of health services.
The presence of family support networks is a constant source of money and care,
elements vital to lives of elderly; yet, Kliksberg (2004) identifies that in Latin America
“many families are falling apart, unable to cope with the permanent lack of vital
resources, prolonged periods of unemployment, and the constant threat of economic
uncertainty” (654).
Social Networks
Schoenbach et al. (1986) found an elevated morbidity risk of elderly with the
fewest social network ties, showing that social networks are indicative of the health of
elderly individuals. Their study was based on the Berkman and Syme study of social
networks and mortality in Alameda County, California, and their survey index was
modeled after the Berkman Social Network Index, a measure developed to summarize the
relationship between social support and mortality rate. Though Schoenbach et al. (1986)
conducted their study using data from interviews administered in 1967-1969 and

19
separated the subjects based upon race, their study found interesting and useful results.
The data showed that among white individuals, those who were not married had much
higher risks of mortality.
Steinbach (1992) used the Longitudinal Study of Aging (LSOA). The LSOA
study is a study modeled to determine the how changes in functional status and
companionship affect long term institutionalization and death rates among the aging. The
study then obtained the results that living alone increased the likelihood of
institutionalization by 1.79 times compared to an elderly individual living with a spouse
or others. The participation of elders in social activities decreased the likelihood of
institutionalization by almost 50%. For his study on the predicted likelihood of mortality,
Steinbach (1992) found that all three variables, which includes visits or talks with friends,
social activities, and talking with friends or family, decreased the rate of mortality by
almost 50% as well. Thus, more social interaction prolongs the lives of elderly by
improving health and mental status, prevents their institutionalization, and reduces the
need for public healthcare.
Echoing the importance of social support, Cantor and Little (1985) found that
elderly most commonly associate their quality of life with their ability to remain
independent in their community, therefore residing among family and friends.
Community is a group of individuals with common interests, shared passions and usually
consists of networks and family and friends, and thus is a key factor in improving and
maintaining the quality of life for elderly people. Schoenbach et al. (1986) also showed
that participation in church activities was a factor in lowering mortality risks. The
resulting conclusions were most indicative for the elderly. The emphasis on the

20
importance of family and social networks for quality and length of life among elderly is
evident from the previous research and demonstrates the need for the consistency of these
networks in the lives of the aged.
These studies have focused on either industrialized nations or solely the United
States, whereas my research will provide information about the impacts of informal care
on less industrialized nations in the Latin American and Caribbean context. Latin
America and the Caribbean are regions of increasing interest but most research has not
yet provided much information for the region and has not compared the context of two
different countries in Latin America or the Caribbean.
IV. Theory
Health is an output, much like any other good, that requires inputs to be produced.
The inputs, or factors of health, are fundamental for producing health. Aside from the
input of interest in the study, social capital, the main factors of production for health are
age, wage rate, education, and income. Literature shows that all of these variables are
important inputs to health, which guides the choice for control variables. Therefore, in
my study, I will control for these variables in order to try and prevent a problem of
omitted variable bias.
Grossman (1972) proposes that health can be defined as a capital stock, which
depreciates with age but improves with increased inputs of education. He identifies that
an individual is born with a certain level of health stock, but that this stock depreciates at
an increasing rate, as one gets older. However, individuals can invest in their health
stock, through education and personal choices. At some point, elderly individuals demand
less health capital because the depreciation rates rises. Grossman proposes that any

21
individual chooses their optimal stock of health by equating the marginal efficiency of
health capital to the cost of that health capital, which comes from the cost of investments.
Death says Grossman, occurs when one‟s stock of health falls below a certain level,
which Grossman calls the “death stock” (238).
Supported by Grossman (1972), age is the primary input affecting health. As a
person ages, the deprecation rate of health is likely to increase which is why “the health
of older people is likely to deteriorate faster than the health of younger people” (Folland,
Goodman and Stano, 136). One‟s stock of health, as defined as all inputs to health, will
decrease, as one gets older. Therefore, elderly adults demand more medical care than
younger adults to maintain the same level of stock. Grossman (2000) conducted a study
on health and human capital and found that age has a statistically significant impact on
reducing health status, whereas it also has a statistically significant effect on increasing
health care costs. The individuals in the sample have a range of ages between 60 and 80,
and controlling for age variable in each sample will control for the possible differences in
mean age between the samples.
Wage rate is also a significant input to the health function. A higher wage implies
a higher level of health stock, meaning that if someone making more money gets sick,
their opportunity cost of the days of work they lose is higher than someone who makes
minimum wage but gets sick. Upon retirement, which implies older age, there is an
expectation that an individual will reduce their stock of health because they no longer
make income, and no longer require more „healthy days.‟ Logically, it would seem
realistic that having more income would be positively related to health. However,
research has shown that being rich does not automatically lead to being healthy. The

22
relationship between income and health is unclear because of the many confounding
variables that affect both health and income. Reverse causality may also bias the
relationship between income and health. For example, higher income individuals have the
luxury of buying more health by of taking time off, purchasing gym memberships and
living in safer, less polluted areas. Conversely, healthier individuals can work more and
make more income. The complexity of the income variable makes it hard to distinguish
its actual impact on health status.
Income may provide money for the purchase of medical care and may be the
reason for the positive association between health and income. With income, you can
purchase private institutional care or, instead, one may prefer to substitute formal care
with informal care. Yoo (2004) found that informal LTC is a clear substitute for
institutional care, while formal home care as a complement to informal LTC. Therefore,
lower income individuals may be provided with adequate and less expensive aid when
receiving informal care from a relative or friend.
Education is often correlated to better health due to increased knowledge of the
inputs to health. Two theories have related health and education. Grossman (1972) argues
that higher education leads individuals to take better care of their health, and therefore,
are healthier members of society, requiring less health care. Fuchs (1982) contends that
individuals who want more years of schooling are individuals with lower discount rates,
who look to the future for gains rather than the present.
Along with age, wage rate, income and education, family, friend and community
networks are significant factors for improving and maintaining the health stock of the
elderly.

23
V. Production Function of Health Status and Social Support
Friends, family and community are associated with the health of an individual.
Increased social capital is positively correlated with health status, as social relationships
may relieve stress, provide additional health information (about both preventive
behaviors and general health tips) as well as cause individuals to revaluate their risky
behaviors, such as smoking and drinking. Folland et al. (2010), conclude that, “social
capital improvements lead to health improvements (101).”
The production function demonstrates the relationship between various inputs and
the maximum output that can be attained from the inputs used. However, this study will
focus on the input of social support and health status as the output in order to establish a
relationship between social networks and health status.
The concept of the production function (Figure 1) shows that as inputs increase,
output also increases. However, as the contributions of additional support increase, the
increase in health becomes smaller, causing the production function to eventually level
off and may start to decrease, demonstrating the law of diminishing marginal returns.
This law implies that after a certain level of social support, each additional (marginal)
unit of social support produces less and less output, and may eventually turn negative.
Point A and point B demonstrate two possible points on the production function
where Cuban or Argentina might lie. The study will also analyze where Cuba and
Argentina lie on the production function. The slope of the production function measures
the marginal benefit of each additional unit of input, in this case of social capital. The

24
analysis of the data will measure the slope, but we expect that the slope to be positive,
indicating a positive relationship between social capital and health.
In this study, the production function of the relationship between social capital as
the input and health as the output will be explored in depth, with a comparison between
the production function of health for Cuba and the production function of health for
Argentina. Is the production function for Argentina different than the curve for Cuba?
Does social support have a different impact on health status in Cuba than on health status
in Argentina?
Figure 1 assumes the same production function for Cuba and Argentina, whereas
Figure 2 and Figure 3 show two different production function graphs, showing
differences between Cuba and Argentina. In Figure 2, the impact of social support on
improving health status in Argentina is greater than the impact of social support on health
status in Cuba, as the total product curve for Argentina lies above the total product curve
for Cuba. Figure 3 displays the opposite.
Another main goal of the paper will be to compare the differences in the size of
the marginal impact of social capital on health in Argentina and the size of the marginal
impact of social capital on health in Cuba.
The theoretical relationship between health and social support is a fundamental
factor in evaluating production of health. There are many other additional factors that
impact health status that relate to environmental, demographic, political and economic
events. Originally, I was anticipating that social support would have a larger marginal
impact on the Argentine sample due in large part to the unstable political and economic
climate in the country. As discussed previously, Argentina‟s recent neoliberal reforms

25
and economic recession had devastating impacts on the entire Argentine population.
Moreover, Argentina is historically a nation of vast income inequalities, thus the
economic problems only added to the already present inequities. Therefore, intuitively, it
would seem that family and friend networks would become increasingly important for
both financial and psychological support. Additionally, the highly fragmented health care
system present in Argentina may be a cause for the need of informal care, especially for
the elderly.
In Cuba, as the social government guarantees health care and education, I
expected family and friend support to have less of an impact on health status. Through
various reforms, the socialist government provided schooling and health care for all
citizens, as well as supported a more equal and progressive role in society for women.
From this historical background, it would seem that life in Cuba is more certain and
provided for by the government, whereas life in Argentina is more unstable and less is
government provided, showing a stronger need for informal networks.

26
Total Product Argentina
Total Product Cuba
Health Status
Social Support
Figure 2: Total Product of
Social Support
Social Support
Figure 1: Total Product of
Social Support
Total Product Cuba and Argentina
A
Health Status
B

27
Marginal Product Curve
Figure 4: Diminishing Marginal
Product of Health
Total Product Argentina
Total Product Cuba
Social Support
Health Status
Figure 3: Total Product of
Social Support

28
VI. Data
The data source is the Survey on Health and Well-Being of Elders (SABE) from
1999-2000, which has a sample of 10,656 individuals aged 60 years and older residing in
private households occupied by permanent dwellers in each of the cities of interest:
Buenos Aires (Argentina); Bridgetown (Barbados); Sao Paulo (Brazil), Santiago (Chile);
Havana (Cuba); Mexico City (Mexico) and Montevideo (Uruguay). Because of the
similarly aging populations and contrast in formal LTC support, I will focus on the
Buenos Aires and Havana samples in which there were 1043 individuals in the Buenos
Aires sample and 1905 individuals in the Havana sample.
The study used a general sampling design in order to establish comparability
between countries. In both Argentina and Cuba, samples were chosen in three selection
stages. The Primary Sampling Unit (PSU) selected a predetermined number of PSUs each
selected with a probability proportion to the household distribution within each stratum.
The sampling used for the PSU came from census radiuses, households, census sector,
Basic Geostatistical Area (AGEB), and segments (blocks of 8 households).The second
stage (SSU) and third stage (TSU) were selected with equal probabilities within each
chosen PSU. The SSU was selected for from households, one individual per 60+
households, sections (about 5 households) or blocks. The TSU, when applicable, was
selected for using one individual 60 years or older per household with equal probability
of being selected.

29
Stratification of the clusters of each city varies because some studies were
stratified based upon geography and socioeconomic conditions, whereas some were
stratified solely based upon geography. In some cities, oversampling occurred.
In Buenos Aires, no oversampling occurred and stratification was based upon
geographic and socioeconomic factors. There were two main regions: The City of Buenos
Aires and Grand Buenos Aires with six socioeconomic strata in total. The sampling units
were the census radius (300 households) for the PSU, households for the SSU and one
individual 60+ per household for the TSU. The selection of the older person was a
random selection of one person 60 years or older per household.
In Havana, oversampling did occur as one individual 80 years or older was always
selected and if no person of that age bracket was available, a person 60 years or older was
selected with equal probability. The stratification in Havana was only based on
geographic region, with 15 municipalities in total. Basic Geostatistical Area (AGEB)
(about 180 households) was used for the PSU sampling unit, sections (about 5
households) was used for the SSU sampling unit and one person 60+ living in each
household was used for the TSU sampling unit. Random selection was also used.
The data collection was based upon interviews of target individuals in households
but a variety of interview procedures occurred due to different funding and time variables
in each city of interest.
Estimates of sampling error and design effects required knowledge of sampling
weights, stratification and the nature of the PSUs and their clustering. As identified in the
SABE study, “a limited but strategic set of characteristics and estimated associated
standard errors and design effects was chosen for total samples as well as by age group

30
(all ages 60 and above and those over 75) and sex (all, males and females)” (SABE
Report, 37. 2000) As the study did not over sample on the basis of social support, I do not
need to worry about correcting the sampling design when I do my analysis.
VII. Descriptive Statistics: Sample
As mentioned before, Argentina and Cuba maintain many similarities as well as
many differences in the composition of their populations. Therefore, I ran mean
comparison tests for a variety of characteristics the two samples and the significance of
the results will be reported below.
In the Cuban sample, the average age of the respondents was 71.97 years of age,
and in Argentina the mean age was 70.74 years of age, a statistically significant
difference. Note, however, that the sample is only of elderly individuals 60 years or older,
which cannot be compared to the entire Cuban or Argentine population. Additionally, this
may be due to the oversampling of those 80 years and older in Cuba. There is no separate
data on the population statistics of just the elderly population in Argentina and Cuba.
However, we can establish that the sample is reasonable, and some comparisons have
been drawn.
The mean number of children may appear numerically similar between Cuba and
Argentina: 2.94 in Cuba and 2.47 in Argentina, however the difference is statistically
significant. As children are the primary care givers for their elderly parents, the two
samples are relatively well matched, although one-half of a child on average may lead to
more available and rested caregivers. Additionally, the 2-3 children that each elderly

31
individual has are an extra set of hands, compassion and care, encouraging informal care
networks to exist.
In terms of education, the Cubans in the sample are more educated than the
Argentines. The sample mean for Cuba is 7.58 years and 7.16 years for Argentina, but the
difference is not statistically significant. The employment rates for each sample are
statistically significantly different. 24.2% of the Argentine sample currently working and
18.5% of the Cuban sample currently working. Almost ¼ of the Argentine sample works,
which can speak to the need to work, the younger average age of the sample, and the
higher reported mean of good health status in the Argentine population.
Further emphasizing the discrepancy in health insurance between Argentina and
Cuba, 17.3% of the respondents in the Argentine sample do not have any form of health
insurance while health insurance in Cuba is universal.
Related to the study conducted by Van Houtven and Norton (2008), 17.3% of the
respondents from the Cuban sample identified their main helper as one of their children,
stepchildren or grandchildren, showing that a large percentage of help comes from the
next generation. In the Argentine sample, 9.4% of the respondents identified their
children or grandchildren as their primary helper, and 1.4% indicated their son or
daughter- in-law to be their primary helper.
Evaluating the key dependent variables allows a comparison of the samples. One
of the key dependent variables in the study, health status, is measured as equal to 1 if
health status was indentified to be good, very good or excellent, and 0 otherwise. In
Argentina, the sample mean was 0.65, indicating that 65% of the respondents rated their
health as good, very good or excellent. The mean for the Cuban sample was significantly

32
lower at 0.43, showing that less than half of the respondents believed to be in good, very
good or excellent health. The difference between the two samples is statistically
significant. Interestingly, in the population data, Cubans live longer and have a higher
sample mean age but believe they are in worse health. Life satisfaction, a second
dependent variable in the study, is measured as equal to 1 if the respondent is satisfied
with their life and equal to 0 if the respondent is not generally satisfied with their life.
The means for Argentina and Cuba were different, 0.76 and 0.82 respectively, a
statistically significant difference. Life satisfaction is usually an indication of overall
wellbeing, and thus the numbers show that both groups of elders are living a pleasant and
fulfilling life.
Similarly, a possible indication of satisfaction could be companionship, and the
two countries show high rates of companionship. Companionship in this study is
identified as living with another person, a spouse, child or another kin member. In the
Argentine sample, the mean value was 0.73 and in Cuba the mean value was 0.89, a
difference that is statistically significant. Cuba‟s value is a large majority, which
undoubtedly relates to the housing shortage Cuba is currently experiencing. The variable
measuring the number of family members living with the respondent is similar for
Argentina and Cuba. Cuba‟s is slightly higher at 3.5 members in one house compared to
Argentina‟s 2.4 members living in one house. The extra member for the Cuba sample
may be related to the higher rate of help received in the Cuba sample.
The family help variables are generally very similar between the two countries,
the only exception being the variable measuring help from a child, a statistically
significant difference between the two countries. In Cuba, the child help variable has a

33
mean of 0.16, much higher than the value for Argentina of 0.04. This may also highlight
the housing crisis, which causes many elders to be without homes and therefore in need
of assistance from their family, namely their children. The community help variables are
also similar between the two samples, and especially evident are the extremely high
means for no community help received, at 0.92 for Argentina and 0.94 for Cuba. The
only variable of any noticeable difference is the variable measuring help from a religious
institution. In Cuba the mean is 0.019, slightly higher than the mean for Argentina of
0.011.
Lastly, the no help received are both very high, at 0.88 for the Argentina sample
and 0.74 for the Cuban sample, reflecting the percentage of the sample that did not need
help. Interesting is that every resident of Cuba has government provide health insurance,
yet 26% of the sample received some kind of informal care. In Argentina, universal
healthcare is not granted, but the rate of informal care is 12%, which is much lower.
Among those who need help, 62.7% of the Cuban sample receives help from their
children whereas only 36.1% of the Argentine population receives help from their
children, a difference that is statistically significant. Spousal care makes up 15.5% of help
in the Cuban sample and 23.8% in the Argentine sample and the difference is also
statistically significant. Grandchildren are the primary caregivers for 6.3% of the Cuban
respondents and 13.9% of the Argentine sample, statistically significantly greater in
Argentina. Siblings are not identified as a helper in Cuba but 4.9% of the Argentine
sample receives help from a sibling. Lastly, parents make up 0.6% of those who help in
Cuba but are not identified as helpers in Argentina. One interesting observation is that
help from a paid source in Argentina is statically significantly greater than in Cuba. In

34
Cuba, only 1.4% report getting assistance from a paid source while 32.9% of Argentine
respondents report getting help from a paid source. This may relate to the economic crisis
in Cuba, and the lasting effects of the U.S. blockade. The Cuban government spends
significantly less on health care than the Argentine government, as well. Another case is
that, due to the housing shortage, informal care is more available in Cuba and therefore
there is no need for paid care.
The percent of respondents receiving help from a religious organization is 3.5% in
Cuba and 2.5% in Argentina. The senior citizen center is a community outlet that helps
2.0% of the sample in Cuba and 2.6% of the sample in Argentina and the social-welfare
organization helps 1.6% of the Cuban sample and 6.5% of the Argentine sample, which is
the only difference among the community help variables of statistical significance. When
pooling all of the community help variables together, the mean for Cuba was 0.062, while
the mean for Argentina was 0.071, a difference that was not statistically significant.
Among those who received help, the mean for Cuba was 0.088 while the mean for
Argentina was 0.123, a difference that was also not statistically significant.
Among the respondents in the Cuban sample, 94.5% reported living with
someone else, whereas only 70.5% of the Argentine respondents lived with someone else,
a difference that is quite large and statistically significant. Once again, this can be related
to the housing crisis the Cuba has been experiencing for the past 30 years. Additionally,
we can also infer that as the Cuban sample is older, the need to live with someone else is
greater.

35
VIII. Methods and Hypothesis
Because the outcome variables are binary, if Ordinary Least Squares was used
there would be heteroskedasticity. I have chosen to use probit regressions, which do not
directly produce marginal effects, but what is presented in the tables has been converted
to the marginal effects.
I ran separate probit regression analyses for Cuba and for Argentina. Equation 1
shows the first probit regression that was used in the study.
[1] Yi = β0 + β1LIVE + β2FAMILYSUPPORT + 3FRIENDSUPPORT +
4COMMUNITYSUPPORT + εi,
where β0 – β4 are the marginal effects to be estimated by measuring the effects of different
types of support in relation to the omitted category of paid support. X is a vector of all
other confounding variables and where εi is an error term. is a vector of all of the other
controls: age, education, type of health insurance, and work status, and Yi represents all
of the health outcomes of interest. These outcomes are: general health status, life
satisfaction, happiness and anxiety. These outcomes were examined separately as well. I
compared each country‟s separate subsamples to see how the measured impact of living
arrangements and social networks for Cuba will compare to that of Argentina. I ran
statistical tests to see if the marginal effects differ and draw comparisons and conclusions
based upon the results.
I will test a separate probit regressio of the effect of social support measures on
the full sample, regardless if the individual needed help or not. As displayed in Equation
2, the variables I will be testing are companionship, number of living children, number of

36
living children squared, total number living in the house and total number living in the
house squared. Both of the squared terms are used to test for increasing marginal returns.
[2] Yi = β0 + β1LIVE + β2NUMBERLIVINGCHILDREN +
3NUMBERLIVINGCHILDREN2+ 4TOTALINHOUSE +
5TOTALINHOUSE2+ εi,
I hypothesize:
[1] Ho: βj = 0 HA: βj > 0
where j represents the marginal effects of different measure for family and social
networks.
I will also be testing the following hypotheses:
[2] Ho: j = k
HA: j ≠ k
where j and k represent two different types of support, and
[3]
Ho: jCuba = jArgentina
HA: jCuba ≠ jArgentina
where j again represents the marginal effects of different measures for family and social
networks.
Hypothesis [2] is testing the size of the different family and friend support
networks and whether or not family and friend support networks are interchangeable.
Hypothesis [3] is testing whether or not the impact of social support on health differs
between Argentina and Cuba.

37
Based upon the various inputs important to health other than social capital, social
capital and health status may have complicated interactions. Environmental factors,
behavior, and schooling may have a larger influence on health than actual health care
expenditures. However, I will form two hypothesis based upon my observations.
As the health expenditures in Cuba are much lower than in Argentina, this may
lead to the belief that informal care is more important in Cuba than in Argentina.
However, since the entire Cuban population is provided with health insurance,
whereas universal health insurance is not granted in Argentina, this may indicate that
informal care is more important in Argentina than in Cuba. Therefore, the impact of
social support might be more significant in Argentina than in Cuba.
Additionally, the present housing crisis in Cuba may mean that Cubans receive
more support from family because of the need to live together, which would make social
support more significant in Cuba than in Argentina. Single person households, with
women as the primary lone parent, have increased in both countries but have increased
more so in Cuba. This may then imply that daughters have less time and fewer resources
to take care of their elderly parents, which may lead to less informal care in Cuba.
Factors other than expenditures on health care may contribute significantly to
health status, including behavior, labor patterns, schooling and the environment. This
demonstrates that it is difficult to model health as an output, given the variety of inputs.
I am aware of the possibility for survey bias in this study. The help variables are
collected in the data through questions that inquire about help from family and friends.
Obviously, only those who are not healthy are the ones in need of help, thus, the set up of
the survey may have created some collection bias. Additionally, I am aware of the
38
possibility of reverse causality bias. Therefore, I focus only on the sample needing help.
The focus of my study is how social support impacts health, however, it is possible that I
am seeing the relationship between health and social support in the opposite direction.
Healthier people are more likely to get married, maintain a close group of friends and be
generally better liked. Therefore, what I measure may be a correlation but not necessarily
the causal impact but I will be controlling for many of the variables that may also impact
health status of individuals. My discussion of the results will acknowledge the potential
bias.
IX. Results
Results: Argentina
Good Health
Isolating just those individuals who receive help sheds light on the impact of
different types of help on the elderly. The models that include only those individuals that
receive help (Table 2) tell a different story about the data than using the full sample
results (shown in Appendix A for comparison purposes). When looking at the
coefficients on the independent variables of interest (type of help) and examining types of
non-paid help, almost all of the family help variables positively impact the dependent
variable (good health), signifying that they have a positive effect on health status, relative
to receiving paid help. In model 2, the coefficient on the child help variable is 0.107,
which demonstrates that relative to paying for a helper, getting help from one of your
children increases your health status by 10.7 percentage points. Although negative, the
coefficient on health from a spouse is nearly 0, showing no real impact.

39
Interestingly enough, the variable encompassing help from other members of the
family network (other extended family) has a negative impact on the health status of the
individuals, also displaying that there is some difference in the impact of help depending
on which member of the family is helping. The coefficient on this variable is negative
(-0.211) which explains that the percentage of those reporting good to excellent health
drops by 21.1% if a family member other than those mentioned in the survey is the
caregiver instead of paid help.
However, none of the coefficients on the family help variables are statistically
significant, as the p-values on each coefficient are very large. Once someone receives
help, the type of family help does not matter so much. Additionally, when running the F-
test the results clearly demonstrate that there is no joint significance of the family help
variables, as seen by the small F-statistic.
When adding in the community help variable, the estimated impact of family help
does change very much. In model 1, the children help, siblings help, non relative helps
and grandchildren help variables are all positive and have very similar coefficients to
those coefficients on the family help variables in model 2. Relative to receiving help from
a paid helper, receiving help from any of the above family members will positively
impact the health status of the elderly family member. The spousal help variable becomes
positive, when adding in the community help variables. The coefficient on spouse shows
a lesser marginal impact on health status as compared to the child help variable, but still
increases the probability of being in good to excellent health by 5.8 percentage points.
This finding may demonstrate that spousal help is preferred only to paid help, not
to any other forms of help. One interesting observation is that the coefficient on other

40
family members help is once again strongly negative; demonstrating that compared to
receiving paid help, receiving help from a family member not included in the survey
lowers the individual‟s health status by 21.5 percentage points.
Community help, which encompasses help from all of the non-family networks in
the survey, is strongly negative and statistically significant, showing that receiving help
from a community source significantly lowers an individual‟s probability of being in
good to excellent health by 36.4 percentage points.
The marginal effects of private insurance in models 1 and 2 are positive (0.305
and 0.308) and bigger than family and social variables, but are not statistically
significant. This may be due to the fact that there are fewer observations in the
regressions using model 1 and 2. Nonetheless, observing these results demonstrates that
both formal sector and informal sector help are beneficial to the elderly in times of need.
These results suggest that for those individuals who receive (and need) help,
getting that help from a family or kin member is more effective for improving health
status than receiving that help from a paid professional. Although other variables may be
more useful for evaluating the health status of elderly, there is some evidence that family
care and the type of family care has an impact on the health status of the elderly.

41
Life satisfaction
Another measure of health is being satisfied with and enjoying life. Table 3
presents only the observations of those whom receive help. The marginal impact of the
family help variables for spouse, sibling, grandchild and other family members help are
negative, demonstrating that even among those individuals who receive help, getting help
from some members of the family negatively impacts their satisfaction with life,
compared to receiving help from someone who is paid. This may illustrate that elderly
individuals feel embarrassed or helpless when they receive help from people they know,
but do not have the same reaction to receiving help from someone who is paid because it
is not a personal, kin relationship. In model 2, however, the marginal impact of child help
is 0.201, which may explain that elderly do feel more life satisfaction when those closest
to them take time to help them with their needs. The marginal effect of child help means
that when a child helps their elderly parent, the probability that the elderly parent
expresses satisfaction with life increases by 20.1%. However, when the community help
variables is dropped from the regression (model 1), the marginal effect of sibling help
becomes slightly positive (0.006). However, the impact of sibling care giving in both
models is very small; therefore it does not have much of an impact on life satisfaction.
The community help variable is positive, although not statistically significant.
Receiving support from a community source increases the probability that an individual
will be satisfied with life by 15.2 percentage points. The marginal impacts of private
insurance, in Table 3, the marginal effects on private insurance in model 1 is 0.421, and
the coefficient on private insurance in model 2 is 0.416. These marginal effects

42
demonstrate a 42 percent probability increase in life satisfaction when an elderly
individual has private health insurance. Once again, the private insurance variable may
also include the impact of income on the dependent variable (life satisfaction), as higher
income may lead to a higher probability of being satisfied with life.
Happiness
Related to life satisfaction, is happiness of the elderly individual. Table 4 displays
the results for the regressions of social support on happiness. Happiness is affected
differently by each of the family help variables, as seen in Table 4. Children, siblings and
friend aid actually reduce happiness by probability of 8.5%, 4.3% and 1.7% respectively.
Spousal support and other family support increases the probability of being happy by
22.5 percentage points and .5 percentage points, respectively. Spousal support, perhaps,
is already a support network that is built in and elderly members may not feel as helpless
when receiving support from a spouse. Additionally, living with someone else increases
the likelihood of being happy by 9.2 percentage points.
Community support increases the likelihood of being happy by 23.8 percentage
points and is statistically significant. Receiving help from a community source may make
an individual feel less helpless because receiving help from a community source is less
individualized and more group oriented.
Anxiety
On the opposing side, anxiety is an outcome variable that demonstrates an elderly
individual‟s stress level, which undoubtedly impacts health status. In Table 5, although

43
none of the family or community help variables show statistical significance, most do
negatively affect anxiety levels. The marginal impact of having child help increases the
probability of having anxiety by 16.2%. Having siblings, other family members help or a
friend help also increases anxiety levels. Spousal support and grandchild support,
however, reduce the probability of having anxiety by 13.3 and 2.9%. Companionship also
increases the probability of having anxiety by 17.5%. Interestingly, a one unit rise in the
community help variable actually reduces the probability of having anxiety by 1.3
percentage points.
Results: Cuba
Health
Similar to Argentina, Table 2 displays the results for the regression of the social
support variables on health status. Each of these variables has a positive marginal impact
on the health status of the elderly in the sample. The results in model 1 show that, relative
to having a paid helper, having a child as the primary caregiver increases the probability
of being in good/excellent health by 9.4%. Having a spouse help increase the probability
of being in good/excellent health by 7.9%, having a grandchild help increases the
probability of being in good to excellent health by 12.0%, having a parent or parent-in-
law help increases the probability by 40.4%, having any other family member help
increases the probability of being in good to excellent healthy by 26.9%, a value that is
statistically significant, and having a friend help increases the probability by 5.9%. In
addition, community help variable has a positive marginal impact on health status and is
statistically significant. The companion variable, a measure of living alone or with a

44
companion, also shows a positive marginal impact on health status, showing that living
with someone else increases the probability of being in good to excellent health by
13.1%.
When omitting the community help variables, the marginal effects of the family
help variables do not change by much, therefore showing both the robustness of the
results and the true impact of social support. Running the F-test on both regressions
showed that the family support variables were not jointly significant.
Life Satisfaction
Once again, life satisfaction is an outcome variable related to health status. Table
3 displays the results for the regression of social support on life satisfaction. In this case,
some of the family and community help variables have a negative marginal impact on life
satisfaction, leading to a possible conclusion that receiving help from any source may
make an elderly individual feel helpless and weak. However, it appears that having those
closest to the elderly, children, spouse, or other family, positively impacts life
satisfaction, whereas having a friend help negatively impacts the probability of being
satisfied with life by 5.4%. Living with a companion increases the probability of being
satisfied with life by 8.4%, a possible indication of the impact of the housing shortage.
Without a companion to live with, individuals may be homeless. The coefficient on
community help is negative which shows that, unlike the regression for Argentina,
receiving help from a community source reduces the probability of being satisfied with
life by 4.4 percentage points.

45
Once again, omitting the community help variables make very little difference to
the results. Running the F-test on the combine effect of the family support variables
showed that the support variables were not jointly significant.
Happiness
Related to life satisfaction is the happiness of the elderly individual. Table 4
displays the results for the regressions of social support on happiness. The results for this
regression are interesting in that most of the support variables negatively impact
happiness. Receiving help from a spouse is the only family member that has a positive
marginal impact on happiness. Companionship positively impacts happiness, showing
that living with someone increases the probability of being happy by 12.2 percentage
points. In the regression with the community help variable, companionship is statistically
significant at the 10% level, showing that it has a statistically significant positive impact
on happiness. Community help, however, has a negative marginal impact on happiness,
showing that receiving help from a community source reduces the probability of being
happy by 4.7 percentage points. The F-test results shows that, in both regressions, the
family support variables did not have a significant impact on happiness.
Anxiety
Like Argentina, anxiety, a component of poorer health, is negatively impacted by
some of the support variables. Table 5 displays the results for the regression of social
support on anxiety. Receiving help from a child, spouse or parent shows a marginal
increase in anxiety, whereas receiving assistance from a grandchild, another family

46
member or a friend actually reduces anxiety. It is interesting that receiving help from a
child or spouse has a positive marginal impact on life satisfaction and good health but has
a negative impact on anxiety. Part of the difference in the measure of impact on anxiety is
the time frame of the question or the perceived answer to the question may differ.
Respondents were able answer yes if they had experienced anxiety at one time or another
in their life, a very general time frame. Once again, running the F-test to test the joint
significance of the family support variables showed that they did not have a significant
joint impact on anxiety. Companionship has a positive marginal impact on anxiety,
meaning that it increases the probability that an individual will be anxious, and is
statistically significant in model 1. The community help variable also increases the
likelihood of having anxiety.
Statistical Differences Between Argentina and Cuba
Statistical tests of the effects of social support on the dependent variables in
Argentina and Cuba were conducted to see if the impact differed. For many of the social
support variables in the regression including help from a community source, the
statistical test showed that the effects of social support on health status, life satisfaction,
happiness and anxiety were similar for Cuba and Argentina. However, for the support
care given from other members, the effect on health status and life satisfaction was
different between Argentina and Cuba. The community help variable had a different
impact on health status and happiness in Argentina and Cuba, while the variable help
from a friend had a different impact on anxiety between the two countries.

47
In the regression dropping the community help variable, the effect of help from
another family source had different impacts on life satisfaction and anxiety in Cuba and
Argentina. In Cuba, having another family member has a caregiver had a positive effect
on life satisfaction as well as reduced anxiety in Cuba, while having the opposite impact
in Argentina.
Possibly, the small sample size may have an impact on the statistical findings but
it may also relate to differing family structures in Cuba and Argentina. Once again, the
present housing shortage in Cuba may indicate that more extended families live together
than do in Argentina.
Social Support: Argentina and Cuba
The regressions in Tables 6-9 measure the marginal impacts of types of support
on the full sample for each country using different measures of social support. Each
sample is affected differently by the variables in the regression. In Argentina,
companionship has a negative marginal impact on health status, whereas in Cuba, living
with someone has a positive marginal impact on health status. Similarly, the total number
of people in the house has a negative marginal impact on Argentina, but a positive
marginal impact on Cuba. This may relate to the housing crisis, and the absence of single
person households because of the lack of housing. Having greater numbers of children,
however, has a negative marginal impact on health in both samples, which may relate to
the presence of children as primary helpers. The square of total living children has a
positive marginal effect, which shows increasing returns to the number of children.

48
The probit regression run on life satisfaction shows that having more children has
a positive marginal impact on life satisfaction in Argentina and in Cuba. This may mean
that having more children means more loved ones around, which can improve one‟s
satisfaction with life. In Cuba, life satisfaction is maximized with 5.5 children living. The
squared term total living children is negative, which means that it displays decreasing
marginal returns. Companionship (living with someone) has a positive marginal impact
on life satisfaction in Cuba but a negative marginal impact on life satisfaction in
Argentina. This may again relate to the housing crisis in Cuba. Lastly, the variable total
in house shows a positive marginal impact on life satisfaction. This may mean that being
around more people helps elderly feel more fulfilled, and less lonely. Total in house
squared, like number of children squared, displays decreasing returns.
Anxiety has a positive correlation with total living children, which means that
having more children increases the probability that an elderly will experience anxiety.
With more children, one may have more to worry about. Companionship has a negative
correlation with anxiety in the Argentine sample, but a positive correlation in the Cuban
sample. This means that living with someone, in Argentina, actually decreases the
probability of having anxiety, whereas living with someone in Cuba increases the
probability of having anxiety. The same impact on anxiety is seen for the total in house
variable.
Lastly, happiness is positively impacted by total living children. This means that
having more children has a positive marginal impact on happiness, in both Argentina and
Cuba. Companionship also has positive marginal impacts on both samples. Total number

49
in the house has a positive marginal impact on happiness in the Argentine sample, but a
negative marginal impact on happiness in the Cuban sample. 1
X. Discussion
The original expectations for the study were that social support and informal care
networks would have a larger impact on health status, life satisfaction, happiness and
anxiety in Argentina compared to Cuba. However, the results show that there was
generally a more significant and positive impact of informal care in Cuba. The present
housing shortage in Cuba may suggest that Cubans receive more support from family
because of the need to live together, which would make social support more significant in
Cuba than in Argentina. Moreover, although universal health care is provided in Cuba,
expenditures on health care are much lower in Cuba than in Argentina. The lower overall
expenditures could explain the greater need for informal care in Cuba. This may point to
the efficiency, adequacy and allocation of resources in each health care system. It is also
important to note that, although a Socialist government does provide all basic amenities
equally for all citizens, the Cuban government restricts its citizens from participating in
many facets of life. Many Cubans revert to hawking or working in the underground
economy in order to earn enough income to put food on the table, let alone provide
informal care for their elderly family members (Archibold, 2011). Cuba is also home to
many tourist amenities, including five star hotels, yet these luxuries are denied to Cuban
citizens. Therefore, it is clear that many other factors are involved surrounding the need
for informal care networks.
1 For description of robustness and goodness of fit tests and full description of full sample results see
Appendix A.
50
Investigating the impact of social networks and living arrangements on the health
status of the elderly can highlight important policy and family implications that may help
the lives of elderly and the future of long term health care in the world. Although there is
only some statistical significance seen in the results, family support seems to be both
helpful and preferred, as both a substitute and complement to formal care. However, the
entrance of women in the labor force, shortage of housing and economic uncertainties
may erode informal care networks. Therefore, this demonstrates that the governments
need to be aware of the gaps present in informal care networks. Through the coordination
of various care networks, adequate care can be provided to the elderly in both countries,
as well as around the world. Policies granting compensation incentives for families that
provide informal assistance as well as support groups for caregivers are possible steps
that governments can take to ensure that both the elderly and their caregivers are
provided for. Although this may increase spending, long run expenditures on
institutionalization will decrease, with fewer and prolonged institutionalizations of
elderly. By investigating these variables and their relationships, more effective and
efficient methods of elderly healthcare can be created to aid in the care of elderly
individuals and demonstrate the need for certain types of care network. More qualitative
work should be done on how support is given and what comprises the support as well as
work investigating the efficiencies of the formal health care systems. Extended family
networks should also be evaluated and compared among countries in the Latin American
and Caribbean region. Additionally, the constant change and advancement of the world,
and the growth of the Latin American and Caribbean region, suggests that more updates
studies need to be done the in region. Once again, my research will not only contribute to

51
the health economic field of study, helping to make important implications about health
care policies and programs, but it will also shed light on a new region of study, one that is
not an industrialized world power like the United States and will therefore help expand
the field of study.

52
References
Adams, Bert N. and Jan Trost, eds. “Families in Cuba: From Colonialism to
Revolution” (414-439). In Adams, Bert N. and Jan Trost, (Eds.) Handbook of
World Families. Thousand Oaks, California: Sage Publications, 2005a.
Adams, Bert N. and Jan Trost, eds. “The Family in Argentina: Modernity, Economic
Crisis, and Politics” (391-413). In Adams, Bert N. and Jan Trost, (Eds.)
Handbook of World Families. Thousand Oaks, California: Sage Publications,
2005b.
Anderson, Gerard F. and Peter Sotir Hussey, “Population Aging: A Comparison Among
Industrialized Countries,” Health Affairs 19:3 (2000): 191-203.
Antonucci, Toni C. and Hiroko Akiyama. “Social Networks in Adult Life and a
Preliminary Examination of the Convoy Model,” Journal of Gerontology 42:5
(1987): 519-527.
Archibold, Randal C. "In a Changing Cuba, Many Remain Skeptical." New York Times,
18 Apr. 2011. Accessed 19 Apr. 2011 at
<http://www.nytimes.com/2011/04/19/world/americas/19cuba.html>.
Cantor, Majorie H. “Social Care: Family and Community Support Systems.” Annals of
the American Academy of Political and Social Science 503 (May, 1989): 99-112.

53
Cantor, Majorie H., and Virginia Little. 1985. “Aging and Social Care.” In Robert
Binstock and Ethel Shanas (Eds.), Handbook of Aging and the Social Sciences.
New York: Van Nostrand Reinhold
Cerrutti, M. "Economic Reform, Structural Adjustment and Female Labor Force
Participation in Buenos Aires, Argentina." World Development 28.5 (2000): 879-
91. ScienceDirect.
Coburn, David. “Income inequality, social cohesion and the health status of populations:
the role of neo-liberalism.” Social Science & Medicine 51 (2000): 135-146.
Elsevier Science, Ltd.
Chow, Nelson Wing-Sun. “The Chinese Family and Support the Elderly in Hong Kong.”
The Gerontologist 23:6 (1983): 584-588.
Folland, Sherman, Allen C. Goodman, and Miron Stano. "Demand for Health Capital."
The Economics of Health and Health Care. 6th ed. Boston: Prentice Hall, 2010.
136-40.
Folland, Sherman, Allen C. Goodman, and Miron Stano. "Hospitals and Long Term
Care." The Economics of Health and Health Care. 6th ed. Boston: Prentice Hall,
2010. 294-96.
54
Fried Bruce J. and Laura M. Gaydos, eds., World Health Systems: Challenges and
Perspectives (Chicago: Health Administration Press), 2002.
Fuchs, Victor R. (1999). “Health care for the elderly: How much? Who will pay for
it?” Health Affairs, 18(1): 11-21.
Gasparini, Leonardo. "Income Distribution Changes in Argentina: A Characterization
through Microeconomic Decompositions." Presentation. The World Bank Group,
2 Oct. 2002. Accessed 6 Mar. 2011 at
<http://info.worldbank.org/etools/bspan/PresentationView.asp?EID=186&PID=3
70>.
Grossman, Michael. "The Human Capital Model." In Handbook of Health Economics.
In ed. A.J. Cuyler and Joseph P. Newhouse. Vol. 1, Part 2. Amsterdam: Elsevier,
2000. 347-408.
Grossman, Michael. "On the Concept of Health Capital and the Demand for Health."
Journal of Political Economy 80.2 (1972): 223.
Grossman, Michael. 1972. The Demand for Health: a Theoretical and Empirical
Investigation. New York: National Bureau of Economic Research; The National
Bureau of Economic Research. 1972. 3 Mar. 2011.

55
Gehlert, Sarah, Dana Sohmer, Tina Sacks, Charles Miniger, Martha McClintock and
Olufunmilayo Olopade. “Targeting Health Disparities: A Model Linking
Upstream Determinants to Downstream Interventions.” Health Affairs 27:2
(2008): 339-349. Health Affairs.
Jennissen, Therese, and Colleen Lundy. "Women in Cuba and the Move to a Private
Market Economy." (2001). School of Social Work, Carelton University, 23 May
2001.
Keppel, Kenneth, Linda Bilheimer, and Leda Gurley. “Improving Population Health And
Reducing Health Care Disparities.” Health Affairs 26:5 (2007): 1281-1292.
Health Affairs.
Kindig, David A. Purchasing Population Health: Paying for Results. Ann Arbor:
University of Michigan, 1997.
Kliksberg, Bernardo. “Examining myths and truths in public social policy: the Latin
American case,” International Review of Administrative Sciences 70:649 (2004):
649-664.
Kovner, Christine Tassone, Mark Mezey and Charlene Harrington, “Who Cares for Older
Adults? Workforce Implications Of An Aging Society.” Health Affairs 21:5
(2002): 78-89.

56
Pelaez, Martha, Alberto Palloni, Cecilia Albala, Juan Carlos Alfonso, Roberto Ham-
Chande, Anselm Hennis, Maria Lucia Lebrao, Esther Lesn-Diaz, Edith Pantelides,
and Omar Prats. SABE - Survey on Health, Well-Being, and Aging in Latin
America and the Caribbean, 2000 [Computer file]. ICPSR03546-v1. Ann Arbor,
MI: Inter-university Consortium for Political and Social Research [distributor],
2005. doi:10.3886/ICPSR03546
Mechanic, David. “Disadvantage, Inequality, and Social Policy.” Health Affairs 21:2
(2002): 48-59.
Merlis, Mark. “Caring for the Frail Elderly: An International Review.” Health Affairs
19:3 (May/June 2000): 141-149.
Mesa-Lago, Carmelo. Growing Economic and Social Disparities in Cuba: Impact and
Recommendations for Change. Rep. Miami: Cuba Transititon Project, 2002.
Institute for Cuban and Cuban-American Studies, 2002.
Rice, Thomas H. The Economics of Health Reconsidered. 2nd ed. Chicago: The Health
Administration Press, 2002.

57
Schoen, Cathy, Robin Osborn, Michelle M. Doty, David Squires, Jordan Peugh, and
Sandra Applebaum. “A Survey of Primary Care Physicians In Eleven Countries,
2009: Perspectives On Care, Costs, And Experiences.” Health Affairs: w1171-
w1183.
Schoenbach, Victor J., Berton H. Kaplan, Lisa Fredman, and David G. Kleinbaum,
“Social Ties and Mortality in Evans County, Georgia,” American Journal of
Epidemiology 123:4 (1986): 577-591.
Shaw, James W., William C. Horrace, and Ronald J. Vogel. “The Determinants of Life
Expectancy: An Analysis of the OECD Health Data.” Southern Economic Journal
71:4 (2005): 768-783.
Smith, James P. “Healthy Bodies and Thick Wallets: The Dual Relation between Health
and Economic Status.” The Journal of Economic Perspectives 13:2 (1999):145-
166.
Steinbach, Ulrike. “Social Networks, Institutionalization, and Mortality Among Elderly
People in the United States.” Journal of Gerontology 47:4 (July 1992): S183-
S190.

58
The CIA World Factbook. " Cuba." The World Factbook. Central Intelligence Agency.
Accessed 25 Jan. 2011 at <https://www.cia.gov/library/publications/the-world-
factbook/geos/cu.html>.
The CIA World Factbook. " Argentina." The World Factbook. Central Intelligence
Agency. Accessed 25 Jan. 2011 at <https://www.cia.gov/library/publications/the-
world-factbook/geos/ar.html>.
The CIA World Factbook. “Field Listing: Distribution of Family Income – Gini Index.”
The World Factbook. Central Intelligence Agency. Accessed 18 Apr. 2011 at
https://www.cia.gov/library/publications/the-world-factbook/fields/2172.html
Van Houtven, Courtney, and Edward C. Norton. "Informal Care and Health Care Use of
Older Adults." Journal of Health Economics 23.6 (2004): 1159-180.
World Health Organization. "Argentina." WHO Argentina. 2008. Accessed 20 Sept. 2010
at <http://www.who.int/>.
World Health Organization. “Cuba.” WHO Cuba. 2008. Accessed 20 Sept. 2010 at
<http://www.who.int/>.

59
World Bank. "Argentina." Data: The World Bank. Accessed 25 Jan. 2011 at
<http://data.worldbank.org/country/argentina>.
World Bank. "Cuba." Data: The World Bank. Accessed 25 Jan. 2011 at
<http://data.worldbank.org/country/cuba>
Yoo, Byung-Kwang, Jay Bhattacharya, Kathryn M. McDonald, and Alan M. Garber.
"Impacts of Informal Caregiver Availability on Long-term Care Expenditures in
OECD Countries." Health Services Research 39 (2004): 1971-992.

60
Table 1: Descriptive Statistics
Cuba: 1905 Argentina: 1043
Variable Mean (Std. Error) Mean (Std. Error)
Good Health .431 (.495) .651 (.477)
Anxiety Problems .201 (.401) .121 (.326)
Life Satisfaction .818 (.386) .760 (.427)
Happiness .769 (.423) .831 (.375)
Living Arrangement
(livewith)
.887 (.3171471) .730 (.444)
Total Living Children 2.94 (2.42) 2.43 ( 2.09)
Number of Children 2.80 (2.48) 2.54 (2.42)
Spouse helps .040 (.196) .028 (.1644909)
Child Helps .162 (.368) .042 (.2011097)
Sibling Helps 0 .006 (.0756639)
Parents Help (in law) .002 (.04) 0
Grandchild Helps .016 (.127) .016 (.127)
Other Family Helps .022 (.143) .039 (.192)
Not Family Helps
(friends help)
.018 (.132) .005 (.070)
Paid Help .004 (.061) .010 (.080)
How Many Help .440 (.9156) .306 (.725)
Total People Living in
House(numberinhouse)
3.53 (2.01) 2.43 (2.1)
Social Welfare Helps .018 (.134) .041 (.20)
Religion Helps .019 (.138) .011 (.102)
Home Service Helps .0005 (.023) 0
Center for Elderly Helps .012 (.109) .017 (.130)
Other Community Help .012 ( .109) .002 (.042 )
No Community Help .939 (.242) .921 (.270)
Community Help Total .062 (.006) .071 (.008)
No Help Received .742 (.438) .883 (.322)
Social Insurance (25
observations)
.0131 (.114) X
Public Insurance X .209 (.407)
Private Insurance X .104 (.305)
Social Security X .511 (.500 )
No Insurance X .173 (.378)
Age 71.97 (8.92) 70.74 (7.28)
Age2 5258.7 (1333.2) 5057.5 (1063.2)
Years of Education 7.1 (3.89) 7.16 (6.18)
Years of Education2 65.5 ( 67.9) 89.4 ( 419.21) Source: SABE - Survey on Health, Well-Being, and Aging in Latin America and the Caribbean, 2000

61
Table 2: Impact of Social Support on Self-Reported Health, For Those Who Need
Help
Argentina Cuba
Variables Specification 1 Specification 2 Specification 1 Specification 2
Marginal
Effects (Std.
Error)
Marginal
Effects (Std.
Error)
Marginal
Effects (Std.
Error)
Marginal
Effects (Std.
Error)
Child Helps .148 (.216) .107 (.210) .094 (.108) .112 (.106)
Spouse Helps .058 (.221) -.013 (.270) .079 (125) .094(.124)
Siblings Help .065 (.298) .011 (.285) X X
Parents-in-law help X X .404 (219) .404(.218)
Grandchild helps .132 (.193) .131 (.190) .120 (102) .111(.101)
Other Family Helps -.215 (.199) -.211 (.217) .269 (124)* .273 (.123)
Non Relative Helps -.017 (.213) -.039 (.207) .059 (.143) .086 (.142)
Paid Help X X X X
Companion -.088 (.139) -.115 (.143) .131 (099) .131 (.098)
Community Help -.364 (.097)* X .174 (.084)* X
Age .001 (.130) .001 (.129) -.065 (.043) -.063(.042)
Age2
.0001 (.0008) .0001 (.009) .0005 (.0003) .0005 (.0003)
Education .087 (.041)* .086 (.041) -.035 (018) -.035 (.018)
Education2
-.004 (.002) -.004 (.002) .035 (.108) .002 (.001)
Work Status -.075 (.289) -.114 (.267) -.133 (.120) -.136 (.118)
Private Insurance .305 (.256) .308 (.149) X X
Public Insurance -.084 (.211) -.360 (.133) X X
Social Security
Insurance
-.126 (.202) -.502 (.183) X X
No Insurance X X X X
Pseudo R-Squared .2185 .1750 .1362 .1298 Source: SABE - Survey on Health, Well-Being, and Aging in Latin America and the Caribbean, 2000
*Denotes statistical significance
Sample Size: 105 Sample Size: 483

62
Table 3: Impact of Social Support on Life Satisfaction, For Those Who Need Help
Argentina Cuba
Variables Specification 1 Specification 2 Specification 1 Specification 2
Marginal
Effects (Std.
Error)
Marginal
Effects (Std.
Error)
Marginal
Effects (Std.
Error)
Marginal
Effects (Std.
Error)
Child Helps .201 (.167) .216 (.165) .018 (.102) .014 (.101)
Spouse Helps -.041 (.181) -.018 (178) .121 (.097) .119 (.097)
Siblings Help -.008 (.236) .006 (.236) X X
Parents-In-Law
Help
X X X X
Grandchild helps -.055 (.163) -.054 (.163) -.040 (.115) -.036 (.115)
Other Family
Helps
-.379 (.120) -.372 (.203) .123 (.112) .123 (.112)
Non Relative
Helps
-.003 (.203) .027 (.197) -.054 (.136) -.060 (.137)
Paid Help X X X X
Companion -.142 (.122) -.133 (.122) .084 (.110) .083 (.120)
Community Help .152 (.142) X -.044 (.105) X
Age .079 (.116) .082 (.115) .005 (.045) .005 (.045)
Age2
-.0005 (.001) -.001 (.001) -.000005 (.0003) -.000005
(.0003)
Education .040 (.035) .037 (.034) -.021 (.022) -.022 (.022)
Education2
-.004 (.002) -.003 (.002) .0006 (.001) .0006 (.001)
Work Status -.098 (.258) -.073 (.258) .085 (.111) .087 (.110)
Private Insurance .421 (.117) .416 (.118) X X
Public Insurance .173 (.176) .183 (.173) X X
Social Security
Insurance
.149 (.164) .171 (.161) X X
No Insurance X X X X
Pseudo R-Squared .0962 .0900 .0341 .0337 Source: SABE - Survey on Health, Well-Being, and Aging in Latin America and the Caribbean, 2000
*Denotes statistical significance
Sample Size: 122 Sample Size: 322

63
Table 4: Impact of Social Support on Happiness, Only Those Who Need Help
Argentina Cuba
Variables Specification 1 Specification 2 Specification 1 Specification 2
Marginal
Effects (Std.
Error)
Marginal
Effects (Std.
Error)
Marginal
Effects (Std.
Error)
Marginal
Effects (Std.
Error)
Child Helps -.107 (.180) -.085 (.181) -.060 (.108) -.065 (.107)
Spouse Helps .179 (.123) .225 (.116) .022 (.122) .019 (.122)
Siblings Help -.059 (.229) -.043 (.224) X X
Parents- In-Law
Help
X X
Grandchild helps .140 (.105) .123 (.121) -.055 (.123) -.051 (.122)
Other Family
Helps
-.003 (.232) .005 (.239) -.050 (.150) -.050 (.150)
Non Relative
Helps
-.069 (.193) -.017 (.179) -.093 (.147) -.099 (.147)
Paid Help X X X X
Companion .061 (.119) .092 (.124) .212 (.111)* .210 (.114)
Community Help .238 (.066)* X -.047 (.109) X
Age -.005 (.118) .033 (.137) -.012 (.047) -.012 (.047)
Age2
-.0002 (.002) -.0001 (.001) .0001 (.0003) .0001 (.0003)
Education -.034 (.038) -.051 (.039) .028 (.021) .028 (.021)
Education2
.001 (.002) .002 (.002) -.001 ) (.001) -.001 (.001)
Work Status -.202 (.286) -.119 (.253) .112 (.117) .112 (.117)
Private Insurance .149 (.153) .136 (.173) X X
Public Insurance -.387 (.294) -.318 (.283) X X
Social Security
Insurance
-.201 (.182) -.133 (.192) X X
No Insurance X X X X
Pseudo R-Squared .2079 .1583 .0343 .0338 Source: SABE - Survey on Health, Well-Being, and Aging in Latin America and the Caribbean, 2000
*Denotes statistical significance
Sample Size: 95 Sample Size: 321

64
Table 5: Impact of Social Support on Anxiety, Only Those Who Need Help
Argentina Cuba
Variables Specification 1 Specification 2 Specification 1 Specification 2
Marginal
Effects (Std.
Error)
Marginal
Effects (Std.
Error)
Marginal
Effects (Std.
Error)
Marginal
Effects (Std.
Error)
Child Helps .163 (.159) .162 (.158) .038 (.087) .042 (.086)
Spouse Helps -.132 (.084) -.133 (.084) .020 (.101) .023 (.101)
Siblings Help .103 (.209) .102 (.209) .068 (.287) .068 (.287)
Grandchild helps .163 (.159) .029 (.148) -.056 (.076) -.059 (.075)
Other Family Helps .570 (.250)* .569 (.250) -.013 (.109) -.012 (.109)
Non Relative Helps .209 (.255) .208 (.255) -.040 (.110) -.036 (.111)
Paid Help X X X X
Companion .176 (.071)* .175 (.071)* .186 (.059)* .187 (.059)*
Community Help -.013 (.106) X .037 (.076) X
Age -.068 (.091) -.068 (.092) -.013 (.034) -.012 (.015)
Age2
.0003 (.001) .0003 (.001) -.00002 (.0002) .00002 (.0002)
Education .040(.026) .039 (.026) -.013 (.015) -.013(.015)
Education2
-.0004 (.002) -.0004 (.002) .0008 (.0009) .0008 (.001)
Work Status -.099 (.097) -.099 (.097) -.006 (.100) -.009 (.099)
Private Insurance .126 (.224) .128 (.225) X X
Public Insurance .222 (.217) .221 (.216) X X
Social Security
Insurance
.180 (.115) .179 (.115) X X
No Insurance X X X X
Pseudo R-Squared .2583 .2582 .0482 .0477 Source: SABE - Survey on Health, Well-Being, and Aging in Latin America and the Caribbean, 2000
*Denotes statistical significance
Sample Size: 121 Sample Size: 482

65
Table 6: Impact of Living Arrangement and Support on Self-Reported Health
Status, Full Sample
Variables Argentina Cuba
Marginal Effects
(Std. Error)
Marginal Effects (Std.
Error)
Total Living
Children
-.011 (.015) -.024 (.011)*
Total Living
Children2
.001 (.002) .001 (.001)
Companionship -.010 (.052) .061 (.045)*
Total in House -.023 (.039) .043 (.018)
Total in House2 .003 (.004) -.003(.002)
Age -.050 (.056) -.061 (.021)*
Age2 .0004 (.0002) .0005 (.0001)*
Years of
Education
.033 (.005)* -.013 (.010)
Years of
Education2
-.0004 (.00007) .0012 (.0005)*
Work Status .020 (.037) .165 (.031)*
Private Insurance -.125 (.238) X
Public Insurance -.210 (.235) X
Social Security
Insurance
-.229 (.233) X
No Insurance -.219(.235) X
Pseudo R-Squared .0663 .0395 Source: SABE - Survey on Health, Well-Being, and Aging in Latin America and the Caribbean, 2000
*Denotes statistical significance
Sample Size: 1011 Sample Size: 1894

66
Table 7: Impact of Living Arrangement and Support on Life Satisfaction, Full
Sample
Variables Argentina Cuba
Marginal Effects (Std.
Error) Marginal Effects
(Std. Error)
Total Living
Children
.039 (.017) .011 (.009)
Total Living
Children2
-.0006 (.012) -.001 (.0008)*
Companionship -.034 (.045) .034 (.037)*
Total in House .039 (.017) .023 (.013)
Total in House2 -.006 (.004) -.0007 (.001)*
Age .028 (.031) .008 (.018)
Age2 -.00002 (.0002) -.00003 (.0001)
Years of Education .002 (.004) -.006 (.008)
Years of
Education2
.00003 (.00006) .00001 (.0004)
Work Status .045 (.033) .097 (.020)*
Private Insurance .072 (.193) X
Public Insurance .035 (.213) X
Social Security
Insurance
.037 (.223) X
No Insurance -.039 (.237) X
Pseudo R-Squared .0290 .0294 Source: SABE - Survey on Health, Well-Being, and Aging in Latin America and the Caribbean, 2000
*Denotes statistical significance
Sample Size: 1042 Sample Size: 1690

67
Table 8: Impact of Living Arrangement and Support on Anxiety, Full Sample
Variables Argentina Cuba
Marginal Effects
(Std. Error) Marginal Effects
(Std. Error)
Total Living
Children
.013 (.011) .009 (.009)
Total Living
Children2
-.0004 (.0009) -.001 (.001)*
Companionship -.002 (.036) .039 (.032)
Total in House -.037 (.027) .024 (.013)
Total in House2 .003 (.003) -.001 (.001)*
Age -.009 (.024) -.017 (.017)
Age2 -.00004 (.0002) .00007 (.0001)
Years of
Education
.005 (.003) -.007 (.008)
Years of
Education2
-.00007 (.00005) .0003 (.0004)
Work Status -.045 (.026) -.100 (.020)*
Private Insurance .139 (.168) X
Public Insurance .139 (.166) X
Social Security
Insurance
.132 (.165) X
No Insurance .101 (.166) X
Pseudo R-Squared .0492 .0295 Source: SABE - Survey on Health, Well-Being, and Aging in Latin America and the Caribbean, 2000
*Denotes statistical significance
Sample Size: 933 Sample Size: 1693

68
Table 9: Impact of Living Arrangement and Support on Happiness, Full Sample
Variables Argentina Cuba
Marginal Effects
(Std. Error) Marginal Effects
(Std. Error)
Total Living
Children
.026 (.013)* .006 (.010)
Total Living
Children2
-.001 (.001) -.007 (.015)*
Companionship .072 (.043)* .066 (.041)*
Total in House .057 (.032) -.034 (.015)
Total in House2 -.007 (.003) -.001 (.001)*
Age -.021 (.030) .008 (.020)
Age2 .0002 (.0002) -.00003 (.0001)
Years of
Education
.002 (.004) .015 (.008)
Years of
Education2
-.00006 (.00006) -.0008 (.0005)
Work Status .071 (.031) .028 (.023)*
Private Insurance .089 (.192) X
Public Insurance .106 (.189) X
Social Security
Insurance
.105 (.187) X
No Insurance .068 (.189) X
Pseudo R-Squared .0217 .0231 Source: SABE - Survey on Health, Well-Being, and Aging in Latin America and the Caribbean, 2000
*Denotes statistical significance
Sample Size: 1039 Sample Size: 1893

69
Table 10: Mean Comparison Tests Cuba and Argentina of Those Who Need Help
Variable Cuba
Mean (std. dev)
Argentina
Mean (std. dev)
Difference
(standard error)
Child helps .627 (.484) .361 (.482) .267 (.049)*
Spouse Helps .155 (.360) .238 (.427) -.083 (.038)*
Grandchild Helps .063 (.243) .139 (.347) -.076 (.027)*
Parents Help .006 (.078) 0 X
Siblings Help 0 .049 (.217) X
Religion Helps .035 (.183) .025 (.156) .010 (.018)
Other Family
Helps .081 (.274) .041 (.199) .040 (.026)
Friends Help .069 (.254) .082 (.275) -.013 (.026)
Paid Help .014 (.005) .328 (.043) -.314 (.024)*
Social Welfare
Helps .016 (.127) .066 (.249) -.049 (.026)*
Senior Citizen
Service Helps .020 (.141) .025 (.156) .021 (.006)
Other Community
Help .017 (.127) .008 (.091) .008 (.012)
Social Service
Helps 0 0 0
Live With .945 (.228) .705 (.458) .240 (.029)* Source: SABE - Survey on Health, Well-Being, and Aging in Latin America and the Caribbean, 2000
* denotes statistically significant difference at the 5% level.

70
Table 11: Mean Comparison Tests Cuba and Argentina of the Full Sample
Variable Cuba
Mean (std. dev)
Argentina
Mean (std. dev)
Difference
(standard error)
Child helps .162 (.008) .042 (.006) .119 (.013)*
Spouse Helps .040 (.004) .028 (.005) .012 (.007)*
Grandchild Helps .016 (.003) .016 (.004) -.00003 (.005)
Parents Help .002 (.040) X X
Siblings Help X .006 (.076) X
Religion Helps .019 (.003) .011 (.003) .009 (.005)*
Other Family
Helps .021 (.003) .005 (.002) .016 (.005)*
Friends Help .018 (.003) .010 (.003) .008 (.005)*
Paid Help .004 (.001) .038 (.006) -.035 (.005)*
Social Welfare
Helps .018 (.003) .041 (.006) -.023 (.006)*
Senior Citizen
Service Helps .012 (.003) .017 (.004) -.005 (.005)
Other Community
Help .012 (.003) .002 (.001) .012 (.004)*
Social Service
Helps .018 (.003) .041 (.006) -.023 (.006)*
Live With .887 (.007) .730 (.014) .157(.014)*
Age 71.97 (.204) 70.74 (225) 1.22 (.322)*
Years of Education 7.10 (.089) 7.16 (.191) -.060 (.186)
Work Status .185 (.009) .242 (.013) -.047 (.016)*
Health Status .431 (.011) .651 (.015) -.220 (.019)*
Life Satisfaction .818 (.009) .760 (.013) .058 (.016)* Source: SABE - Survey on Health, Well-Being, and Aging in Latin America and the Caribbean, 2000
* denotes statistically significant difference at the 5% level

71
Appendix A: Tests of Robustness and Goodness of Fit and Full Sample Results
Robustness and Goodness of Fit Tests
Running the reset test, or test of the model specifications, showed that the
regression in Table II needed to be re-specified. Therefore, I added a squared years of
education term to the model. After running the reset test with the squared years of
education variable, model 1 full sample regression reflected the true relationship between
the Y and X variables by passing the reset test.
Degree of Variation Explained by the Models: Argentina
In Table 2, the R2 values are relatively large for models 1 and 2 (.2185 and
0.1750) which indicates that the explanatory variables explain 22% and 18% of the
variation in good health, when using only the individuals that receive help.
The R2 values for these regressions on life satisfaction are smaller than those for
the regressions on good health, indicating that there are other more useful, but
unmeasured, variables to be used for explaining the dependent variable. In Table 3, the
R2 values are 0.0962 and 0.0900, which indicates that the explanatory variables explain
10% and 9% of the variation in life satisfaction.
The R2
values for the regression on happiness are larger at 0.2079 and 0.1583 and
the R2 values for the regression on anxiety are the largest of all four regressions, 0.2583
and 0.2582.

72
Degree of Variation Explained by the Models: Cuba
In Table 2, the R2 values are smaller for models 1 and 2 (0.1362 and 0.1298) than
the R2 values for the same regression in Argentina. These values indicate that the
explanatory variables explain 14% and 13% of the variation in good health, when using
only the individuals that receive help.
The R2 values for these regressions on life satisfaction are smaller than those for
the regressions on good health, indicating that there are other more useful variables to be
used for explaining the dependent variable. In Table 3, the R2 values are 0.0341 and
0.0337, which indicates that the explanatory variables explain 3.5% of the variation in
life satisfaction.
The R2
values for the regression on happiness are relatively the same to those for
the regression on life satisfaction at 0.0343 and 0.0338 and the R2 values for the
regression on anxiety are only slightly larger at 0.0482 and 0.0477.
It is interesting that the regressions for the Argentina sample have much stronger
R2 values. The may be due to the fact that in the Argentina sample there are more control
variables (the insurance variables), which are not present in the Cuban regressions.
Results: Argentina
Family help in the full sample, displayed in Tables 12-15, is negatively associated
with good health. This is most possibly the case because in these specifications
individuals who do not receive help are included in the models, and people in the best
health do not need extra care giving. When the model is altered to include only those
receiving help, displayed in Table 12, the marginal effects of the measures for child,

73
grandchild, siblings and friends help become positive and indicates a positive impact on
the health status of the elderly individual relative to receiving paid help, consistent with
the reverse causality explanation.
The variables on each family help category show that compared to not receiving
any assistance; receiving help from a family member lowers an elderly individual‟s
health status. Interestingly, in Tables 12-15, some of the community help variables
positively impact the good health dependent variable. Having access to a center for
elderly has a positive measured impact on health, demonstrating a 2.6% increase in the
probability of being in good/excellent health when there is a community center available
for the elderly. Help from other community organizations increased the probability of
being in good/excellent health by 3.9 percentage points. Compared to receiving no
community help, most forms of community help lower the probability of being in good to
excellent health.
Additionally, running the F-test demonstrates that the type of family help does
significantly affect health status. The F-statistic, 4.60, is much larger than the critical F
which is 2.02. Therefore, getting help from all types of combined family help versus
receiving no help does affect the dependent variable differently.
The results of this F-test run on all types of help, both community and family, are
also significant. The F-statistic is 3.45, which is larger than the critical value of 1.80,
showing that the types of help, now including both family and community, jointly impact
the health status of the elderly individual.
However, none of the marginal effects of community help are statistically
significant which indicates that community help has does not have a significant impact on

74
the health status of the elderly. The marginal effect on the paid help variable, however, is
statistically significant at the 1% level, with a p-value of 0.0. This indicates that having a
domestic helper significantly lowers the health status of the elderly individual.
One possible reason for this is that this regression is run using all of the
observations in the sample, including those elderly who do not receive help. Getting help
of any kind is a signal of poor health; therefore those who are in good health would not
need help. This regression does not show the results for those that are in poor health and
receive help.
Table 13 demonstrates the effects of the same explanatory variables on the life
satisfaction of the individuals in the study. The resulting marginal effects show that
receiving help from family members lowers an elderly individual‟s life satisfaction.
Model 1 in Table 13 displays that family help negatively impacts an elderly person‟s life
satisfaction but that some forms of community help positively impacts their life
satisfaction, relative to not receiving any help at all. The marginal effect on religion helps
is .079, which shows that, compared to receiving no help, receiving help from a religious
organization, church or synagogue improves the probability that the respondent is
satisfied/very satisfied with life by 7.9 percentage points. Additionally, in Models 1 and
2, the coefficient on living arrangement is positive, demonstrating that living with a
companion improves one‟s life satisfaction by .5 percentage points in model 1 and .7
percentage points in model 2.
The F- test for this regression demonstrates how the life satisfaction variable is
significantly impacted by the dependent variables. Since 4.99 is greater than the critical
value of 2.02, the F-test demonstrates that the family help variables are jointly significant,

75
but none of the family help variables alone are statistically significant. For all types of
help (community and family), the F statistic is 3.02, which is significant.
In Table 13, the marginal effects of other family and paid help are all statistically
significant. The coefficients on other family help and paid help are significant at the 5%
level. The statistical significance of these coefficients suggests that receiving help from
one of the two sources has a significantly negative impact on the probability that the
elderly individual would be satisfied with their life.
The family-help variables generally negatively impact happiness in the full
sample. Receiving help from a child, sibling, non relative, or another family member
negatively impacts happiness. Receiving help from a spouse, however, increases the
probability of being happy by 11.7 percentage points. Receiving paid help reduces the
probability of being happy by 16 percentage points. Living with someone positively
increases the probability of being happy by 12.1 percentage points.
The community-help variables have differing impacts on happiness. Receiving
help from a religious organization or a senior citizen organization decreases the
probability of being happy by 4.2 percentage points and 9.4 percentage points
respectively, while receiving help from a social services organization increases the
probability of being happy by 5.4 percentage points.
Work status is positive and statistically significant, showing that working increase
the probability of being happy by 6.8 percentage points. The insurance variables also
have a positive marginal impact on happiness.
The regression on anxiety shows that having a child help increases the probability
of having anxiety by 18.9 percentage points and receiving help from a sibling increases

76
the probability of being anxious by 25.7 percentage points. Receiving help from a
grandchild, friend, another family member and from a paid source also increases the
probability of having anxiety. Receiving help from a spouse is the only family help
variable that reduces the probability of having anxiety, and does so by 3.6 percentage
points. Living with someone also reduces the probability of having anxiety by 2.9
percentage points.
The community-help variables affect anxiety differently. Receiving help from a
religious source reduces the probability of having anxiety by 4.4 percentage points
respectively, while receiving help from a community center or a social services
organization increases the probability of having anxiety by 27.1 and 3.6 percentage
points. The community center marginal effect is also statistically significant.
Working reduces the probability of having anxiety by 3.3 percentage points, yet
all of the insurance variables are positive.
Insurance
Although not of significant interest in the study, the private insurance control
variable was statistically significant in many of the regressions. Both of the regressions of
social support on health status and life satisfaction display that private insurance
positively impacts the health status of those individuals and is statistically significant.
This indicates that having private insurance significantly improves health and life
satisfaction relative to having no insurance. One possible explanation for significance of
the private insurance variable in Appendix A is that the models are not controlling for
income because the income variable had too many missing observations to be functional

77
in the regression. Therefore, the private insurance variable may be capturing the impact
of income on the dependent variable as well. Higher income usually has a positive impact
on health status. This may reflect a possible omitted error bias.
Results: Cuba
Once again, the full sample results (Tables 12-15) show that many of the social
support and community support variables are negatively correlated to good health. We
can be relatively certain that this relationship is due to the individuals in the sample who
do not need help and who do not receive help. Child help is negatively associated with
good health, showing that having a child help decrease the probability of being in good
health by 5.2 percentage points. Spousal help reduces the probability of being in good
health by 15.0 percentage points and is also statistically significant at the 5% level.
Receiving help from a non relative reduces the probability of being in good to excellent
health by 11.4%. However, help from a grandchild, another family member or a parent
increases the probability of being in good to excellent health by 10.4, 7.9 and 26.0
percentage points respectively. Companionship reduces the probability of being in good
to excellent health by 10.5 percentage points and is statistically significant.
The measures of community help generally have negative marginal impacts on
the health status of the elderly in the full sample.
Family support generally has a negative marginal impact on life satisfaction.
Having a child help reduces the probability of being satisfied with life by 20.3 percentage
points, a coefficient that is statistically significant. Additionally, spousal support, help
from a grandchild, help from a friend, and help from a non relative also negatively

78
impacts life satisfaction. The only family help variable that has a positive marginal
impact on life satisfaction is receiving help from a parent or another family member. Paid
help also a negative impact on life satisfaction and reduces the probability of being
satisfied with life by 33.6 percentage points but is not statistically significant. However,
companionship increases the probability of being satisfied with life by 11.2 percentage
points and is statistically significant.
The community-help variables have differing impacts on life satisfaction.
Receiving help from a religious source and a social services organization reduces the
probability of being satisfied with life by 4.1 and 8.3 percentage points, while receiving
help from a senior center organization and another community source increase the
probability of being satisfied with life by 5.8 and 2.2 percentage points.
Although a control variable in the study, work status has a positive and
statistically significant impact on life satisfaction. Working improves one‟s satisfaction
with life by 7.6 percentage points, which makes logical sense because those who are able
to work would generally feel more able.
Happiness is negatively impacted by all of the family help variables. Living with
someone else has a positive marginal impact of 15.5% on happiness and is statistically
significant. Receiving help from a paid source reduces the probability of being happy by
9.5 percentage points.
The community help variables, once again, have different marginal impacts on the
happiness of elderly in the full sample. Religion, other community help and social
services help have a negative marginal impact on happiness while receiving help from a
senior citizen center increases the probability of being happy by 10.2 percentage points.
79
Work status is once again both positive and statistically significant, and increase
the probability of being happy by 9.5 percentage points. Working is generally an
indication of being in good health and being capable, both of which can contribute to
happiness.
Lastly, the regression on anxiety show that receiving help from both a spouse and
child have a statistically significant effect on increasing the probability of having anxiety.
Receiving help from a spouse increases the probability of having anxiety by 15.2
percentage points and receiving help from a child increases the probability of having
anxiety by 16.6 percentage points. Receiving help from a parent, another family member
or from a friend also increase the probability of having anxiety but none of the three are
statistically significant. Receiving help from a grandchild and from a paid source both
reduce anxiety, an interesting observation. Although receiving help from a paid source
may reduce happiness, health status and life satisfaction it also have the probability of
reducing anxiety by 2.6 percentage points. Living with someone reduces anxiety by 1.8
percentage points, which can perhaps be related to the housing crisis and the need to live
with family because of the lack of housing in Cuba.
The community-help variables impact anxiety differently. Receiving help from a
social services organization, a religious organization or from another community
organization increase the probability of having anxiety by 8.6, 7.0 and 11.5 percentage
points respectively, while receiving help from a senior citizen organization reduces the
probability of having anxiety by 12.1 percentage points.

80
Lastly, once again, work status is statistically significant and reduces the
probability of having anxiety by 8.5 percentage points. This is perhaps due to the fact that
working brings in extra income.
Results: Ordinary Least Square Regression of Social Support on General Well Being
Only Those Who Need Help
When combining the three dependent variables that are indicators of good general
well-being, health status, life satisfaction and anxiety, there is little significance seen in
the results. In Table 16, the coefficient estimates of the ordinary least squares regression,
as opposed to marginal effects converted from the probit regression, are similar to those
found in the probit regression, showing a generally positive impact on well-being,
although showing little statistical significance.
Full Sample
The OLS regression results on the full sample, presented in Table 17, do have
some statistical significance, yet, most coefficients are negative. Grandchild, other
family, non relative, paid and sibling help are all statistically significant, yet all have
negative impacts on well being in the Argentine sample. However, the companionship
variable is statistically significant and shows a positive impact on general well-being,
demonstrating that living with another individual improves the probability that one will
be generally healthy. The results in the Cuban sample are similar to those in Argentine
sample. The family and friend help variables do have some statistical significance but all

81
have negative impacts on general well being with the exception of the companionship
variable. This again demonstrates that living with someone else positively impacts
general well-being, which, in Cuba, may relate to the housing shortage.

82
Table 12: Impact of Types of Social Support on Self-Reported Health Status, Full
Sample
Argentina Cuba
Variables Specification 1 Specification 2 Specification 1 Specification 2
Marginal
Effects (Std.
Error)
Marginal
Effects (Std.
Error)
Marginal Effects
(Std. Error) Marginal Effects
(Std. Error)
Child Helps -.221 (161) -.233 (.159) -.052 (.036) -.055 (.036)
Spouse Helps -.064 (.187) -.067 (.185) -.150 (.054) * -.150 (.054)*
Siblings Help -.369 (.219) -.389 (.209)
Parents-In-Law
Help
X X .260 (.273) .264 (.271)
Grandchild helps -.264 (.139) -.266 (.128) .104 (.098) .107 (.099)
Other Family
Helps
-.439 (.227) -.438 (.228) .079 (.084) .082 (.084)
Non Relative
Helps
-.298 (.166) -.309 (.162) -.114 (.083) -.125 (.081)
Paid Help -.305 (.087) * -.304 (.087)* -.291 (.135) -.287 (.138)
Companion -.031 (.036) -.032 (.036) .105 (.036) .111 (.035)
Social Service
Helps
-.187 (.085) X -.129 (.082) X
Senior Citizen
Center Helps
.026 (.113) X -.114 (.098) X
Home Service
Helps
X X X X
Religion Helps -.043 (.160) X -.044 (.084) X
Other
Community
Help
.039 (.387) X .040 (.107) X
Age -.069 (.040)* -.075 (.040)* -.058 (.021)* -.060 (.021)*
Age2
.0005 (.0003) .0005 (.0003) .0004 (.0001)* .0005 (.0001)*
Education .040 (.012)* .042 (.012)* -.010 (.010) -.011 (.010)
Education2
-.001 (.001) -.001 (.001) .001 (.0005)* .001 (.001)*
Work Status -.001 (.040) -.001 (.040) .153 (.032) * .153 (.031)*
Private
Insurance
.146 (.058)* .158 (.056)* X X
Public Insurance .007 (.053) .021 (.052) X X
Social Security
Insurance
-.017 (.047) -.004 (.046) X X
No Insurance X X X X
R-Squared .0915 .0874 .0427 .0414 Source: SABE - Survey on Health, Well-Being, and Aging in Latin America and the Caribbean, 2000
*Denotes statistical significance
Sample Size 1011 Sample Size 1893

83
Table 13: Impact of Types of Social Support on Life Satisfaction, Full Sample
Argentina Cuba
Variables Specification 1 Specification 2 Specification 1 Specification 2
Marginal Effects
(Std. Error) Marginal Effects
(Std. Error) Marginal Effects
(Std. Error) Marginal Effects
(Std. Error)
Child Helps -.105 (.127) -.099 (.125) -.203 (.041)* -.201 (.041)*
Spouse Helps -.037 (.140) -.052 (.141) -.091 (.061) -.088 (.061)
Siblings Help -.308 (.205) -.302 (206) X X
Parents-In-Law
Help
X X X X
Grandchild helps -.105 (.127) -.368 (.121) -.022 (.083) -.022 (.087)
Other Family
Helps
-.552 (.192)* -.552 (.192)* .022 (.083) -.075 (.103)
Non Relative
Helps
-.183 (.164) -.169 (161) -.276 (.097)* -.279 (.097)*
Paid Help -.232 (.082)* -.229 (.082)* .336 (.209) -.333 (.210)
Companion .005 (.031) .007 (.031) .112 (.034)* .117 (.034)*
Social Service
Helps
.028 (.063) X -.083 (.082) X
Senior Citizen
Center Helps
-.042 (.108) X .058 (.071) X
Home Service
Helps
X X X X
Religion Helps .079 (.111) X -.041 (.080) X
Other
Community
Help
-.235 (.373) X .022 (.083) X
Age .020 (.031) .021 (031) -.005 (.019) -.004 (.019)
Age2
-.0001 (.0002) -.0002 (.0002) .0001 (.0001) .0001 (.0001)
Education -.002 (.004) -.002 (.004) -.009 (.008) -.009 (.008)
Education2
.00001 (.00006) .00001 (.0001) .0001 (.0004) .0001 (.0004)
Work Status .025 (.034) .024 (.034) .076 (.021)* .075 (.021)*
Private
Insurance
.104 (.045)* .102 (045)* X X
Public Insurance .064 (.042) .060 (.042) X X
Social Security
Insurance
.060 (.042) .055 (.040) X X
No Insurance X X X X
R-Squared .0351 .0340 .0530 .0514 Source: SABE - Survey on Health, Well-Being, and Aging in Latin America and the Caribbean, 2000
*Denotes statistical significance
Sample Size 1043 Sample Size 1688

84
Table 14: Impact of Types of Social Support on Happiness, Full Sample
Argentina Cuba
Variables Specification 1 Specification 2 Specification 1 Specification 2
Marginal
Effects (Std.
Error)
Marginal Effects
(Std. Error) Marginal Effects
(Std. Error) Marginal Effects
(Std. Error)
Child Helps -.196 (.167) -.154 (.152) -.162 (.041)* -.160 (.041)*
Spouse Helps .117 (.060) .102 (.068) -.086 (.066) -.084 (.065)
Siblings Help -.295 (.229) -.282 (.225) X X
Parents-In-Law
Help
X X X X
Grandchild helps -.010 (.111) -.009 (.109) -.051 (.104) -.049 (.104)
Other Family
Helps
-.141 (.271) -.135 (.268) -.155 (.107) -.149 (.104)
Non Relative
Helps
-.169 (.172) -.117 (.151) -.199 (.095)* -.197 (.096)*
Paid Help -.160 (.085)* -.149 (.083)* -.095 (.199) -.088 (.197)
Companion .121 (.031) .125 (.031) .155 (.036)* .161 (.036)*
Social Service
Helps
.054 (.041) X -.091 (.086) X
Senior Citizen
Center Helps
-.094 (.117) X .102 (.074) X
Home Service
Helps
X X X X
Religion Helps -.042 (.038) X -.122 (.090) X
Other
Community Help
X X -.077 (.105) X
Age -.029 (.032) -.026 (.031) -.004 (.020) -.003 (.020)
Age2
.0002 (.0002) .0002 (.0002) .0001 (.0005) .0001 (.0001)
Education -.0005 (.004) -.001 (.004) .011 (.009) .011 (.009)
Education2
-.00002 (.0001) -.00002 (.0001) .001 (.0004) -.001 (.0004)
Work Status .068 (.028)* .069 (.028)* .095 (.024)* .096 (.024)*
Private Insurance .028 (.047) .024 (.047) X X
Public Insurance .042 (.039) .039 (.039) X X
Social Security
Insurance
.042 (.038) .035 (.037) X X
No Insurance X X X X
R-Squared .0459 .0434 .0410 .0380 Source: SABE - Survey on Health, Well-Being, and Aging in Latin America and the Caribbean, 2000
*Denotes statistical significance
Sample Size 934 Sample Size 1691

85
Table 15: Impact of Types of Social Support on Anxiety, Full Sample
Argentina Cuba
Variables Specification 1 Specification 2 Specification 1 Specification 2
Marginal
Effects (Std.
Error)
Marginal Effects
(Std. Error) Marginal
Effects (Std.
Error)
Marginal
Effects (Std.
Error)
Child Helps .189 (.134) .177 (.130) .166 (.036)* .162 (.036)
Spouse Helps -.036 (.069) -.013 (.023) .152 (.058)* .154 (.057)
Siblings Help .257 (.200) .255 (.200) X X
X X .193 (.293) .188 (.292)
Grandchild helps .106 (.110) .099 (.108) -.066 (.057) -.064 (.058)
Other Family
Helps
.425 (.229)* .415 (.228)* .093 (.079) .090 (.079)
Non Relative
Helps
.026 (.126) .015 (.120) .040 (.078) .043 (.079)
Paid Help .098 (.070) .089 (.068) -.026(.153) -.029 (.151)
Companion -.029 (.024) -.033 (.025) -.018 (.031) -.023 (.030)
Social Service
Helps
.036 (.058) X .086 (.080) X
Senior Citizen
Center Helps
.271 (.120)* X -.121 (.056) X
Home Service
Helps
X X X X
Religion Helps -.044 (.079) X .070 (.075) X
Other
Community Help
X X .115 (.099) X
Age .007 (.026) .008 (.062) -.006 (.017) -.007 (.017)
Age2
-.0001 (.002) -.0001 (.0001) -.000001 (.0001) -.00001 (.0001)
Education .005 (.003) .004 (.003) -.002 (.008) -.002 (.008)
Education2
-.0001 (.0001) -.0001 (.0001) .0001 (.0004) .0001 (.0004)
Work Status -.033 (.023) -.033 (.023) -.085 (.021)* -.086 (.021)*
Private Insurance .039 (.050) .037 (.049) X X
Public Insurance .044 (.041) .043 (.040) X X
Social Security
Insurance
.025 (.032) .031 (.031) X X
No Insurance X X X X
R-Squared .0481 .0365 .0400 .0365 Source: SABE - Survey on Health, Well-Being, and Aging in Latin America and the Caribbean, 2000
*Denotes Statistical Significance
Sample Size 1038 Sample Size 1892

86
Table 16: Impact of Social Support on General Well-Being, Only Those Who Need
Help
Argentina Cuba
Variables Specification 1
Specification 2 Specification 1 Specification 2
Coefficient
Estimates (Std.
Error)
Coefficient
Estimates (Std.
Error)
Coefficient
Estimates (Std.
Error)
Coefficient
Estimates (Std.
Error)
Child Helps .050 (.396) .043 (.391) .069 (.214) .069 (.213)
Spouse Helps .264 (.401) .257 (.396) .166 (.240) .167 (.239)
Siblings Help -.169 (.521) -.173 (.517) X X
Parents-in-law-
help
X X .675 (.965) .676 (.964)
Grandchild
helps
.095 (.368) .096 (.365) -.065 (.232) -.065 (.231)
Other Family
Helps
-.642 (.603) -.641 (.60) .424 (.290) .424 (.290)
Non Relative
Helps
.019 (.411) .010 (.405) -.075 (.277) -.074 (.275)
Paid Help X X X X
Companion .046 (.271) .042 (.268) .204 (.215)
Community
Help
-.049 (.309) X .007 (.209) X
Age .099 (.242) .097 (.240) -.097 (.091) -.097 (.091)
Age2
-.0003 (.002) -.0003 (.002) .001 (.001) .001 (.001)
Education .035 (.077) .037 (.076) .022 (.043) .022 (.043)
Education2
-.003 (.005) -.003 (.004) -.001 (.003) -.001 (.003)
Work Status -.264 (.511) -.274 (.504) X X
Private
Insurance
.618 (.502) .627 (.495) X X
Public
Insurance
-.443 (.469) -.443 (.466) X X
Social Security
Insurance
.386 (.418) -.390 (.414) X X
No Insurance X X X X
R-Squared .2142 .2140 .0533 .0533 Source: SABE - Survey on Health, Well-Being, and Aging in Latin America and the Caribbean, 2000
*denotes statistical significance
Sample Size: 95 Sample Size: 317

87
Table 17: Impact of Social Support on General Well-Being, Full Sample
Argentina Cuba
Variables Specification 1
Specification 2 Specification 1 Specification 2
Coefficient
Estimates (Std.
Error)
Coefficient
Estimates (Std.
Error)
Coefficient
Estimates (Std.
Error)
Coefficient
Estimates (Std.
Error)
Child Helps -.444 (.278) -.437 (.276) -.591 (.077)* -.593 (.077)*
Spouse Helps .160 (.331) .088 (.327) -.515 (.126)* -.512 (.126)*
Siblings Help -.872 (.387)* -.888 (.386)* X X
Parents-in-law-
help
X X -.001 (.903) .009 (.904)
Grandchild helps -.552 (.295)* -.552 (.250)* -.052 (.219) -.038 (.219)
Other Family
Helps
-1.08 (.497)* -.107 (.498)* -.254 (.205) -.238 (.205)
Non Relative
Helps
-.522 (.295) -.513 (.293) -.687 (.178)* -.707 (.178)*
Paid Help -.545 (.157)* -.534 (.155)* -.821 (.370)* -.802 (.371)*
Companion .150 (.065)* .154 (.065)* .315 (.069)*
Social Service
Helps
-.142 (.142) X -.352 (.168)* X
Senior Citizen
Center Helps
-.307 (.227) X .024 (.204) X
Home Service
Helps
X X .950 (.907) X
Religion Helps .098 (.277) X -.322 (.180) X
Other
Community Help
-.229 (.625) X -.039 (.209) X
Age -.106 (.069) -.110 (.069) -.036 (.044) -.038 (.044)
Age2
.001 (.0004) .001 (.0004) .0003 (.0003) .0004 (.0003)
Education .026 (.009)* .026 (.009)* .013 (.019) .012 (.019)
Education2
-.0004 (.0001)* -.0004 (.0001)* -.0003 (.001) -.0002 (.001)
Work Status .082 (.072) .080 (.072) .325 (.059)* .327 (.059)*
Private Insurance .200 (.120) .211 (.119) X X
Public Insurance .122 (.099) .128 (.098) X X
Social Security
Insurance
.054 (.087) .053 (.086) X X
No Insurance X X X X
R-Squared .0733 .0703 .0950 .0903 Source: SABE - Survey on Health, Well-Being, and Aging in Latin America and the Caribbean, 2000 *denotes statistical significance
Sample Size: 934 Sample Size: 1665
Recommended