1
NOVEMBER 2016
COMPANY OVERVIEW

AGENDA
I. COMPANY DESCRIPTION
II. CMPC’S VALUE PROPOSAL
1. LEADING DIVERSIFIED LATIN AMERICAN P&P PLAYER
2. LOW COST PRODUCER WITH WORLD CLASS ASSETS
3. STRONG BALANCE SHEET AND FINANCIAL TRACK RECORD
4. COMMITTED TO SUSTAINABLE DEVELOPMENT AND CORPORATE GOVERNANCE
5. DIVERSIFIED INVESTMENT PORTFOLIO
III. CHALLENGES 2016-2017
IV. APPENDIX

I. COMPANY DESCRIPTION

4
Matte Group
56%
Chilean and
Foreign Investors
34%
Chilean
Pension Funds
10%
CMPC AT A GLANCE
CMPC is a P&P company, established in 1920, that produces solid wood products, pulp,, paper and
packaging products and tissue in Latin America
International rating BBB+ (negative) - Fitch
BBB- (stable) - S&P Baa3 (stable) - Moodys
Local rating AA (Fitch) AA (ICR)
CMPC’s Figures
Sales: 4,844
EBITDA: 1,059
EBITDA Margin: 22%
Net Income: 144
Net Debt: 3,610
Assets: 14,883
Shareholders’ Structure* Market capitalization of
US$5.4 billion
as of October 31st, 2016
Figures for the LTM as of September, 2016 (US$ million) * As of September 30th, 2016. Source: CMPC

II. CMPC’S VALUE PROPOSAL
1. LEADING DIVERSIFIED LATIN AMERICAN P&P PLAYER

6
A DIVERSIFIED BUSINESS PORTFOLIO PROVIDES CMPC A STABLE CASH FLOW
Source: CMPC. Figures in US$ million for the LTM as of September 2016 / Figures do not include Holding and Intercompany Sales.
Main Figures % of third parties total
sales
% of consolidated
EBITDA
Total capacity &
Employees
Pu
lp-F
ore
str
y
Pa
pe
rs
Tis
su
e
Sales: 2,526
Sales 3rd parties: 2,236
EBITDA: 722
EBITDA margin: 29%
647 Th. has. Planted
17 M m3/y harvested
1.7 M m3/y Solid wood
4.1 M tons/y Pulp
5,048 employees
US$11.1 billion in assets
Sales: 878
Sales 3rd parties: 839
EBITDA: 120
EBITDA margin: 14%
1.3 M tons/y
3,538 employees
US$1.4 billion in assets
Sales: 1,771
Sales 3rd parties: 1,769
EBITDA: 241
EBITDA margin: 14%
657 Th. tons/y
8,638 employees
US$2 billion in assets
46%
17%
37%
68%
11%
23%
7
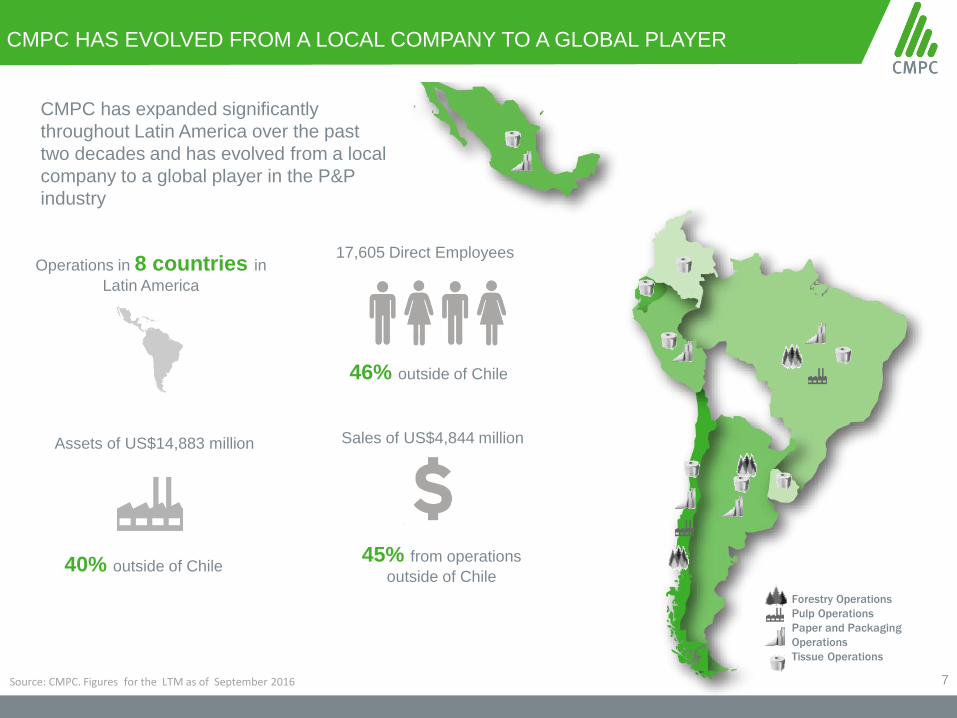
CMPC HAS EVOLVED FROM A LOCAL COMPANY TO A GLOBAL PLAYER
Assets of US$14,883 million
40% outside of Chile
Operations in 8 countries in
Latin America
Forestry Operations
Pulp Operations
Paper and Packaging
Operations
Tissue Operations
Sales of US$4,844 million
45% from operations
outside of Chile
17,605 Direct Employees
46% outside of Chile
CMPC has expanded significantly
throughout Latin America over the past
two decades and has evolved from a local
company to a global player in the P&P
industry
Source: CMPC. Figures for the LTM as of September 2016

8
CMPC HAS A PRODUCT AND GEOGRAPHIC DIVERSIFICATION OF SALES THAT PROVIDES FLEXIBILITY
Source: CMPC. Figures in US$ million for the LTM as of September 2016 / Figures do not include Holding and Intercompany Sales.

2. LOW COST PRODUCER WITH WORLD CLASS ASSETS
II. CMPC’S VALUE PROPOSAL

10
CMPC BENEFITS FROM ITS PRODUCTION COST EFFICIENCIES AND WORLD CLASS ASSETS
Energy investments based
in biomass and natural gas
cogeneration
Access to
low cost fiber Research and Development
to enhance efficiency,
productivity and customer
satisfaction
State of art
facilities strategically
located

11
Eucalyptus Average hardwood growth rate
(m3ssc/ha/year)
Radiata Pine Average softwood growth rate
(m3ssc/ha/year)
11
2023
43 43
E.
Glo
bu
lus
Ibe
ria
n
E.
Glo
bu
lus
Ch
ile
Aca
cia
Ma
ng
ium
Eu
ca
lyp
tus
Bra
zil
E.
Nit
en
s C
hil
e
2 4 511
19
Ru
ssia
Sca
nd
ina
via
Ca
na
da
US
A
Ch
ile
HIGH YIELD FORESTRY ASSETS THAT PROVIDE LOW COST FIBER RESOURCES
647,000 Planted hectares
474,200 Chile
117,600 Brazil *
55,200 Argentina
CMPC Forest
Base is FSCR
Certified
Improvement in Forestry Yields **
** Evolution of the weighted increase of volume per
hectare expected for eucalyptus and pine plantations
established in Chile in the respective year
CMPC has a high quality and sustainable forestry base with fast growth cycles which optimizes capital invested in land,
reduces average distance to mills and increases gains due to genetic and sylvicultural practices
Source: CMPC.
*There is an agreement to acquire from Fibria aprox. 100 Th. hectares of which 39 Th. are planted. CMPC is waiting the approval of Brazilian authorities to consolidate this land
** m3ssc: solid m3 without bark
Over 1 million hectares of land
0%3%
9%
14%
23%
32%
1975 1980 1990 2000 2010 2020P

12
PULP DIVISION: LARGE SCALE PRODUCER WITH GLOBAL CLIENT BASE
Market Pulp Capacity Ranking
Laja BSKP - Chile 340 Th. tons/y
Pacífico BSKP - Chile 500 Th. tons/y
Santa Fe BEKP - Chile
1,500 Th. tons/y
Guaíba BEKP - Brazil
1,759Th. tons/y
Source: CMPC and Hawkins Wright as of August 2016 (million tons)
1,440
2,210
1,610
1,070
905
60
700
1,765
340
100
170
1,335
1,715
3,285
3,560
3,055
3,055
5,300
215
635
60
485
- 2,000 4,000 6,000
Illim
Georgia Pacific
Paper Exellence
Stora Enso
UPM-Kymmene
APRIL
Suzano
CMPC
Arauco
Fibria
BSKP BHKP Other

13
0
100
200
300
400
500
600
700
0 5,000 10,000 15,000 20,000 25,000 30,000
(US
$/T
on
c.i.
f. C
hin
a)
(Th. metrics Tonnes)
0
100
200
300
400
500
600
700
0 5,000 10,000 15,000 20,000 25,000
(US
$/T
on
c.i.
f. C
hin
a)
( Th. metrics Tonnes)
BSKP1 Supply Curve (US$/ton)
CMPC’S CASH COSTS ARE AMONG THE LOWEST OF THE PULP INDUSTRY GLOBALLY
Source: CMPC and Hawkins Wright as of August 2016
(1) BSKP: Bleached Softwood Kraft Pulp
(2) BHKP: Bleached Hardwood Kraft Pulp
CMPC’s pulp facilities
CMPC’s pulp facilities
BHKP2 Supply Curve (US$/ton)
CMPC’s average distance from… to…
Source: CMPC
163 Km.
93 Km.
119 Km.
208 Km.
80 Km.
93 Km.
99 Km.
260 Km.
(by train)
(by train)
(by train)
(by barges)
Laja
Guaíba
Pacífico
Santa Fe
Plantations Ports

II. CMPC’S VALUE PROPOSAL
3. STRONG BALANCE SHEET AND FINANCIAL TRACK RECORD

15
Financial Debt / Equity (Covenant: <0.8x) Interest Coverage Ratio (Covenant: >3.25x)
Sales Evolution (US$ million) EBITDA and EBITDA Margin Evolution (US$ million)
KEY FINANCIAL FIGURES AS OF SEPTEMBER 30TH, 2016
Source: CMPC
Source: CMPC
Source: CMPC
Source: CMPC
4,759 4,974 4,900 4,841 4,844
2012 2013 2014 2015 LTM
914964 985
1,0991,059
19% 19% 20%23% 22%
0%
5%
10%
15%
20%
25%
30%
35%
40%
45%
50%
0
200
400
600
800
1,000
1,200
2012 2013 2014 2015 LTM
0.48x 0.48x
0.56x
0.52x0.53x
0.44
0.46
0.48
0.50
0.52
0.54
0.56
0.58
2012 2013 2014 2015 3Q16
5.45x
5.67x
5.31x
5.94x
5.19x
4.80x
5.00x
5.20x
5.40x
5.60x
5.80x
6.00x
2012 2013 2014 2015 3Q16

16
4.5
1.5
2.3
0.9
2.8
1.5
3.3
1.8
3.4
3.8
3.4
0.0
0.5
1.0
1.5
2.0
2.5
3.0
3.5
4.0
4.5
5.0 Acquisition of Pacífico and Santa
Fe I
Santa Fe II
Investment Period
Guaíba I
AcquisitionGuaíba II
Investment Period
DEMONSTRATED CAPACITY TO MANAGE LEVERAGE
Net Debt / EBITDA
Source: CMPC

17
- -
499 498
-
495
991
479
57
260
152 195
147
281
106
47
2016 2017 2018 2019 2020 2021/2022 2023/29 2030/39
Bonds Banks Interests
CMPC’S DEBT PROFILE AS OF SEPTEMBER 30TH, 2016
Amortization schedule (as of today)
Source: CMPC
Debt Profile
Average term: 5.7 years
Average cost in US$: 4.2%
Total Debt: US$4,206 million
Cash: US$596 million
Net Debt: US$3,610 million
Debt by Type Debt by Interest Rate Debt by Currency Debt by Issuer
Banks
7%
Bonds
71%
BNDES
14%
ECA
8%
Fixed
Rate
94%
Variable
Rate
6%
CLP
3%
USD 87%
BRL
6%
Other
4%
Inversion
es CMPC
72%
Tissue
6%
Pulp
22%
II. CMPC’S VALUE PROPOSAL
4. COMMITTED TO SUSTAINABLE DEVELOPMENT AND CORPORATE GOVERNANCE
19
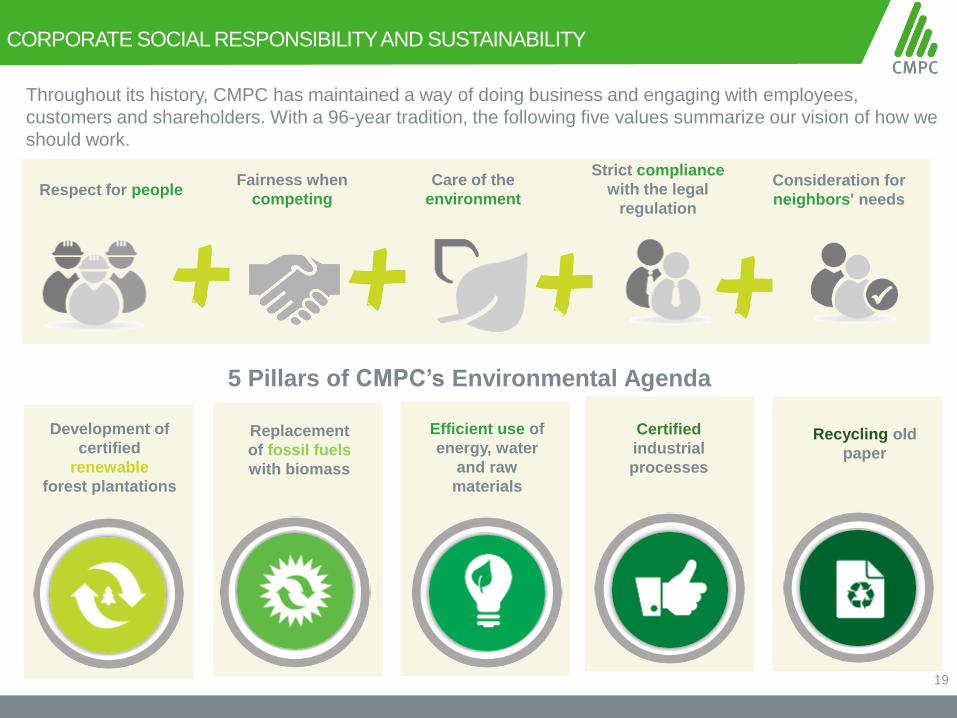
CORPORATE SOCIAL RESPONSIBILITY AND SUSTAINABILITY
Throughout its history, CMPC has maintained a way of doing business and engaging with employees,
customers and shareholders. With a 96-year tradition, the following five values summarize our vision of how we
should work.
Strict compliance
with the legal
regulation
Consideration for
neighbors' needs Respect for people
Fairness when
competing
Care of the
environment
Development of
certified
renewable
forest plantations
Replacement
of fossil fuels
with biomass
Efficient use of
energy, water
and raw
materials
Certified
industrial
processes
Recycling old
paper
5 Pillars of CMPC’s Environmental Agenda

20
BOARD OF DIRECTORS
CORPORATE GOVERNANCE IN CMPC
Luis Felipe
Gazitúa
Chairman
Vivianne
Blanlot
Jorge
Marín
Independent
Jorge
Larraín Jorge
Matte
Ramiro
Mendoza
Bernardo
Matte Rafael
Fernández
Independent
Pablo
Turner
Current members: Vivianne Blanlot,
Rafael Fernández and Jorge Marín CMPC’s Board of
Directors
CMPC’s
Management
CMPC’s Subsidiary’s
Board of Directors
CMPC’s Subsidiary’s
Management
Appoints
Board
Members
Directors
Committee
Financial Risk
Committee
Audit
Committee Comptroller
Current members: Vivianne Blanlot
and Ramiro Mendoza
Current members: Bernardo Matte
and Jorge Marín
Other initiatives: Business Ethics Guidelines, Corporate Governance Guidelines, Antitrust Guidelines,
Anticorruption Policies, Whistle Blower Hotline

II- CMPC’S VALUE PROPOSAL
5. DIVERSIFIED INVESTMENT PORTFOLIO

22
CMPC HAS A DIVERSIFIED INVESTMENT PORTFOLIO
CMPC is finishing the largest investment cycle of its
history
Guaíba II Project – May 2015
Tissue paper machine in Altamira, México (2Q15)
Cogeneration Facilities: Puente Alto Mill,
Talagante Mill and Altamira Mill.
Focus in 2016-2017
Continue to increase tissue paper and conversion
capacity
Cañete Mill (Peru)
• Capacity: 50 th. tons/year
• Investment: US$ 139 million
• Start-up: 1Q17
Operational continuity projects to further increase
efficiency
Laja Pulp Mill
Guaíba I Pulp Mill
Maule Boxboard Mill
Cañete Mill - Perú
23
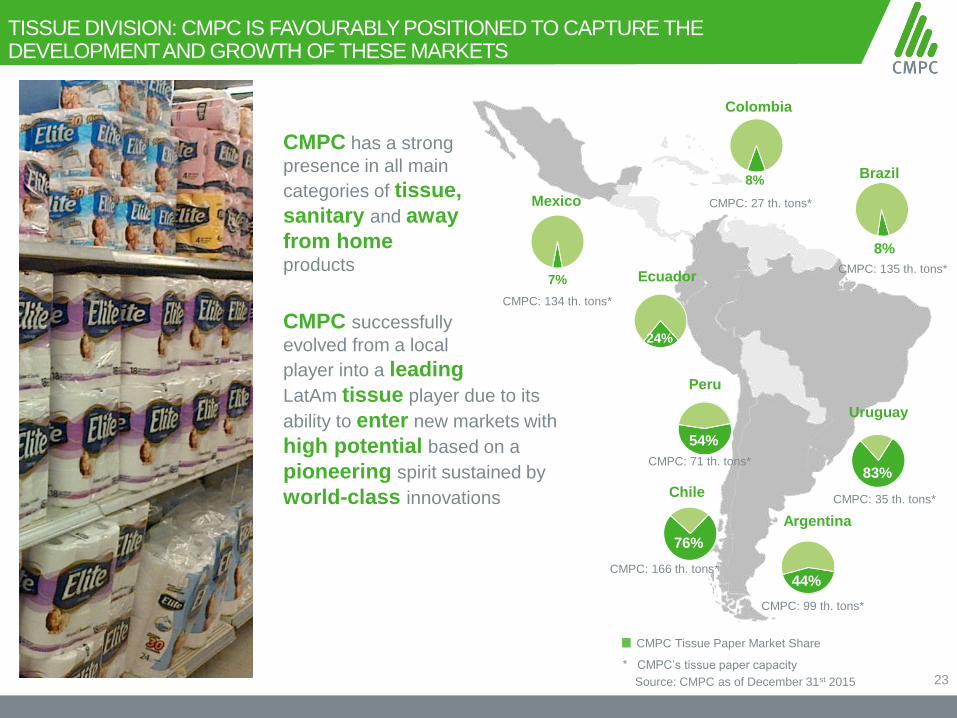
TISSUE DIVISION: CMPC IS FAVOURABLY POSITIONED TO CAPTURE THE DEVELOPMENT AND GROWTH OF THESE MARKETS
Chile
Argentina
Uruguay
Peru
Mexico
Colombia
Brazil
76%
8%
44%
83%
8%
7%
54%
CMPC Tissue Paper Market Share
Source: CMPC as of December 31st 2015
Ecuador
24%
CMPC has a strong
presence in all main
categories of tissue,
sanitary and away
from home
products
CMPC: 134 th. tons*
CMPC: 71 th. tons*
CMPC: 166 th. tons*
CMPC: 27 th. tons*
CMPC: 135 th. tons*
CMPC: 35 th. tons*
CMPC: 99 th. tons*
CMPC successfully
evolved from a local
player into a leading
LatAm tissue player due to its
ability to enter new markets with
high potential based on a
pioneering spirit sustained by
world-class innovations
* CMPC’s tissue paper capacity

24
Per Capita Tissue Consumption
Source: CMPC as of December 2015
CMPC SEEKS TO TAP LATAM UNDERPENETRATED TISSUE MARKETS
High growth potential in Tissue Paper and Sanitary Products in Latin America based on the following fundamentals,
4.4 Kg. 1.2 kg 0.4 kg 0.1 kg
LatAm Average Tissue Consumption 6.1 kg/person
Baby Diapers Feminine
Protection Incontinence
LatAm Sanitary Products Penetration*
73% 72%
TISSUE PAPER Population growth and urbanization
Economic growth
Increase in per capita consumption
Higher quality products
SANITARY PRODUCTS Child population growth
Economic growth
Higher penetration levels
14%
Source: Price Hanna
India
Phillippines
Indonesia
Vietnam IranThailand
RussiaSouth AfricaEcuadorColombia MalaysiaGuatemala China
Peru
VenezuelaBrazil Turkey
RomaniaArgentina
El SalvadorLebanonMexico Slovakia
TaiwanCzech RepublicRepublic of Korea
Lithuania
Poland Estonia CroatiaHungaryChileCosta Rica Italy FrancePortugal
SpainGreece
AustraliaBelgiumJapan
NetherlandsSlovenia New Zealand
Israel IrelandUK
FinlandDenmark
SwitzerlandGermany
Austria Sweden
Hong KongCanada
USA
0.00
5.00
10.00
15.00
20.00
25.00
0 10 20 30 40 50
Tís
su
e P
ap
er
Ap
p. C
on
su
mp
tio
n (
k/h
ab
.)
GNI p/c (thousand US$ at ppp)

III. CHALLENGES 2016-2017

26
CMPC WILL BASE ITS STRATEGY IN 4 PILLARS TO CONSOLIDATE ITS LEADERSHIP IN THE P&P INDUSTRY
1. Continue running at full capacity across all business units
2. Expand tissue capacity with new facility in Peru
3. Focus in cost control and enhance efficiency
4. Reduce leverage, lower Net Debt / EBITDA
among all business divisions and countries

IV. APPENDIX

28
APPENDIX I: ANNUAL CAPACITY BY PRODUCT/COUNTRY
Business Area Product / Country Capacity
Forestry
Sawn wood 1.0 M m3
Remanufactured wood 190 th. m3
Plywood 500 th. m3
Pulp
BSKP (Laja) 340 th. tons
BSKP (Pacífico) 500 th. tons
BEKP (Guaíba) 1.750 th. tons
BEKP (Santa Fe) 1.496 th. tons
Papers
Boxboard 431 th. tons
Paper Bags 93 th. tons
660 M bags
Corrugated Paper 330 th. tons
Corrugated boxes 285 th. tons
Molded Pulp trays 18 th. tons
296 M units
Other Papers 140 th. tons
Tissue
Chile 166 th. tons
Brazil 135 th. tons
Argentina 99 th. tons
Mexico 134 th. tons
Peru 71 th. tons
Uruguay 35 th. tons
Colombia 27 th. tons 28

29
APPENDIX II: NEW BEKP CAPACITY IN THE 4OO+ MILLION TONNES FIBER MARKET
Source: Own elaboration based on RISI 5-year Forecast (2016-2020) Data 2015 - June 2016 + HW data April 2016
422 million tons of total
fibers
62 million tons
of market pulp
30 million tons
of BHKP
Fiber World Consumption required
to produce 408 million tons of
Paper&Board Virgin fiber used to produce
Paper&Board
(million tons) Market Pulp consumed to
manufacture Paper&Board
(million tons)
Virgin Pulp 181 million
tons (43%)
Recovered Paper
241 million tons
(57%)
Market Pulp
62 million tons
(34%)
Integrated 119
million tons
(66%)
BSKP 24
BHKP 30
Sulphite
UKP 2
Mec 5

30
APPENDIX II: EUCALYPTUS PULP GROWTH HAS OUTPACED OTHER HARDWOOD FIBERS BECAUSE OF ITS COST AND QUALITY ADVANTAGES
Source: CMPC, Hawkins Wright
Higher pulp production yield than other species
Fast growing trees: shorter rotation, less land required and better performance
Superior structural properties for several paper & paperboard applications
Paper manufacturers looking for BEKP to premium tissue products
BEKP replacing other fibers
0
5
10
15
20
25
30
35
40
1990 1995 2000 2005 2006 2007 2008 2009 2010 2011 2012 2013 2014 2015 2016 2019
Millio
n t
on
s
Market pulp demand
BSKP BHKP BEKP

31
APPENDIX II: THE PAPER INDUSTRY HAS GROWN, SPECIALLY IN THE PACKAGING SEGMENT
Since 1992 paper production has grown 61%, mainly explained by: 106 million additional tons of packaging paper
33 million additional tons of P&W papers
18 million additional tons of tissue papers
Since 2007, Packaging and Tissue have continued to grow, while P&W has declined
Source: RISI
Mill
ion T
ons
32 33 34 35 35 36 36 38 39 38 37 37 39 38 38 38 37 32 32 31 30 28 26
74 76 83 85 85 93 94 98 104 99 102 105 112 113 117 119 116 106 111 110 108 106 105
114 115 123 127 131
138 138 144
148 148 156 161 171 177
186 194 196 191
206 210 214 220 226 15 16
16 17 18 19 19
20 21 22
23 23
24 25 26
27 28
28
29 30 31 32 33
15 14 15
15 16 16 15
16 15 15
14 15
15 14
15 15 15
14
16 17 16 16 16
-
50
100
150
200
250
300
350
400
450
1992 1993 1994 1995 1996 1997 1998 1999 2000 2001 2002 2003 2004 2005 2006 2007 2008 2009 2010 2011 2012 2013 2014
Mil
lio
n t
on
s
Newsprint P&W Packaging Tissue Other P&B

32
CONTACT INVESTOR RELATIONS
Colomba Henríquez
+(562) 2 441 2791
Isidora Farías
isidora.farí[email protected]
+(562) 2 441 2713
Disclaimer:
This document provides information about Empresas CMPC SA. In any case this constitutes a comprehensive analysis of the financial, production and
sales situation of the company, so to evaluate whether to purchase or sell securities of the company, the investor must conduct its own independent
analysis.
In compliance with the applicable rules, Empresas CMPC SA. publishes this document in its web site (www.cmpc.cl) and sends to the Superintendencia
de Valores y Seguros, the financial statements of the company and its corresponding notes, which are available for consultation and review.
Recommended