DISCLAIMER: Orient Capital Pty Ltd has taken all reasonable care in publishing the information contained in this document; furthermore, the entirety of this document has been approved for release to the market by the participating company. It does not purport to be complete. The information contained is not intended to be used as the basis for making any investment decision and you are solely responsible for any use you choose to make of the information. We strongly advise that you seek independent professional advice before making any investment decisions. Orient Capital Pty Ltd is not responsible for any consequences of the use you make of the information, including any loss or damage you or a third party might suffer as a result of that use.
Company: Brambles Limited Title: Financial Year 2015 Results Date: 20 August 2015 Time: 9:45 AM AEST
Start of Transcript
James Hall: Good morning everyone, it's James Hall speaking here from the Brambles Investor Relations
Team. Sorry that we've had a slight delay in getting started this morning. Thanks for joining us for the
presentation of our 2015 financial year results. We will be opening the lines for Q&A in a short while. Please
be ready with your questions. But first we'll be - we'll go to some prepared remarks from our CEO Tom
Gorman and our CFO Zlatko Todorcevski. I'll just remind you that all forward looking statements are subject
to the disclaimer on slide 50 of the deck that we lodged with the ASX this morning.
Tom Gorman: Well good morning; this is Tom Gorman speaking and thank you very much for joining us
today. I would like to start today's presentation by recognising that the Brambles team delivered a solid
result for the 2015 financial year. This was delivered despite underlying operating conditions which remain
challenging; the result was in line with our guidance. At constant currency sales revenue was up 8% and
underlying profit was up 10%. This positive leverage to the bottom line reflected the strong delivery of
efficiencies.
Now in our largest segment which is the pallets business, the result reflected the very strong European
performance contrasted by some ongoing cost pressures in the US. Our RPC segment delivered a result
that reflected strong sales and profit growth. In containers the key feature of the year was the acquisition of
Ferguson and I am pleased to say that it delivered a solid contribution despite the challenging conditions we
face in the oil and gas sector. Our final dividend for the year is AUD0.14 per share which is the same
amount as the interim dividend and is up AUD0.05 on the 2014 final dividend. We are reactivating our
dividend reinvestment plan for this dividend on a non-underwritten basis and with a modest discount of 1.5%.
Reactivating the DRP will provide additional flexibility in support of our strong balance sheet position as we
continue to fund our growth strategy in particular with regard to small bolt-on acquisitions.
In addition to our FY15 result I would also like to talk about our outlook and our expectations for future
investment in the business. Notwithstanding the challenges presented by continued uncertain and lacklustre
economic conditions and the generally low global growth rates, we expect our growth to remain strong. In
fact our outlook reflects an increased level of investment opportunity that we believe is available to Brambles
given the unique position we enjoy in the supply chains we serve. We expect sales revenue and underlying
profit growth in FY16 of between 6% and 8% at constant currency. Now that translates to an underlying
profit range of between US$1 billion to US$1.02 billion and that is at 30 June 2015 foreign exchange rates.
Return on capital invested is likely to be down slightly in FY16 and this is reflecting the investments we
expect to undertake during the period as well as higher goodwill as a result of recent acquisitions. We

2
remain committed to delivering our FY19 objective which we set back in December of 2013 and this was an
objective to achieve a return on capital invested of 20% exclusive of the impact of acquisitions made since
that date. We currently expect to invest US$1.5 billion of growth capital expenditure from FY16 to FY19.
This spending is over and above our replacement capital expenditure over the next few years which we
expect to remain broadly stable.
I will talk about the scope of these opportunities in some depth later on but our investment plans are
weighted to FY16 and to a lesser extent FY17. These largely relate to supporting availability to CHEP
customers in the US as the inventory cycle continues to pick up in that market, supporting major retail
partners in the RPC sector in response to strong demand, as well as appetite for differentiated
merchandising offerings - and the continued rolling out of a broader range of fractional and display pallet
offerings worldwide as well as higher growth in emerging markets. In addition we continue to invest in our
brand and in innovation projects. Now these investments reflect our confidence in the future and the unique
position we hold in our customers' supply chains.
Now I will now briefly cover our safety performance before moving on to looking at the financial results in a
bit more detail. The Brambles injury frequency rate continues to decline as we drive better performance in
our recently acquired businesses. Notwithstanding this strong performance however, I am extremely
saddened to report that we did suffer a fatality during the year. This fatality was the result of a road traffic
accident involving one of our vehicles in the US recycled pallet business, it occurred in December. The
accident resulted in the death of our driver and a person in another vehicle. The entire Brambles team were
saddened by this tragic accident and we continue to stay focused on delivering a zero harm work
environment.
Turning now to the key financial highlights of the FY15 result. You can see clearly in the comparison of the
actual and constant currency growth columns the impact of foreign exchange on our reported results. It is
very important to remember, however, that out exposure is purely a result of translating local currency into
US dollars for reporting purposes. We have negligible transactional exposure in our operating businesses
and for that reason I will focus on constant currency performance throughout the course of my comments.
Sales revenue was up 8% to almost US$5.5 billion reflecting a two percentage point contribution from
acquisitions, solid new business and lane expansion and modest contribution from organic volume increases
and pricing.
Operating profit was also up 8% to US$939 million. The slightly lower rate of growth in profit after tax which
was up 7% to US$586 million reflected the non-deductibility of some significant items. Underlying profit
which is operating profit excluding significant items was up 10% to US$986 million. This profit leverage
reflected efficiency gains for the Group which was very pleasing in the context of the increased cost we have
been experiencing in the US part of our pallet operations. Return on capital invested was down half a point
to 15.7% as a result of the good will impact of acquisitions, most notably Ferguson. Excluding acquisition
impacts, return on capital invested was up 30 basis points or 0.3 percentage points to 16.6%. Brambles
value added or BVA as we refer to it - was broadly flat at US$272 million. Cash flow from operations
declined US$99 million to US$729 million reflecting increased CapEx in the period to fund our growth.

3
Now moving on to look at the delivery scorecard for the year, I also believe we did well. Our sales revenue
growth was at the low end of the 8% to 9% guidance range we provided in November. While 6% growth
excluding acquisitions was just below our target range of 7% to 9%. We have delivered against all our other
key targets for the Global Supply Chain efficiencies program, underlying profit growth, return on capital
invested excluding acquisition impacts and free cash flow after dividends.
Now in addition to the delivery scorecard I would like to touch on the key actions undertaken in the second
half in the context of the focus areas we set out at the half year result which we presented in February. The
first point was cost on which we said we would seek to mitigate transport inflation and deploy pallet durability
actions in the CHEP USA business to offset higher plant costs. Both those actions are underway and we
experienced a moderated level of plant and transportation cost growth in the second half compared to the
first half. As discussed at the first half result, our durability improvements included the roll-out of a new of a
new clinch nail process for repairing pallets and the addition of a new nail plate to all new pallet purchases.
In FY16 we anticipate that 25% of the pool will have been repaired with the clinch nail process and that 60%
of new pallets will have nail plates. The financial implications of this are broadly neutral in FY16 and are
forecast to drive a benefit from FY17 onwards.
On the second point which is brand, the global refresh of the CHEP brand launched officially in North
America in June. Using the theme - this is the supply change - this campaign is about repositioning CHEP
as a provider of a differentiated portfolio of solutions and has been extremely well received by our customers.
We'll show investors more of this at the investment market briefing in Southern California in September. The
CHEP brand refresh will roll-out on a phased basis in other regions over the course of FY16 and FY17.
Now the third point was on innovation. We are increasingly undertaking projects alongside customers to
develop applications and technology solutions specific to their supply chain needs - which we can also
discuss further at the briefing next month. In addition we continue to explore the current structure and the
correct business model in the arena of the internet of things as we explore opportunities to leverage both our
asset base as well as our data in this fast evolving space.
Now the fourth point was our growth strategy. Total FY15 growth CapEx was about US$350 million as we
continued to invest in opportunities throughout the Brambles Group. We made two small acquisitions in the
RPC business, Rentapack in Chile which gives us a bigger footprint in our very strong South American
business and IFCO Japan which gives us control at a very attractive multiple of a business of which we
previously owned one third. In Africa we also made a small acquisition it the period, a timber plantation
business which further strengthens our lumber security in the region. We continue gradually to expand our
footprint on the African continent with initiatives in countries such as Zambia and Morocco.
I will now cover each of our segmental results in a bit more detail; I'll start with the pallet segment. Here new
business growth, pricing and mix gains and like for like volume growth contributed in roughly equal
proportion to total sales revenue growth of 5% at constant currency. In emerging markets, growth of 12%
was robust if a little bit below the recent trend of more than 15%. This was primarily a result of a somewhat
lower rate of growth for our Latin American business. A major highlight of the year in pallets was the
outstanding result in Europe. Where mix improvement, specific pricing actions and a strong level of

4
efficiencies all contributed to a great year. This performance was more than enough to offset the negative
impact of the ongoing cost pressures in the Americas from higher plant and transport costs and at constant
currency enabled underlying profit to grow 6% and return on capital invested to increase by 20 basis points.
The RPC result was greatly improved on the prior year with contact FX sales revenue growth of 12%. This
was driven by a particularly strong rate of growth in Europe as we continue to drive conversions from
cardboard to RPCs with both existing and new retail partners. The rate of growth we are experiencing for
IFCO in Europe is well above what we assumed when we acquired this business. The growth is a real credit
to the strength of our relationship with retailers in the region as show by our recent extension of our contract
with REWE which is our biggest customer. Underlying profit growth in RPCs was 15% and ROCI increased
by 70 basis points. Excluding goodwill impacts from the IFCO acquisition our RPCs portfolio delivered
returns on tangible capital invested of 18.7% in the year. This margin growth reflected scale related network
and transportation efficiencies in Europe and the non-recurrence of various one off items in the prior period
which were more than enough to offset higher depreciation costs as the pool grew.
Now the containers segment results vary by supply chain and this reflects the breadth of operations in this
segment. Total sales revenue was up 31% at constant currency although this largely reflected the impact of
Ferguson, Transpac and Airworld acquisitions. Excluding these acquisitions, sales revenue growth was 4%
as we continue to seek to offset a challenging growth environment in some of our operations. In automotive
- although second half growth rates were much improved in the European business and the relatively small
North American and Indian businesses continue to growth strongly - our Australian operations remain
exposed to the decline of car manufacturing in this country.
The performance of the intermediate bulk containers business continued to be strong with growth rates there
reflecting market share gains in all regions. Now in the oil and gas supply chain, Ferguson's pro forma
constant currency sales revenue growth for FY15 was 7% which we believe is a solid result amid the
challenging conditions in this sector. Our pre-existing catalyst and chemical containers business which has a
strong market position experienced lower levels of the customer shutdown and turnaround activity that drives
its volumes. Aerospace growth has begun to increase in line with the onboarding of some of our recent
customer wins. Underlying profit growth of 10% and ROCI growth of 60 basis points, excluding acquisitions,
reflect the continued indirect costs disciplines within the containers business. It's now my pleasure to hand
over to Zlatko who will walk you through the financials in a bit more detail.
Zlatko Todorcevski: Thanks very much Tom and good morning everyone. I'll start with a more detailed look
at the key drivers of our sales revenue growth. I remind you that all figures as in US dollars and
comparisons in constant currency unless otherwise stated. Net new business wins in the pallet segment
were US$64 million, approximately one third of the total pallet sales revenue growth. It's important to
remember that his growth, as well as the RPC's growth of US$105 million comes from the consumer staples
sector which while non-volatile, also has a very low rate of underlying growth in the current global economic
environment. In this context the growth we're delivering is quite robust.
The container segment growth reflected a relatively mixed set of conditions in the four supply chains we
serve as well as acquisitions in the period. This chart highlights the translational impact of the strong US

5
dollar during the period which amounted to US$363 million. We have negligible transactional exposures to
FX moves as our local business costs are mostly in local currency. An extended breakdown of our FX mix
and prevailing rates applicable during the period is included in the appendices to this presentation.
Now let's look at underlying profit in more detail. The contribution of volume, price and mix of US$134 million
reflects the strong operating leverage we delivered on sales growth during the period. US$24 million of our
profit growth came from newly acquired businesses with Ferguson being the largest contributor. There was
also a US$34 million benefit from the delivery of the Global Supply Chain program. We've broken out the
direct cost impact of the Pallets Americas businesses from direct cost increases in other businesses. The
US$74 million increases in Pallets Americas has been challenging and reflected the impact of improved
asset recoveries on repair and transportation costs as well as a spike in freight carrier rates during the year.
Although there as some modest reduction in the rate of cost increase in both these areas in the second half
we expect the pressure to continue into FY16. I'll talk more about this on the next couple of slides. The
remaining increase in direct costs of US$10 million was mostly driven by higher depreciation as we increase
the size of the pool to support growth in RPCs in particular. The increase on other costs was largely a result
of US$10 million of costs allocated to Recall in the prior corresponding period. Versions of this slide for each
of our segments are included in the appendices.
This next slide looks at transports cost in the pallets business in more detail. As you can see from the chart,
although there has been a strong spike in transport costs in the Americas, shown as the dark blue line, our
Europe, Middle East and Africa business - the bright blue line at the top - experienced a strong reduction in
the year. The thick black line is a weighted average for the whole pallet segment which, as you can see, has
in fact moved very little in five years. This reflects how the diversity and breadth of our business tends to
mitigate against the impact of trends in any one region. For example, the decrease in transport costs in
Europe, Middle East and Africa in FY15 was largely a result of efficiencies being delivered in a low inflation
environment. Conversely the increase in the US was a result of system wide inflation and freight carrier
costs of about 8% which we've only been able to offset slightly to date through pricing initiatives. We would
expect both the positive trend in Europe and the negative trend in the US to be less pronounced in FY16
albeit the pressures in the US will remain. Transport costs in Asia Pacific - the light blue line at the bottom of
the chart - are inherently lower because of the predominance of the transfer hire model in this region.
Plant costs follow a not dissimilar trend to transport costs. The increase in the Americas has been offset by
improvements in Europe, Middle East and Africa. However, the key difference is that while trends for
transport costs are largely driven by extraneous factors, plant costs increases in the Americas - shown as the
dark blue line at the top - are primarily the result of deliberate actions we've taken in the way we manage our
pools. In the Americas increased recoveries and reduced losses from improved asset management have led
to a higher average pool age. This has driven a higher cost of repairs because older pallets tend to pick up
more damage so the cost of repairing them to customer specifications is higher. At the same time we remain
committed to meeting customer quality requirements with our pallet repairs which has supported the
elimination of the commitment to provide some customers with new pallets. While these trends have had a
negative short term impact on margins, they reflect that we are running the business for the long term.
Additionally the investments we have begun to make in pallet durability by changing both repair practices

6
and pallet design are underway. Coupled with some replenishment of the pool to support supply chain
restocking, these changes should have a mitigating effect on plant costs in future years. I'll discuss this in
more detail when I cover the CapEx outlook in a few slides.
The declining plant costs in Europe, Middle East and Africa shown at the bottom of the chart again reflect the
delivery of cost efficiencies in a low inflation environment. The systemically lower plant cost ratio in Europe,
Middle East and Africa reflects the use of managed exchange in Europe as well as the diversity of the pool in
that market given that fractional and display pallets require less repair than do full size wooden pallets.
I'll briefly touch on the indirect cost trend for the Group in the context of the targets we've set under the One
Better business improvement program. Those targets for FY19 compared with FY14 are to reduce total cost
by US$100 million and to reduce the overheads to sales ratio by at least two percentage points. As you can
see from the chart we're making strong progress in reducing the sales to overheads ratio. It's important
when looking at this chart to note the impact of acquisitions as the purchase of IFCO in 2011 decreased the
Group's average overheads to sales ratio substantially. In FY15 we delivered US$11 million of reductions
from quick wins, we're on track to achieve a cumulative US$30 million of the US$100 million target by the
end of FY16.
Much of the early benefit will come from the Better Purchasing initiative where we will leverage our
procurement scale globally. The other elements of One Better are divided into two groups. Firstly, Better for
the Customer which are initiatives focused on simplifying processes and making it easier for our customers
to do business with us. Secondly, Better for the Business focused on driving alignment and simplification
and key internal functions like finance, HR and IT. We're making good progress in both areas and I'll talk
more about these programs at the investor briefing next month.
This next slide covers a reconciliation from underlying profit to statutory reported profit. Underlying profits
which excludes significant items was up 10% in the year at constant currency compared with 8% growth in
statutory operating profit. Significant items rose to US$47 million from US$31 million in the prior period due
to the ramp up of the One Better program, acquisition related costs and the cost of our brand refresh in the
pallets business. At the operating level the difference between actual and constant currency growth, as
we've explained, is purely a result of the translational impact of the stronger US dollar. In finance costs the
impact of higher net debt as a result of funding the Ferguson acquisition was offset by the impact of the
weakening Euro relative to the US dollar. Our net debt by currency is set out in the appendices where you
can see that the Euro accounts for about 55% of net debt compared with about 24% of sales revenue. Our
effective tax rate was 29%, broadly in line with the prior year but impacted by the non-deductibility of some
significant items.
Now turning to cash flow. Cash flow from operations at US$729 million was US$99 million lower than the
prior year. This was a result of increased capital expenditure to support customer growth which I'll cover in
more depth on the next slide. The positive effect in the year of foreign exchange moves on our funding costs
is apparent when we look at free cash flow. Although FX adversely impacted our EBITDA outcome it also
resulted in reduced financing costs because of the weaker Euro and lower dividends paid because of the
weaker Australian dollar. There was also some positive cash flow impact in the period due to timing of tax
7
payments and recoveries. As a result, total free cash flow after dividends improved US$8 million to US$45
million in the year.
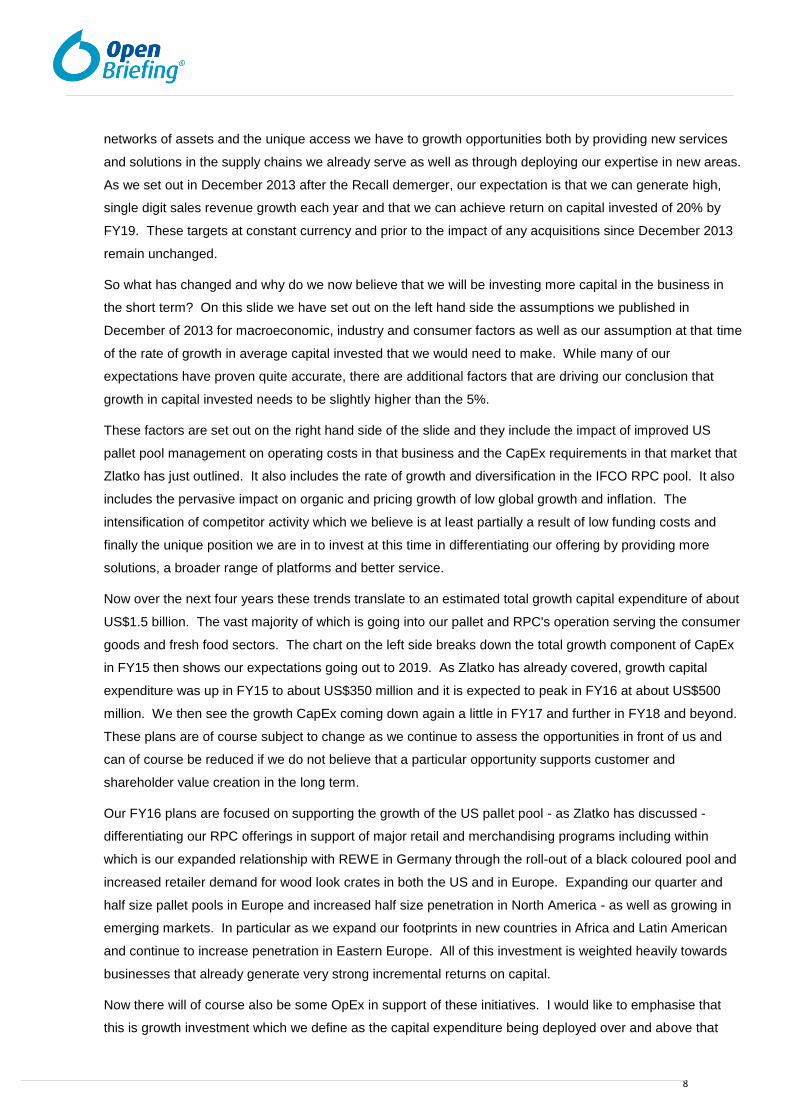
I'll now look at capital expenditure in more detail. The chart on this slide shows replacement CapEx in grey
with growth CapEx for each of our business segments over the past five years and our forecast for FY16 of
US$1.1 billion of which US$500 million is for growth. The first point is that replacement CapEx has remained
relatively stable. This is despite continued growth in the size of the pool and is due to improvements in asset
management. The second relates to RPCs where we say a strong increase in growth CapEx in FY12 post
the IFCO acquisition. CapEx is now increasing again in response to strong growth in Europe and customer
demand for differentiated merchandising such as a new black coloured pool in support of REWE in Germany
and wood look crates for other retailers. The third point is that growth CapEx has also increased the support
acquisitions in containers. The final point is that we're beginning to see increase in growth CapEx again in
pallets. This part reflects gradual supply chain restocking in the US which is driving increased inventories in
the retail supply chain. I'll talk about this in more detail on the next slide.
This next chart shows seasonally adjusted, US Census Bureau data on the ratio of retail trade inventories to
retails sales, excluding the automotive sector. It highlights that we're experiencing a gradual pick up in
inventories, that is restocking is beginning to gather pace in the US supply chain. This would appear to be a
positive sign for the US economy longer term although I must stress we're extremely cautious on any leading
indicators given the ongoing uncertainty in the economy. Increase in retailer inventories also means slightly
longer cycle times as CHEP pallets in the field spend more time in customer warehouses and take a little
longer to return to us. In the short term at least that means more new pallets are needed to meet growth
demand. The need for more investment is amplified by recent plant stock trends shown as the blue line on
the chart. We have driven stocks down to their lowest level for many years and now need to replenish plant
stocks in anticipation of growing demand. While we anticipate increased CapEx and pool growth in response
to these trends please remember that as a result of our improvements and repair quality for the customer we
now have no commitment to provide new pallets to any individual customer. That means we can turn CapEx
off relatively easily if the restocking trend and associated customer demand growth is not sustained.
I'll now close with a short discussion of the balance sheet. Next debt of almost US$2.7 billion at June 2015
was up US$327 million on the prior year primarily reflecting the debt funding of the Ferguson acquisition.
Despite the acquisition we're now back at the net debt to EBITDA of 1.75 times as at 30 June 2015. Our
decision to reactivate the dividend reinvestment plan on a non-underwritten basis reflects our commitment to
staying with our leverage target at a time of increased growth investment. For the sake of consistency it is
our expectation that we will now leave the DRP open for the foreseeable future. I'll now hand you back to
Tom.
Tom Gorman: Well thanks very much Zlatko, I'll now spend just a few minutes reviewing our longer term
outlook and investment plans before we open up for questions. To begin let me reaffirm that the investment
proposition for Brambles is unchanged. At the heart of our proposition is a sustainable, competitive
advantage created by our unique scale, expertise and commitment to our customers' supply chain. This
drives the other two tenants of our investment proposition. The strong rates of return we generate from our
8
networks of assets and the unique access we have to growth opportunities both by providing new services
and solutions in the supply chains we already serve as well as through deploying our expertise in new areas.
As we set out in December 2013 after the Recall demerger, our expectation is that we can generate high,
single digit sales revenue growth each year and that we can achieve return on capital invested of 20% by
FY19. These targets at constant currency and prior to the impact of any acquisitions since December 2013
remain unchanged.
So what has changed and why do we now believe that we will be investing more capital in the business in
the short term? On this slide we have set out on the left hand side the assumptions we published in
December of 2013 for macroeconomic, industry and consumer factors as well as our assumption at that time
of the rate of growth in average capital invested that we would need to make. While many of our
expectations have proven quite accurate, there are additional factors that are driving our conclusion that
growth in capital invested needs to be slightly higher than the 5%.
These factors are set out on the right hand side of the slide and they include the impact of improved US
pallet pool management on operating costs in that business and the CapEx requirements in that market that
Zlatko has just outlined. It also includes the rate of growth and diversification in the IFCO RPC pool. It also
includes the pervasive impact on organic and pricing growth of low global growth and inflation. The
intensification of competitor activity which we believe is at least partially a result of low funding costs and
finally the unique position we are in to invest at this time in differentiating our offering by providing more
solutions, a broader range of platforms and better service.
Now over the next four years these trends translate to an estimated total growth capital expenditure of about
US$1.5 billion. The vast majority of which is going into our pallet and RPC's operation serving the consumer
goods and fresh food sectors. The chart on the left side breaks down the total growth component of CapEx
in FY15 then shows our expectations going out to 2019. As Zlatko has already covered, growth capital
expenditure was up in FY15 to about US$350 million and it is expected to peak in FY16 at about US$500
million. We then see the growth CapEx coming down again a little in FY17 and further in FY18 and beyond.
These plans are of course subject to change as we continue to assess the opportunities in front of us and
can of course be reduced if we do not believe that a particular opportunity supports customer and
shareholder value creation in the long term.
Our FY16 plans are focused on supporting the growth of the US pallet pool - as Zlatko has discussed -
differentiating our RPC offerings in support of major retail and merchandising programs including within
which is our expanded relationship with REWE in Germany through the roll-out of a black coloured pool and
increased retailer demand for wood look crates in both the US and in Europe. Expanding our quarter and
half size pallet pools in Europe and increased half size penetration in North America - as well as growing in
emerging markets. In particular as we expand our footprints in new countries in Africa and Latin American
and continue to increase penetration in Eastern Europe. All of this investment is weighted heavily towards
businesses that already generate very strong incremental returns on capital.
Now there will of course also be some OpEx in support of these initiatives. I would like to emphasise that
this is growth investment which we define as the capital expenditure being deployed over and above that
9
required to maintain our existing pools at their current levels by replacing lost of scrapped assets. I also
emphasise that these programs will be supported by a continued focus on driving cost efficiencies in all
aspects of our business, disciplined capital allocation and leveraging acquired goodwill throughout the
portfolio. Now to shine the light a little more on capital allocation, it is useful to review our current portfolio of
business units in the context of the quantity and quality drivers of value. The horizontal axis represents our
business units' recent rate of growth in average capital invested. The vertical axis represents the business
units' return on capital invested. The bubble size represents the average capital invested in each business
unit at the end of FY15. The darker blue bubbles are the CHEP business units, the green bubbles are IFCO
business units and the lighter blue bubbles are container business units. The chart is not drawn to exact
scale.
What is apparent on this slide is that we have many, very strong businesses that generate strong rates of
return above our notional pre-tax cost of capital at 12%. Some of these such as IFCO South America, the
IBC's business and CHEP emerging market businesses to the right also offer very high growth opportunities.
Others such as the bulk of the CHEP operations and the automotive operations have less strong growth
profiles but given their return profiles, generate a strong return on any capital we can invest. There are a
number of businesses in which acquired goodwill dilutes returns on capital. The three businesses in which
this impact is most significant are the IFCO business in Europe, our oil and gas business and the IBC
business. In all three cases incremental investment on these businesses generates a return well in excess
of 12%, highlighting the attractiveness of investing in these businesses in the future.
Now this leaves three businesses that require a particular focus in terms of disciplined capital allocation.
They include our IFCO North American business, Lean Logistics and CHEP Aerospace. In the case of IFCO
North America we are currently planning to invest proactively as we seek to drive penetration higher, such
that scale will drive asset utilisation and operating efficiencies will improve in the long term. If we did not feel
confident that this increased investment would contribute towards our achievement of that efficiency tipping
point then of course we would not sanction the investment. In the case of Lean Logistics and CHEP
Aerospace, both made progress in FY15 in delivering higher returns although both still have some distance
to travel before they are in fact mature businesses. We will talk in more depth about our current view of our
portfolio at the investor briefing next month.
Now to close I will summarise our guidance and outlook. Over the medium term we remain committed to our
FY19 target of a 20% return on capital invested and again this is prior to acquisition impacts. Second we
expect compound annual growth rate in average capital invested to be slightly higher than the previously
anticipated rate of 5% a year. We anticipate total growth CapEx between now and FY19 to be in the region
of US$1.5 billion. For this year - that is FY16 - we expect constant currency growth in both sales revenue
and underlying profit to be between 6% and 8%. This translates to an underlying profit guidance range of
US$1 billion to US$1.02 billion and that is at 30 June 2015 foreign exchange rates. Return on capital
invested will be down slightly for the year and this reflects the short term impact of increased investment and
of the FY15 acquisitions. We are expecting interest costs in the region of US$120 million to US$125 million
and we expect the effective tax rate on underlying profit to remain about the same as this year at 29%.
Thank you very much for your time this morning, we will now open for questions.
10
James Hall: Thank you Tom, thanks everyone, it's James speaking again here. The first question on the line
I'll go to in a moment. If I can just remind everyone please to sort of ask just one question at a time so we
can get through everybody. The first person on the line is Cameron McDonald from Deutsche Bank so
Cameron, your line should be open.
Cameron McDonald: (Deutsche Bank, Analyst) Thanks James, morning Tom and Zlatko. Just a question -
I'm restricting it to one - just with regards to the return on capital target and then the guidance around CapEx
and the lower return that you're going to generate in FY16. So if I leave the return flat into next year - albeit
that you've said it's going down - that's going to require you to have a return expansion of about 150 basis
points for the subsequent three years each year through to FY19. Even on a stable capital base - albeit that
you're saying that investment's going to go up - yes, that's about US$90 million a year in additional EBIT. I
mean when was the last time that you were actually able to generate that sort of increase? How are you
going to actually do that? I mean given that you've only got US$100 million worth of cost out, Yes, so I'm just
concerned as to where - how much of this is actually reliant on top line growth coming through that is outside
of your control?
Tom Gorman: Well Cam, first of all thanks for the question. I think - look it goes to the core of the medium
term outlook and investment proposition for the company. So first of all I'll make a couple of comments. So
we wouldn't have reiterated the 20% target if we didn't think we had a road map to get there. I think the road
map again is really based on a couple of things through the period. High single digit sales growth. So that
still assumes that through the period we can grow in that 7% to 9% range. It does also assume that we'll get
positive profit leverage against that growth rate and it does assume a slightly higher than a 5% ACI growth in
the period. Now also it doesn't have every business unit getting to 20% to be clear. So if you look at some
of our businesses today they're well north of 20%. There will be a number of businesses that move above
20% during the period and there are other businesses that will actually show more than a doubling of their
return on capital although still not make it to the 20%. So on the weighted average basis we believe that we
have a plan to get there.
I think in terms of our ability to deliver that there are a number of issues that we'll continue to press on. So
clearly top line growth is a component of that but we will continue to take cost out of the business. So we
have a very large focus on driving overheads down. You can see that we're making great progress on that
and we see our way very clear to delivering that. We continue to have a number of initiatives underway to
improve our EBIT margins or our underlying profit margins as we refer to them. So we believe that - look,
this is not a lay-up by any stretch of the imagination, there's work to be done. But we believe that we're
positioned very well to take advantage of the opportunities that are in front of us.
I also think you have to look at where we are today. If you look at where we were five years ago to where we
are today our business is almost twice as large. If you look at the opportunities that we have in front of us to
grow our business, our pooling business over the last five years has grown a top line - and that does include
acquisitions for sure - but the top line growth has been close to 11% or 12% CAGR over that period. So the
business to which we then can invest is significantly larger. So we think that we're in a position to deliver the
20% objective. If you look at that small chart that we showed Cam which is really just sort of indicative of
11
where we are and it's really meant to be more of an example than specific sizes of circles and the like. We'll
cover a lot more of this at the investor briefing in September. But we look at our business as a portfolio
business and there are businesses in there that have to improve their performance and we'll be keenly
focused on driving improvement in margin structure for those businesses. There are other businesses that
are incredibly strong and we'll be looking for new ways to deploy capital into those higher return businesses.
So we still believe that there is a plan there for us, we're committed to that plan. No question there's a lot of
work ahead of us but we think we can deliver.
Cameron McDonald: (Deutsche Bank, Analyst) Thanks.
James Hall: Thanks Cameron and of course if you do want to ask more questions please - you can do so
later on. Simon Mitchell from UBS is the next in the queue so please go ahead Simon.
Simon Mitchell: (UBS, Analyst) Good morning, my question relates to the return on capital in the Pallets
Americas and Pallets EMEA businesses. There's obviously a very large divergence between the two
returns. In fact EMEA now at 27% which kind of takes us back to the days when the US business was
generating a similar return and then it faced a significant reinvestment catch up program after that period.
How do you view those two returns and their divergence going forward? How do you think about that fitting
into the 20% target? I guess in particular I'm interested in your thoughts on the 27% in EMEA whether that's
sustainable.
Tom Gorman: Yes, so I think that's a great question as well and thanks for your participation Simon. So first
of all I think there - the returns are differences in the business - the way we show them. I'll just remind you
that the return on the Americas business has in it the CHEP recycled business as well which has a bit of
goodwill associated with it. So in essence that has an impact to begin with. It has a lower margin - very high
return on capital ex the goodwill because there's low capital in it but there is a slug of goodwill in that
business. Look, I think when you step back and look at the EMEA business it's a very, very strong business
for us. As I think we've said pretty clearly, FY15 was a great performance year for us and we do not see that
position improving substantially from where it is. So we think we're at a great set of returns, great set of
return on capital and we really envision holding that position through the medium term.
The real issue for us is to get the Americas business up to a return very close to where we are in the EMEA
business today. So the improvement that we're going to get through the cycle is to make both businesses
look very similar in terms of return profile. Now your caution is one that we take very seriously. So you go
back to the history of how we achieved the returns in the US and fundamentally we were not delivering the
customer requirements. That is not the case of our returns in Europe. We've been able to deliver
efficiencies in Europe so we've made our business better. We have not taken very much pricing at all in
Europe which we've been very open about. So the improvement in our business is not coming through
pricing to the customer. The same will hold true in the Americas. We believe that we can continue to drive
efficiencies in that business. The further integration of the recycled and the pool business holds a lot of
promise for us. If we get that return in the Americas close to the return that we see in Europe that goes a
long way to delivering this 20% return.
12
Last but not least I would just mention that part of the Americas is our Latin America business and there last
year we didn't achieve the growth expectations that we had. These are high return businesses, we see the
growth returning in FY16 and beyond and we'll continue to deploy capital. So it's more of a - a bit of a more
of a complicated story in the Americas because you have a number of moving components. But we're
confident that we can get that return close to where EMEA is today and it's not dependent on stretching the
EMEA returns beyond where they are.
Simon Mitchell: (UBS, Analyst) Okay, thank you.
James Hall: Thanks Simon. Scott Ryall of CLSA is next in the queue, Scott please go ahead mate.
Scott Ryall: (CLSA, Analyst) Thank you. Tom, I was wondering - you mentioned on the way through that one
of the drivers of increased CapEx is the increased scope of investment opportunity and you stressed on slide
26 talking about the CapEx outlook that these were for growth investment areas. Could you just talk to - I
guess there's some - there was a few examples you provided there but in terms of roll-out of new pallet
platforms and differentiation of RPC offerings - just clarify a little bit more on how they are expanding your
addressable market. As opposed to changing the equipment that you're supplying for current customers?
Tom Gorman: I think that there's a couple of things happening. So if you look on the year-on-year growth in
our growth capital. So sort of that US$350 million that we spent in '15 and taking that up to about US$500
million in '16. I think there's a couple of things that are going to drive that. First of all the continued
expansion of fractional pallets in the US, so we have been talking about that now for the last year or so.
We're beginning to get traction on that program in the US. Look it's not yet a noticeable contributor; it's
nowhere near sort of the 10% to 12% of volume that we get in Europe. But we still hold great hope in that
business and will continue to invest in fractional pallets. Emerging market growth is going to accelerate in
the pallet business in the year, that's also a fairly large component of that US$150 million or so increase
year-on-year in the pallet sector. Also there is now - we are wining contracts in the US and we do foresee
higher growth in the US market. So on the pallet side, emerging market growth, fractional or display pallet
growth and there is growth in the US.
When it comes to the RPC business, I think we've been clear about this, it really represents two
opportunities. There's still more investment to be made in support of the REWE contract. We won that
contract last year, that's a big shot in the arm for our team in Europe, plus the emergence of alternate
merchandising strategies with some of our customers around this wood look crate. We've also put aside
some investment to build growth there. On the container side really the actual incremental - the increment
for growth year-on-year is really not that large. Most of the investment - that US$150 million if you will from
'15 to '16 is really going to find its way into the pallets and RPC business. But we do have a bit of
incremental growth across all of the containers business with probably more of a focus on IBC growth than
anything else.
Scott Ryall: (CLSA, Analyst) Okay, thank you.
James Hall: Thanks Scott. The next question in the queue is from Matt Spence at Merrill Lynch.

13
Matt Spence: (Merrill Lynch, Analyst) Hi guys. Pallets Americas if I can. You've broken out for us previously
the increase in the direct costs. So the US$74 million that we saw in FY15 - how much of that's down to
increased repair costs in the second half? How much mitigation do you get on the US$74 million FY16 from
the transport surcharge?
Zlatko Todorcevski: Matt, it's Zlatko. I won't give you direct guidance on the FY16 mitigation from the
transportation surcharge we put in place. But look it helps to offset but it doesn't go a great way to offsetting
what we're seeing in transport inflation. If you recall in the first half we said that excess transportation
inflation was about a US$10 million impact. In the second half we did moderate that with some efficiencies.
So it was only about US$5 million but we do expect those higher levels of transportation inflation to continue.
So that was about a US$15 million hit in the year out of the US$74 million. Of the balance, the vast majority
continues to be driven by the impact of the higher asset collection that we've been seeing in the last couple
of years. Therefore higher plant costs around repairing those pallets and relocating those pallets to where
they need to be. That's by far the biggest component of the US$74 million; it's about US$40 million. Then
we have a little bit of depreciation from the higher investment that Tom spoke about. So that's about US$15
million. The rest is in Latin America.
Matt Spence: (Merrill Lynch, Analyst) That's what worries me is the higher repair costs though. Because you
called out higher repair costs in the second half '14 and first half '15 and said that it had re-based and we've
got a step up I guess of about US$20 million again in second half '15.
Tom Gorman: Yes, look I think that I would add one thing to what Zlatko said. We have also taken a number
of actions on durability and they're not going to be visible in '16. The durability impacts - the two major things
that we're doing is we introduced a clinch nail process in the repair process and on new pallets we're now
introducing nail plates in the US. In '16 we'll only probably have - about 60% of our new pallets will have the
nail plates and we yet don't have all of our facilities ready to put clinch nails on. But we see a real benefit in
that in FY17 and beyond. So in '16 it's basically net neutral, so the added costs - the processing or OpEx
cost that's going in is going to be offset by what we believe is a lower damage rate in the US business. But
in the long term when we get our pool all new having nail plates and clinch nails throughout every service
centre, we believe that that will pay significant dividends going forward in the efficiency of the business.
Look we've also assumed that our transport cost in '16 really doesn't moderate very much from what we've
seen in the US. We actually in our forecasting - we actually have the full year cost increase greater than the
cost increase in the second half. So look is that a conservative assumption, a realistic assumption? It's an
assumption that we've made as we've built our forecast because it's something that we really can't control.
We can control the efficiency rate at which we drive our own business but we did see higher plant costs -
sorry higher transportation costs. They have moderated somewhat in the second half but we still see a fairly
large increase as we look into FY16.
Matt Spence: (Merrill Lynch, Analyst) Thanks.
James Hall: We have Anthony Moulder from Citi up next in the queue, good morning Anthony.
14
Anthony Moulder: (Citi, Analyst) Hi, good morning all. Just a question on the slowing - we've seen some
slowing in that net pallet revenue business as per that column chart. I think we've seen it for a little while
now but we're now at a point where you're increasing the investment. Does that suggest that you're not
seeing any shrinkage in the opportunity ahead for the pallet space in particular but it's just a timing issue that
we should be aware of?
Tom Gorman: Yes, I'm sorry Anthony - first of all I appreciate your participation. I'm not sure I fully
understood your question. Are you referring to a specific slide?
Anthony Moulder: (Citi, Analyst) Yes, let me find the slide. Slide 13 - we've seen - so pallets net new
business that's at US$64 million I guess that it wasn't - it was a little bit lower than that obviously in the first
half so I guess we're starting to see a slowdown in some of that - the growth profile coming from that net new
business?
Tom Gorman: No, I think that I would be careful of reading too much into that. I think that we've been open
in terms of the pallet business in total where we've seen net new business and particularly in Europe in
FY15. We had a number of pieces of business that for us to pursue and win those businesses - or to win
those customers or to retain in certain cases - the return profile was well below our expectations. So we did
walk away from some business in FY15 and that had an impact on the net wins. So it's actually a loss
component of net wins. Z if you wanted to add anything else.
Zlatko Todorcevski: That's all - I think it's absolutely right. So we're getting pretty healthy wins particularly in
the Americas Anthony and as Tom said we continue to win business in Europe but the issue is particularly
pointed competition there on price. So we have lost and we've - I think we've been transparent on that for at
least the last 18 months or 24 months. But that's been a trend that we've called out for a while but it - I
wouldn't read too much into that. I think we're pretty comfortable with where we sit on net wins.
Tom Gorman: Yes and I think that the - arresting the decline in our share in certain markets in Europe is a
priority for us but the return of our business is also a priority. So - and I think we've said this Anthony on
several occasions that we need to be cognisant when we win or when we lose a customer of the impact it
has on our network efficiency. I believe that we are very cognisant of that and look I think if you can just
watch carefully in what's happened with LPR. Look we've lost some business to them in the UK; we've been
open about that. We think it was very - the economics were very unattractive and if you're watching closely
that competitor - they cleaned out their management team - both CEO and CFO. I'm going to guess that
they had a look at some of the returns on the business that they were winning. But nevertheless they've
made a leadership change there on the back of winning business which generally would indicate to me you
won business you really didn't - you didn't want.
Anthony Moulder: (Citi, Analyst) Understood, thank you.
James Hall: Thanks Anthony. Will Charleston - good morning Will. Will from Goldman Sachs is up next.
Will Charleston: (Goldman Sachs, Analyst) Good day guys. I just have a question on Ferguson. It delivered
7% pro forma growth in FY15. What's the outlook for that business in this new oil price environment? Has
your thinking changed much for that business since you acquired it?
15
Tom Gorman: Look I think if we said our thinking hadn't changed, you'd want to ask the question again. We
love the Ferguson business and that is clear. We think it's a well run business, we think it's got a good group
of folks working there, we think it's well positioned. We think it has great customer satisfaction and it's well
respected in the markets in which it participates in. But we have to be realistic. I think when we closed the
acquisition oil was trading at US$92 a barrel and today it's in the US$41 range. Clearly that has had an
impact on the marketplace. We've also talked in our half year results about how we are well positioned in oil
and gas. Where we play today is really at the lower cost end of extraction. So we're not in ultra deep water,
we're not in the Arctic we're not exposed to shale. So we're in the right place if you will. But having said that
when those other areas of the market slow down it does free assets up that then can find their way into
competing with us.
So it has been more challenging than we would have anticipated when we made the acquisition but by sure
we're not sitting on our thumbs here. We have reduced our overheads in that business significantly; we've
taken 12% of the workforce out as part of our adjustment. At the same time that we've reinvested, we've put
more resources into the Middle East where we think there are real growth opportunities for us; we've
strengthened our own marketing and sales capability with the Ferguson team in Europe. So we are treating
this as you would expect us to. We did not buy this for the next quarter or the next half, it's part of our
company for a long term. We'll look at continuing opportunities in the oil and gas space as you would expect
us to and we'll manage this business aggressively as we manage all of our portfolio businesses. But to say
that's met every expectation since the acquisition - well that would be misleading because we did not foresee
oil process dropping to the point of where they are today.
Having said that we do like the business and we're going to continue to manage it aggressively for growth
and profitability and strong returns. It is a strong margin business it has - incremental investment in this
business is good, it has a strong incremental return on capital and we're pleased it's in the portfolio,
Will Charleston: (Goldman Sachs, Analyst) Great, thanks Tom.
James Hall: Up next you have Paul Butler from Credit Suisse, good morning Paul.
Paul Butler: (Credit Suisse, Analyst) Hi, thanks guys. I just had a question on RPCs. So the growth rate for
the year came in at 10% in North America whereas I think in the first half you were around 11% and I was
expecting that you'd be seeing much stronger growth in that particular market. As I understand that you'd
changed the management team there a year ago with the express focus on looking at a strong growth. So
just wondering what's happening there and what we could expect going forward?
Tom Gorman: Yes, well look I think when it comes to the North American growth, I mean we're actually quite
pleased with the growth. You're correct to identify that it slowed a little bit in the second half and there's
really been one major issue, there's been a bit of consolidation in that market. You might - those of you that
watch the market closely would notice that Albertsons - it's a private equity deal - but Albertsons acquired
Safeway. Safeway is a very big customer of ours and I think that as they bring those two businesses
together I think the general growth rate has slowed a little bit versus what our initial expectations would have
been. We'll watch that merger closely going forward; obviously it is a big component of our growth plans.
16
Relative to the management team however though, we made a change probably now two years ago [Z] that
we're very pleased with. I think that the management team is focused on the things we wanted to get them
focused on from the beginning. Look, we have a very strong market position there; we are in essence the
market maker. We have a first mover advantage that we believe is strong and we want to continue to grow
that business. As we grow it we think that that will bring with it all of the advantage that a network business
should have. Which means that we get better efficiency, better asset utilisation, we drive our plant cost
down, we drive our transport cost down, all of those things are ahead of us. I think also I would just mention
finally Paul that we have been open here and we put the chart up in front of you. There are a couple of
businesses in our portfolio that still require more direct attention both from the corporate team as well as from
Wolfgang and the RPC leadership team. We've identified the North American business as an area that's
going to get a lot of focus from us in the year.
We have to continually prove out that this is a business that deserves the capital that we want to invest in it
and the way we do that is we prove all of the things that I just said. That the network effect as we grow the
business is in fact delivering improved returns. We like the business a lot, we're going to continue to invest
in it but it does get a lot of focus. Much more than you would think given the overall size of the business.
Paul Butler: (Credit Suisse, Analyst) Okay, thank you.
James Hall: Thanks Paul - we have Paul Mason at RBC up next in the queue, good morning Paul.
Paul Mason: (RBC, Analyst) Morning guys. A question on the balance sheet quickly. So your net debt
EBITDA number is at 1.75 which I - from my understanding it's pretty much where you want it to be at for
your credit metrics. But you've decided to leave the DRP open for the foreseeable future. I just wanted to
get some comments on - I can understand say for next year you've got a big CapEx half way you’d maybe
attract a little bit more equity capital. But what's the reasoning for kind of guiding for that being open longer
term, not just for say one year or so?
Zlatko Todorcevski: Well it's more just a pragmatic decision. So administratively turning it off and then on
again does take some time. I think if you look at a number of other corporates what they do is turn it on and
leave it on. If they find that they don't need the DRP then they either - excuse me - have a 0% discount or
neutralise it. That would be our intent in the longer term. As Tom said we see a spike of CapEx n '16
moderating in '17 so we'll just see how we go with that CapEx.
Tom Gorman: The only other thing I would add to that Paul is that in addition to the organic growth in the
CapEx that we've identified, look we don't see any major acquisition in front of us but there are a series of
bolt-ons that may present themselves during the year. Us having the flexibility to respond to those
opportunities quickly - the three things that we've talked about here but clearly the Chilean acquisition,
fantastic for us to strengthen our RPC footprint in South America. Acquiring the remaining two thirds of the
IFCO Japan business and we also made a small acquisition South Africa. So the sum of those things it
gives us the market response capability that makes us a bit more comfortable as opposed to bumping up
against the 1.75.
Paul Mason: (RBC, Analyst) Thanks a lot.
17
James Hall: Thanks Paul. Sam Dobson at Macquarie is next in the queue, please go ahead Sam.
Sam Dobson: (Macquarie, Analyst) Hi guys, thanks for taking the time. Just a couple if I might. Just
following on from a previous question on Ferguson. You mentioned the business has strong incremental
ROIC which we'd agree with. How has the growth expectation changed for that business since the
acquisition of it and noting the fall in the oil price? Just if you can elaborate where you're making investment
in that business.
Tom Gorman: Yes, so I think that - look, as I said we still like the business. I think we had a vision that we
would be able to put more capital into the business in the acquisition case. So in a way - and you guys know
how to do this as well as we do - but there's less cash going into the business. So in a way the return on the
initial investment actually in the short term looks a little bit better but that's not really our plan. We want to
grow that business; we think there are plenty of opportunities. I think when we look at the globe today
probably the area that has the most opportunity for us is in the Middle East and that's fundamentally the area
that we're strengthening in terms of our portfolio. We still have a very strong footprint in Europe; we have a
strong footprint here in Australia. But we are focused on - organically I would say focused on the Middle
East.
In terms of other opportunities - and this potentially goes to the bolt-on comment. But if there were other
opportunities, clearly the strategic hole that we have in our portfolio in oil and gas is a position in the Gulf of
Mexico. Look we'll continue to look at opportunities that may present themselves there and if there's
something that opportunistic for us - and you should read that as sort of the right strategic fit and the right
value story - I think we're in a position to take advantage of that.
Sam Dobson: (Macquarie, Analyst) Yes, okay and then just one on RPCs if I might. So you called out scale
of the network efficiencies starting to come through in that business and looking to continue that trajectory in
FY16 if I'm correct in hearing you.
Tom Gorman: Yes.
Sam Dobson: (Macquarie, Analyst) How does that correlate with the increased CapEx in that business?
Tom Gorman: Yes, so the CapEx in terms of year-over-year growth in our CapEx. In the RPC business it's
actually not that great an increase year-on-year. If you look at our CapEx that we spent in '15 in the RPC
business versus what we're planning to spend in '16, the primary increase or the delta is really around the
wood look crates. So we have been growing the business as you pointed out in the US, we'll continue to do
that. But the new merchandising alternatives that have been presented by our customers, that's really kind
of where the growth is going to come from. I also would add that we believe that's incremental growth that
that presents us an opportunity expand the reach of RPCs, either in certain categories that they had not yet
converted or even with certain customers that have not yet converted. But - so in terms of absolute year-to-
year, not that much of an increase in terms of growth. So meaning that we're getting similar growth rates
year-on-year but the difference is really in merchandising alternatives.
Sam Dobson: (Macquarie, Analyst) Right, okay. Alright, thanks guys.
18
James Hall: We'll now go to Nick Markiewicz at Morgan Stanley, hi Nick.
Nick Markiewicz: (Morgan Stanley, Analyst) Hi guys. Tom maybe just a bit of a broader question for you on
the containers business. But can you maybe just give us an update on the strategy more broadly there? I
guess in the context of your comments before around very little incremental CapEx being put into that
business and revenue growth being - organic revenue growth being quite low. So maybe just an update
there and I guess how that fits in with the broader business from a more strategic point of view.
Tom Gorman: Sure, a great question, thanks Nick. So look I think if you take a step aback and look at the
broader corporate strategy right. The corporate growth strategy was around really two fundamental themes.
One is take what we know which is really pooling expertise, supply chain expertise and apply that to more
jurisdictions and we have done that, we've continued to grow into new markets. But primarily we're growing
in those markets in either the two supply chains that are our largest components - so the RPC business - you
look at our growth in Latin American now - in Japan. We're also growing in Eastern Europe and so forth.
But it takes what we know very well and it moves it to a new jurisdiction and we're doing the same in the
pallets business, so the supply chain that serves fast moving consumer goods.
The other component of growth though was take our expertise and apply it to a different asset class. That's
really almost entirely what the containers business unit is all about. Within that business unit there are four
fundamental supply chains that we service - four fundamental industrial supply chains. Automotive is one, oil
and gas is another, aero is the third. Then there's general - I would call it general industrial - but it's really
the intermediate bulk container business. That is about inbound raw materials to the manufacturers whose
outbound packaging we already handle. So we think of it in those four ways. Now I said that there's not a lot
of incremental capital year-on-year but there's a lot of capital going into the business to serve growth. What
I'm really saying is we're applying about - well it's about a 10% increase in terms of growth CapEx from the
prior year. So think of it broadly speaking about US$50 million goes into that business in FY16 which again
is up about 10% from the prior year. So it's a strong amount of capital that we're deploying to the business
but we are - we have been deploying it each year so there's no big change.
I think the other thing that you have to look at is you have to step back. Because there are four separate
supply chains, you can't paint them with one brush and there are some quite interesting dynamics in each of
the supply chains. So let me just take automotive for example and just share some data with you. So when
you step back and look at the automotive business, we have a footprint in several locations in automotive
and one of those locations is ANZ. Now - so Australia only is now 7% of our total automotive sales but last
year that business declined at 14% and we all know that that business - ultimately car manufacturing is
exiting Australia in the next couple of years. So that impact just in the year led to a 1.4 percentage point
negative growth. So we're going to have to overcome that with growth. How are we doing that? Well in the
Americas last year we grew at almost 60%. Now that business is only 7% of the total but it continues to grow
aggressively and we are continuing to grow that business not just domestically but a number of
intercontinental movements into assemblers and manufacturers in the US - components and sub-systems
coming primarily from China and India. So we see it as a great growth opportunity but the growth is going to
come in what are the smaller businesses today, primarily our Asian business and our Americas business.

19
When you look at Europe - Europe today is almost 70% of our total mix and there we're somewhat at the
whim or somewhat tied to the general organic growth of our customers and the European automotive market
has been fairly muted. So we essentially got very little growth out of that business. So when 70% of your
business doesn't grow you have to run pretty quickly in the other pieces and then you put Australia on top of
that that's shrinking. So the automotive business sis very attractive for us, we still believe in it and ultimately
the play for us is intercontinental movements. But in order for us really to win in that space we believe we
have to have strong footprints in the major automotive centres and that's what we're building. We're
comfortable and confident with the progress that we're making but it's going to take time to continue to do
that and the returns on the business are quite strong for us.
Oil and gas I think we've covered in terms of the focus on Ferguson. Great business, clearly some macro
factors that are headwinds at the moment but we think we're doing the right things and we'll continue to look
for opportunities that may present themselves in that space. When you look at the IBC business - our IBC
business grew very nicely during the year. Still heavily influenced by some acquisitions but we see that as a
real growth opportunity for us in the future. But again here we're trying to disrupt inbound packaging. So
what comes in today in cardboard or wood boxes or burlap sacks - however it comes into the manufacturing
environment, we're trying to do what we did with outbound, we're trying to get into a fungible asset class,
we're trying to get it to be a re-usable asset. I think we're making good progress here but this is going to
continue to take time. But as we showed in that slide briefly, the incremental investment has a very, very
high return on capital.
Then that leads us to the last business which is aerospace. Look, we continue to grow the aerospace
business quite well, even excluding acquisitions we grew it at 14% in a year. We continue to win major
pooling accounts and I think the issue for us here is going to be twofold. Can we get this to a business that
is attractive for us to continue to put capital in? Meaning when we allocate capital where does it rank in
terms of the business in our portfolio. Then second also is the business scaleable? What size can we really
get this to be to be meaningful in our portfolio? Now these are questions that we've been very open about.
They are questions that are in front of us. But we'll continue to evaluate our portfolio as a portfolio of
businesses. So long winded answer because it's kind of a complicated story. But the containers business is
the poster child for growth in new verticals by taking our pooling skill and applying it to those verticals.
Nick Markiewicz: (Morgan Stanley, Analyst) Right, okay, thank you.
James Hall: There's one final question on the line. Obviously if anyone wants to ask another one, please do
so. The final question we have queued is a second question from Scott Ryall at CLSA. Please go ahead
Scott.
Scot Ryall: (CLSA, Analyst) Thank you. Tom just a question on slide 21 which is your US inventories in
pallet demand - pallet demand slide. Could you just talk - I mean most of the FMCG companies - either
supermarkets or producers - in the course of the first six months have talked about sales growth surprising
on the low side of what they were expecting at the start of the year. Is that a potential reason for the
increase in inventories in your mind?

20
Tom Gorman: Yes, no it's interesting because I think very few people would have called us bullish on the
growth in restocking post Lehman. We actually have this chart that goes quite a way - back to '08 and it
shows where stocking really fell and we had significant de-stocking. But look we're showing you the data as
they exist there and what has happened is we have really in the last six months seen a build up inventories.
Now one of two things are going to happen with that. It's going to be sold through and you're going to get
growth in the market place. Or you're going to get a slow down in new stocking of it and you're going to back
to a level where we were before. Now we're reacting to what we see in a way and remember we're - we
have a model that's quite predictive here so we know when the supply chain is restocking. So we're pretty
good at understanding that. Obviously you can't predict long term consumer demand but we know when
stocks are building and we can react to it quickly.
So what we're showing you here is that we have done a great job of managing our stocks down over the last
couple of years. We have no new pallet commitments in the US; the team has done a phenomenal job
managing this. Now what we've seen as - during that process we have seen an up-tick in stock levels and
for us to respond to that we have to put some more assets in place. I don't think that's a big risk for us
because we can respond very quickly in the US market. If we don't see the flow through in ultimate demand
and demand growth in the US, it's not an issue, we just modulate the growth and we continue to run our
plant stocks very tight.
So I think we have the flexibility to respond but we clearly are seeing this today and it's either going to be one
of the two. Either it flows through in demand and you get a growth in demand in the US. Or you see an area
where our customers may have misinterpreted some of the signs and there's not complete pull through of
that and there's a bit of de-stocking after this. But we're in a position to respond. Our plant stock levels are
at the lowest they've been in the last eight years. So we have managed this very, very well. We have - as I
think Z's been very open on - we have traded a bit OpEx and CapEx here. So when we run our stocks to a
very good, tight level, you then have to move pallets around a bit, there's a little bit more transport cost. So
us just increasing in our plant stocks just moderately anyway will help us modulate some of the operating
expense and that's not a bad thing for us in the long run.
Scot Ryall: (CLSA, Analyst) Okay, thank you.
James Hall: Thanks Scott. We do have one more question in our queue. Another question from Paul Mason
at RBC, thanks Paul.
Paul Mason: (RBC, Analyst) Thanks guys. Sorry, just on the US RPC business. So there were some
reports earlier in the year that I saw that - about Polymer Logistics winning a significant account from Wal-
Mart with a very similar wood look crate product. So I was just wondering if you could speak a little bit about
the what - I mean because you've kind of mentioned a couple of times this wood look crate that's driving new
growth for you guys. Is that a direct competitive response to what Polymer Logistics has done? Or is that
just like a general thing where a lot of supermarkets are moving to that sort of a product?
Tom Gorman: Now look I think that - I think there's been a lot of - how do I say this here? I think Polymer
has done a great job of positioning themselves publicly is I guess the best way I would put that. We have
been in dialogue with our customer in the US and globally for a long time. We talk to our customers all the
21
time around innovations - both innovation in process as well as innovation in product and we're continuing to
do that. Clearly with REWE - REWE has decided that they want a different look in their merchandising
strategy and we're meeting that requirement. We've signed a 10 year deal with them and we'll be delivering
now black coloured crates to them as that fits what they're trying to do. As other customers look at different
ways of merchandising, we want to be there to meet those requirements. So we have a solution than meets
the requirements in terms of a wood look crate.
I think that what happens in this space - particularly - the differences in the businesses are quite broad. In
Europe you get exclusivity with the retailer and you sign a long term contract. Obviously there are financial
ramifications associated with that; we have a deposit program in Europe. I think everybody understands the
difference. I the US you don't have that case; there's not exclusivity with a retailer. But given our network
advantage, given our cost position, our ability to deliver. When customers want to have a different
merchandising strategy we remain open to delivering a solution for that strategy and that's exactly what we're
doing. Polymer is welcome to compete in that space - obviously we're - Tosca is also a competitor in that
space. Our businesses are not in competitive free zones here, we have competitors. But our ability to
respond quickly and to deliver the network advantages that we possess we think puts us in a good position
to win the business. So yes, Polymer is amongst the consideration set for some retailers but we think we're
in a very good position to win that business.
Paul Mason: (RBC, Analyst) Okay, thanks a lot.
James Hall: Thanks Paul. There are no further questions in the queue so with that, thanks everybody for
joining us this morning and have a great day.
Tom Gorman: Thank you all.
End of Transcript
Recommended