Community Health Needs AssessmentFinal Report September 2013
Women & Infants Hospital CHNA Summary Report September 2013
Holleran Consulting Page 2
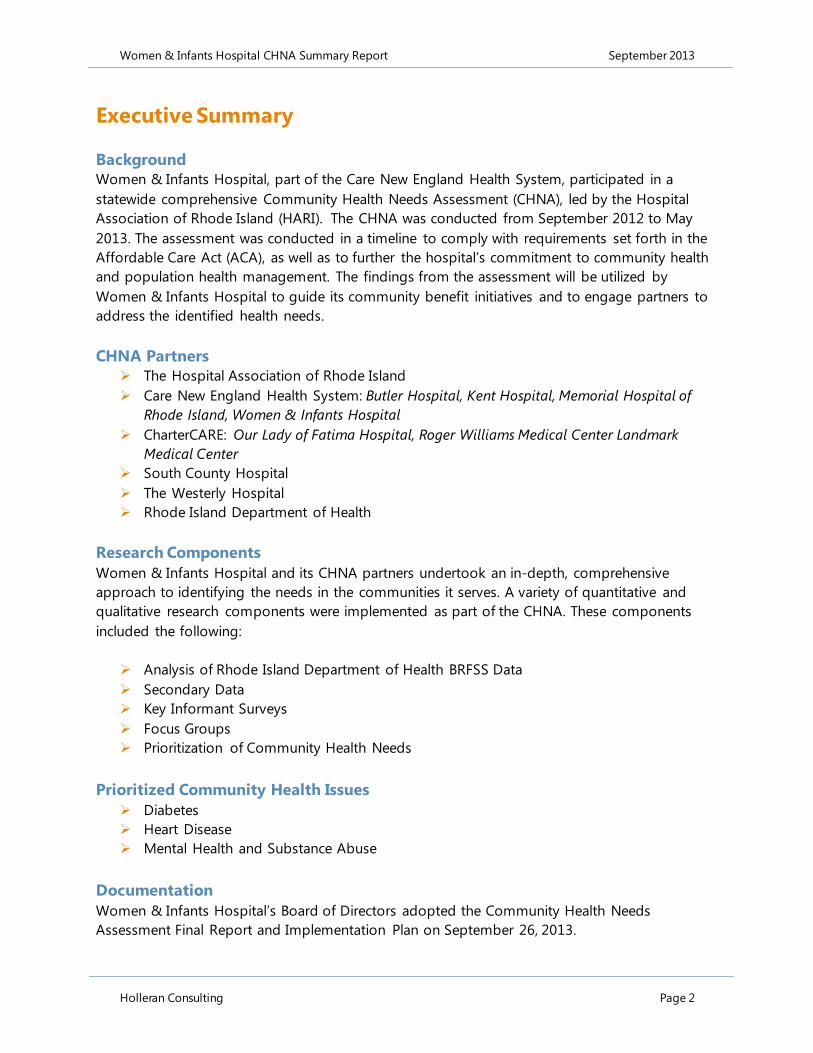
Executive Summary
Background Women & Infants Hospital, part of the Care New England Health System, participated in a
statewide comprehensive Community Health Needs Assessment (CHNA), led by the Hospital
Association of Rhode Island (HARI). The CHNA was conducted from September 2012 to May
2013. The assessment was conducted in a timeline to comply with requirements set forth in the
Affordable Care Act (ACA), as well as to further the hospital’s commitment to community health
and population health management. The findings from the assessment will be utilized by
Women & Infants Hospital to guide its community benefit initiatives and to engage partners to
address the identified health needs.
CHNA Partners
The Hospital Association of Rhode Island
Care New England Health System: Butler Hospital, Kent Hospital, Memorial Hospital of
Rhode Island, Women & Infants Hospital
CharterCARE: Our Lady of Fatima Hospital, Roger Williams Medical Center Landmark
Medical Center
South County Hospital
The Westerly Hospital
Rhode Island Department of Health
Research Components Women & Infants Hospital and its CHNA partners undertook an in-depth, comprehensive
approach to identifying the needs in the communities it serves. A variety of quantitative and
qualitative research components were implemented as part of the CHNA. These components
included the following:
Analysis of Rhode Island Department of Health BRFSS Data
Secondary Data
Key Informant Surveys
Focus Groups
Prioritization of Community Health Needs
Prioritized Community Health Issues
Diabetes
Heart Disease
Mental Health and Substance Abuse
Documentation
Women & Infants Hospital’s Board of Directors adopted the Community Health Needs
Assessment Final Report and Implementation Plan on September 26, 2013.

Women & Infants Hospital CHNA Summary Report September 2013
Holleran Consulting Page 3
Hospital & Community Profile
Hospital Overview
Women & Infants Hospital of Rhode Island, a Care New England hospital, is one of the nation’s
leading specialty hospitals for women and newborns. The major teaching affiliate of The Warren
Alpert Medical School of Brown University for activities unique to women and newborns,
Women & Infants is the ninth largest stand-alone obstetrical service in the country with nearly
8,400 deliveries per year. In 2009, Women & Infants opened what was at the time the country’s
largest, single-family room neonatal intensive care unit.
New England’s premier hospital for women and newborns, Women & Infants and Brown offer
fellowship programs in gynecologic oncology, maternal-fetal medicine, urogynecology and
reconstructive pelvic surgery, neonatal-perinatal medicine, pediatric and perinatal pathology,
gynecologic pathology and cytopathology, breast disease, and reproductive endocrinology and
infertility. It is home to the nation’s only mother-baby perinatal psychiatric partial hospital, as
well as the nation’s only fellowship program in obstetric medicine.
Women & Infants has been designated as a Breast Center of Excellence from the American
College of Radiology; a Center for In Vitro Maturation Excellence by SAGE In Vitro Fertilization; a
Center of Biomedical Research Excellence by the National Institutes of Health; a National
Accreditation Program for Breast Centers through the American College of Surgeons; and a
Neonatal Resource Services Center of Excellence. It is one of the largest and most prestigious
research facilities in high risk and normal obstetrics, gynecology and newborn pediatrics in the
nation, and is a member of the National Cancer Institute’s Gynecologic Oncology Group and the
National Institutes of Health’s Pelvic Floor Disorders Network.
Definition of Service Area
Women & Infants Hospital defines its service area as all of Rhode Island and select regions of
Massachusetts and Connecticut. For purposes of the Community Health Needs Assessment
project, we have targeted only Rhode Island.
CHNA Background
Women & Infants Hospital participated in a statewide comprehensive Community Health Needs
Assessment (CHNA), led by the Hospital Association of Rhode Island (HARI). The CHNA was
conducted from September 2012 to July 2013. The assessment was conducted in a timeline to
comply with requirements set forth in the Affordable Care Act, as well as to further the hospital’s
commitment to community health and population health management. The findings from the
assessment will be utilized by Women & Infants Hospital to guide its community benefit
initiatives and to engage partners to address the identified health needs. Through this process,
the hospital will be a stronger partner in the community and the health of those in the
surrounding neighborhoods will be elevated.

Women & Infants Hospital CHNA Summary Report September 2013
Holleran Consulting Page 4
The purpose of the CHNA was to gather information about local health needs and health
behaviors in an effort to ensure hospital community health improvement initiatives and
community benefit activities are aligned with community need. The assessment examined a
variety of community, household and health statistics to portray a full picture of the health and
social determinants of health in the Women & Infants Hospital service area.
The findings from the CHNA were reviewed and health needs were prioritized to develop the
hospital’s Community Health Implementation Plan. Women & Infants Hospital is committed to
the people it serves and the communities they live in. Through this process, the hospital will be a
stronger partner in the community and the health of those in the surrounding neighborhoods
will be elevated. Healthy communities lead to lower health care costs, robust community
partnerships, and an overall enhanced quality of life.

Women & Infants Hospital CHNA Summary Report September 2013
Holleran Consulting Page 5
Methodology
Rhode Island State BRFSS Data Analysis
The state of Rhode Island annually participates in the Centers for Disease Control and
Prevention (CDC) Behavioral Risk Factor Surveillance System (BRFSS) survey. The BRFSS study is
conducted nationally each year and is led at the state level through the respective state health
departments. The Hospital Association of Rhode Island and its member hospitals partnered with
the Rhode Island Department of Health to review existing BRFSS data for member hospital
service areas. Holleran, a third party research and consulting firm, conducted all analysis. Each
hospital’s service area was defined and the associated data points were extracted for each
hospital. The survey assessed indicators such as general health status, prevention activities
(screenings, exercise, etc.), and risky behaviors (alcohol use, etc.). The results were also examined
by a variety of demographic indicators such as age, race, ethnicity, and gender.
Secondary Data Profile
Women & Infants Hospital and its CHNA partners, contracted with Healthy Communities
Institute (HCI) to gather and present existing secondary data. The secondary data included
statistics such as mortality rates, cancer statistics, communicable disease data, and social
determinants of health (poverty, crime, education, etc.), among others. This information was
used to supplement the primary data and to fill research gaps not addressed in the BRFSS
results. Where available, the local-level data was compared to state and/or national
benchmarks. This data is also available as a web portal for full public access.
Key Informant Surveys
Key informant surveys were conducted with 49 professionals and key leaders throughout Rhode
Island. Working with each HARI member hospital, prospective individuals were identified and
invited to participate in the study. The survey included a range of individuals, including elected
officials, healthcare providers, health and human services experts, long-term care providers,
representatives from the business community, and educators. A detailed list of participants can
be found in Appendix A. The content of the questionnaire focused on perceptions of community
needs and strengths across three key domains: Perceived key health issues prominent in the
community, health care access and challenges, and solutions.
Focus Groups
Two focus groups were facilitated by Holleran in March 2013. The focus groups were intended
to gather feedback regarding mental health issues and resources within Rhode Island. The
participants included mental health experts, providers, and referral sources. A moderator guide,
developed in consultation with the CHNA partners, was used to prompt discussion and guide
the facilitation. In total, 21 people participated in the two focus groups. Participants were
recruited by the CHNA hospital partners. Each session lasted approximately two hours. It is
important to note that the focus group results reflect the perceptions of a small sample of
community members and may not necessarily represent all mental health professionals in the
hospital service areas.

Women & Infants Hospital CHNA Summary Report September 2013
Holleran Consulting Page 6
Prioritization of Community Health Needs
HARI CHNA hospital partners, including Women & Infants Hospital, jointly conducted a
prioritization to identify key statewide community health needs. The goal of the statewide
prioritization was to allow hospitals to work collectively and individually to address health needs
affecting residents across the state of Rhode Island. The prioritization session included
representatives from HARI, the hospital partners, as well as public health experts.
Limitations of Study
It should be noted that limitations of the research may have prevented the participation of some
community members. The time lag of secondary data, the hospital service area sample,
language and cultural barriers, the project timeline, and other factors may present some
research limitations. To mitigate limitations of the research, Women & Infants Hospital and its
CHNA partners sought to include representatives of diverse and underserved populations,
public and community health experts, and other community representatives to present the most
comprehensive assessment of community health needs given the research constraints.
Existing Resources to Address Community Health Needs
Below is a partial list of health and social services the actively partner with Women & Infants
Hospital to address health needs in the community.
Alpert Medical School of Brown
University
American Cancer Society
American Heart Association
Children's Friend and Service
CHIPSA
Day One
E.W. Flynn Model Elementary School
Healthy Mothers, Healthy Babies
Kidscount
March of Dimes
Meeting Street School
National Association of Social
Workers
Partnership to Reduce Cancer
Progresso Latino
Providence Ronald McDonald House
Rhode Island Association for Cardiac
Children
Rhode Island Department of Health
Rhode Island Department of Health
Office of Minority Health
Rhode Island Department of
Children, Youth, and Families (DCYF)
Rhode Island Blood Center
Rhode Island Osteoporosis Coalition
Rhode Island Parenting Information
Network
Rhode Island Network of Care for
Behavioral Health
Rhode Island Council on Alcoholism
and Other Drug Addiction
Rhode Island State Nurses
Association
Women's Health Council
United Way
Urban League
Research Partner
Women & Infants Hospital and its CHNA partners contracted with Holleran, an independent
research and consulting firm located in Lancaster, Pennsylvania, to conduct research in support
Women & Infants Hospital CHNA Summary Report September 2013
Holleran Consulting Page 7
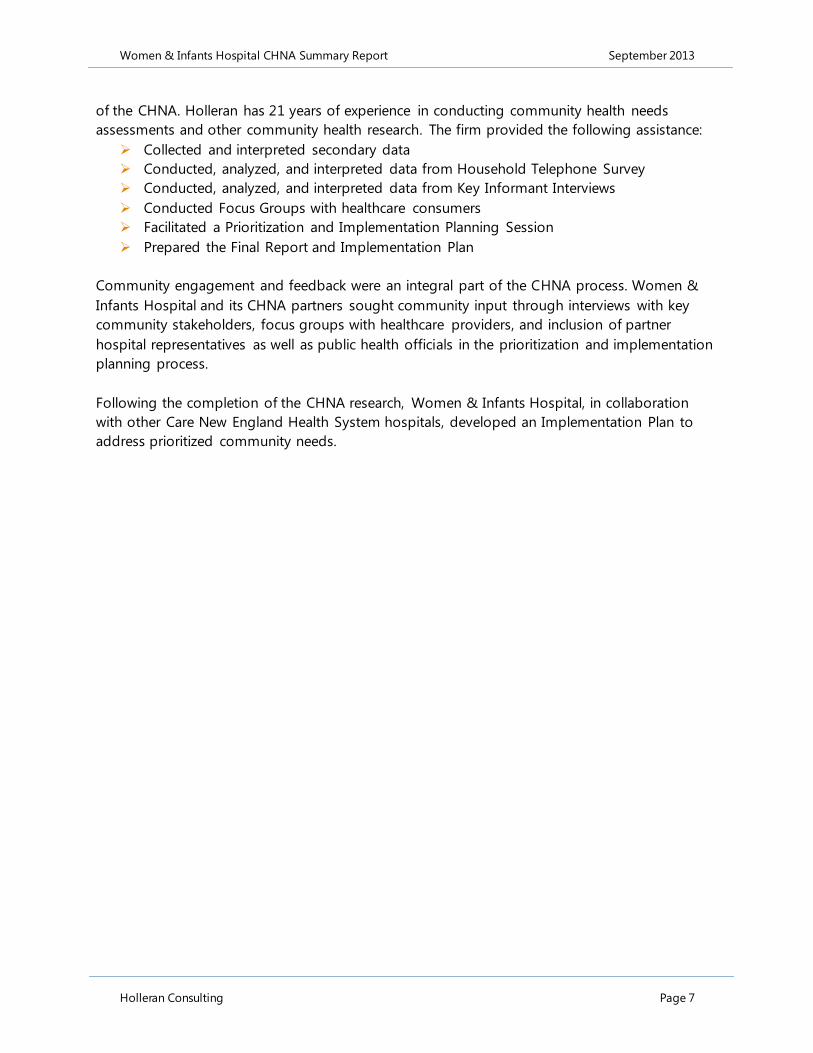
of the CHNA. Holleran has 21 years of experience in conducting community health needs
assessments and other community health research. The firm provided the following assistance:
Collected and interpreted secondary data
Conducted, analyzed, and interpreted data from Household Telephone Survey
Conducted, analyzed, and interpreted data from Key Informant Interviews
Conducted Focus Groups with healthcare consumers
Facilitated a Prioritization and Implementation Planning Session
Prepared the Final Report and Implementation Plan
Community engagement and feedback were an integral part of the CHNA process. Women &
Infants Hospital and its CHNA partners sought community input through interviews with key
community stakeholders, focus groups with healthcare providers, and inclusion of partner
hospital representatives as well as public health officials in the prioritization and implementation
planning process.
Following the completion of the CHNA research, Women & Infants Hospital, in collaboration
with other Care New England Health System hospitals, developed an Implementation Plan to
address prioritized community needs.
Women & Infants Hospital CHNA Summary Report September 2013
Holleran Consulting Page 8
Key CHNA Findings
ANALYSIS OF BRFSS DATA Behavioral Risk Factor Surveillance System data was analyzed between the dates of November 1,
2012 and January 10, 2013. BRFSS data was released to Holleran by the Rhode Island
Department of Health on behalf of the Hospital Association of Rhode Island and its members.
The final sample (6,533) yields an overall error rate of +/-1.2% at a 95% confidence level. This
means that if one were to survey all residents within Rhode Island, the final results of that
analysis would be within +/-1.2% of what is displayed in the current data set. All comparisons
represent 2011 BRFSS data.
Household Survey Findings A number of the items on the survey assessed general health status. When asked to rate their
general health, 83% of residents in Rhode Island responded “good,” “very good” or “excellent.”
This is above the 81.8% nationally. However, area residents were more likely to report one or
more days of poor physical or mental health in the previous month when compared to residents
across the nation. Approximately 40% of adults surveyed in the hospital’s service area reported
at least one day in the past month when their physical health was not good and 37.9% reported
at least one day where their mental health was not good. Just over 45% percent indicated that
these poor mental or physical health days keep them from doing their usual activities. This is
higher than the nation (42.3%).
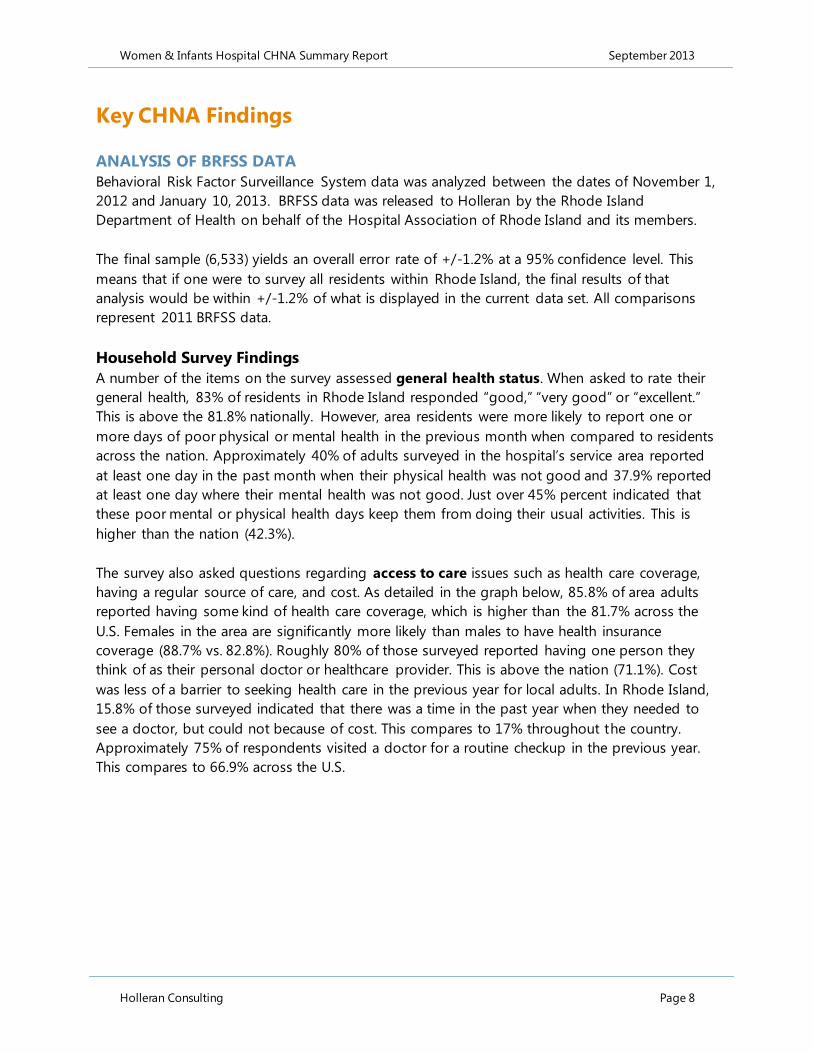
The survey also asked questions regarding access to care issues such as health care coverage,
having a regular source of care, and cost. As detailed in the graph below, 85.8% of area adults
reported having some kind of health care coverage, which is higher than the 81.7% across the
U.S. Females in the area are significantly more likely than males to have health insurance
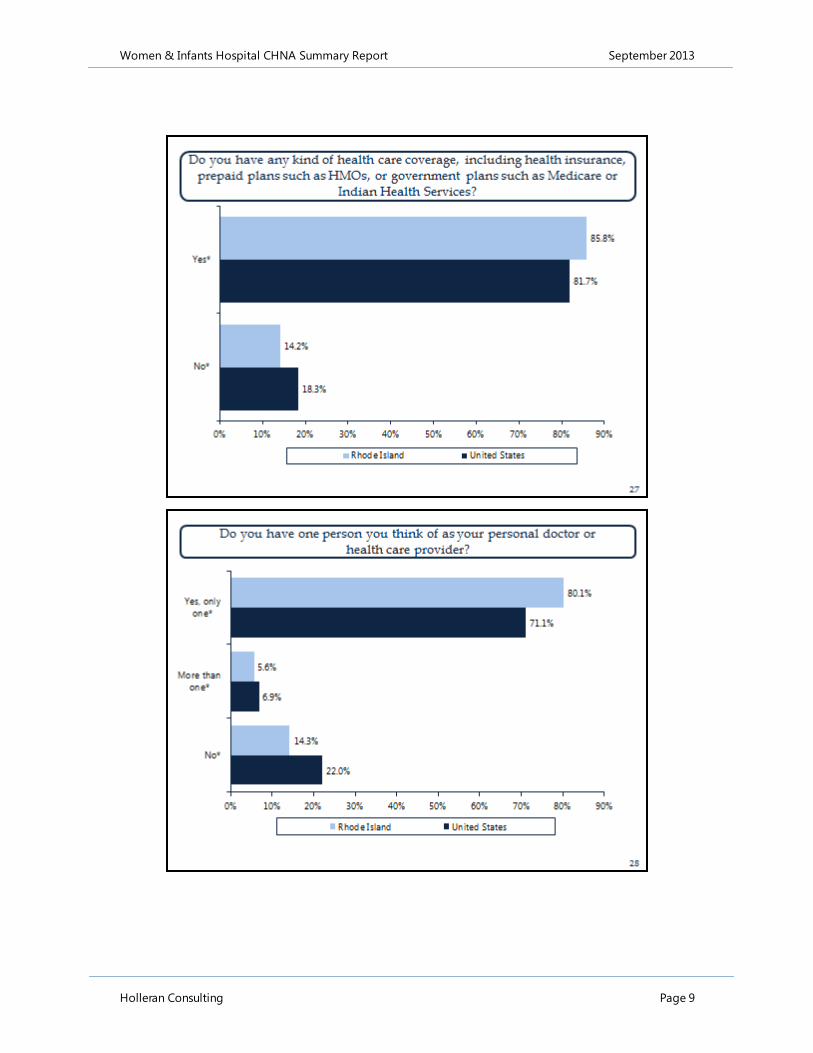
coverage (88.7% vs. 82.8%). Roughly 80% of those surveyed reported having one person they
think of as their personal doctor or healthcare provider. This is above the nation (71.1%). Cost
was less of a barrier to seeking health care in the previous year for local adults. In Rhode Island,
15.8% of those surveyed indicated that there was a time in the past year when they needed to
see a doctor, but could not because of cost. This compares to 17% throughout the country.
Approximately 75% of respondents visited a doctor for a routine checkup in the previous year.
This compares to 66.9% across the U.S.
Women & Infants Hospital CHNA Summary Report September 2013
Holleran Consulting Page 9
Women & Infants Hospital CHNA Summary Report September 2013
Holleran Consulting Page 10
Awareness of individual “numbers” for blood pressure and cholesterol has been a national
focus in recent years. Locally, 32.9% reported that they have been told by a doctor or health
professional that they have high blood pressure. This is similar to the U.S. figure (31.6%). Nearly
eight out of 10 residents who have high blood pressure reported that they are currently taking
medicine for their high blood pressure. This is similar to the nation (77.3%). Among those with
high blood pressure, 78.4% are changing their eating habits, 79.4% are cutting down on salt,
41.8% are drinking less alcohol, and 65.8% are exercising more to help lower or control their
condition. These figures are similar to or better than nationally. In addition, a greater percentage
of residents with high blood pressure reported being advised by their doctor to change their
lifestyle habits to help lower or control their blood pressure than individuals nationally. With
respect to blood cholesterol levels, 85.1% of area adults reported having their blood cholesterol
checked which is above the national figure (79.4%). The percentage of residents reporting
elevated cholesterol levels (38.5%) is in line with the nation (38.5%).
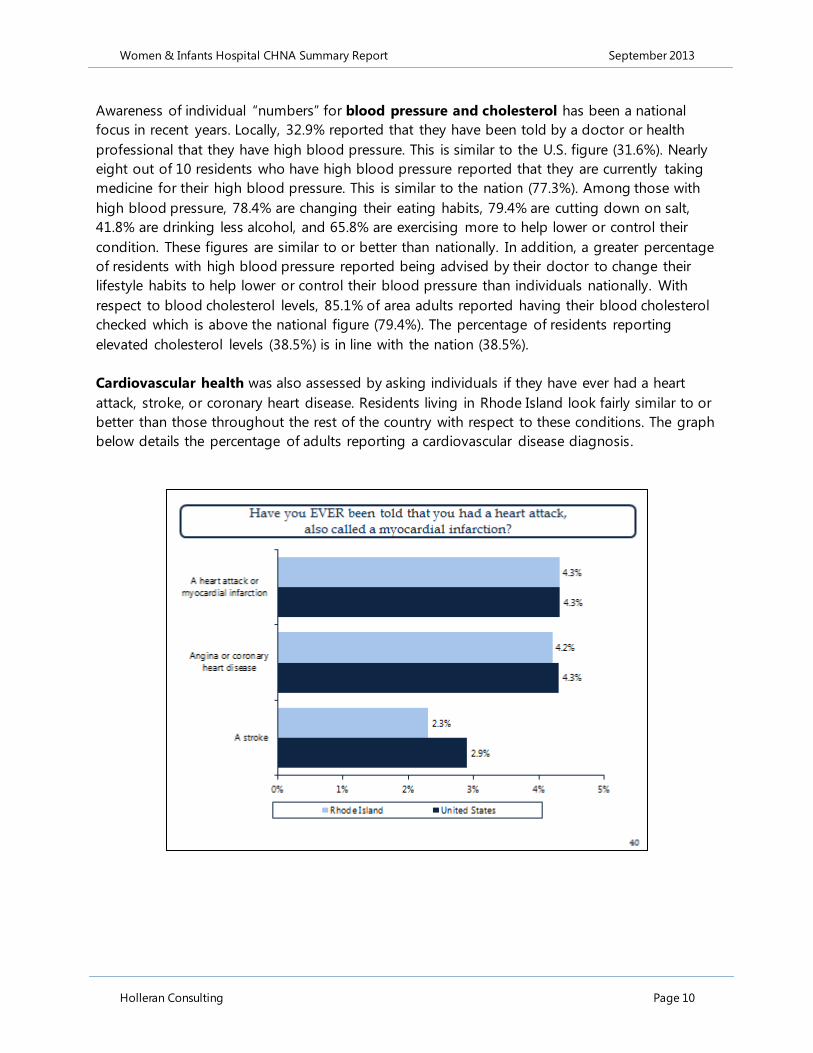
Cardiovascular health was also assessed by asking individuals if they have ever had a heart
attack, stroke, or coronary heart disease. Residents living in Rhode Island look fairly similar to or
better than those throughout the rest of the country with respect to these conditions. The graph
below details the percentage of adults reporting a cardiovascular disease diagnosis.

Women & Infants Hospital CHNA Summary Report September 2013
Holleran Consulting Page 11
An Asthma diagnosis was reported by approximately 16% of adults in the hospital’s service area
and among this group, 74.1% reported that they still have asthma. The proportion that still has
asthma is higher than the national proportion. The percentage of service area children who have
been diagnosed with asthma (18.2%) is above the nation (13.4%). Survey respondents were also
asked if they have COPD (chronic obstructive pulmonary disease), emphysema, or chronic
bronchitis. The percentage among residents (6.2%) was similar to the U.S. (6.3%).
As a follow-up to the initial question regarding poor mental health days, the survey inquired
about the incidence of depressive disorders. Twenty-two percent of those surveyed reported
being told that they had/have a depressive disorder. This is higher than the nation (16.8%).
Similar to national trends, females reported a higher incidence of depression than males (25.9%
vs. 17.7%). When asked how many days in the previous two weeks they had little interest or
pleasure in doing things, 36.5% of adults in Rhode Island mentioned at least one day. This is
higher than national percentages. The following graph details a sampling of these findings.

Women & Infants Hospital CHNA Summary Report September 2013
Holleran Consulting Page 12
Diabetic conditions such as pre-diabetes, gestational diabetes, and adult diabetes were
included in the survey as well. The percentage of residents with diabetes is lower than what is
seen throughout Rhode Island and the rest of the country. Approximately 8% of area adults
reported having diabetes compared to 9.8% across the nation. An additional 8.3% of residents
reported having pre-diabetes or borderline diabetes. Among those with diabetes, 45.1% have
taken a class to manage their diabetes compared to 52.2% throughout the U.S. When asked
about having a test for high blood sugar or diabetes in the past three years, 59.5% of local
adults indicated that they have had such a test. This is above the figure nationally (54.4%).
Risky behaviors related to tobacco and alcohol use were measured as part of the survey.
Roughly 48% of area adults reported smoking at least 100 cigarettes in their lifetime, which is
above the U.S. figure (44.8%). However, fewer residents reported that they still smoke. Among
those residents who are still smoking, 63.2% have attempted to quit smoking in the past year.
This is higher than throughout the U.S. and suggests that there are fewer current smokers in the
area, and those who do smoke, are more likely to quit.

Women & Infants Hospital CHNA Summary Report September 2013
Holleran Consulting Page 13
Women & Infants Hospital CHNA Summary Report September 2013
Holleran Consulting Page 14
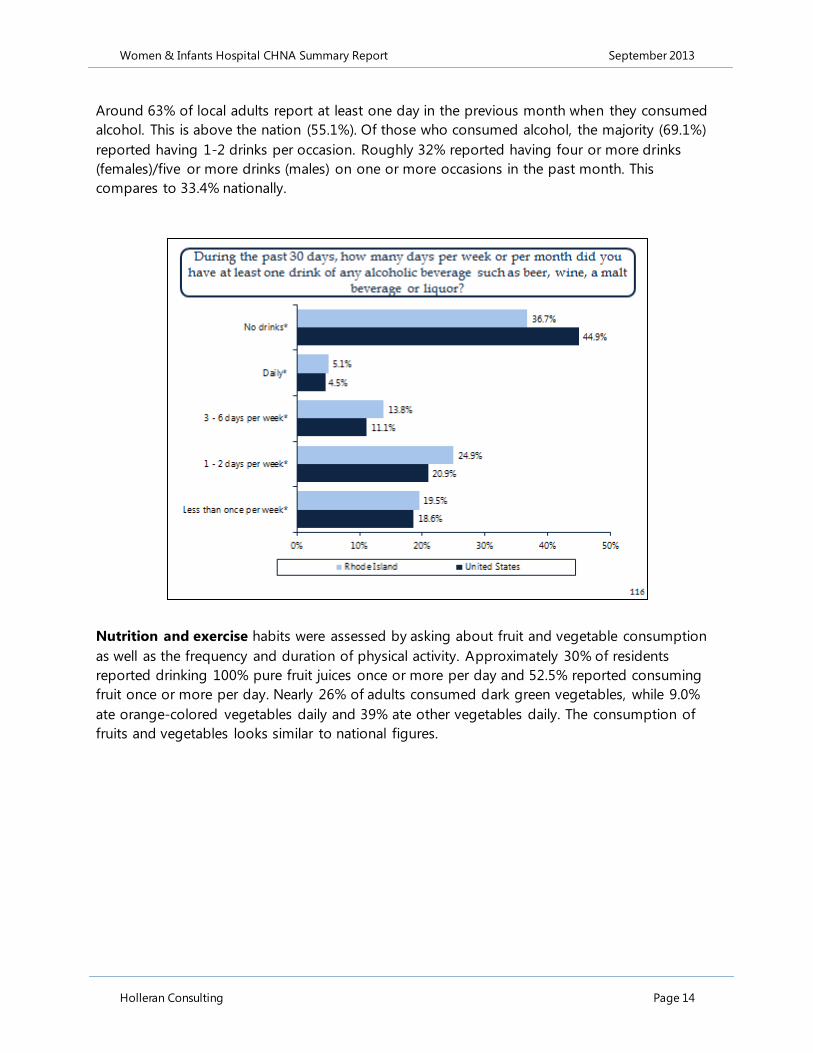
Around 63% of local adults report at least one day in the previous month when they consumed
alcohol. This is above the nation (55.1%). Of those who consumed alcohol, the majority (69.1%)
reported having 1-2 drinks per occasion. Roughly 32% reported having four or more drinks
(females)/five or more drinks (males) on one or more occasions in the past month. This
compares to 33.4% nationally.
Nutrition and exercise habits were assessed by asking about fruit and vegetable consumption
as well as the frequency and duration of physical activity. Approximately 30% of residents
reported drinking 100% pure fruit juices once or more per day and 52.5% reported consuming
fruit once or more per day. Nearly 26% of adults consumed dark green vegetables, while 9.0%
ate orange-colored vegetables daily and 39% ate other vegetables daily. The consumption of
fruits and vegetables looks similar to national figures.

Women & Infants Hospital CHNA Summary Report September 2013
Holleran Consulting Page 15
Roughly 74% of survey respondents indicated that they participated in physical activities such as
running, walking or calisthenics in the previous month. This is similar to the U.S. (74.3%). Walking
was the most common form of exercise and was reported by 52.2% of those who exercised.
Approximately 58% of residents reported exercising 1 to 5 times a week and 13.4% of residents
reported exercising 6 to 10 times per week. The majority, 55.9%, engaged in exercise for less
than one hour. BMI (Body Mass Index) was calculated from self-reported measures of height
and weight. As displayed below, 62.3% of surveyed residents were either obese or overweight,
which is similar to the U.S. (63.2%).
More than half of the surveyed residents (50.4%) indicated that they have limitations because of
arthritis or joint symptoms and 32.2% reported that these symptoms affect the amount and
type of work that they can do. Both of these figures are lower than what is seen among
residents throughout the U.S.

Women & Infants Hospital CHNA Summary Report September 2013
Holleran Consulting Page 16
Seatbelt use was identified as an area of concern on the survey. As shown below, fewer
residents always wear their seatbelt when riding in or driving a car.
Immunization rates were assessed by asking residents about various vaccinations that they or
their children may have received. Nearly forty-one percent (40.6%) of adults in Rhode Island had
the seasonal flu vaccine in the previous year. This is above the nation (36.7%). When asked
about children who live in the household, 73.2% indicated that their child had a seasonal flu
vaccination. This compares to 48.2% nationally. Roughly 34% of those surveyed reported that
they have had a pneumonia shot at some point in their lifetime. This compares to 30.6% across
the U.S. When asked if they received a tetanus shot in the past 10 years, 72.6% indicated that
they had. HPV (Adult Human Papillomavirus) vaccinations are slightly more prevalent among
residents than what is seen throughout the nation. Roughly 12% have had the HPV vaccination
and 72.2% have had all three shots.

Women & Infants Hospital CHNA Summary Report September 2013
Holleran Consulting Page 17
Household Survey Conclusions
In summary, the household survey results reveal a number of areas of opportunity and needs in
the community such as mental health status (depressive disorder and symptoms), alcohol use,
and asthma. The household survey results should be examined along with the secondary data,
key informant interviews, and focus groups to examine areas of overlap.

Women & Infants Hospital CHNA Summary Report September 2013
Holleran Consulting Page 18
SECONDARY DATA PROFILE Secondary data, such as mortality rates, cancer incidence rates, and social determinants of
health (poverty, education, and housing to name a few) were gathered and reported by Healthy
Communities Institute (HCI) and Holleran. The Hospital Association of Rhode Island established
a relationship with HCI to measure and depict health status and risky behaviors throughout
Rhode Island communities. The following information summarizes select health statistics and
findings for Rhode Island, compared to the U.S. A full, detailed listing of the indicators collected
for most Rhode Island counties, ZIP codes, and census tracts can be found at
www.rihealthcarematters.org. All figures and statistics presented below were obtained from the
RI Health Care Matters website with the exception of select maternal, fetal, and infant statistics ,
which were compiled by Holleran.
Access to Health Services When compared against other U.S. Counties, both adults and children living in Rhode Island are
more likely to have health insurance coverage. The primary care provider rate, which is the rate
per 100,000 population, is also better locally than what is seen nationwide. Primary care
providers include physicians practicing in general practice medicine, family medicine, internal
medicine, and pediatrics. For Rhode Island, it is estimated that there are 90 providers per
100,000 population.
Cancer Cancer statistics were evaluated through an examination of incidence rates and age-adjusted
death rates. Specifically, rates for breast, colorectal, lung, cervical, prostate, and oral
cavity/pharynx cancers were gathered. The age-adjusted death rates for breast, colorectal, lung,
and prostate cancer are all well below the associated rates throughout the country. The area of
greatest concern is breast cancer incidence rate. Based on 2005-2009 data, the incidence rate for
breast cancer in Rhode Island is 133.2 cases per 100,000 females. This ranks Rhode Island in the
upper 25th quartile of incidence rates nationally. It is important to note that the likelihood of

Women & Infants Hospital CHNA Summary Report September 2013
Holleran Consulting Page 19
females aged 50 and over having had a mammogram in the past two years in Rhode Island rates
favorably against national figures. Nearly 85% of females in this age group have had a
mammogram in the past two years. Other cancer incidence rates that were slightly elevated
included colorectal cancer and lung or bronchus cancer incidence.
Diabetes Diabetes statistics related to incidence, mortality, and screenings were reported. According to
2010 figures, 7.8% of Rhode Island adults have diabetes. Nationally, the figure is 8.7%. The
picture below details this comparison.
8.7
7.8 Comparison: 8.7
Unit: percent View the Legend
Adults with Diabetes
Value: 7.8 percent
Measurement Period: 2010
Location: State : Rhode Island [ View All Location Types ]
Comparison: U.S. Value
Categories: Health / Diabetes
The age-adjusted death rate due to diabetes within Rhode Island is 15.9 deaths per 100,000
population. This is in the bottom 25th quartile nationally. Among Medicare patients who have
diabetes, 84.4% report having had their blood sugar tested in the past year. This is comparable
to, or slightly above, what is seen nationally among other Medicaid recipients with a diabetes
diagnosis.
Exercise, Nutrition, and Weight It is well documented that individuals who are overweight or obese have a higher incidence of
chronic disease and other illnesses. The percentage of Rhode Island residents who are obese is
estimated at 25.4% and the percentage of residents who are overweight or obese is 62.5%. It is
estimated that there are 1,050,292 adults living in Rhode Island, which translates to roughly
656,433 adults who are overweight or obese. One in four, 26.2%, Rhode Island adults are
sedentary, compared to 26.2% nationally.
Women & Infants Hospital CHNA Summary Report September 2013
Holleran Consulting Page 20
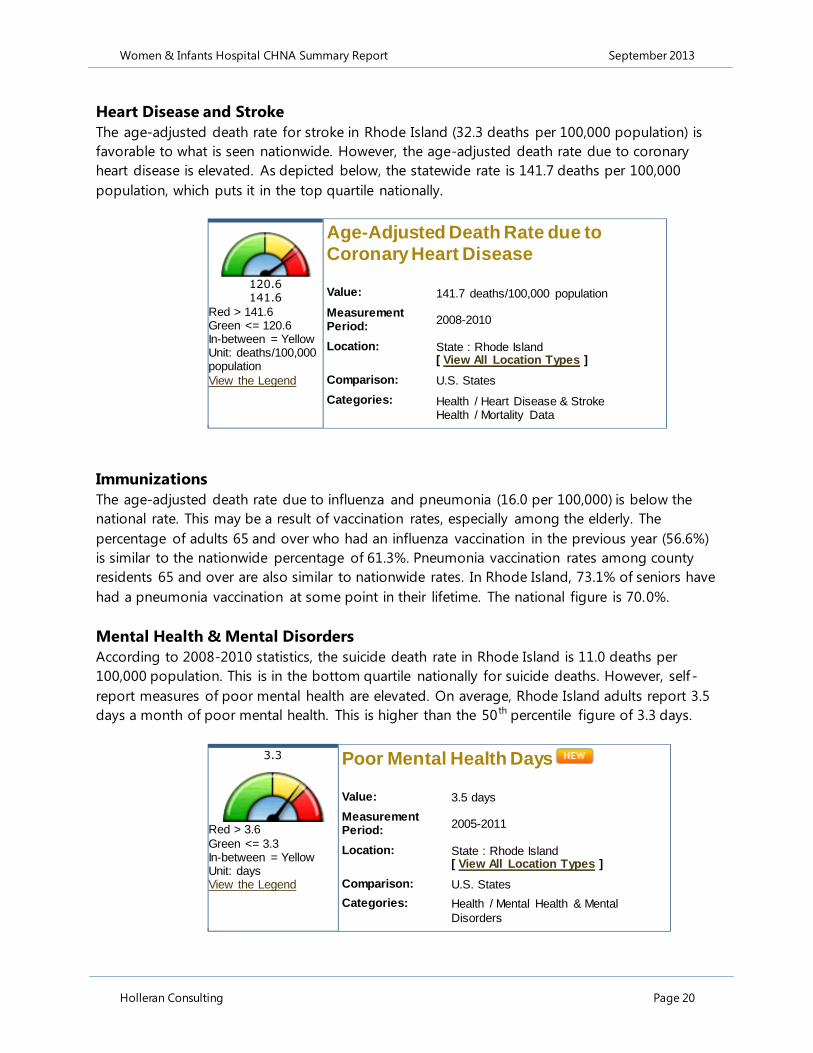
Heart Disease and Stroke The age-adjusted death rate for stroke in Rhode Island (32.3 deaths per 100,000 population) is
favorable to what is seen nationwide. However, the age-adjusted death rate due to coronary
heart disease is elevated. As depicted below, the statewide rate is 141.7 deaths per 100,000
population, which puts it in the top quartile nationally.
120.6 141.6
Red > 141.6 Green <= 120.6 In-between = Yellow Unit: deaths/100,000 population
View the Legend
Age-Adjusted Death Rate due to
Coronary Heart Disease
Value: 141.7 deaths/100,000 population
Measurement Period:
2008-2010
Location: State : Rhode Island [ View All Location Types ]
Comparison: U.S. States
Categories: Health / Heart Disease & Stroke Health / Mortality Data
Immunizations
The age-adjusted death rate due to influenza and pneumonia (16.0 per 100,000) is below the
national rate. This may be a result of vaccination rates, especially among the elderly. The
percentage of adults 65 and over who had an influenza vaccination in the previous year (56.6%)
is similar to the nationwide percentage of 61.3%. Pneumonia vaccination rates among county
residents 65 and over are also similar to nationwide rates. In Rhode Island, 73.1% of seniors have
had a pneumonia vaccination at some point in their lifetime. The national figure is 70.0%.
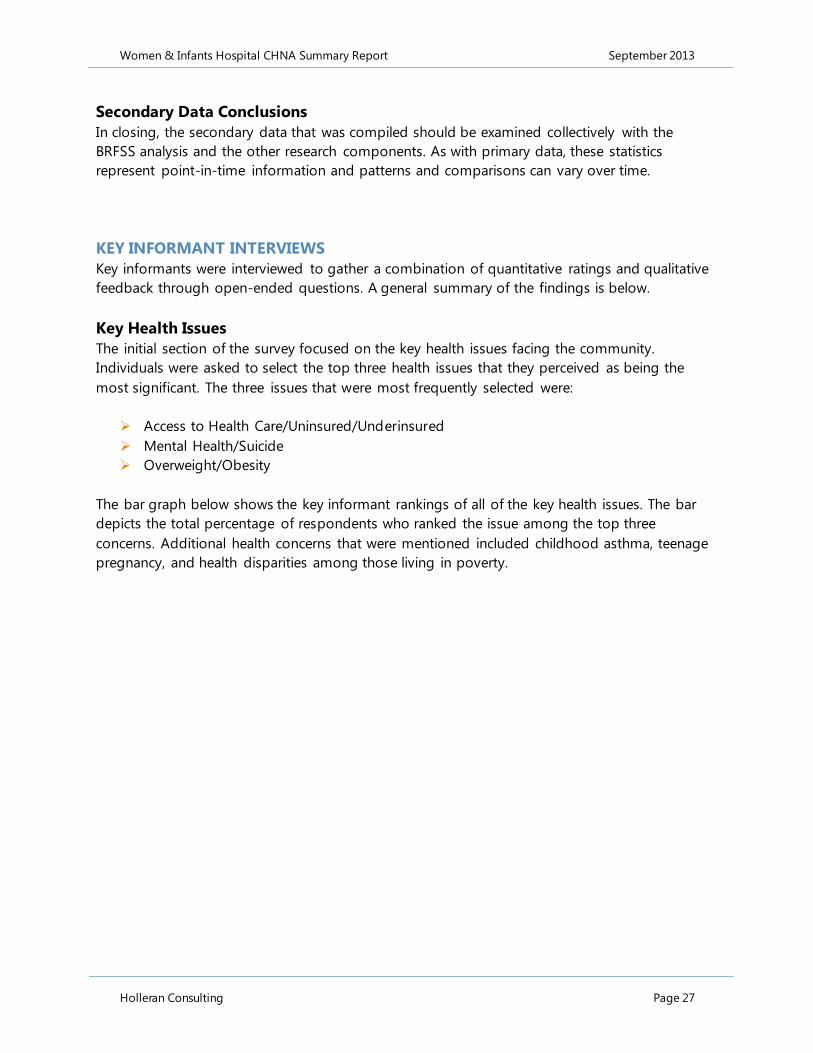
Mental Health & Mental Disorders According to 2008-2010 statistics, the suicide death rate in Rhode Island is 11.0 deaths per
100,000 population. This is in the bottom quartile nationally for suicide deaths. However, self -
report measures of poor mental health are elevated. On average, Rhode Island adults report 3.5
days a month of poor mental health. This is higher than the 50 th percentile figure of 3.3 days.
3.3
Red > 3.6
Green <= 3.3 In-between = Yellow Unit: days View the Legend
Poor Mental Health Days
Value: 3.5 days
Measurement Period:
2005-2011
Location: State : Rhode Island [ View All Location Types ]
Comparison: U.S. States
Categories: Health / Mental Health & Mental
Disorders

Women & Infants Hospital CHNA Summary Report September 2013
Holleran Consulting Page 21
Additional Mortality Data In general, Rhode Island has favorable mortality rates compared to the nation. Premature death
is less likely and conditions in which the age-adjusted death rates are lower than what is seen
nationally include Alzheimer’s disease, unintentional injuries, and motor vehicle collisions. The
one area that is slightly elevated compared to the nation is death due to falls. There mortality
rate due to falls is 9.8 per 100,000 population. The 50 th percentile nationally is 8.1 deaths.
Asthma It is estimated that 10.9% of Rhode Island adults have asthma. Nationally, the figure is 9.1%.
These statistics reflect adults who have been diagnosed as having asthma by a doctor of health
professional.
Tobacco and Alcohol The percentage of adults who binge drink in Rhode Island is 19.7%. The percentage of adults
who smoke in Rhode Island is 20.0%. Both of these statistics are similar to the United States
(18.3% and 21.2% respectively).
Economic Indicators A variety of economic indicators were gathered including education levels, homeownership,
income, and poverty. The findings suggest that there may be significant disparity in Rhode
Island between demographic populations. Overall per capita income and median household
income for the state compare favorably to national comparisons. A number of the poverty
indictors also compare favorably. The number of adults 65 and older who live below the poverty
level is the one exception. Nearly 10% of adults 65 and older live below the poverty line. This is
in comparison to 8.4% as the 50th percentile nationally.
8.4
10.9
Red > 10.9 Green <= 8.4
In-between = Yellow Unit: percent View the Legend
People 65+ Living Below Poverty Level
Value: 9.5 percent
Measurement Period:
2007-2011
Location: State : Rhode Island [ View All Location Types ]
Comparison: U.S. States
Categories: Economy / Poverty
Additional statistics that are in the upper 50th percentile in terms of comparisons to national
benchmarks include the unemployment rate, households with cash public assistance income, the
home foreclosure rate. The percentage of people 25+ with a high school degree or higher is
also less than what is seen nationally.

Women & Infants Hospital CHNA Summary Report September 2013
Holleran Consulting Page 22
The Environment The built environment can play a significant role in a community’s health. For Rhode Island,
areas of concern are the density of liquor stores, and houses built prior to 1950 compared to the
U.S.
Social Environment The percentage of single-family households in Rhode Island is higher than what is typically seen
throughout the country. The percentage of children living in single-parent family households
(with a male or female householder and no spouse present) is 34.8%. This ranks in the top
quartile nationally. It is also estimated that 31.1% of seniors who are 65 years and older in
Rhode Island live alone, which is higher than the national average.
Transportation A variety of transportation measures were gathered. For the most part, Rhode Island compares
favorably to national statistics with regard to workers commuting by public transportation, and
average travel time to work. However, unfavorable comparisons are the percentage of
households without a vehicle, and workers who drive alone to work. Approximately nine percent
(9.4%) of state households do not have a vehicle. It is important to note, however, that this may
be a function of geography (e.g. urban living) and the presence of public transportation options,
and may or may not represent a negative statistics.
Maternal, Fetal, and Infant Health (Additional secondary data compiled by
Holleran)
In 2010, there were 11,164 births across Rhode Island and a birth rate of 10.61 per 1,000. Of the
total births, 61.1% were to White mothers, 6.5% were to Black mothers, 26.7% were to
Other/Multiple Race mothers, and 21.7% were to mothers of Hispanic origin. The majority of
births were to mothers aged 20 – 34 years of age (State of Rhode Island Department of Health,
n.d.). In general, births to teenagers (mothers aged 15 -19 years) compared favorably to the
United States. However, teenage birth rates for American Indians and Asians were higher. The
following tables further depict births by the age of the mother and teenage births by the
race/ethnicity of the mother.
Rhode Island United States
Age of Mother Births Birth Rate per 1,000 Births Birth Rate per 1,000
15 – 17 years 284 13.7 109,173 17.3
18 – 19 years 606 31.6 258,505 58.2
20 – 24 years 2,327 56.8 951,688 90.0
25 – 34 years 6,032 94.6 2,095,883 102.6
35 – 44 years 1,896 27.1 571,915 27.7
45+ years 13 0.1 7,725 0.1
Sources: State of Rhode Island Department of Health, n.d.; CDC National Vital Statistics Report,
2012

Women & Infants Hospital CHNA Summary Report September 2013
Holleran Consulting Page 23
Rhode Island United States
Race/Ethnicity of
Mother Teen Births
Teen Birth Rate
per 1,000 Teen Births
Teen Birth Rate
per 1,000
Non-Hispanic White 378 14.0 144,102 23.0
Black/African
American 190 44.0 94,950 51.0
American Indian 31 61.0 7,408 39.0
Asian and Pacific
Islander 35 19.0 6,262 11.0
Hispanic or Latino 352 51.0 121,798 56.0
Source: The Annie E. Casey Foundation, 2013
According to data available from the March of Dimes, 10.8% of Rhode Island births in 2010 were
preterm. This compares to 12.0% across the United States and the Healthy People 2020 goal of
11.4%. Of the preterm births in Rhode Island, 8.9% were moderately preterm and 1.9% were very
preterm. Moderately preterm is defined as 32 – 36 completed weeks of gestation and very
preterm is defined as less than 32 completed weeks of gestation. Averages for the years 2008 to
2010 show that preterm births are most prevalent among Black mothers (14.6%) and mothers
aged 40 years or older (16.3%). The following graph illustrates the trend in preterm births from
2000 to 2010. As shown in the graph, preterm births peeked in 2006 at 12.6% and have been
declining since.
Percentage of Preterm Births in Rhode Island (2000 – 2010)

Women & Infants Hospital CHNA Summary Report September 2013
Holleran Consulting Page 24
A Healthy People 2020 goal is to reduce the proportion of infants born with low birth weight
(2,500 grams or less) to 7.8%. As of 2010, Rhode Island exceeded this goal with a figure of 7.6%.
However, the percentage of low birth weight infants varies based on the age, race/ethnicity, and
insurance coverage of the mother. For example, the percentage of low birth weight infants born
to mothers not covered by insurance was 10.3% (State of Rhode Island Department of Health,
n.d.). The following tables depict low birth weight percentages by the age and race/ethnicity of
the mother for Rhode Island and the U.S.
Rhode Island United States
Age of Mother Births
Low Birth Weight
Percentage Births
Low Birth Weight
Percentage
15 – 17 years 34 12.0% 10,889 10.0%
18 – 19 years 49 8.1% 24,469 9.5%
20 – 24 years 170 7.3% 79,225 8.3%
25 – 29 years 231 7.8% 83,391 7.4%
30 – 34 years 208 6.8% 72,891 7.6%
35 – 39 years 109 7.1% 40,897 8.8%
40 – 44 years 47 12.8% 11,608 10.9%
45+ years 1 7.7% 1,651 21.4%
Sources: State of Rhode Island Department of Health, n.d.; CDC National Vital Statistics Report,
2012
Rhode Island United States
Race of Mother Births
Low Birth Weight
Percentage Births
Low Birth Weight
Percentage
White, Non-
Hispanic 418 6.6% 154,325 7.1%
Black, Non-
Hispanic 77 11.5% 79,677 13.5%
Other/Multiple,
Non-Hispanic 89 8.6% N/A N/A
Hispanic 187 7.7% 65,868 7.0%
Sources: State of Rhode Island Department of Health, n.d.; CDC National Vital Statistics Report,
2012
In general, Rhode Island compares similarly or favorably to the United States for low birth
weight. The exception is for mothers aged 15-17 years and 40-44 years. Rhode Island also
compares favorably for very low birth weight infants. In 2010, it met the Healthy People 2020
goal of 1.4% and exceeded the national percentage of 1.45% (State of Rhode Island Department
of Health, n.d. & CDC National Vital Statistics Report, 2012).

Women & Infants Hospital CHNA Summary Report September 2013
Holleran Consulting Page 25
In 2010, the percentage of live births in Rhode Island receiving prenatal care in the first trimester
was 84.1%. This exceeds the Healthy People 2020 goal of 70.8%. Only 0.3% of live births did not
receive any form of prenatal care (State of Rhode Island Department of Health, n.d.). The
following tables detail first trimester prenatal care by the race/ethnicity and insurance coverage
of the mother.
Race of Mother
Live Births with Prenatal Care
in the First Trimester
Percentage of Live Births with
Prenatal Care in the First Trimester
White, Non-Hispanic 5,977 87.7%
Black, Non-Hispanic 557 76.5%
Other/Multiple, Non-Hispanic 2,355 79.1%
Hispanic 1,901 78.5%
Source: State of Rhode Island Department of Health, n.d.
The findings in the tables below show that race/ethnicity and insurance coverage are indicators
of the likelihood of receiving timely prenatal care. Black, Non-Hispanic mothers are the least
likely to receive prenatal care in the first trimester. They differ notably from White, Non-Hispanic
mothers who are the most likely to receive prenatal care in the first trimester. In addition, only
72.7% of mothers without health insurance coverage received prenatal care in the first trimester.
This compares to 90.7% of mothers with private insurance (State of Rhode Island Department of
Health, n.d.).
Insurance Coverage
Live Births with Prenatal
Care in the First Trimester
Percentage of Live Births with
Prenatal Care in the First Trimester
Private 5,309 90.7%
RiteCare/Medicaid 5,135 78.3%
None 377 72.7%
Unknown 319 85.6%
Source: State of Rhode Island Department of Health, n.d.
Maternal characteristics such as tobacco use, education, marital status, breastfeeding habits, and
WIC enrollment can predict the health of children and mothers both during and after pregnancy.
The following table compares Rhode Island to the United States for these characteristics. All of
the data is for 2010 with the exception of the breastfeeding rate, which is a 2007–2011 average,
and WIC enrollment, which is a 2012 percentage of all eligible women and children.

Women & Infants Hospital CHNA Summary Report September 2013
Holleran Consulting Page 26
Rhode Island United States
Maternal Characteristic Births Percentage Births Percentage
Births to mothers who
smoked during pregnancy 946 9.0% 241,704 9.0%
Births to mothers with less
than 12 years of education 1,644 16.0% 605,454 20.0%
Births to unmarried
women 5,031 45.0% 1,633,471 41.0%
Breastfeeding rate N/A 61.0% N/A N/A
Women and children
participating in WIC N/A 69.0% N/A N/A
Source: The Annie E. Casey Foundation, 2013
Infant mortality refers to death occurring at any time during the first year of life. In 2010, 79
infant deaths occurred in Rhode Island for a rate of 7.1 per 1,000 live births. This compares to a
rate of 6.2 per 1,000 live births across the nation. The following table depicts mortality by
specific time spans within the first year of life for Rhode Island. National comparison data is only
available for neonatal deaths. In 2010, the neonatal death rate for the nation was 4.1 per 1,000
live births (State of Rhode Island Department of Health, n.d. & CDC National Vital Statistics
Report, 2013).
Age of Infant at Death Number of Deaths
Death Rate per 1,000 Live
Births
Late Fetal (Fetal deaths of 28
weeks or more uterogestation) 31 2.8
Early Infant (Death occurs after
birth but before the 7th day of life) 47 4.2
Neonatal (Death occurs prior to
the 28th day of life) 59 5.3
Source: State of Rhode Island Department of Health, n.d.
Infant deaths in Rhode Island are primarily due to conditions originating in the perinatal period
(the period around childbirth). In 2010, 45 infant deaths were caused by these conditions
resulting in a crude rate of 4.1 per 1,000. Specifically, infant deaths were most likely to occur in
the perinatal period due to maternal factors and complications of pregnancy, labor, and delivery.
In 2010, 21 of the 45 perinatal infant deaths were caused by these factors resulting in a crude
rate of 1.9 per 1,000. The rates for the United States for these conditions are 3.0 and 0.7 per
1,000 respectively (CDC National Center for Health Statistics, 2012).
Women & Infants Hospital CHNA Summary Report September 2013
Holleran Consulting Page 27
Secondary Data Conclusions
In closing, the secondary data that was compiled should be examined collectively with the
BRFSS analysis and the other research components. As with primary data, these statistics
represent point-in-time information and patterns and comparisons can vary over time.
KEY INFORMANT INTERVIEWS Key informants were interviewed to gather a combination of quantitative ratings and qualitative
feedback through open-ended questions. A general summary of the findings is below.
Key Health Issues The initial section of the survey focused on the key health issues facing the community.
Individuals were asked to select the top three health issues that they perceived as being the
most significant. The three issues that were most frequently selected were:
Access to Health Care/Uninsured/Underinsured
Mental Health/Suicide
Overweight/Obesity
The bar graph below shows the key informant rankings of all of the key health issues. The bar
depicts the total percentage of respondents who ranked the issue among the top three
concerns. Additional health concerns that were mentioned included childhood asthma, teenage
pregnancy, and health disparities among those living in poverty.

Women & Infants Hospital CHNA Summary Report September 2013
Holleran Consulting Page 28
“What are the top 3 health issues you see in your community?”
Access to health care was the most frequently selected health issue with 82% of informants
ranking it among the top three key health issues. Forty-one percent (41%) of informants ranked
it as the most significant issue facing the community. Concerns were voiced about hospitals
serving as the safety-net provider for individuals who are uninsured and the number of
uninsured patients that providers of free or reduced health care centers are seeing. While these
clinics and options are in place, they do not provide high-level specialty care that is often
needed.
The second most frequently selected health issue was mental health/suicide with 47% of
informants selecting it among the top three key health issues. Sixteen percent (16%) of
respondents ranked mental health as the most significant issue facing the community.
Respondents indicated that the resources available for the treatment of mental health issues are
insufficient. The greatest concerns were for the lack of psychiatrists, children’s specialists, and
professionals trained in co-occurring disorders (mental health and addiction). Key informants
reported that emergency rooms are often addressing these mental health issues among
residents.
The third most frequently selected health issue was overweight/obesity with 39% of informants
ranking it among the top three key health issues. Ten percent (10%) of informants ranked
overweight/obesity as the most significant issue facing the community. Respondents feel that
Women & Infants Hospital CHNA Summary Report September 2013
Holleran Consulting Page 29
reducing obesity can lead to improvements in many of the other chronic health issues identified
as areas of concern. Those interviewed acknowledged that Rhode Island is not alone in its
struggle with obesity.
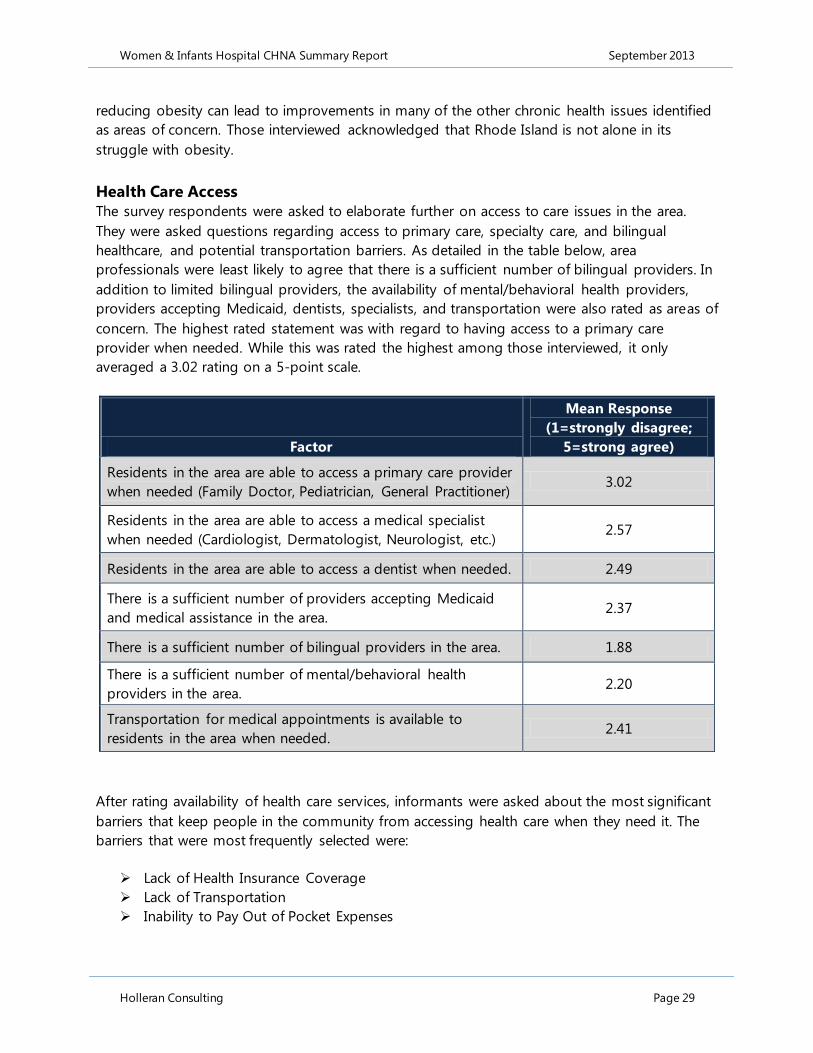
Health Care Access The survey respondents were asked to elaborate further on access to care issues in the area.
They were asked questions regarding access to primary care, specialty care, and bilingual
healthcare, and potential transportation barriers. As detailed in the table below, area
professionals were least likely to agree that there is a sufficient number of bilingual providers. In
addition to limited bilingual providers, the availability of mental/behavioral health providers,
providers accepting Medicaid, dentists, specialists, and transportation were also rated as areas of
concern. The highest rated statement was with regard to having access to a primary care
provider when needed. While this was rated the highest among those interviewed, it only
averaged a 3.02 rating on a 5-point scale.
Factor
Mean Response
(1=strongly disagree;
5=strong agree)
Residents in the area are able to access a primary care provider
when needed (Family Doctor, Pediatrician, General Practitioner) 3.02
Residents in the area are able to access a medical specialist
when needed (Cardiologist, Dermatologist, Neurologist, etc.) 2.57
Residents in the area are able to access a dentist when needed. 2.49
There is a sufficient number of providers accepting Medicaid
and medical assistance in the area. 2.37
There is a sufficient number of bilingual providers in the area. 1.88
There is a sufficient number of mental/behavioral health
providers in the area. 2.20
Transportation for medical appointments is available to
residents in the area when needed. 2.41
After rating availability of health care services, informants were asked about the most significant
barriers that keep people in the community from accessing health care when they need it. The
barriers that were most frequently selected were:
Lack of Health Insurance Coverage
Lack of Transportation
Inability to Pay Out of Pocket Expenses
Women & Infants Hospital CHNA Summary Report September 2013
Holleran Consulting Page 30
Respondents also identified concerns related to having too few providers, limited appointment
times (particularly for the uninsured), language and cultural barriers, and difficulties navigating
the health care system. While the greatest concerns were for the uninsured, many commented
on increasing barriers for those with health insurance. One barrier that was mentioned was the
escalating out-of-pocket expenses for co-pays and prescriptions medications. Another barrier
that was mentioned was transportation. Transportation services were identified as “practically
non-existent” in some areas. Those areas with bus or other public transportation options also
have limitations that present additional barriers such as restricted eligibility requirements or
expensive fares.
Informants were then asked whether they thought there were specific populations that were not
being adequately served by local health services. The majority of respondents (88%) indicated
that there are underserved populations in the community. The immigrant/refugee population
was identified as the most underserved followed by the low-income/poor. These groups were
followed by the uninsured/underinsured, the Hispanic/Latino population, and individuals with
mental health issues as the groups most underserved.
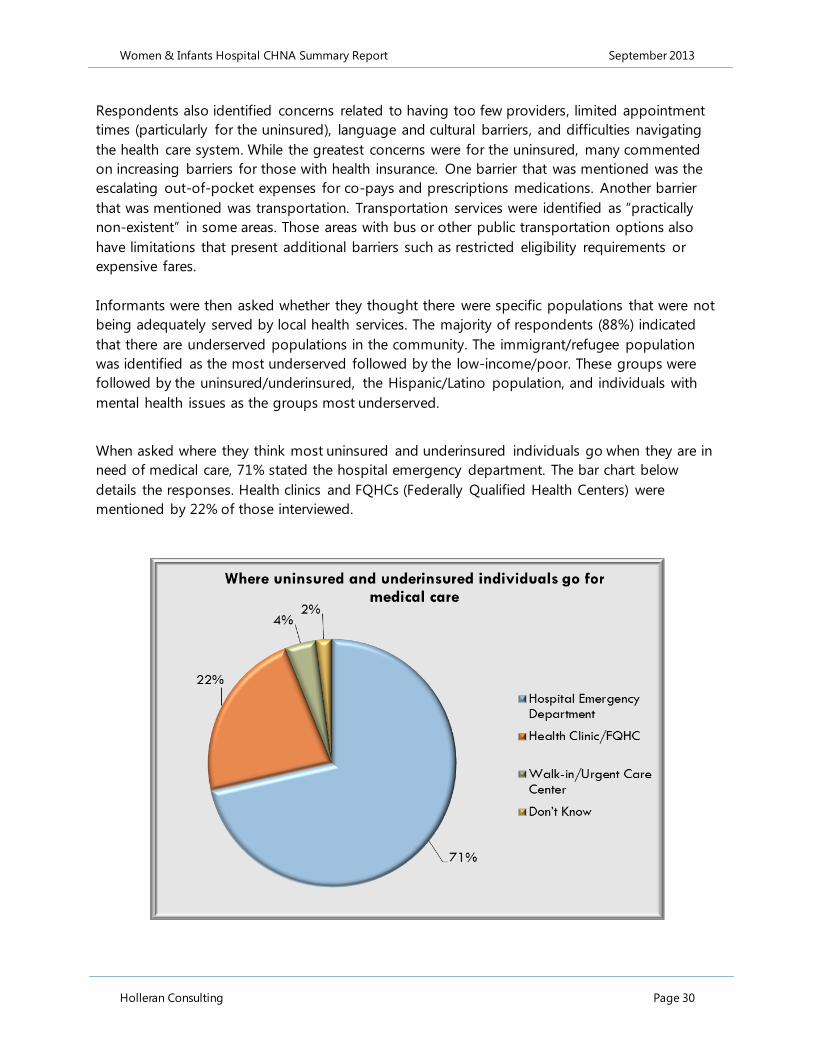
When asked where they think most uninsured and underinsured individuals go when they are in
need of medical care, 71% stated the hospital emergency department. The bar chart below
details the responses. Health clinics and FQHCs (Federally Qualified Health Centers) were
mentioned by 22% of those interviewed.
Women & Infants Hospital CHNA Summary Report September 2013
Holleran Consulting Page 31
Respondents were asked to identify key resources or services they felt would be needed to
improve access to health care for residents in the community. Many informants indicated that
mental health services were needed. Informants also felt there was a need for more health
education, information, and outreach. In addition, respondents suggested that additional free
and low cost medical and dental services would help improve access. Additional frequent
mentions included transportation options, assistance with basic needs (housing, food), and more
primary care providers.
Challenges and Solutions The final section of the survey focused on challenges to maintaining healthy lifestyles,
perceptions of current health initiatives, and recommendations for improving the health of the
community. When asked what challenges people in the community face in trying to maintain
healthy lifestyles, participants suggested the following common challenges:
Cost/Access
Motivation/Effort
Time/Convenience
Education/Knowledge
Several participants indicated that cost is a barrier. They explained that healthy foods like fresh
fruits and vegetables can be expensive, and unhealthy foods are often cheaper. Participants also
mentioned that gym memberships and fitness programs can be expensive. In addition,
informants expressed concerns about lack of awareness and education. Suggestions were made
to integrate more planning activities into community health improvement initiatives. An example
that was mentioned was ensuring that communities are walkable and safe. A number of
programs and organizations were praised for their efforts, but it was generally agreed that more
are needed.
Key Informant Interviews Concluding Thoughts
The key informants expressed appreciation for the opportunity to share their thoughts and
experiences and indicated interest and support for efforts to improve community health. Based
on the feedback from the key informants, access to health care is a significant issue in the
community. A number of barriers contribute to access including health insurance coverage,
transportation, and inability to pay out of pocket expenses. The need for mental and behavioral
health services was also repeatedly mentioned by informants.
In addition, informants expressed concern about the growing problem of obesity and indicated
that there are number of challenges that contribute to obesity including cost, accessibility,
convenience, education, and motivation. Many respondents indicated the need for increased
awareness, education, prevention, and outreach and encouraged more collaboration and
coordination among health and human service providers.

Women & Infants Hospital CHNA Summary Report September 2013
Holleran Consulting Page 32
FOCUS GROUPS
On March 26, 2013, Holleran conducted two focus groups with 21 Mental and Behavioral Health
Care professionals. Both groups were held at Butler Hospital in Providence, Rhode Island. Focus
Group participants were recruited by HARI and the CHNA partner hospitals. A full report of the
Focus Groups was provided to the hospital. A list of participants is included as Appendix B.
The aim of the Focus Groups was to identify mental and behavioral health needs throughout
Rhode Island. Focus group participants discussed Rhode Island’s challenges and successes in
providing care to residents with mental health needs. Special populations, access to care,
community perception, emerging trends, and recommendations were discussed.
Adolescents, the elderly, homeless individuals, and those who do not speak English were seen as
some of the most underserved populations when it came to mental health needs. Of particular
concern is increased substance abuse, especially among adolescents, and the co-occurring
diagnosis of mental illness and substance abuse. The participants also expressed concerns
about the complexity of patients’ conditions and the relationship between mental and physical
health.
Challenges with accessing care included lack of insurance and ability to afford care, as well as
provider reimbursement rates and acceptance of insurance. Coordination of services within the
system needs to be improved to create a transparent system where providers can easily provide
referrals to the appropriate level of care in an efficient and expedient manner.
Stigma, as well as the recognition of signs and symptoms of mental health conditions, continues
to be a barrier to treatment. Recommendations were made to continue to explore the
integration of primary care and mental health, as well as regular mental health screening of
patients with chronic conditions.
Continued collaborations between schools and community-based services were seen as
successful and in need of additional support. Advocacy to ensure continued funding successful
programs is needed.
A shift from payer-led treatment plans to provider-led treatment plans would enable the
appropriate level of care and likely cut costs in the end. Providers feel as though “their hands are
tied” when it comes to providing the best treatment for patients.
Participants, encouraged by the dialogue with a cross-section of providers, referral sources, and
community agencies, suggested a state-wide mental health summit to further explore issues and
opportunities.

Women & Infants Hospital CHNA Summary Report September 2013
Holleran Consulting Page 33
Identified Areas of Need While each individual research component provides a unique perspective on the health status of
the service area for Women & Infants Hospital, a number of overlapping health issues are
evident. The following list outlines the key themes that stood out across the four research
components.
Access to Care: Concerns for healthcare access were seen as greatest for the uninsured
and under-insured and those attempting to access specialty care. Specialty care includes
medical specialists, dentists, and child and senior providers. The growing immigrant
population was also noted as an increasing challenge on the local health care system. .
The growing immigrant population was also noted as an increasing challenge to the
local health care system. Specifically, it was stated that there are too few bilingual
providers locally and that cultural competencies are not fully integrated into the health
system.
Alcohol Use: The household survey identified that more residents consume alcohol in a
typical month when compared against state and national figures. Binge drinking
episodes, however, were lower in the area. Area professionals stated concerns with drug
and alcohol use and discussed the relationship between poor mental health and drug
and alcohol use. The secondary data also revealed a higher density of liquor stores in
Kent County compared to what is generally seen throughout the country.
Asthma: The secondary data identified a higher than recommended number of ozone
days in a year. Kent County received the equivalent of a “C” rating from the American
Lung Association for ozone days. Additionally, the household survey results identified
that more adults and children in the area have had asthma at some point in their lifetime
and most still do. While the secondary data did not point to elevated asthma rates,
statistics for tobacco use among adults were higher.
Breast Cancer: The incidence of breast cancer in Kent County is well above national
rates. The secondary data also revealed that fewer females aged 50 years and over in the
county have had a mammogram at some point in the past two years.
Cardiovascular Health: According to the secondary data, deaths due to heart disease
in Kent County are elevated when compared against national figures. Adults in the
hospital’s service area are also more likely to have high blood pressure and high
cholesterol levels than adults statewide and nationally.
Mental Health Status: The key informants that were interviewed identified mental
health issues as one of the primary health concerns for the area. Specifically, concerns
were voiced about the limited number of treatment options, particularly for those who
are uninsured or underinsured. As a result, individuals with mental health issues often
utilize the hospital emergency room. The household survey also reported a higher

Women & Infants Hospital CHNA Summary Report September 2013
Holleran Consulting Page 34
number of individuals with depressive disorder and self-reported days of poor mental
health. While the suicide rate for Kent County is below the national figure, the secondary
data aligned with the household survey data with respect to poor mental health days.
Overweight & Obesity: All research components identified that there are significant
concerns about overweight/obesity in the area. This holds true for both adults and
children. Roughly 63% of adults are overweight or obese. Elevated overweight/obesity
rates are seen among low-income pre-school children as well. Key informants also noted
their concern with the issue of overweight/obesity and its relationship to chronic
diseases such as diabetes. The secondary data pointed to a higher density of fast food
restaurants in in Kent County and fewer grocery stores and farmers markets.

Women & Infants Hospital CHNA Summary Report September 2013
Holleran Consulting Page 35
Prioritization of Community Health Needs On April 30, 2013, approximately 20 individuals representing the Hospital Association of Rhode
Island (HARI), its member hospitals, and the Rhode Island Department of Health gathered to
review the results of the 2013 Community Health Needs Assessment (CHNA). A list of attendees
can be found in Appendix A. The goal of the meeting was to discuss and prioritize key findings
from the CHNA and to set the stage for statewide community health improvement initiatives
and the development of the system’s Implementation Plan.
The meeting began with an abbreviated research overview presented by Holleran Consulting.
The presentation covered the purpose of the study, research methodologies, and the key
findings.
Following the research overview, participants were provided with information regarding the
prioritization process, criteria to consider when evaluating key areas of focus, and other aspects
of health improvement planning, such as goal setting and developing strategies and measures.
Holleran facilitated an open group discussion for attendees to share what they perceived to be
the needs and areas of opportunity in the region. The group identified overlapping strategies,
cross-cutting issues, and the ability for regional health and human services providers to
effectively address the various needs. The following “Master List of Needs” was developed by
the attendees to be evaluated as potential priority areas for community health improvement
activities.
Master List Of Community Priorities (In alphabetical order):
Access to Care
Asthma
Cancer
Diabetes
Heart Disease
Mental Health and Substance Abuse
Overweight and Obesity
Once the master list was compiled, participants were asked to rate each need based on two
criteria. The two criteria included seriousness of the issue and the ability to impact the issue.
Respondents were asked to rate each issue on a 1 (not at all serious; no ability to impact)
through 5 (very serious; great ability to impact) scale. The ratings were gathered instantly and
anonymously through a wireless audience response system. Each attendee received a keypad to
register their vote. The following table reveals the results of the voting exercise from highest to
lowest rated need based on the average score of the two criterions.

Women & Infants Hospital CHNA Summary Report September 2013
Holleran Consulting Page 36
Master List
Seriousness
Rating
(average)
Impact Rating
(average)
Average Total
Score
Mental Health and Substance
Abuse 4.94 3.78 4.36
Diabetes 4.17 4.11 4.14
Overweight/obesity 4.22 4.06 4.14
Access to Care 4.11 3.50 3.81
Heart Disease 3.94 3.50 3.72
Cancer (specifically breast, lung) 4.33 3.00 3.67
Asthma (adult and child) 2.94 2.89 2.92
The priority area that was perceived as the most serious was Mental Health (4.94 average rating),
followed by Cancer (4.33 average rating), and Overweight and Obesity (4.22 average rating). The
ability to impact Diabetes was rated the highest at 4.11, followed by Overweight and Obesity
with an impact rating of 4.06, and Mental Health, with a score of 3.78.
The matrix below outlines the intersection of the seriousness and impact ratings. Those items in
the upper right quadrant are rated the most serious and with the greatest ability to impact.
Women & Infants Hospital CHNA Summary Report September 2013
Holleran Consulting Page 37
The CHNA hospital partners recommended that the statewide priorities include Mental Health
and Substance Abuse, Overweight/Obesity, Diabetes, Heart Disease, and Access to Care.
The results of the prioritization session were shared with the HARI Board of Trustees, made up of
the CEOs of each Hospital in Rhode Island, to garner feedback. The HARI Board of Trustees
recommended that the following priorities be adopted as statewide issues:
Mental Health and Substance Abuse
Diabetes
Heart Disease
The board suggested that strategies across all three priority areas include addressing the
following:
Overweight and obesity
Access to Care
Health Disparities

Women & Infants Hospital CHNA Summary Report September 2013
Holleran Consulting Page 38
Implementation Plan Following the review of research findings and prioritization of community health needs, Women
& Infants Hospital worked with other Care New England Health System hospitals to identify
system priorities and develop an Implementation Plan that aligned with the prioritized statewide
health issues.
In developing the Implementation Plan, the Care New England Health System outlined the
following goals to guide its community health improvement initiatives.
Mental Health and Substance Abuse
Goal 1: Decrease morbidity from diabetes and heart disease among persons with mental
illness, including substance abuse disorders.
Goal 2: Improve mental health by increasing access to appropriate, quality mental health
services including substance abuse services.
Heart Disease
Goal 1: Increase the number of women who are aware of their risk for heart disease.
Goal 2: Reduce heart disease through early identification, and early and appropriate
treatment/management.
Diabetes
Goal 1: Increase the number of people who are aware of the risk factors for diabetes.
Goal 2: Increase diabetes self-management education for people living with diabetes.
Women & Infants Hospital will employ its initiatives, services, and programs in working to meet
its goals to improve the health of the communities it serve. The system’s full Implementation
Plan was attached to the Hospital’s Form 990 and is available on the Hospital’s website.
Adoption of Report and Implementation PlanWomen & Infants Hospital’s Board of Directors adopted the Community Health Needs
Assessment Final Report and Implementation Plan on September 26, 2013. Both documents are
available on the hospital’s website or by request from the hospital.

Women & Infants Hospital CHNA Summary Report September 2013
Holleran Consulting Page 39
Appendix A: Key Informants
Name Title Organization
Ana Novais Executive Director Community, Family Health & Equity/HEALTH
Ann Barrone Chief WIC Rhode Island Dept. of Health
Ann Nolan President Cross Roads
Benedict Lessing Jr. Executive Director Family Resources Community Action
Beth Lamarre Director Community Health Care Workers Association
Carol Holmqust President & CEO Dorcas Place
Catherine Taylor Director of Elderly Affairs DHS
Christopher Koller Health Insurance Commissioner RI Dept. of Health
Chuck Jones President and CEO Thundermist
Cindy Gardiner Social Services Manager Wood River Health Services
Clark Rumfelt Chaplain & Community Volunteer The Westerly Hospital
Dale Klatzker President & CEO Providence Center
Dennis Keefe President & CEO Care New England
Dennis Langley President Urban League of RI
Dennis Lecrerc President Urban League of RI
Donna Nabb Family Literacy Coordinator Westerly Public Schools
Elena Nicolella RI Medicaid Director EOHHS/DHS
Elizabeth Burke Bryant Executive Director RI Kids Count
Elizabeth Lange Pediatrics, MD Coastal Medical of RI
Graciela Fontana ESL Teacher Assistant & Translator Westerly Public Schools
Jane Hayward CEO RI Health Center Association
Jerry Cutler VP of Clinical Services South Shore Mental Health Center
Jim Nyberg Director RIAFSA
Jim Berson President & CEO YMCA of Greater Providence
Women & Infants Hospital CHNA Summary Report September 2013
Holleran Consulting Page 40
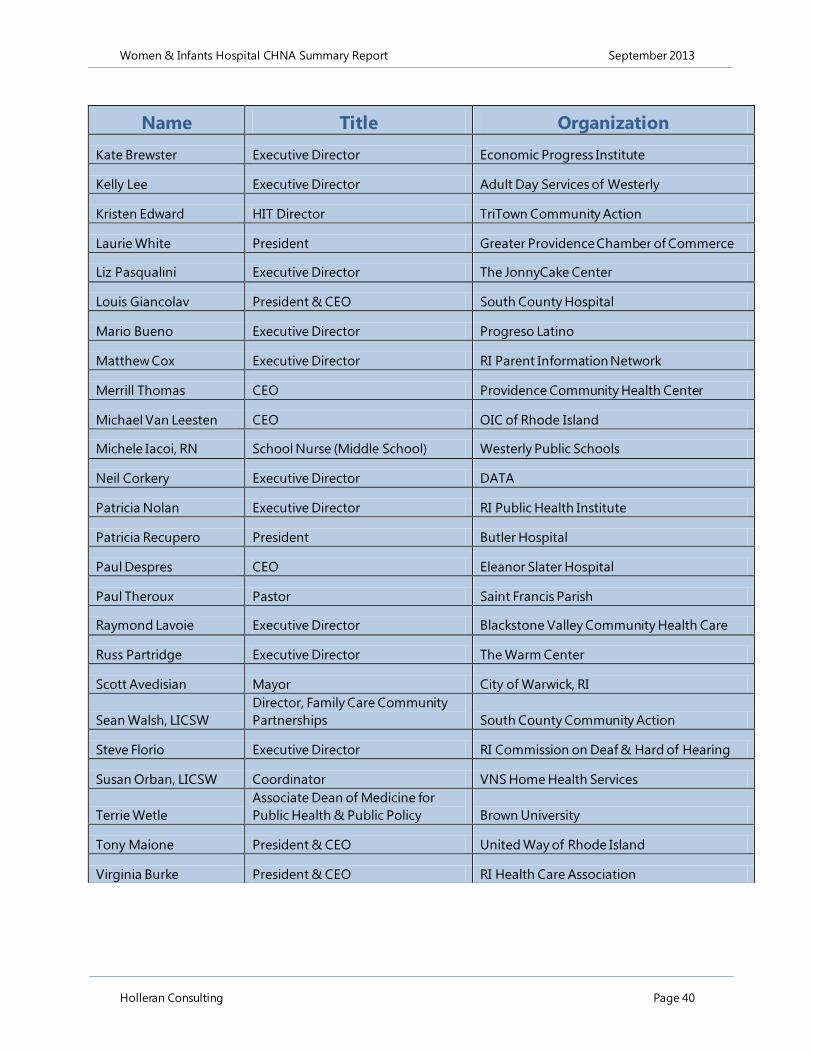
Name Title Organization
Kate Brewster Executive Director Economic Progress Institute
Kelly Lee Executive Director Adult Day Services of Westerly
Kristen Edward HIT Director TriTown Community Action
Laurie White President Greater Providence Chamber of Commerce
Liz Pasqualini Executive Director The JonnyCake Center
Louis Giancolav President & CEO South County Hospital
Mario Bueno Executive Director Progreso Latino
Matthew Cox Executive Director RI Parent Information Network
Merrill Thomas CEO Providence Community Health Center
Michael Van Leesten CEO OIC of Rhode Island
Michele Iacoi, RN School Nurse (Middle School) Westerly Public Schools
Neil Corkery Executive Director DATA
Patricia Nolan Executive Director RI Public Health Institute
Patricia Recupero President Butler Hospital
Paul Despres CEO Eleanor Slater Hospital
Paul Theroux Pastor Saint Francis Parish
Raymond Lavoie Executive Director Blackstone Valley Community Health Care
Russ Partridge Executive Director The Warm Center
Scott Avedisian Mayor City of Warwick, RI
Sean Walsh, LICSW
Director, Family Care Community
Partnerships South County Community Action
Steve Florio Executive Director RI Commission on Deaf & Hard of Hearing
Susan Orban, LICSW Coordinator VNS Home Health Services
Terrie Wetle
Associate Dean of Medicine for
Public Health & Public Policy Brown University
Tony Maione President & CEO United Way of Rhode Island
Virginia Burke President & CEO RI Health Care Association

Women & Infants Hospital CHNA Summary Report September 2013
Holleran Consulting Page 41
Appendix B: Focus Group Participants
Name Title Agency
Tom Allen LICSW, Director, Outpatient Addiction Medicine & Behavioral Health Social Work
Roger Williams Medical Center
Fay Baker LICSW, Director, Project Implementation and
Acute Care Services The Providence Center
Susan Bruce LICSW
Gary Bubly MD, Director, Department of Emergency Medicine
The Miriam Hospital
Joseph Dziobek President & CEO Fellowship Health Resources
Charlene Elie RN, Chief Nursing Officer Landmark Medical Center
Peter Erickson PhD
Dr. Roberta Feather Marriage and Family Counseling Private practice
Diane Ferreira RN, Director of Social Services Butler Hospital
Robert Hamel RN, Director of Psychiatric Partial Hospital
Psychiatric Services Butler Hospital
Margaret Howard PhD, Director of Post-Partum Depression Day Hospital
Women & Infants Hospital
Sue Jameson VNS Home Health Services
Dale K. Klatzker President & CEO The Providence Center
Rich Marwell Eleanor Slater Hospital
Sally Mitchell PsyD
Caroline Obrecht LICSW
Deborah O’Brien Vice President & COO The Providence Center
Francis Paranzino Vice President & COO Newport County Community Mental Health Center
David Robinson Office of Primary Care and Rural Health
Rhode Island Department of
Health
Lisa Shea MD, Deputy Medical Director Butler Hospital
Curt Wilkins Director of Social Services Landmark Medical Center

Women & Infants Hospital CHNA Summary Report September 2013
Holleran Consulting Page 42
Appendix C: Prioritization Session Participants
Name Title Organization
Mike Souza Senior Vice President
HARI
Liz Almanzor Project Coordinator
HARI
Stephanie Anderson Senior Planning Analyst
Care New England
Gina Rocha
HARI
Ed Quinlan President
HARI
May Kernan
Care New England
Gary Epstein-Lubow
Butler Hospital
Lisa Shea
Butler Hospital
Patti Melaragno
Butler Hospital
Jeff Borkan
Memorial Hospital of Rhode Island
Kellie Sullivan
Planning Implementation
Manager Care New England
Gail Costa Senior VP Planning
Care New England
Cindy Wyman
VP, Planning & Market
Development South County Hospital
Rene Fischer
Kent Hospital/Care New England
James Alves
Butler Hospital
Ana Novais
Rhode Island Department of Health
Magaly Angeloni
Rhode Island Department of Health
Otis Brown VP, External Affairs
CharterCARE Health Partners
Darlene Kershaw
Roger Williams Medical Center
Linda Zaman
Roger Williams Medical Center
Patricia Nadle
St Joseph Health Services of
RI/CharterCARE
Margaret Duff
St Joseph Health Services of
RI/CharterCARE
Paula DiLeonardo
St Joseph Health Services of RI
Michele Danish
St Joseph Health Services of RI
Recommended