Community analysis and learning outcome prediction based on learning behaviours in the context of programming education
TAI MAI, MARIJA BEZBRADICA, MARTIN CRANE, SCHOOL OF COMPUTING, DUBLIN CITY UNIVERSITY
1

Introduction• The failure rate in introductory programming modules has been reported to
be 28% on average, with a huge variation from 0% to 91% (Bennedsen & Caspersen, Michael, 2019)
• Learning behaviours tend to be correlated with students’ performance in programming education (Carter & Hundhausen, 2017)
• The learning behaviours in using material items, however, has not been commonly investigated (Li & Tsai, 2017)
• Problem with noise in the dataset.
2

Context of the study
Learning platform
Learning
Assessement Performance
Learning behavioural data
Lab exam
Higher performing Lower Performing
Lecture Notes
Practice exercises
Lab sheets
12 weeks
- 37 learning items- 2.5 million events
400 studentsTwo Introductory
programming courses over two academic years (2018 and 2019)
3

Behavioural features
4

Noise and Trend effect
Correlation matrix
- Students freely interactive with the learning platform
- High correlation between students learning behaviours
5
Process mining approach

Noise and Trend effect – Investigation with PCA
PC1 PC2 PC3
Eigenvectors: PC1 loadings are all positive => Possible Noise & Trend effect
Biplot of PC2 & PC3 reveals differences of learning behaviours between higher-performing and lower-performing cohorts
6
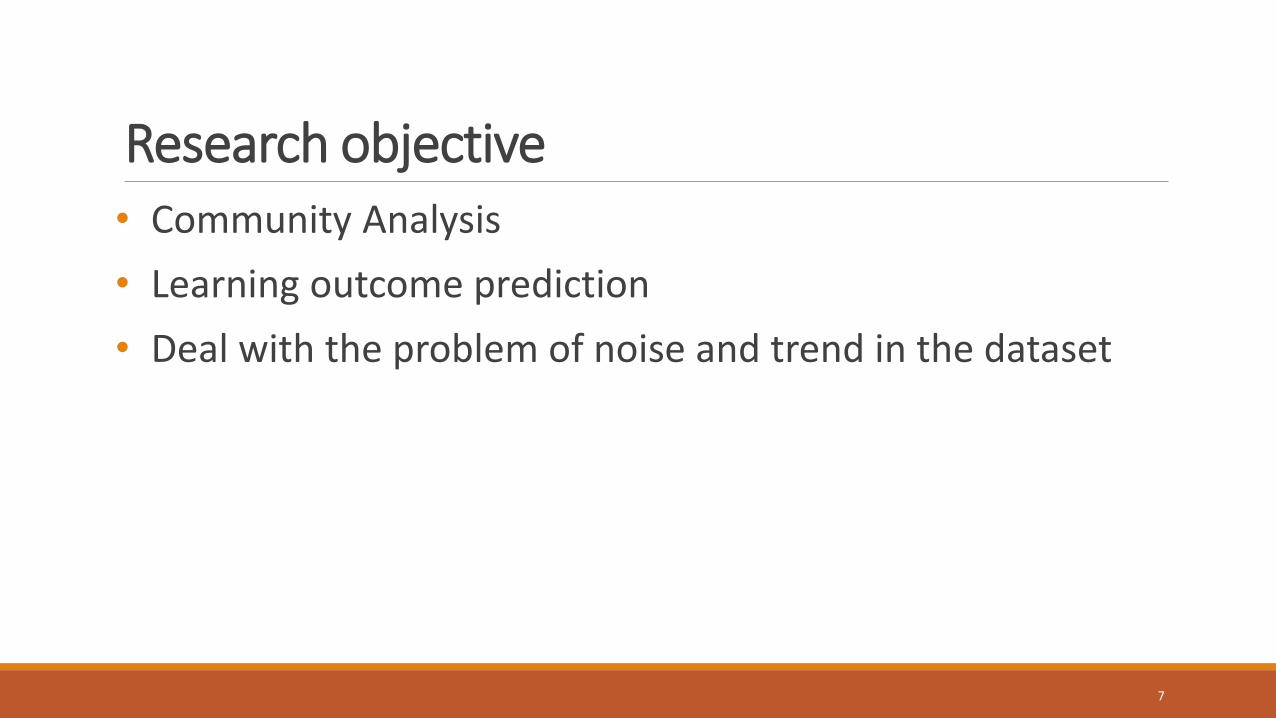
Research objective• Community Analysis
• Learning outcome prediction
• Deal with the problem of noise and trend in the dataset
7

Random Matrix TheoryGiven a random matrix mxn A such that Q =m/n > 1 is fixed. R is a correlation matrix of A
Marcenko-Pastur probability density function of eigenvalue λ of R is given by:
=> Clean correlation matrix=> Clean dataset
Key InformationRandom ~ Noise
8

Clean correlation matrixEigenvalue clipping
- Where C is the correlation matrix of the standardised dataset G- W1 and V1 are the first eigenvector and eigenvalue of C
cleaning
9

Clean dataset
:eigenvector i-th (loadings of component i-th):scores of component i-th
Fully re-constructed dataset G from component scores and loadngs
Noise part Trend part
Configurable parameters: how much noise and trend we want to clean
10

Community Analysis❑Construct a graph from distance matrix
❑Girvan-Newman community detection algorithm
❑Labelling each community based on the number of higher/lower-performing students in the community
❑Comparison analysis
11

Community Analysis
Cleaned correlation matrix CDistance matrix D
1 Learning behaviours between two students are more different
Distance of learning behaviours between student i and j:
0 Learning behaviours between two students are more similar
12

Graph construction
Distance matrix D
Minimum spanning tree
Higher performing student
Lower performing student
Possible communities detected by Girvan-Newman
Lower performing community (>70% of lower-performing students)
Mixed community
We want less mixed communities and more lower/higher-performing communities
𝑚𝑖𝑥𝑒𝑑 𝑐𝑜𝑚𝑚𝑢𝑛𝑖𝑡𝑦 𝑟𝑎𝑡𝑒 =𝑛𝑢𝑚𝑏𝑒𝑟 𝑜𝑓 𝑚𝑖𝑥𝑒𝑑 𝑐𝑜𝑚𝑚𝑢𝑛𝑖𝑡𝑖𝑒𝑠
𝑡𝑜𝑡𝑎𝑙 𝑛𝑢𝑚𝑏𝑒𝑟 𝑜𝑓 𝑑𝑒𝑡𝑒𝑐𝑡𝑒𝑑 𝑐𝑜𝑚𝑚𝑢𝑛𝑖𝑡𝑖𝑒𝑠
Higher performing community (>70% of higher-performing students)
13
Girvan-Newman community detection

Community Analysis
Comparison between original data and cleaned data when apply Girvan-Newman algorithm
Cleaned data
Original data
14
Mix
ed c
om
mu
nit
y ra
te
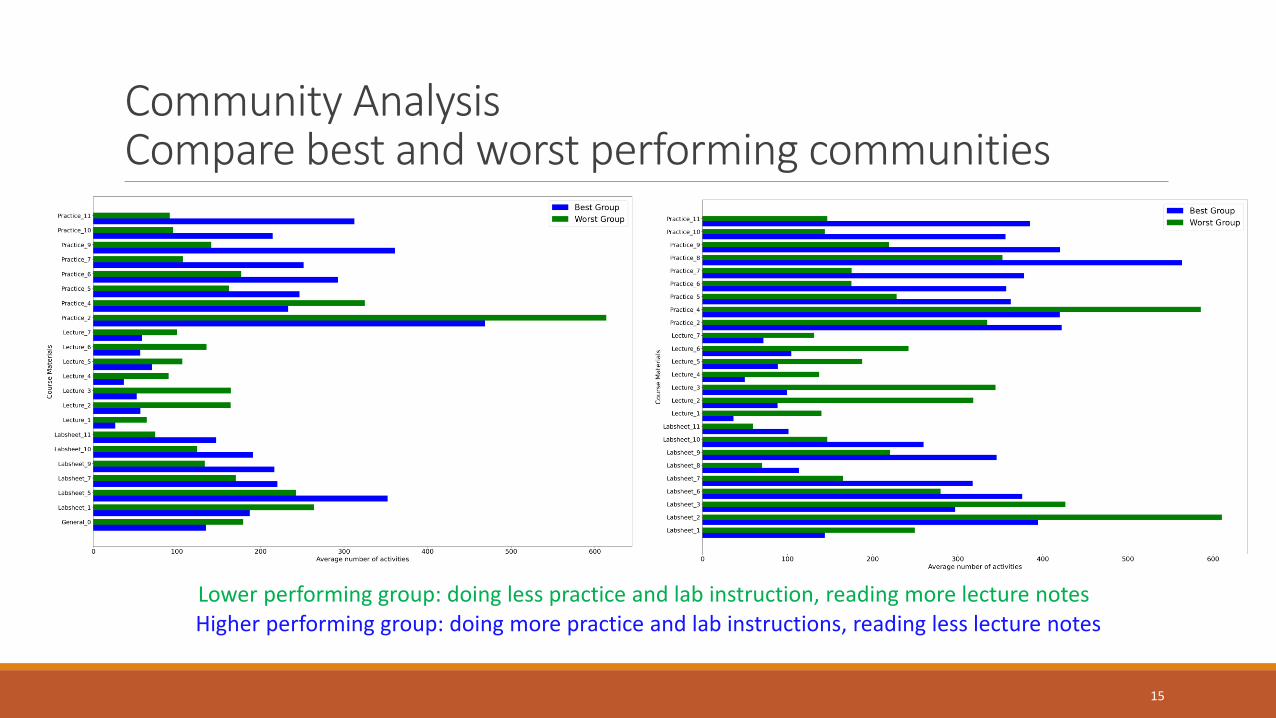
Community AnalysisCompare best and worst performing communities
Lower performing group: doing less practice and lab instruction, reading more lecture notesHigher performing group: doing more practice and lab instructions, reading less lecture notes
15

Learning outcome prediction
Learning platform
Learning
Assessement results
Learning behavioural data
Lab exam
Lecture Notes
Practice exercises
Lab sheets
Dataset cleaning and preparation
12 weeks
Fully cleaned datasets
Partly cleaned datasets
PCA datasets
Original dataset
Student accesses in 37 learning items
Introductory programming
course over two academic years (2018 and 2019)
Classification Algorithms
SVM
KNN
XGBoost
Gradient Boosting
Logistic Regression
Model Evaluation and Comparison
Accuracy
ROC AUC
F1 score
10-fold cross validation
Target variables
Predictor variables
16

Prediction result
17

Summary❑ Findings
• Extracted learning behavioural data
• Utilised Random Matrix Theory (RMT) in Educational context to separate the key information from the noise in the dataset
• Community Analysis and Learning performance prediction
• Cleaned data can help to cluster more informed communities and improve prediction models
❑ Future work• More data features included (e.g. time and sequences of learning activities)
• Compare different ways of constructing graph
• Test with more datasets
18

THANK YOU FOR YOUR ATTENTION!
19
Recommended

![PREDICTION MARKETS AND LAWharvardlawreview.org/.../02/prediction_markets_and_law.pdf · 2016-10-05 · 2009] PREDICTION MARKETS AND LAW 1219 the outcome of events.9 Each participant](https://img.pdfslide.us/doc/110x75/5e8e6e7476362a1f4b1e41ee/prediction-markets-and-2016-10-05-2009-prediction-markets-and-law-1219-the-outcome.jpg)