1
Commerce Bancshares, Inc.Commerce Bancshares, Inc.Investors PresentationInvestors Presentation
Boston, MABoston, MANew York, NYNew York, NY
January 28 January 28 –– 30, 200830, 2008
Bayard Clark, EVP & CFOBayard Clark, EVP & CFOJeffrey Aberdeen, ControllerJeffrey Aberdeen, Controller
Nicole Nicole HilemanHileman, Asst. Treasurer, Asst. Treasurer
2
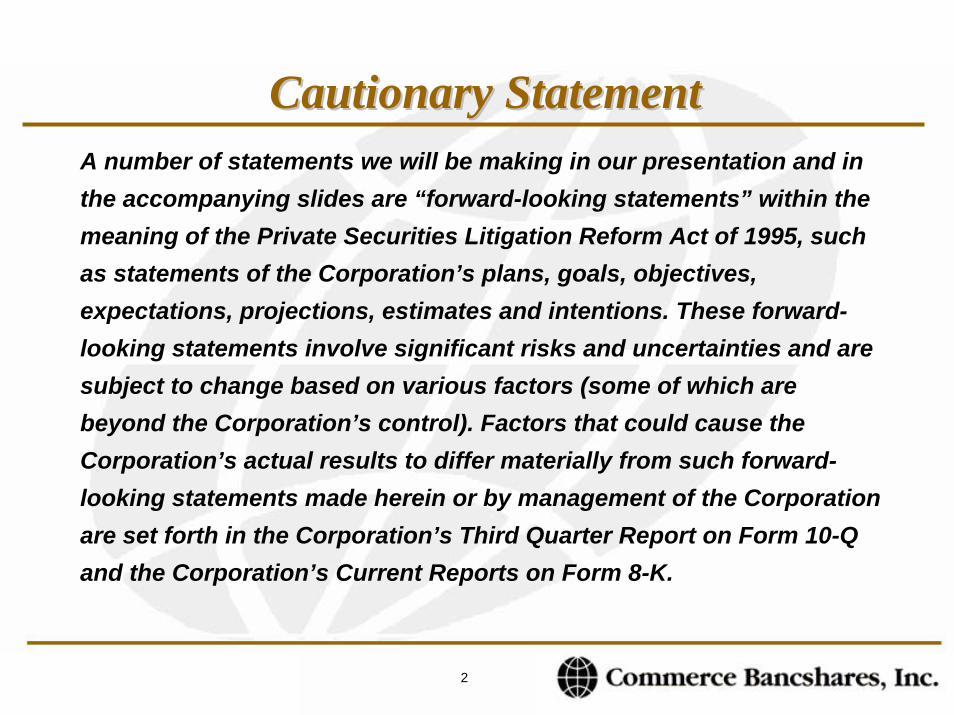
Cautionary StatementCautionary StatementA number of statements we will be making in our presentation and in the accompanying slides are “forward-looking statements” within the meaning of the Private Securities Litigation Reform Act of 1995, such as statements of the Corporation’s plans, goals, objectives, expectations, projections, estimates and intentions. These forward-looking statements involve significant risks and uncertainties and are subject to change based on various factors (some of which are beyond the Corporation’s control). Factors that could cause the Corporation’s actual results to differ materially from such forward-looking statements made herein or by management of the Corporation are set forth in the Corporation’s Third Quarter Report on Form 10-Q and the Corporation’s Current Reports on Form 8-K.
3
About Commerce BancsharesAbout Commerce Bancshares
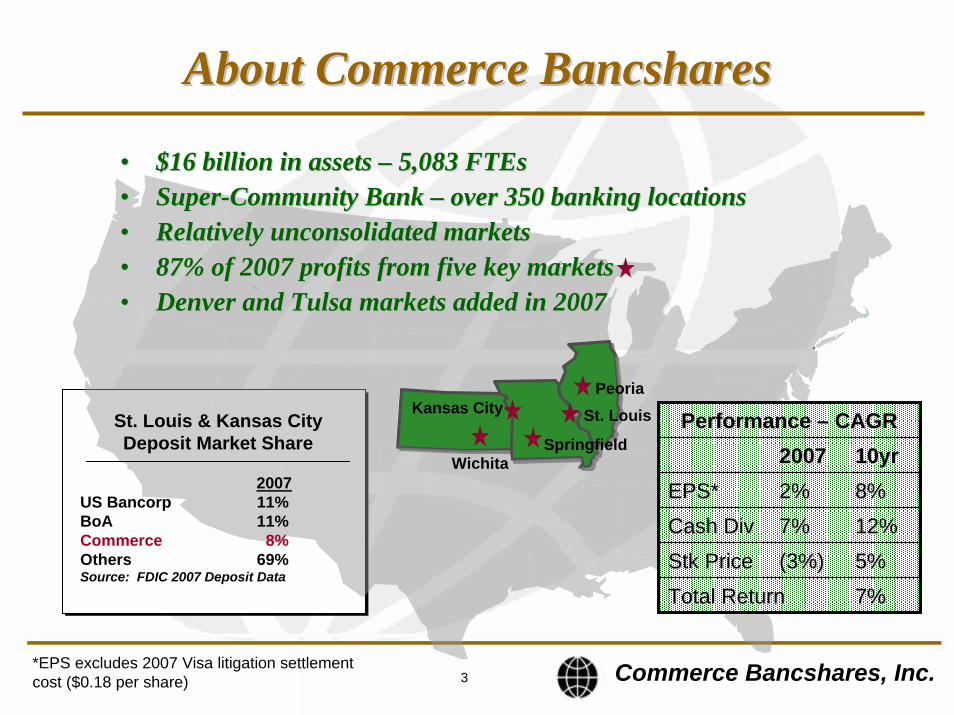
•• $16 billion in assets $16 billion in assets –– 5,083 FTEs5,083 FTEs•• SuperSuper--Community Bank Community Bank –– over 350 banking locationsover 350 banking locations•• Relatively unconsolidated marketsRelatively unconsolidated markets•• 87% of 2007 profits from five key markets87% of 2007 profits from five key markets•• Denver and Tulsa markets added in 2007Denver and Tulsa markets added in 2007
St. LouisKansas CitySt. Louis & Kansas CityDeposit Market Share
2007US Bancorp 11% BoA 11% Commerce 8% Others 69%Source: FDIC 2007 Deposit Data
Peoria
WichitaSpringfield
3Commerce Bancshares, Inc.
Performance Performance –– CAGRCAGR20072007 10yr10yr
EPS*EPS* 2%2% 8%8%
Cash DivCash Div 7%7% 12%12%
StkStk PricePrice (3%)(3%) 5%5%
Total ReturnTotal Return 7%7%
*EPS excludes 2007 Visa litigation settlement cost ($0.18 per share)
4
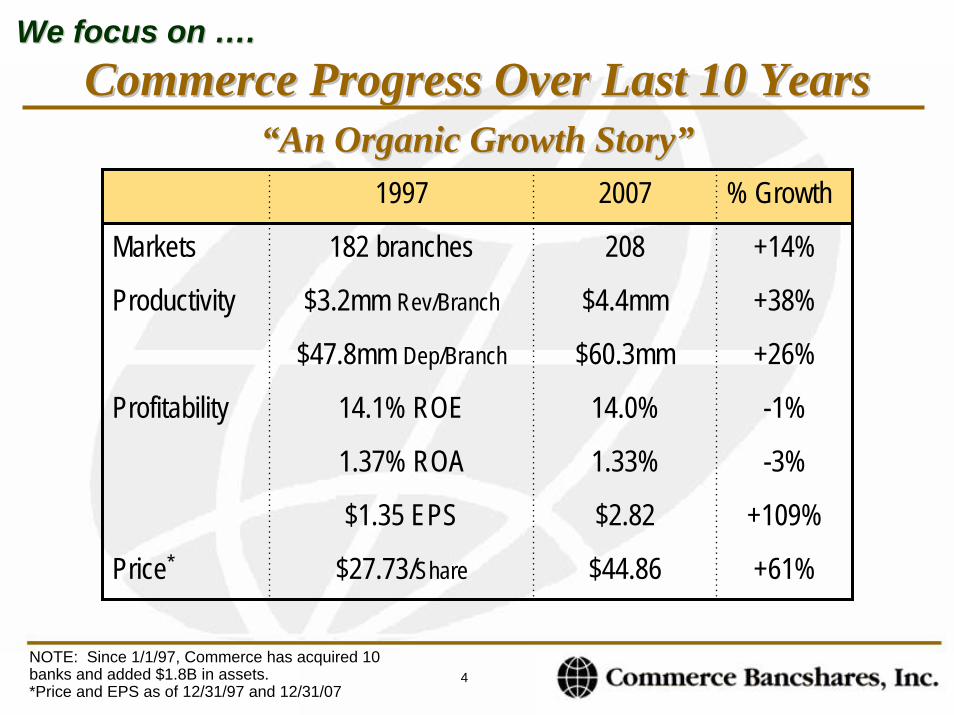
Commerce Progress Over Last 10 YearsCommerce Progress Over Last 10 Years““An Organic Growth StoryAn Organic Growth Story””
We focus on We focus on ……..
1997 2007 % Growth
Markets 182 branches 208 +14%
Productivity $3.2mm Rev/Branch $4.4mm +38%
$47.8mm Dep/Branch $60.3mm +26%
Profitability 14.1% ROE 14.0% -1%
1.37% ROA 1.33% -3%
$1.35 EPS $2.82 +109%
Price* $27.73/Share $44.86 +61%
NOTE: Since 1/1/97, Commerce has acquired 10 banks and added $1.8B in assets.*Price and EPS as of 12/31/97 and 12/31/07
5
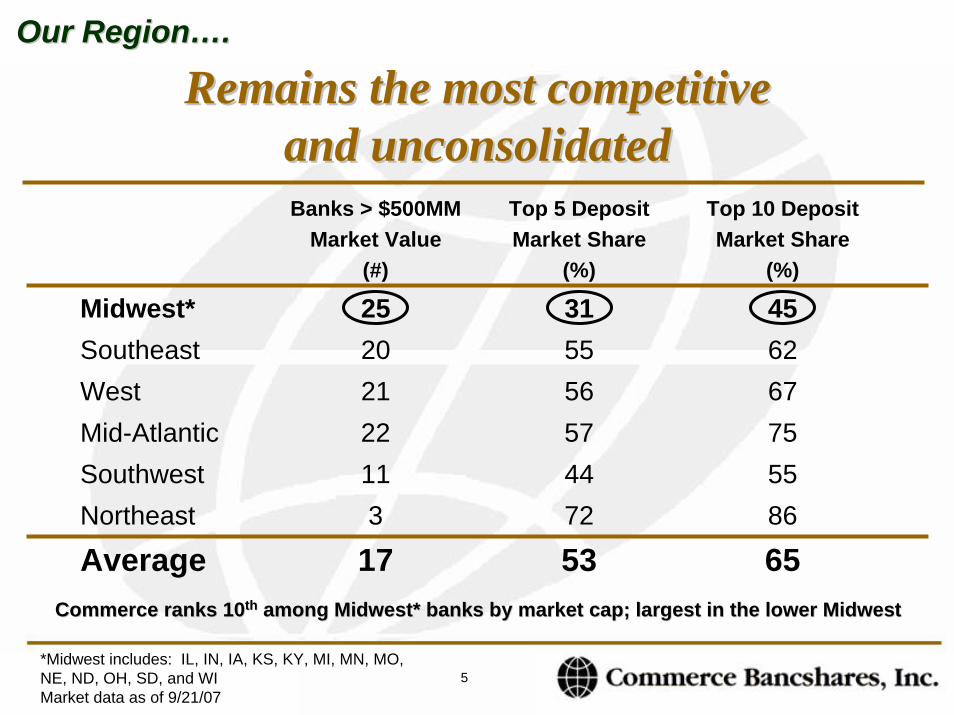
Remains the most competitive Remains the most competitive and unconsolidated
Our RegionOur Region……..
and unconsolidatedBanks > $500MM
Market Value(#)
Top 5 DepositMarket Share
(%)
Top 10 DepositMarket Share
(%)
Midwest* 25 31 45Southeast 20 55 62West 21 56 67Mid-Atlantic 22 57 75Southwest 11 44 55Northeast 3 72 86
Average 17 53 65Commerce ranks 10Commerce ranks 10thth among Midwest* banks by market cap; largest in the lower Midwesamong Midwest* banks by market cap; largest in the lower Midwestt
*Midwest includes: IL, IN, IA, KS, KY, MI, MN, MO, NE, ND, OH, SD, and WIMarket data as of 9/21/07
6
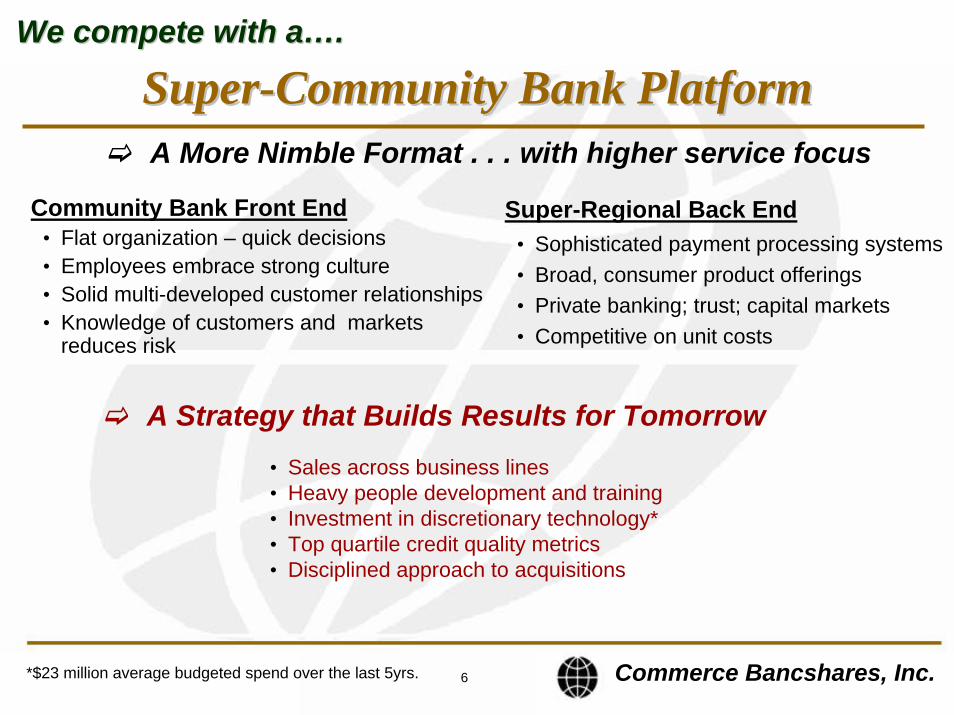
SuperSuper--Community Bank PlatformCommunity Bank PlatformWe compete with aWe compete with a……..
A More Nimble Format . . . with higher service focus
Community Bank Front End• Flat organization – quick decisions• Employees embrace strong culture• Solid multi-developed customer relationships• Knowledge of customers and markets
reduces risk
Super-Regional Back End• Sophisticated payment processing systems• Broad, consumer product offerings• Private banking; trust; capital markets• Competitive on unit costs
Commerce Bancshares, Inc.
A Strategy that Builds Results for Tomorrow• Sales across business lines• Heavy people development and training• Investment in discretionary technology*• Top quartile credit quality metrics• Disciplined approach to acquisitions
*$23 million average budgeted spend over the last 5yrs.
7
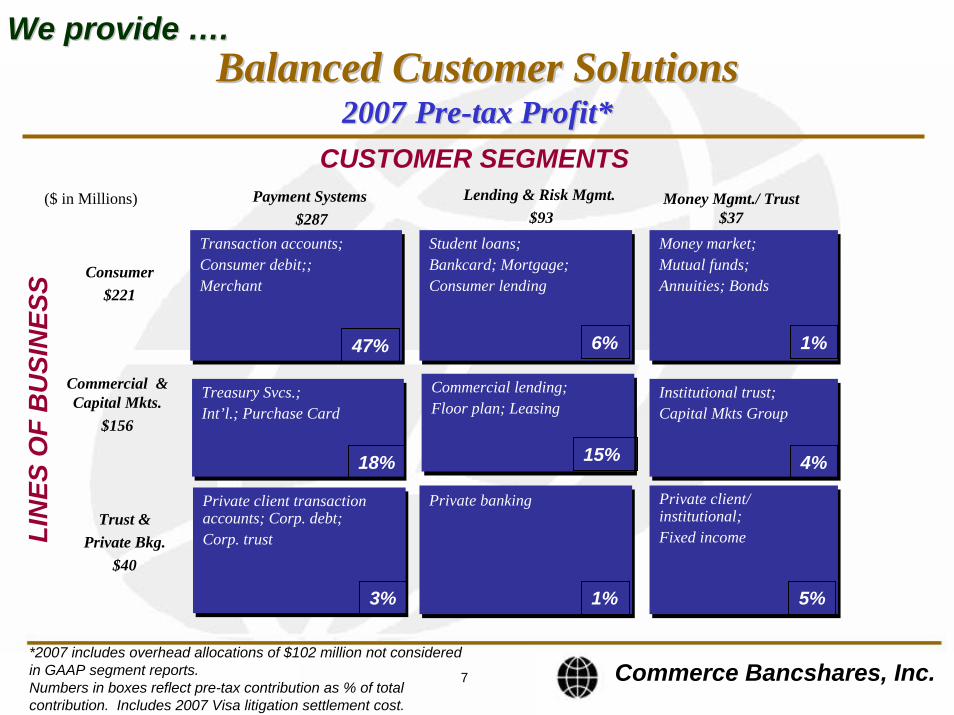
Balanced Customer SolutionsBalanced Customer Solutions20072007 PrePre--tax Profit*tax Profit*
Trust & Private Bkg.
$40
Commercial & Capital Mkts.
$156
Consumer$221
Money Mgmt./ Trust $37
Lending & Risk Mgmt. $93
Payment Systems $287
LIN
ES O
F B
USI
NES
S
Transaction accounts;Consumer debit;;Merchant
CUSTOMER SEGMENTS
Transaction accounts;Consumer debit;;Merchant
Private client/ institutional;Fixed income
Private client/ institutional;Fixed income
Private bankingPrivate banking
Institutional trust;Capital Mkts GroupInstitutional trust;Capital Mkts Group
Commercial lending;Floor plan; LeasingCommercial lending;Floor plan; Leasing
Treasury Svcs.;Int’l.; Purchase CardTreasury Svcs.;Int’l.; Purchase Card
Money market;Mutual funds;Annuities; Bonds
Money market;Mutual funds;Annuities; Bonds
Student loans;Bankcard; Mortgage;Consumer lending
Student loans;Bankcard; Mortgage;Consumer lending
Private client transaction accounts; Corp. debt; Corp. trust
Private client transaction accounts; Corp. debt; Corp. trust
47% 6% 1%
5%
4%
1%
15%
3%
18%
We provide We provide ……..
($ in Millions)
*2007 includes overhead allocations of $102 million not considered in GAAP segment reports.Numbers in boxes reflect pre-tax contribution as % of total contribution. Includes 2007 Visa litigation settlement cost.
Commerce Bancshares, Inc.
8
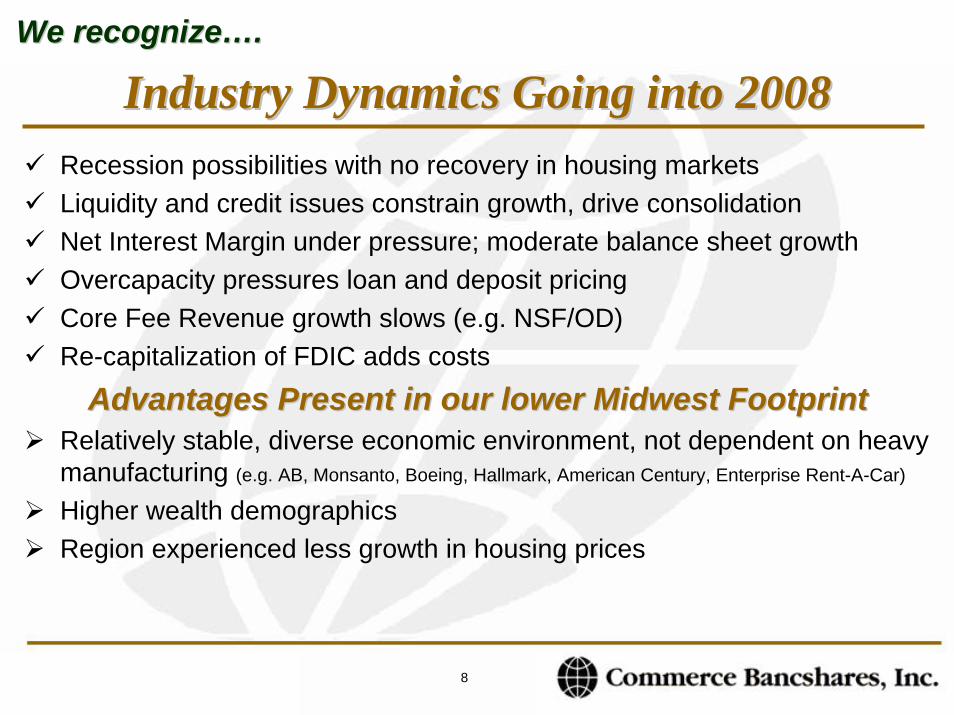
We recognizeWe recognize……..
Industry Dynamics Going into 2008Industry Dynamics Going into 2008Recession possibilities with no recovery in housing marketsLiquidity and credit issues constrain growth, drive consolidationNet Interest Margin under pressure; moderate balance sheet growthOvercapacity pressures loan and deposit pricingCore Fee Revenue growth slows (e.g. NSF/OD)Re-capitalization of FDIC adds costs
Advantages Present in our lower Midwest FootprintAdvantages Present in our lower Midwest FootprintRelatively stable, diverse economic environment, not dependent on heavy manufacturing (e.g. AB, Monsanto, Boeing, Hallmark, American Century, Enterprise Rent-A-Car)
Higher wealth demographics Region experienced less growth in housing prices
9
..…’…’07 Report07 Report
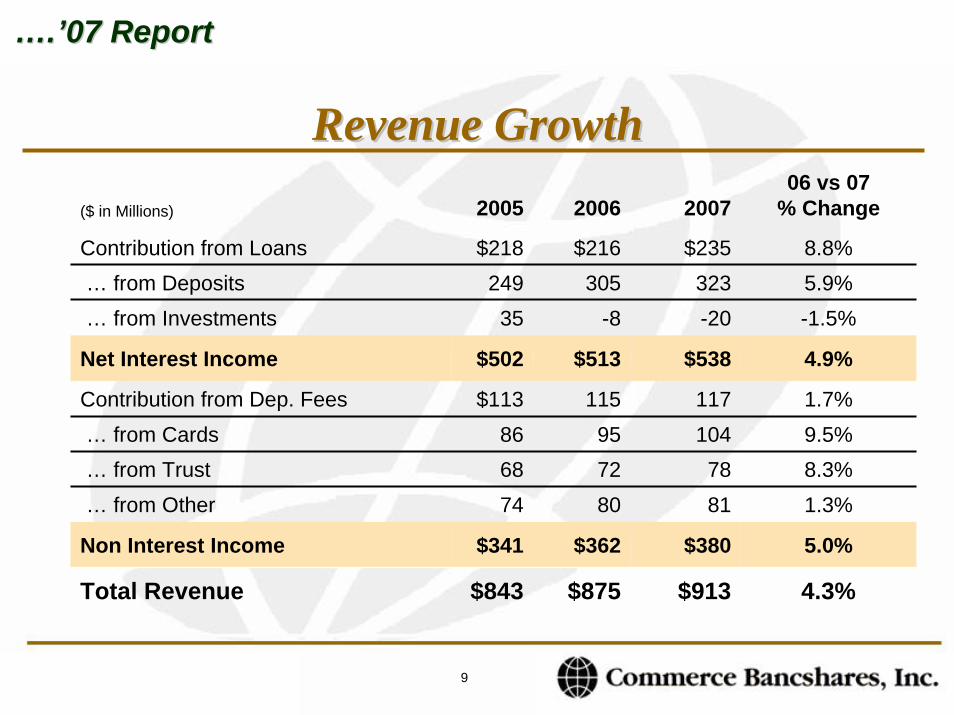
Revenue GrowthRevenue Growth($ in Millions) 2005 2006 2007
06 vs 07% Change
Contribution from Loans $218 $216305
-8
$513
115957280
$362
$875
$235 8.8%… from Deposits 249 323 5.9%… from Investments 35 -20 -1.5%
Net Interest Income $502 $538 4.9%
… from Cards 86 104 9.5%
Non Interest Income $341 $380 5.0%
… from Trust 68 78 8.3%… from Other 74 81 1.3%
Contribution from Dep. Fees $113 117 1.7%
Total Revenue $843 $913 4.3%
10
..…’…’07 Report07 Report
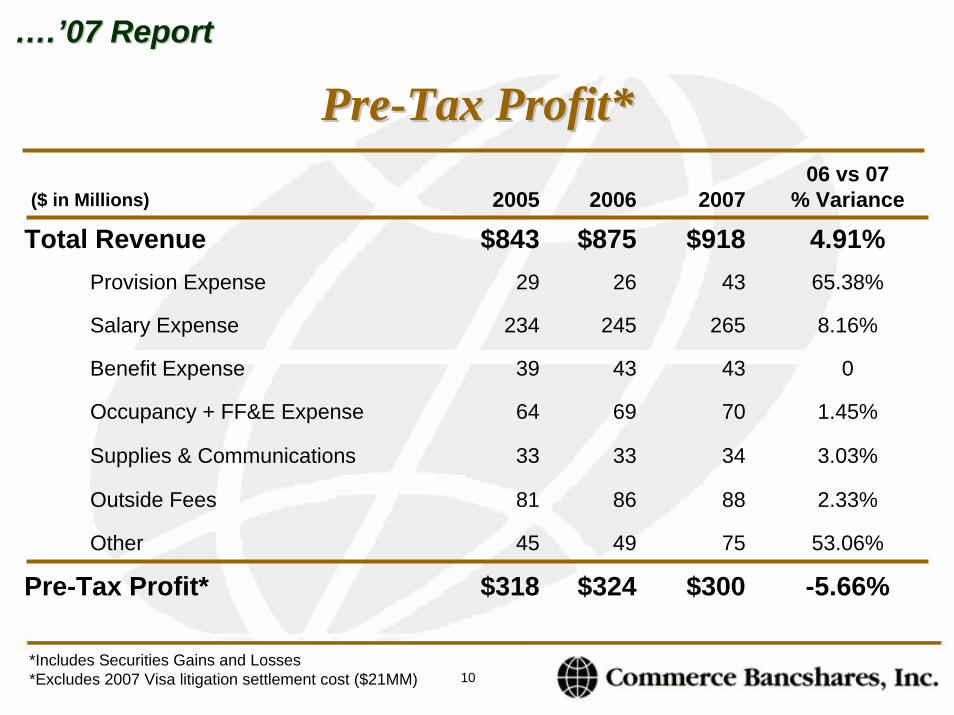
PrePre--Tax Profit*Tax Profit*
($ in Millions) 2005 2006
$843 $87526
245
43
69
33
86
49
$324
29
234
39
64
33
81
45
$318
200706 vs 07
% Variance
Total Revenue $918 4.91%Provision Expense 43 65.38%
Salary Expense 265 8.16%
Benefit Expense 43 0
Supplies & Communications 34 3.03%
Outside Fees 88 2.33%
Other 75 53.06%
Occupancy + FF&E Expense 70 1.45%
Pre-Tax Profit* $300 -5.66%
*Includes Securities Gains and Losses*Excludes 2007 Visa litigation settlement cost ($21MM)
11
..…’…’07 Report07 Report
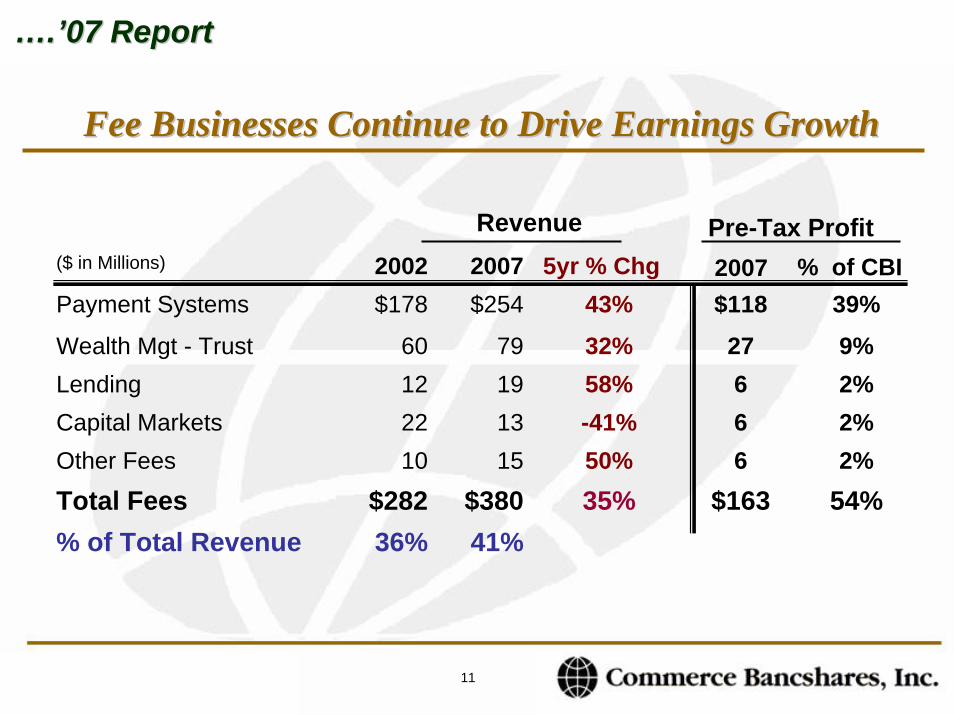
Fee Businesses Continue to Drive Earnings GrowthFee Businesses Continue to Drive Earnings Growth
($ in Millions) 2002 2007 5yr % Chg$178 43%
32%58%-41%50%35%
% of Total Revenue 36% 41%
60
$118
27666
122210
$282 $163
Payment Systems $254 39%
Wealth Mgt - Trust 79 9%Lending 19 2%Capital Markets 13 2%Other Fees 15 2%Total Fees $380 54%
Pre-Tax ProfitRevenue
2007 % of CBI
12
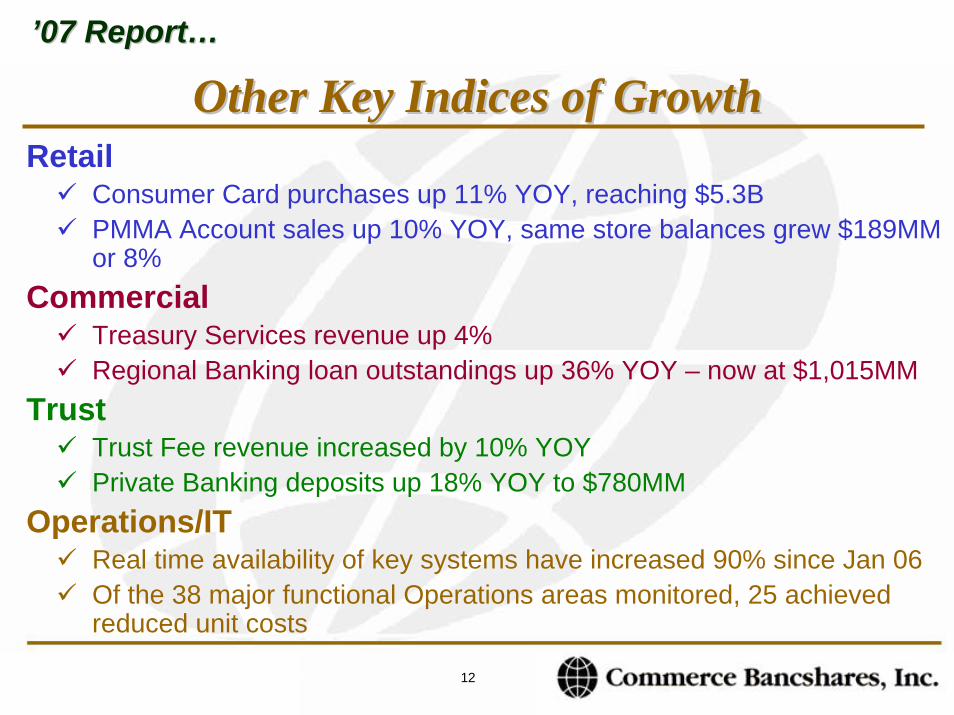
’’07 Report07 Report……
Other Key Indices of GrowthOther Key Indices of GrowthRetail
Consumer Card purchases up 11% YOY, reaching $5.3BPMMA Account sales up 10% YOY, same store balances grew $189MM or 8%
CommercialTreasury Services revenue up 4%Regional Banking loan outstandings up 36% YOY – now at $1,015MM
TrustTrust Fee revenue increased by 10% YOYPrivate Banking deposits up 18% YOY to $780MM
Operations/ITReal time availability of key systems have increased 90% since Jan 06Of the 38 major functional Operations areas monitored, 25 achieved reduced unit costs
*Automated Teller System is key driver
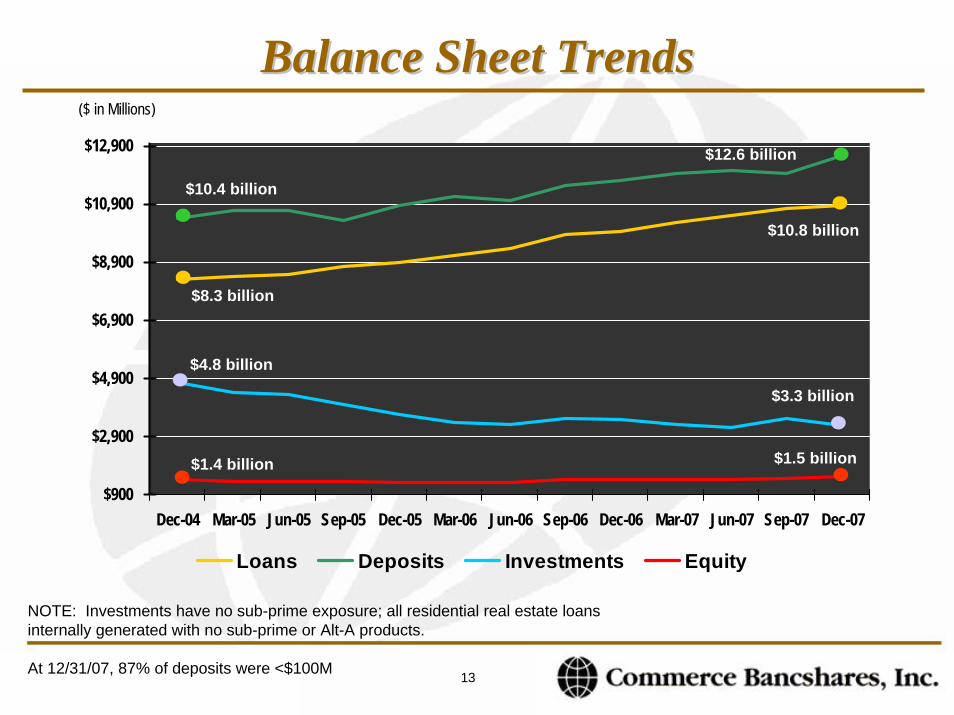
13
Balance Sheet TrendsBalance Sheet Trends($ in Millions)
$900
$2,900
$4,900
$6,900
$8,900
$10,900
$12,900
Dec-04 Mar-05 Jun-05 Sep-05 Dec-05 Mar-06 Jun-06 Sep-06 Dec-06 Mar-07 Jun-07 Sep-07 Dec-07
Loans Deposits Investments Equity
$3.5 billion
$4.8 billion
$8.3 billion
$10.8 billion
$12.6 billion
$10.4 billion
$1.4 billion
$3.3 billion
$1.5 billion
NOTE: Investments have no sub-prime exposure; all residential real estate loans internally generated with no sub-prime or Alt-A products.
At 12/31/07, 87% of deposits were <$100M
15
14
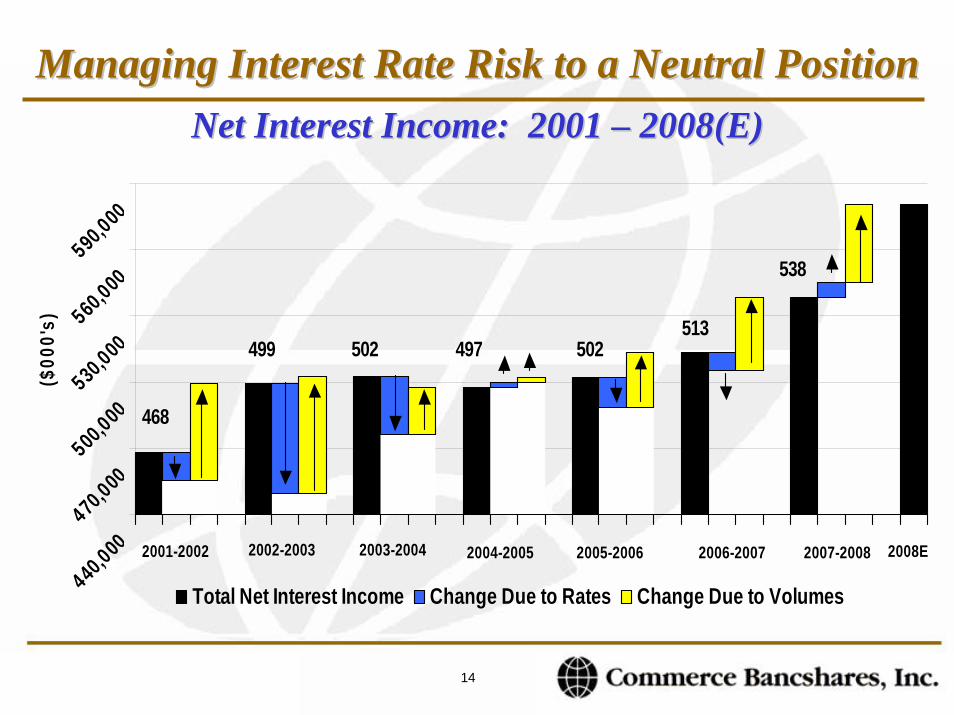
Managing Interest Rate Risk to a Neutral PositionManaging Interest Rate Risk to a Neutral PositionNet Interest Income: 2001 Net Interest Income: 2001 –– 2008(E)2008(E)
440,000
470,000
500,000
530,000
560,000
590,000
($00
0's)
Total Net Interest Income Change Due to Rates Change Due to Volumes
2001-2002 2002-2003 2003-2004 2006-2007
499 502 497
2004-2005 2005-2006
502513
2007-2008
468
538
2008E
15
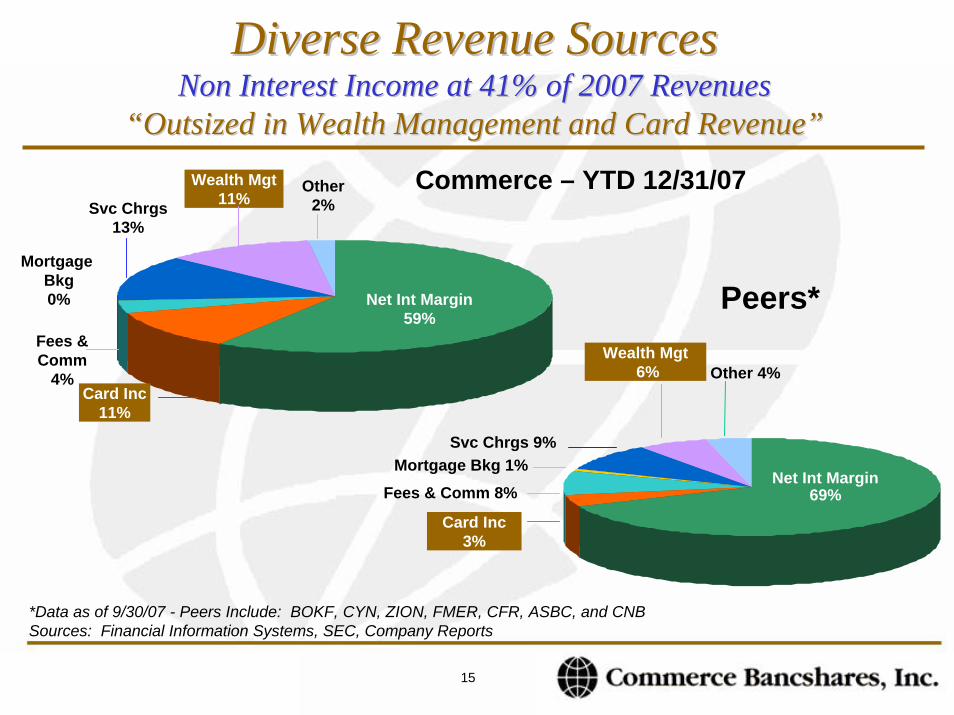
Diverse Revenue Sources Diverse Revenue Sources Non Interest Income at 41% of 2007 RevenuesNon Interest Income at 41% of 2007 Revenues
““Outsized in Wealth Management and Card RevenueOutsized in Wealth Management and Card Revenue””
*Data as of 9/30/07 - Peers Include: BOKF, CYN, ZION, FMER, CFR, ASBC, and CNBSources: Financial Information Systems, SEC, Company Reports
Peers*
Card Inc 3%
Svc Chrgs 9%Mortgage Bkg 1%
Other 4%
Net Int Margin69%
Wealth Mgt6%
Fees & Comm 8%
Card Inc11%
Wealth Mgt11%Svc Chrgs
13%
Other2%
Net Int Margin59%
Mortgage Bkg0%
Fees & Comm
4%
Commerce – YTD 12/31/07
16
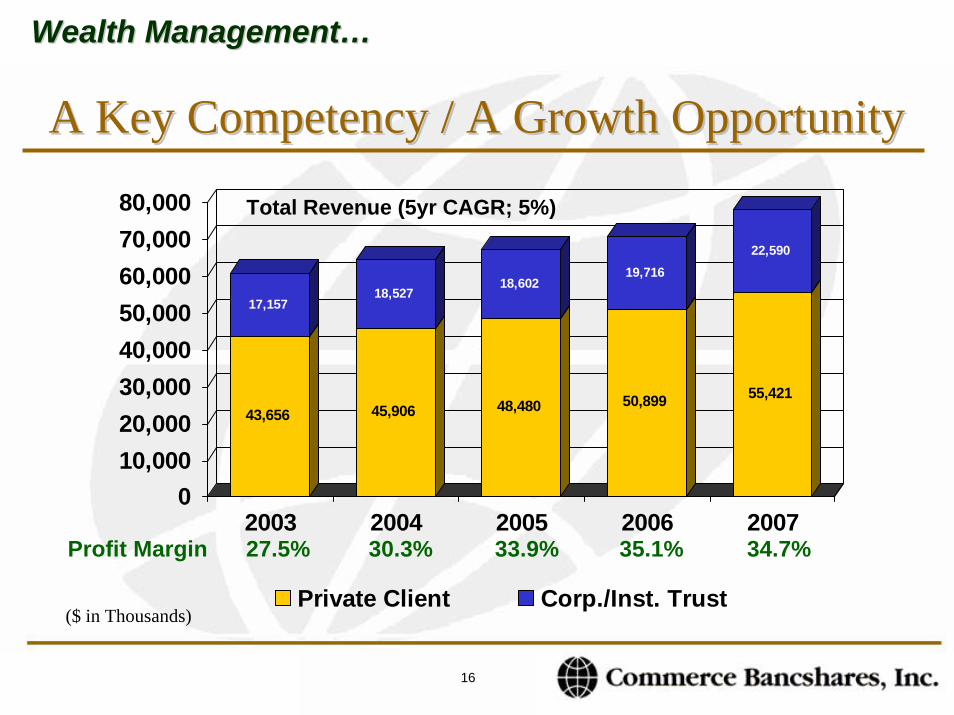
Wealth ManagementWealth Management……
A Key Competency / A Growth OpportunityA Key Competency / A Growth Opportunity
43,656
17,157
45,906
18,527
48,480
18,602
50,899
19,716
55,421
22,590
010,00020,00030,00040,00050,00060,00070,00080,000
2003 2004 2005 2006 2007
Private Client Corp./Inst. Trust
Profit Margin 27.5% 30.3% 33.9% 35.1% 34.7%
($ in Thousands)
Total Revenue (5yr CAGR; 5%)
17
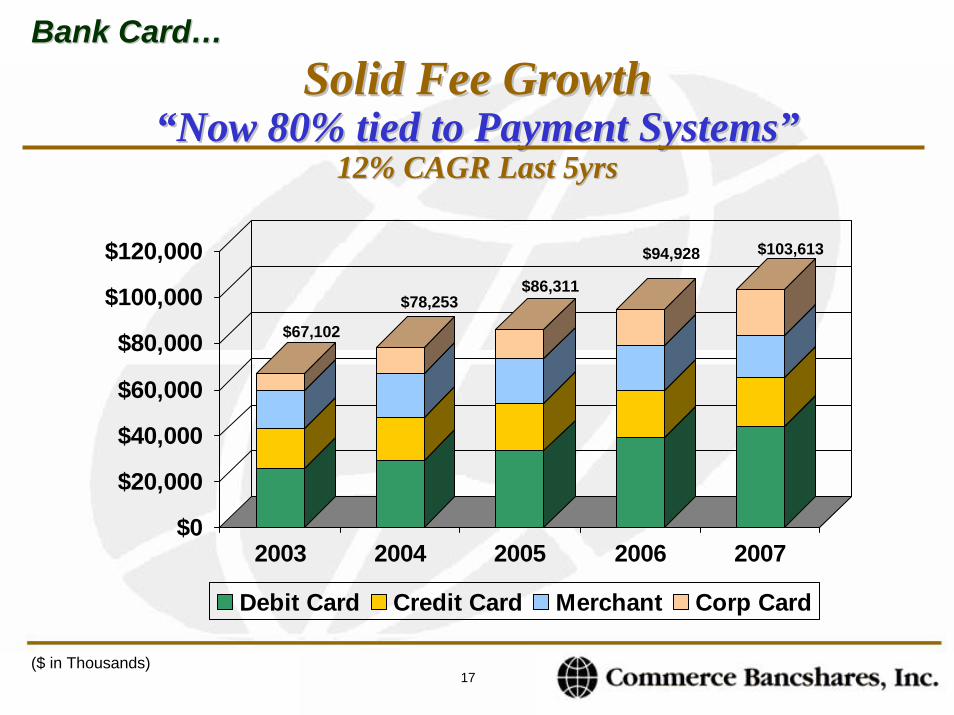
Solid Fee GrowthSolid Fee Growth““Now 80% tied to Payment SystemsNow 80% tied to Payment Systems””
12% CAGR Last 5yrs12% CAGR Last 5yrs
$0
$20,000
$40,000
$60,000
$80,000
$100,000
$120,000
2003 2004 2005 2006 2007
Debit Card Credit Card Merchant Corp Card
$67,102
$78,253$86,311
$94,928 $103,613
Bank CardBank Card……
($ in Thousands)
18
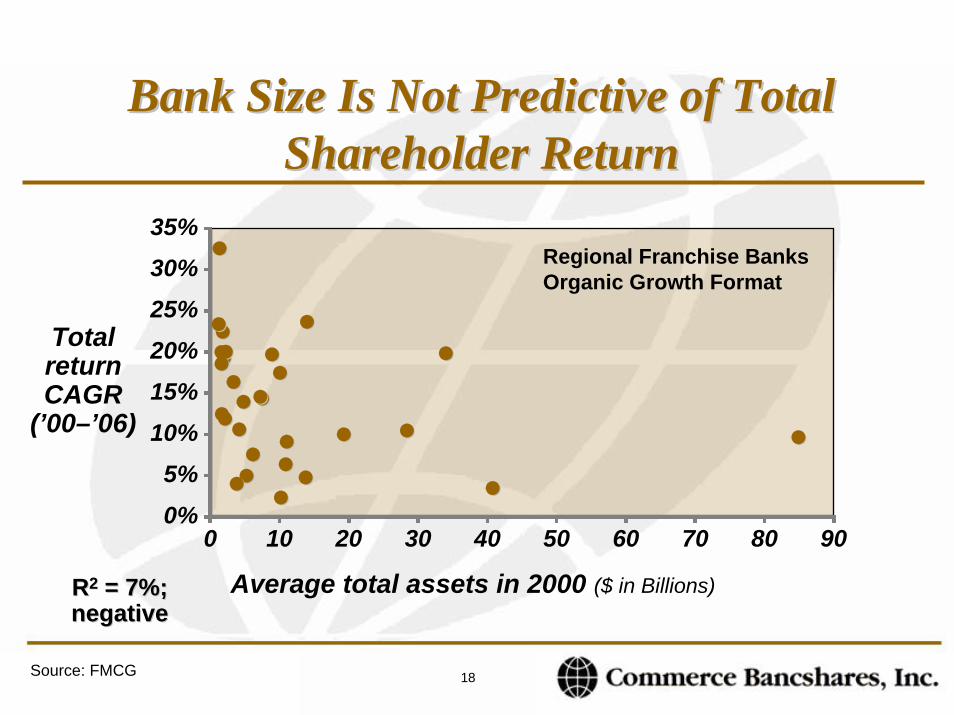
Bank Size Is Not Predictive of Total Bank Size Is Not Predictive of Total Shareholder ReturnShareholder Return
0%
5%
10%
15%20%
25%
30%35%
0 10 20 30 40 50 60 70 80 90
Regional Franchise BanksOrganic Growth Format
Total returnCAGR
(’00–’06)
Average total assets in 2000 ($ in Billions)RR22 = 7%;= 7%;negativenegative
Source: FMCG
19
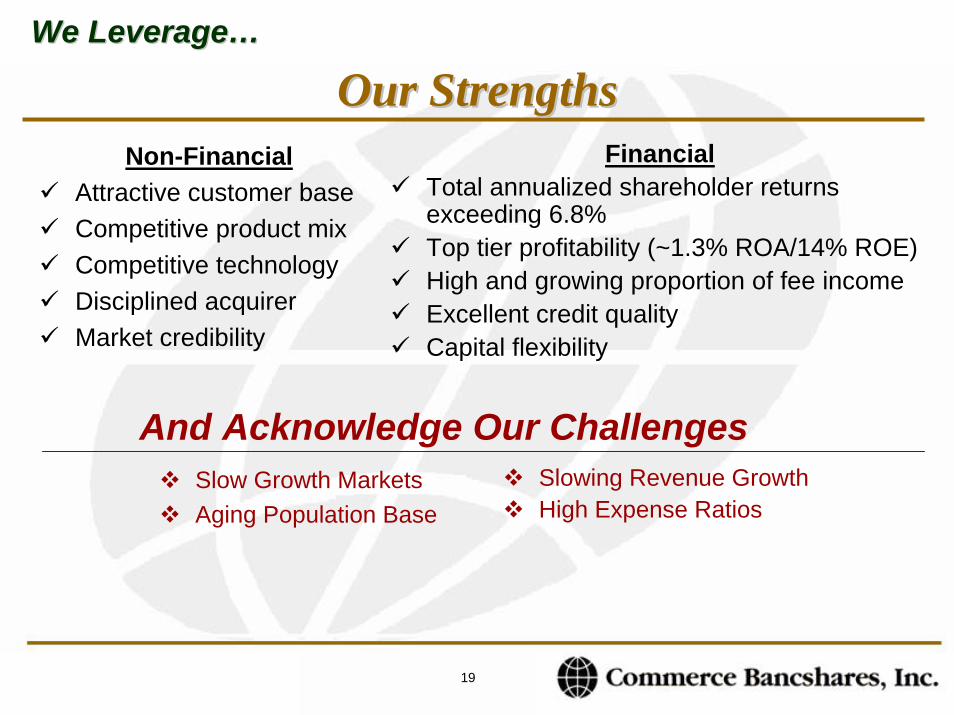
We LeverageWe Leverage……
Our StrengthsOur StrengthsNon-Financial
Attractive customer baseCompetitive product mixCompetitive technologyDisciplined acquirerMarket credibility
FinancialTotal annualized shareholder returns exceeding 6.8%Top tier profitability (~1.3% ROA/14% ROE)High and growing proportion of fee incomeExcellent credit qualityCapital flexibility
And Acknowledge Our ChallengesSlow Growth MarketsAging Population Base
Slowing Revenue GrowthHigh Expense Ratios
20
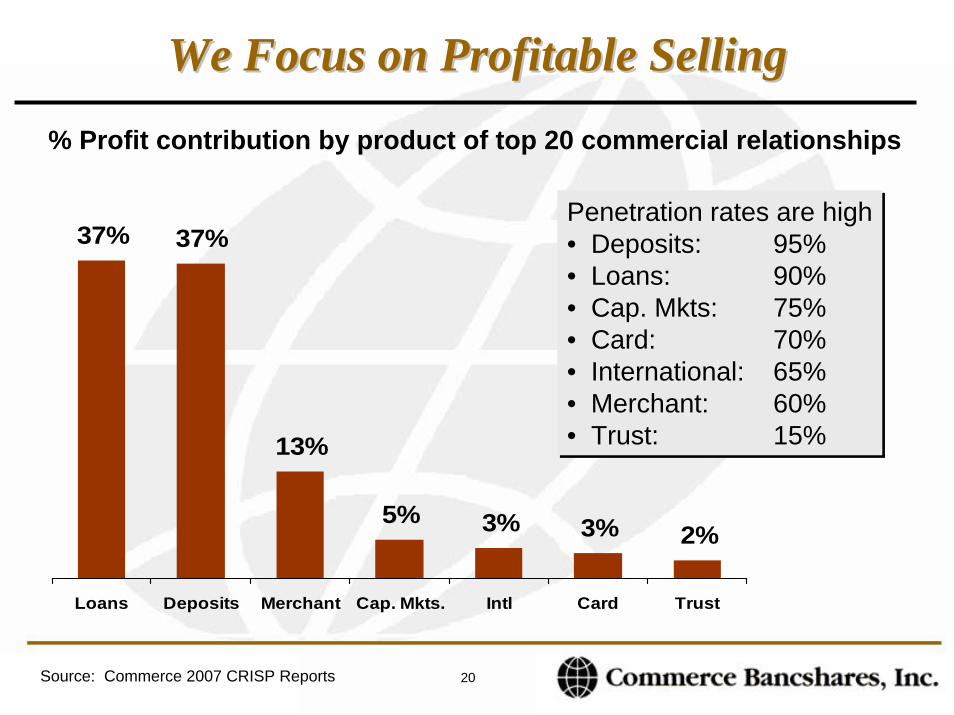
We Focus on Profitable SellingWe Focus on Profitable Selling
% Profit contribution by product of top 20 commercial relationships
37% 37%
13%
5% 3% 3% 2%
Loans Deposits Merchant Cap. Mkts. Intl Card Trust
Penetration rates are high• Deposits: 95%• Loans: 90%• Cap. Mkts: 75%• Card: 70%• International: 65%• Merchant: 60%• Trust: 15%
Penetration rates are high• Deposits: 95%• Loans: 90%• Cap. Mkts: 75%• Card: 70%• International: 65%• Merchant: 60%• Trust: 15%
Source: Commerce 2007 CRISP Reports23
21
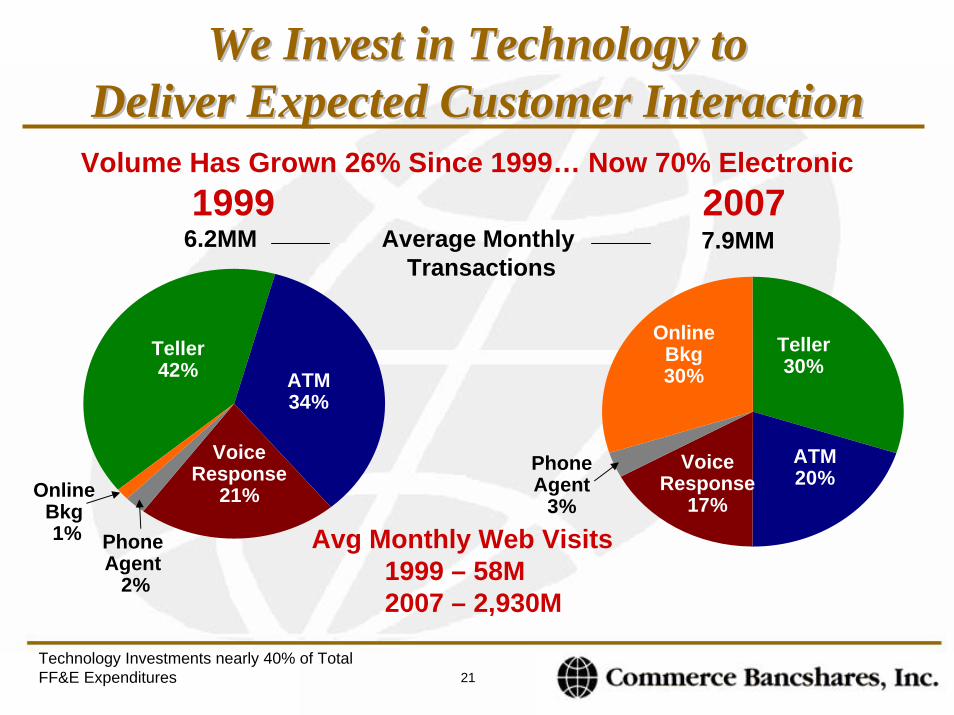
We Invest in Technology toWe Invest in Technology toDeliver Expected Customer Interaction Deliver Expected Customer Interaction
6.2MM 7.9MMAverage Monthly Transactions
1999 2007
Avg Monthly Web Visits1999 – 58M2007 – 2,930M
Volume Has Grown 26% Since 1999… Now 70% Electronic
Teller42%
VoiceResponse
21%
PhoneAgent
2%
ATM34%
OnlineBkg1%
Teller30%
VoiceResponse
17%
PhoneAgent
3%
ATM20%
OnlineBkg30%
Technology Investments nearly 40% of Total FF&E Expenditures
22
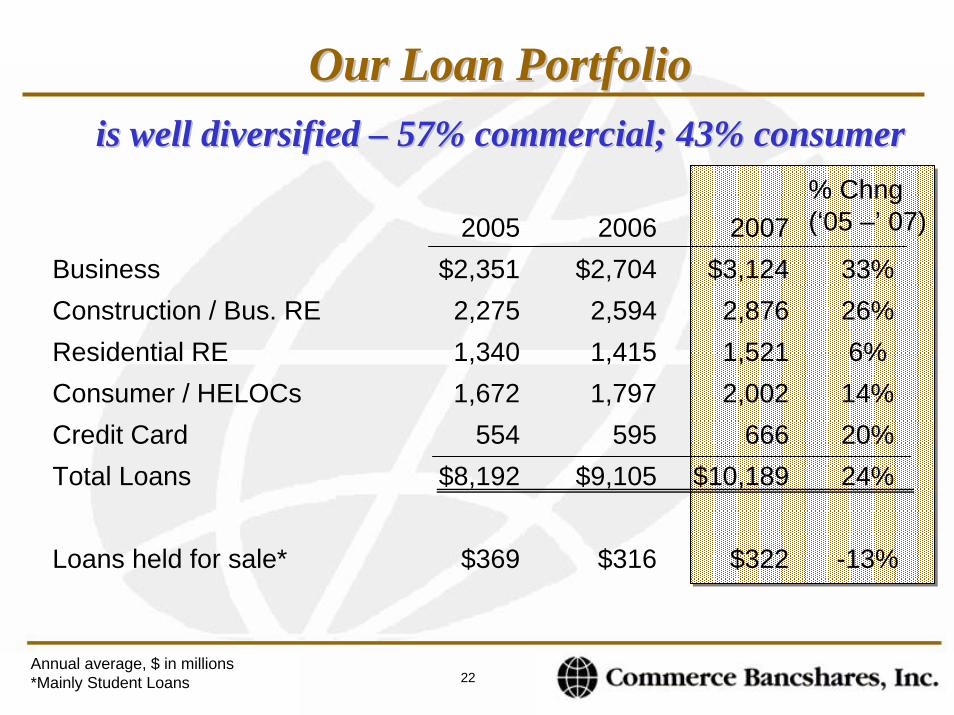
Our Loan PortfolioOur Loan Portfoliois well diversified is well diversified –– 57% commercial; 43% consumer57% commercial; 43% consumer
2005 2006 2007% Chng(‘05 –’ 07)
Business $2,351 $2,704 $3,124 33%Construction / Bus. RE 2,275 2,594 2,876 26%Residential RE 1,340 1,415 1,521 6%Consumer / HELOCs 1,672 1,797 2,002 14%Credit Card 554 595 666 20%Total Loans $8,192 $9,105 $10,189 24%
Loans held for sale* $369 $316 $322 -13%
Annual average, $ in millions*Mainly Student Loans
23
0.00%
0.05%
0.10%
0.15%
0.20%
0.25%
0.30%
0.35%
0.40%
0.45%
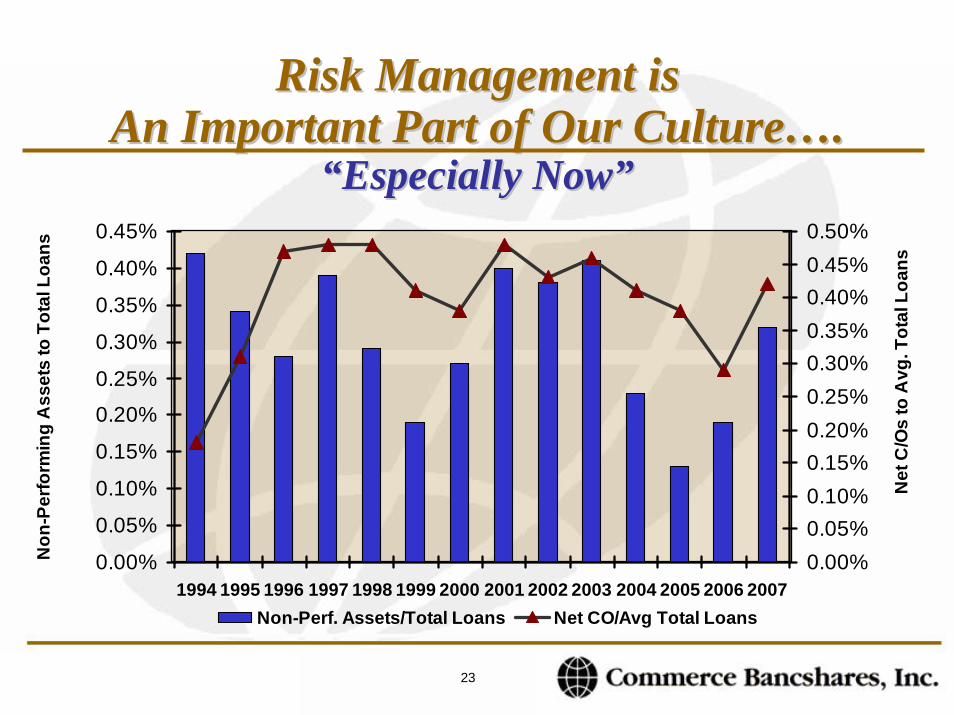
1994 1995 1996 1997 1998 1999 2000 2001 2002 2003 2004 2005 2006 2007
Non
-Per
form
ing
Ass
ets
to T
otal
Loa
ns
0.00%0.05%0.10%0.15%0.20%0.25%0.30%0.35%0.40%0.45%0.50%
Net
C/O
s to
Avg
. Tot
al L
oans
Non-Perf. Assets/Total Loans Net CO/Avg Total Loans
Risk Management is Risk Management is An Important Part of Our CultureAn Important Part of Our Culture……..
““Especially NowEspecially Now””
24
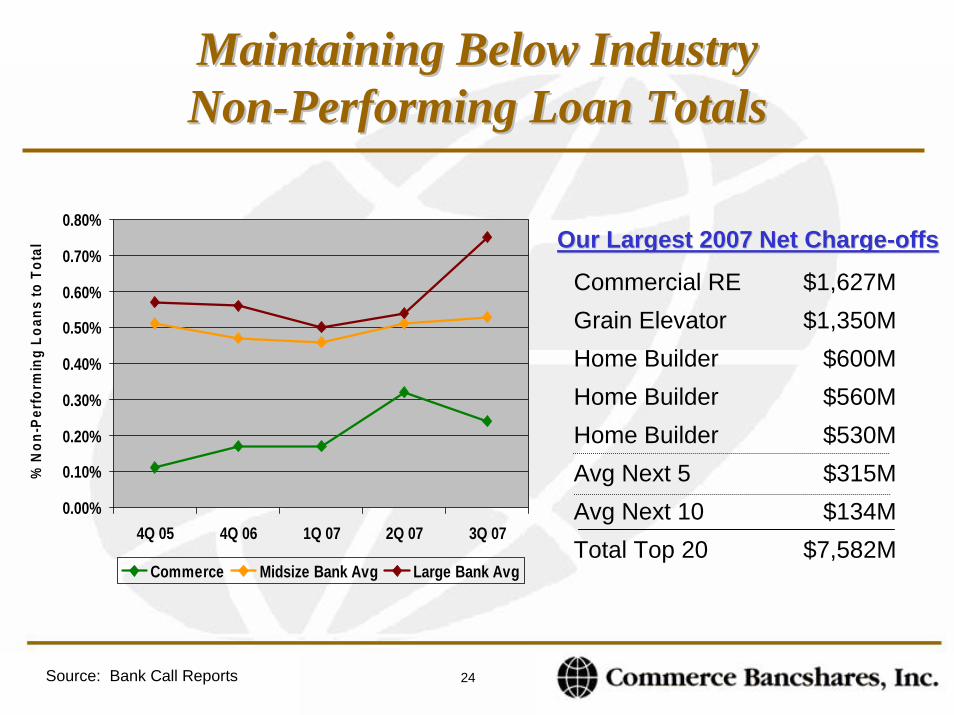
Maintaining Below Industry Maintaining Below Industry NonNon--Performing Loan TotalsPerforming Loan Totals
0.00%
0.10%
0.20%
0.30%
0.40%
0.50%
0.60%
0.70%
0.80%
4Q 05 4Q 06 1Q 07 2Q 07 3Q 07
% N
on-P
erfo
rmin
g Lo
ans
to T
otal
Commerce Midsize Bank Avg Large Bank Avg
Our Largest 2007 Net ChargeOur Largest 2007 Net Charge--offsoffs
Commercial RE $1,627MGrain Elevator $1,350MHome Builder $600MHome Builder $560MHome Builder $530MAvg Next 5 $315MAvg Next 10 $134MTotal Top 20 $7,582M
Source: Bank Call Reports
25
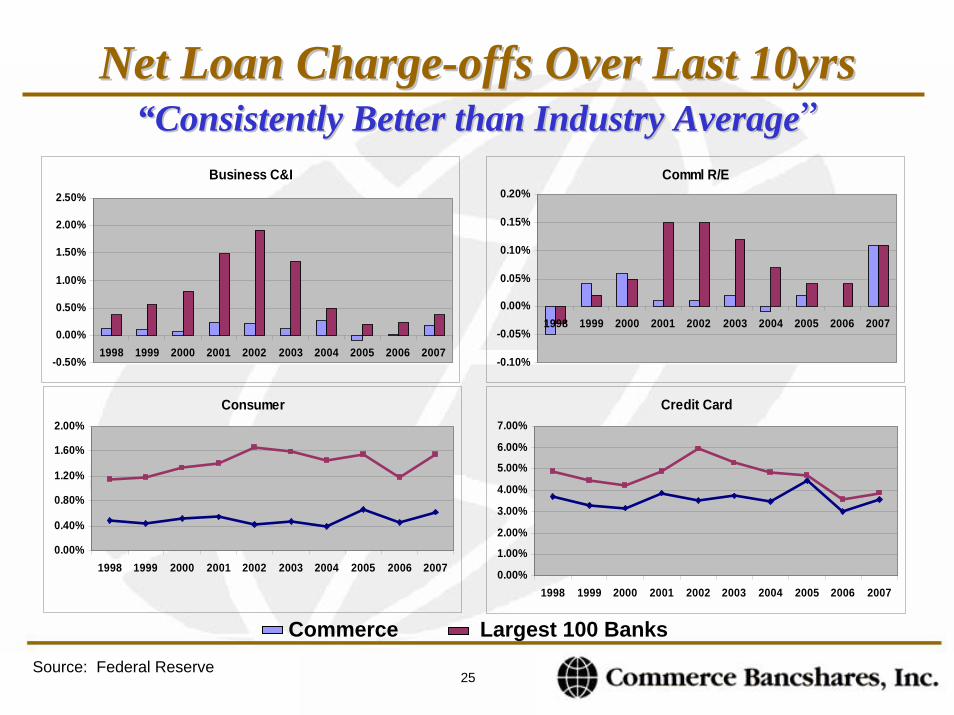
Net Loan ChargeNet Loan Charge--offs Over Last 10yrsoffs Over Last 10yrs““Consistently Better than Industry AverageConsistently Better than Industry Average””
Business C&I
-0.50%
0.00%
0.50%
1.00%
1.50%
2.00%
2.50%
1998 1999 2000 2001 2002 2003 2004 2005 2006 2007
Comml R/E
-0.10%
-0.05%
0.00%
0.05%
0.10%
0.15%
0.20%
1998 1999 2000 2001 2002 2003 2004 2005 2006 2007
Consumer
0.00%
0.40%
0.80%
1.20%
1.60%
2.00%
1998 1999 2000 2001 2002 2003 2004 2005 2006 2007
Credit Card
0.00%
1.00%
2.00%
3.00%
4.00%
5.00%
6.00%
7.00%
1998 1999 2000 2001 2002 2003 2004 2005 2006 2007
Commerce Largest 100 BanksSource: Federal Reserve
26
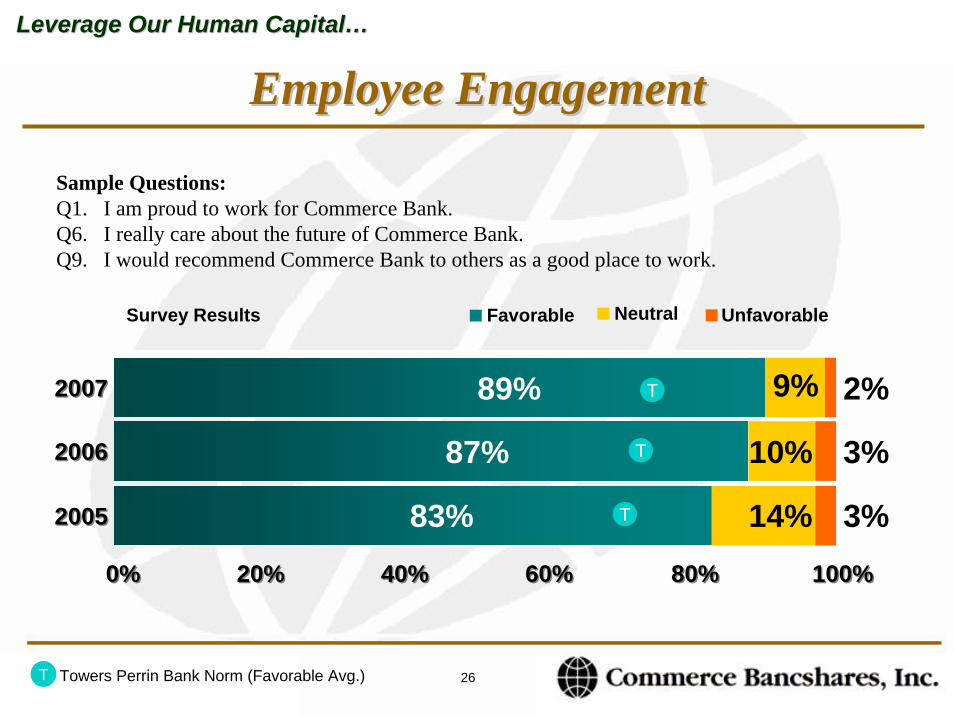
Employee EngagementEmployee EngagementLeverage Our Human CapitalLeverage Our Human Capital……
Sample Questions:Q1. I am proud to work for Commerce Bank.Q6. I really care about the future of Commerce Bank.Q9. I would recommend Commerce Bank to others as a good place to work.
NeutralSurvey Results UnfavorableFavorable
89% 2%20072007 9%T
83% 14% 3%
87% 10% 3%
20052005
20062006
T
T
0%0% 20%20% 40%40% 60%60% 80%80% 100%100%
Towers Perrin Bank Norm (Favorable Avg.)T
27
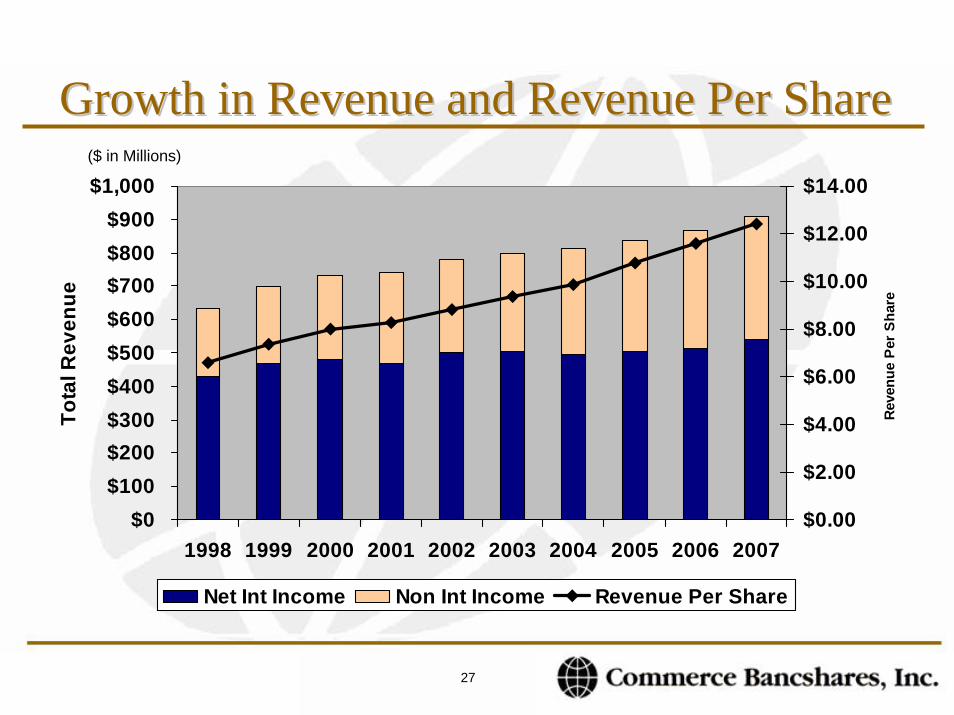
Growth in Revenue and Revenue Per ShareGrowth in Revenue and Revenue Per Share($ in Millions)
$0$100$200$300$400$500$600$700$800$900
$1,000
1998 1999 2000 2001 2002 2003 2004 2005 2006 2007
Tota
l Rev
enue
$0.00
$2.00
$4.00
$6.00
$8.00
$10.00
$12.00
$14.00
Reve
nue
Per
Shar
e
Net Int Income Non Int Income Revenue Per Share
28
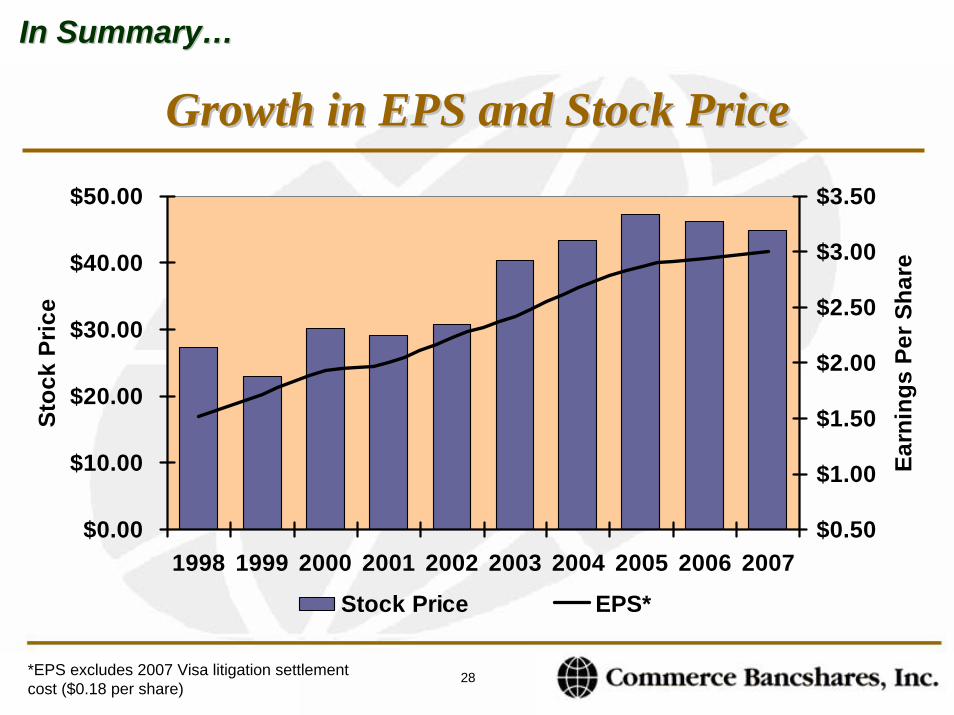
In SummaryIn Summary……
Growth in EPS and Stock PriceGrowth in EPS and Stock Price
$0.00
$10.00
$20.00
$30.00
$40.00
$50.00
1998 1999 2000 2001 2002 2003 2004 2005 2006 2007
Stoc
k Pr
ice
$0.50
$1.00
$1.50
$2.00
$2.50
$3.00
$3.50
Earn
ings
Per
Sha
re
Stock Price EPS*
*EPS excludes 2007 Visa litigation settlement cost ($0.18 per share)
Recommended