Daren Harmel
Collecting Small Watershed Runoff andWater Quality Data

Objectives
• Small watershed data collection• Provide “How To” overview for managers• Present “How To” details for technical staff• Discuss balance between project resources, monitoring
goals, and data uncertainty

Small Watershed Data Collection
• Prior to this research, little published guidance was available to support design and operation of small watershed data collection.• Costs and difficulties often under-estimated• Projects characterized by inconsistent methods, missing
data values, short-term data sets.

Small Watershed Data Collection
• Developed and published practical “how to” guidance• Small watersheds (including “edge-of-field”)• Automated storm sampling• Q measurement - USGS, ARS
• Manual grab sampling - USGS
For example:
Harmel, R.D., K.W. King, and R.M. Slade. 2003. Automated storm water sampling on small watersheds. Appl. Eng. Agric. 19(6): 667-674.
Harmel, R.D., K.W. King, B.E. Haggard, D.G. Wren, and J.M. Sheridan. 2006. Practical guidance for discharge and water quality data collection on small watersheds. Trans. ASABE 49(4): 937-948.
Harmel, R.D., R.M. Slade, and R.L. Haney. 2010. Impact of sampling techniques on measured storm water quality data for small streams. J. Environ. Qual. 39: 1734-1742.

Difficulties in Storm Sampling
• Requires substantial resource commitment• equipment purchase and maintenance
• automated samplers needed• personnel (travel, work hours)• lab analysis
• Constrained by QA/QC• “Storm sampling”
• safety, timing• Problems will occur
Difficulties in Storm Sampling

Difficulties in Storm Sampling
8 in of rain following seeding/mulching
lightning
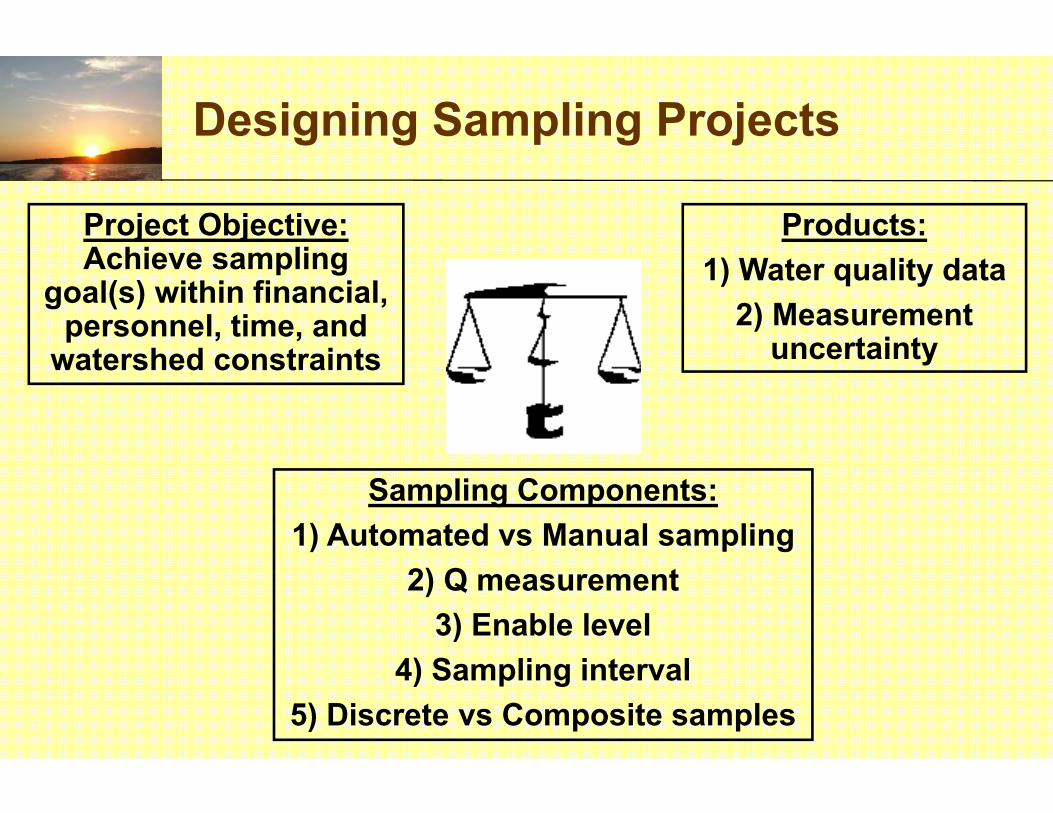
Sampling Components:1) Automated vs Manual sampling
2) Q measurement3) Enable level
4) Sampling interval5) Discrete vs Composite samples
Project Objective: Achieve sampling
goal(s) within financial, personnel, time, and
watershed constraints
Products:1) Water quality data
2) Measurement uncertainty
Designing Sampling Projects

Sampling Components:Manual vs. Automated
• Automated sampling necessary in most projects• Most samplers have:
• stage recorder/flow meter• sample collection pump & bottle(s)• programmable operation/memory
• Must commit to regular maintenance• limit malfunctions• prevent data loss

intake
bottle(s)
stage/flow recorder

Sampling Components:Q Measurement
• For continuous discharge measurement:• Option #1 -
• establish stage-discharge relationship (rating curve)• measure stage - preferably in stilling well• determine Q with stage-discharge relationship
• Option #2 –• use in-stream area-velocity sensor

Sampling Components:Q Measurement
0
1
2
3
0 1 2 3 4 5water level (ft)
flow
(cfs
)
Stage Discharge Curvestage-discharge relationship

Sampling Components:Q Measurement
• Developing a stage-discharge relationship in a natural channel requires • substantial time and effort• periodic adjustment

Sampling Components:Q Measurement
• Flow control (hydraulic) structure highly recommended• Precalibrated flow control structure eliminates need to
develop stage-discharge relationship• provides consistent, accurate Q measurement for load
and EMC determination
Stilling Well

88
89
90
91
92
93
94
95
96
20 30 40 50 60 70 80
distance (ft)
rela
tive
elev
atio
n (ft
)
high enable level
low enable level
Sampling Components:Enable Level
• High Minimum Flow Threshold “Enable Level”• increases error, even if consider Q and estimate
concentration outside sampling period

88
89
90
91
92
93
94
95
96
20 30 40 50 60 70 80
distance (ft)
rela
tive
elev
atio
n (ft
)
high enable level
low enable level
Sampling Components:Enable Level
• Low Minimum Flow Threshold “Enable Level”• reduces error, especially if consider Q and
estimate concentration outside sampling period

Sampling Components:Sampling Interval
• Time-Interval Sampling • Advantages
• simple, reliable• Disadvantages
• difficult to choose interval
• Q needed to calculate load
• “Low” interval recommended
time (min)
0 20 40 60 80 100 120 140 160
flow
(m3 /s
)
0
1
2
3 flowtime-interval sample (10 min)
time interval(min) discrete 2 4 6
5 no no no no10 no no no no15 no no no yes30 no no yes no60 no yes no no120 yes no no no180 no no no no
composite samples per bottle

Sampling Components:Sampling Interval
• Flow-Interval Sampling• Advantages
• produces EMC• easy to choose interval• uniform sampling for
various watershed sizes• Disadvantages
• must accurately measure Q• 1.5-5 mm interval
recommended
time (min)
0 20 40 60 80 100 120 140 160
flow
(m3 /s
)
0
1
2
3 flowflow-interval sample (2.5 mm)

Sampling Components:Discrete vs Composite
• Discrete Sampling• collection of 1 sample per bottle• difficult to sample complete storms of various duration• complete information on within-storm concentrations (if
can sample complete event)

Sampling Components:Discrete vs Composite
• Composite Sampling• collection of 2+ samples per bottle• little or no increase in error• reduced information on within-storm concentrations

Sampling Components:1) Automated vs Manual sampling
2) Q measurement3) Enable level
4) Sampling interval5) Discrete vs Composite samples
Project Objective: Achieve sampling
goal(s) within financial, personnel, time, and
watershed constraints
Products:1) Water quality data
2) Measurement uncertainty
Designing Sampling Projects

Designing Sampling Projects
Alternative Cost Uncertainty RecommendRaise “enable level” save $ increase No
Increase sampling interval save $ increase NoComposite samples save $ ~ no increase Yes
Decrease # sites save $$$ small increase YesDecrease # storms save $$ large increase No, no!
Flow-interval, compositesampling with single bottle

Conclusions
• In small watershed runoff and water quality data collection, it is important to understand that…• successful projects achieve a difficult balance between
project goal(s), data quality, sampling components • collection of high quality data requires a great deal of
time, $$, commitment• all measured data are uncertain• uncertainty increases dramatically without dedicated
QA/QC• QA/QC should include uncertainty estimation and
reporting to increase “value” of data.

Daren Harmel
Understanding and Reducing Uncertaintyin Hydrology and Water Quality Data
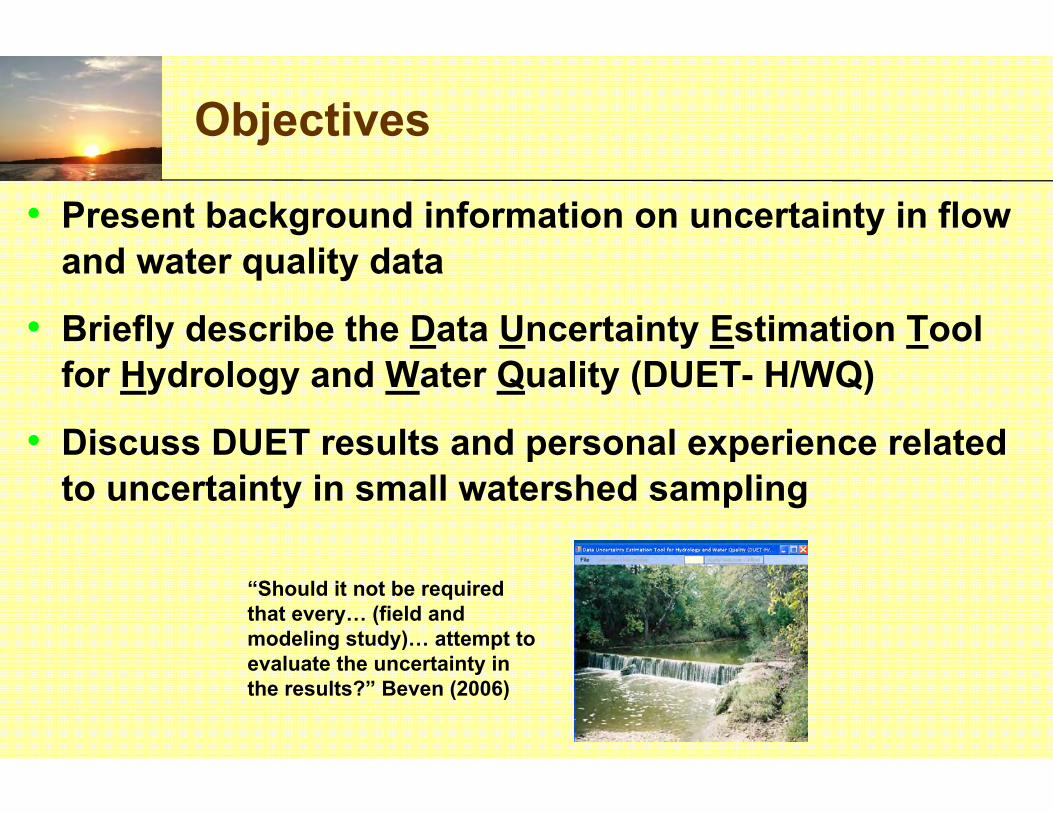
Objectives
• Present background information on uncertainty in flow and water quality data
• Briefly describe the Data Uncertainty Estimation Tool for Hydrology and Water Quality (DUET- H/WQ)
• Discuss DUET results and personal experience related to uncertainty in small watershed sampling
“Should it not be required that every… (field and modeling study)… attempt to evaluate the uncertainty in the results?” Beven (2006)

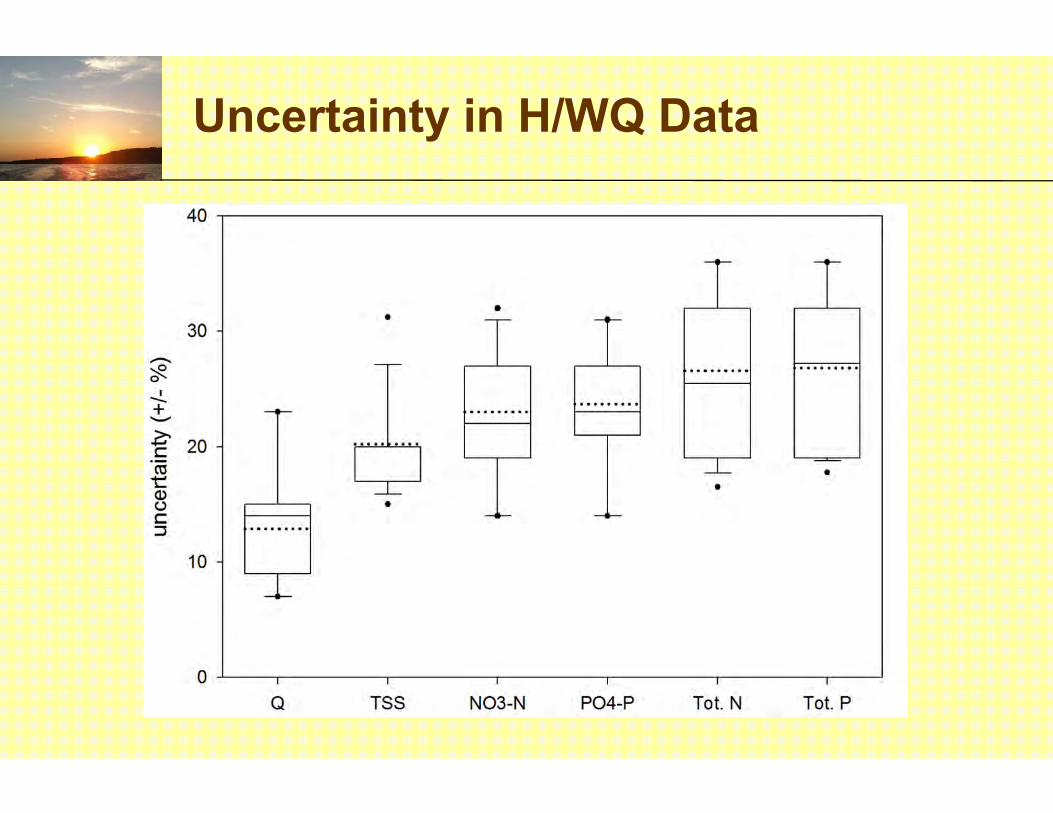
Uncertainty in H/WQ Data
• Why is data uncertainty typically ignored?? Until recently…• An adequate understanding of H/WQ measurement
uncertainty had not been established. • No complete uncertainty (error propagation) analysis had
been conducted on measured H/WQ data.• No easy-to-use tool was available to assist with
uncertainty estimation in H/WQ.

Sources of Uncertainty
• discharge measurement - individual Q’s, stage-discharge relation, channel conditions
• sample collection - EWI vs. grab vs. automated, sampling frequency, location in x-section, discrete vs. composite
• sample preservation/storage - pre-processing, preservation, storage duration and conditions
• laboratory analysis - reagents, standards, method, instrument, best fit curve
• data processing and management - mistakes, missing data
“The use of uncertainty estimation… (should be)… routine in hydrological
and hydraulic science.” Pappenberger, Beven (2006)

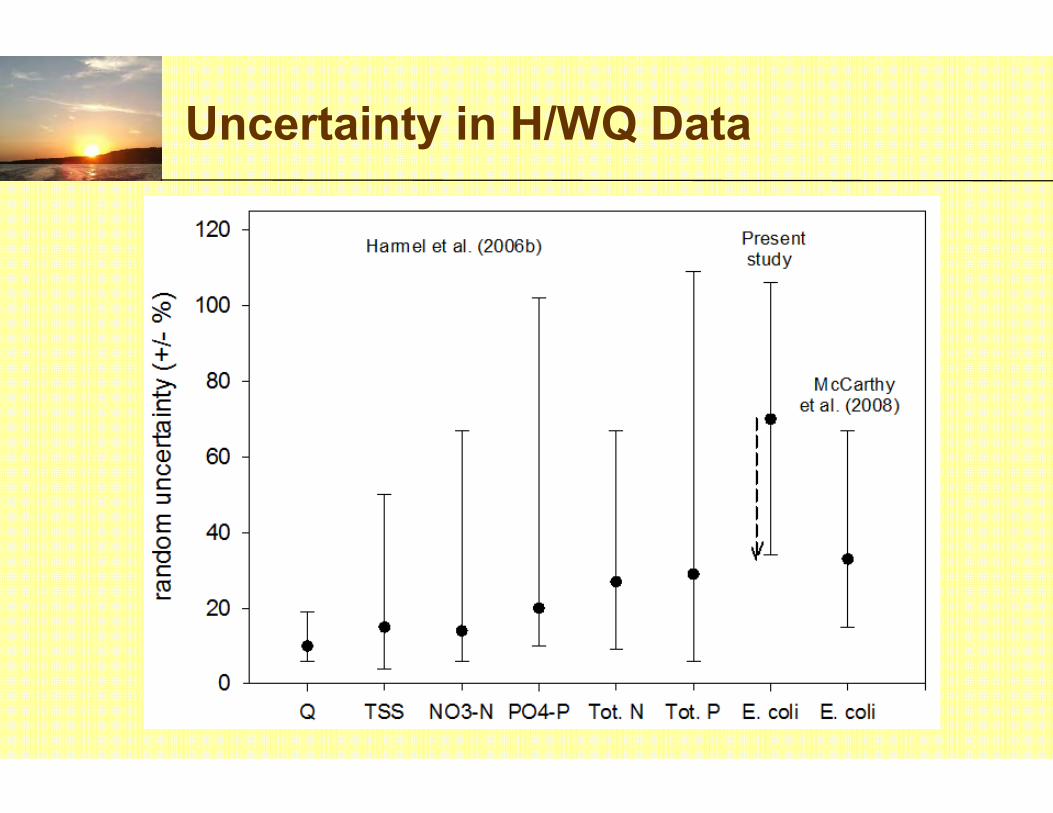
Uncertainty in H/WQ Data
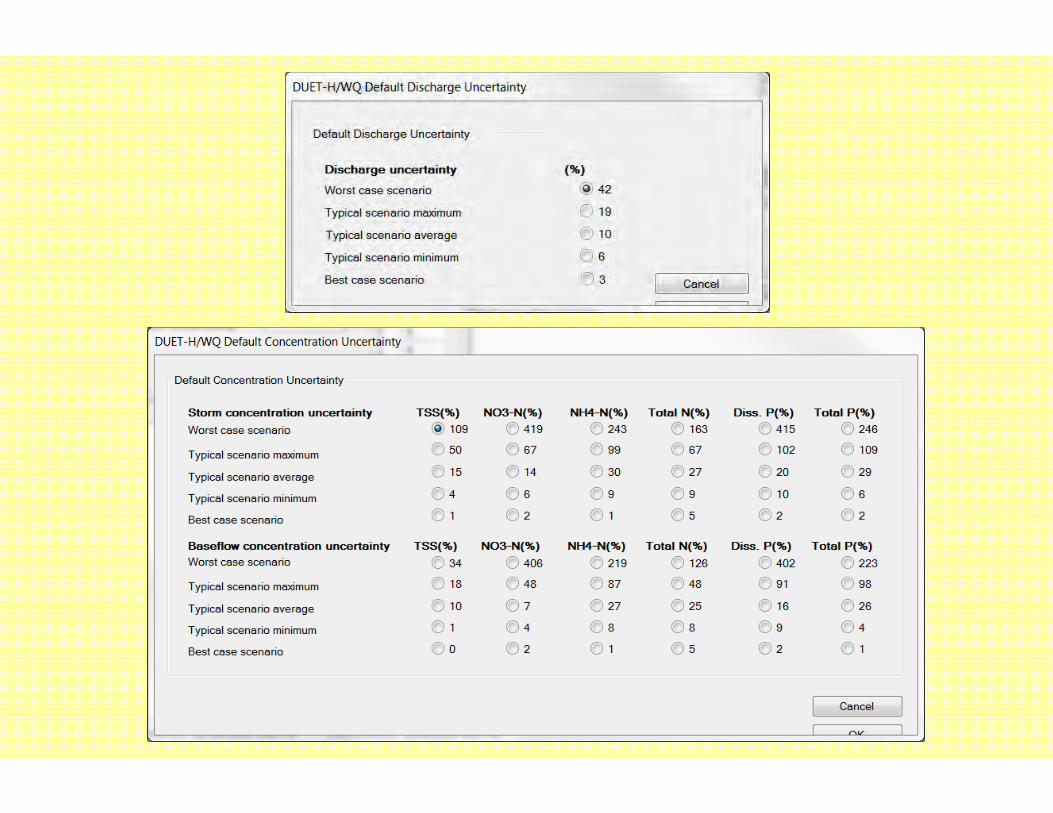
• Developed uncertainty estimation framework (2006)• focused on Q, TSS, N, and P data for small watersheds• listed published uncertainty estimates in 4 categories
• discharge, sample collection, preservation/storage, analysis• analyzed “data quality” scenarios (best, typical, worst)
• compared uncertainty introduced by each procedural category
• calculated cumulative uncertainty in resulting data

Uncertainty in H/WQ Data
• Enhanced uncertainty estimation framework to make more user-friendly (2009)• added “data processing and management” procedural
category


Uncertainty in H/WQ Data

Uncertainty in H/WQ Data
Uncertainty in H/WQ Data
Uncertainty in H/WQ Data

Conclusions
• Uncertainty is almost always ignored in spite of:• numerous pleas for uncertainty analysis• fact that all measurements are inherently uncertain.
• Uncertainty is rarely estimated and included in:• Research and monitoring• Data reporting• Regulation and policy• Model evaluation
• However, the ramifications of decisions based on these data are too great to continue to ignore uncertainty!!!

Conclusions

Any Questions??
Daren Harmel(254) 770-6521
www.ars.usda.gov/spa/hydro-collectionIncludes uncertainty-related pubs (7) and
sampling methods-related pubs (10)
Recommended