0172-6545529 ( O )98141 75200 ( M )
CLIENT :-
Report Prepared by:- Checked by:-
ER. SAURABH KAYSHAP I J GhaiSERVICES PROVIDED : -* Quality Assurance & Quality Control For Highway Projects.** Engineering Surveys, Investigations & Design.
Topographical Surveys using latest equipments.3D View generation.Geometric Design for Highways.Route location studiesCalculation of Quantities of Earth Work,P.C.C.& other layers.Design of Intersections & Junctions.
*** Pre and Post tendering services & Documentation.**** Project Planning & Management.
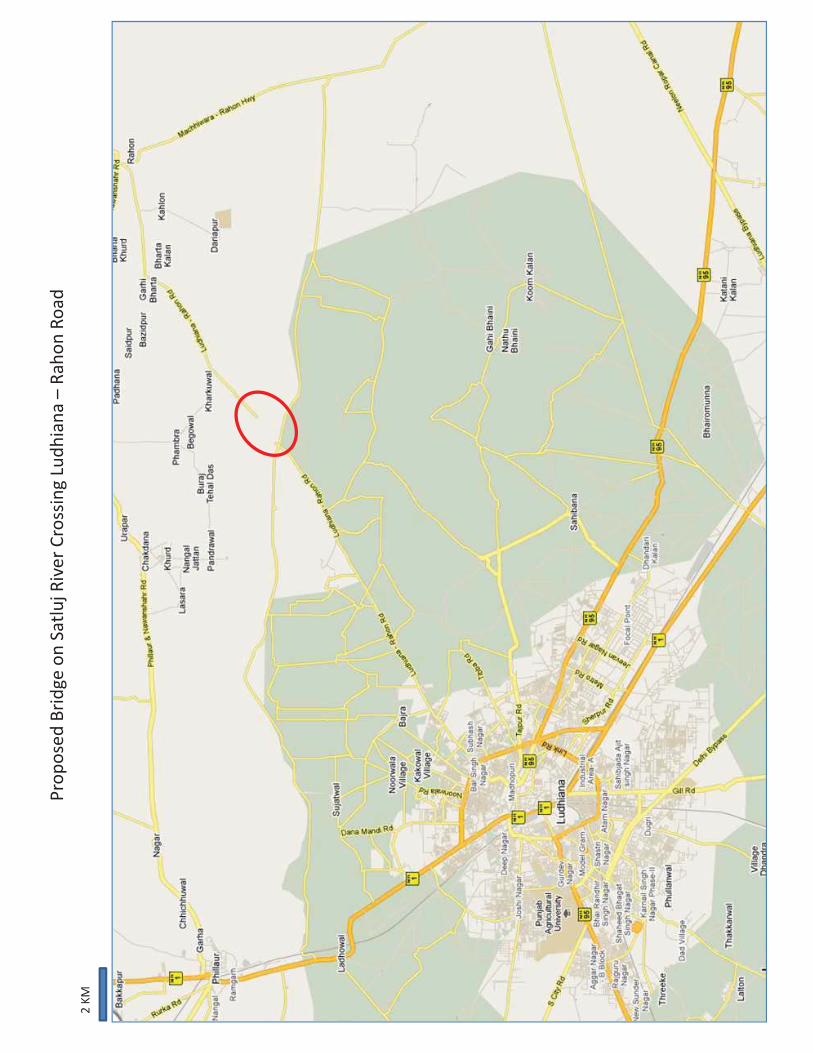
A REPORT ON GEOTECHNICAL INVESTIGATION FOR THE ASSESSMENT OF NET SAFE BEARING CAPACITY FOR THE CONSTRUCTION OF H.L. BRIDGE OVER RIVER SATLUJ
AT MATTEWARA ON LUDHIANA - RAHON ROAD, DISTRICT LUDHIANA, PUNJAB.
EXECUTIVE ENGINEER Pb.PWD (B&R)
LUDHIANA, PUNJAB
Geo-Technical Investigations Report
Consulting Engineers Associates Panchkula.
CLIENT : EXECUTIVE ENGINEER
Pb. PWD (B&R) PUNJAB. JOB & SITE DESCRIPTION : A REPORT ON GEOTECHNICAL
INVESTIGATION FOR THE ASSESSMENT OF NET SAFE BEARING CAPACITY FOR THE CONSTRUCTION OF H.L. BRIDGE OVER RIVER SATLUJ AT MATTEWARA ON LUDHIANA – RAHON ROAD, DISTRICT LUDHIANA, PUNJAB.
Geo-Technical Investigations Report
Consulting Engineers Associates Panchkula.
A REPORT ON GEOTECHNICAL INVESTIGATION FOR THE ASSESSMENT OF NET SAFE BEARING CAPACITY FOR THE CONSTRUCTION OF H.L. BRIDGE OVER RIVER SATLUJ At MATTEWARA.
INTRODUCTION
Foundation engineering is the art of selecting, designing and constructing the element that
transfer the weight of a structure to the underlying soil or rock, to know the nature &
consistency of sub soil or rock geotechnical investigation is required. Knowledge of soil
classification, including typical engineering properties of soil of various groups is especially
valuable for the computation of bearing capacity.
The geotechnical investigation at the said site is a part of the consultancy work awarded to
us by Executive Engineer, Pb. PWD(B&R), PUNJAB for the project work under
consideration. This report contains both field investigation & laboratory test data &
computation of net safe bearing capacity as per IS: 6403 and from settlement criteria.
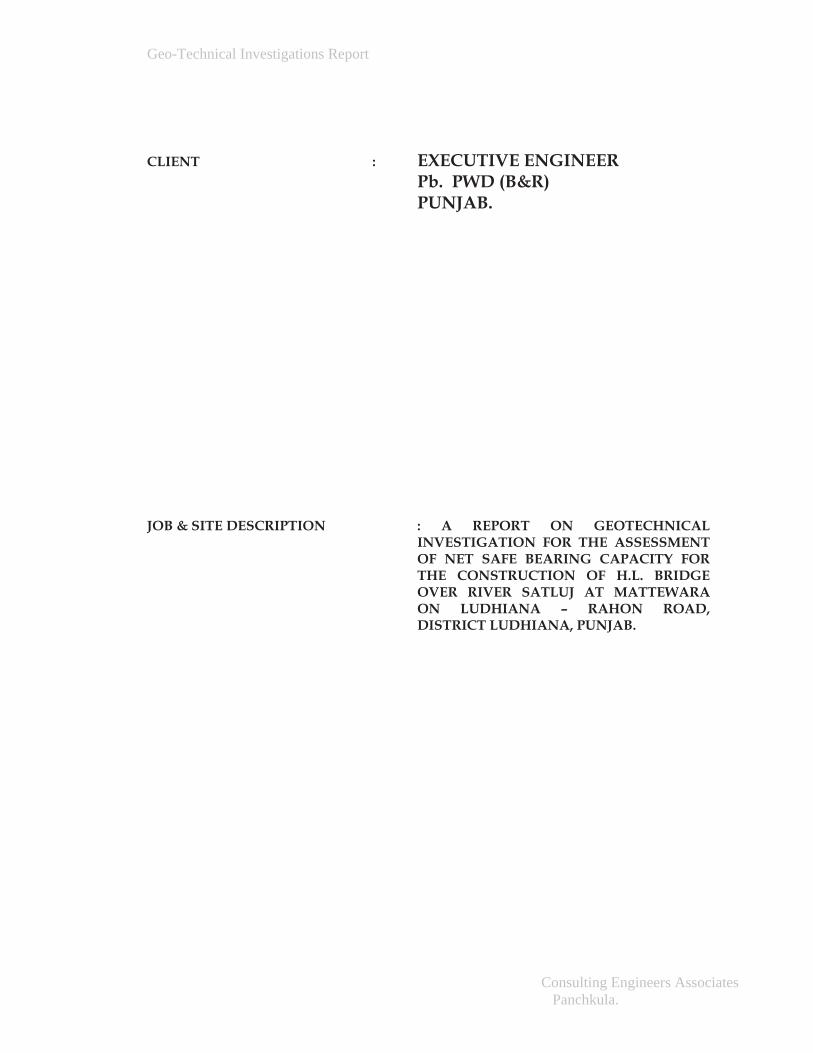
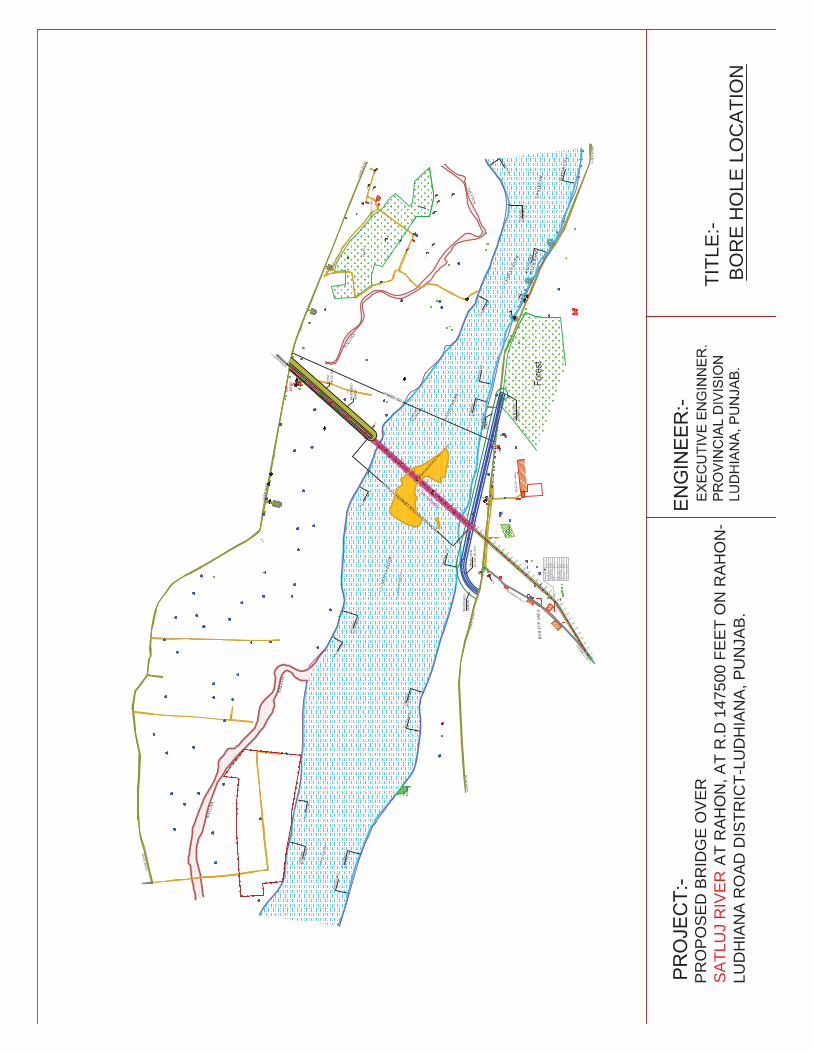
SITE
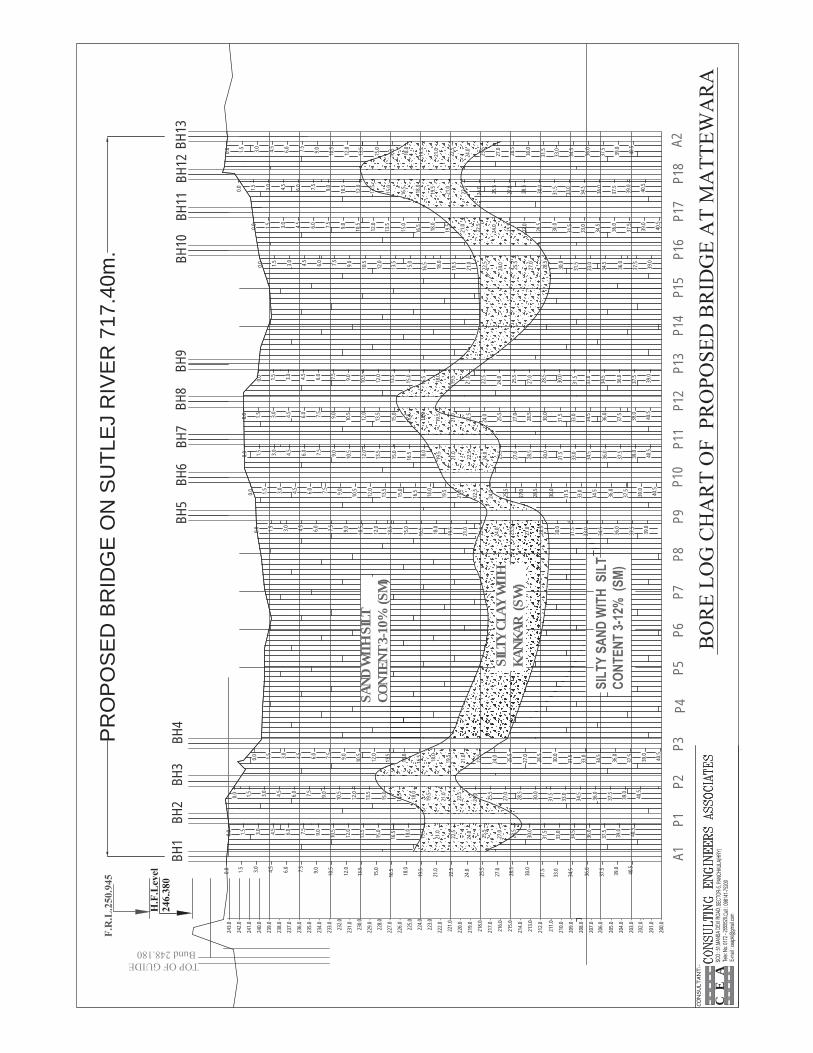
The site plan showing the bore hole locations is attached with this report.
SCOPE OF WORK
The investigation program was divided into two parts namely, field investigations &
laboratory testing.
(a) Field investigations include following parameters (IS:2131)
(i) Boring 200mm dia bore up to 40.5 meter depth or refusal which ever occurs
earlier from river bed level.
(ii) Conducting standard penetration test at every 1.5 meter depth interval.
(iii) Collection of both disturbed & undisturbed soil samples from various depth &
their testing in the laboratory.
(b) Laboratory tests includes following characteristics (IS:2720 relevant parts)
(i) Indian soil classifications
(ii) Natural moisture content
(iii) Composition
(iv) Liquid limit
(v) Plasticity Index
(vi) Shear parameters (Direct shear test method)
(vii) Sieve analysis of non-plastic gravelly samples.
Geo-Technical Investigations Report
Consulting Engineers Associates Panchkula.
TEST PROCEDURE
This test was conducted as per IS: 2131 – 1981.Machine boring using 200mm dia boring
equipment was employed. As boring progressed, N-values representing the number of
blows of a 63.5 Kg. Standard hammer falling through a height of 75cm required to drive
standard split spoon sample 30cm into sub soil were recorded at every 1.5 mtr, depth
interval up-to the explored depth i.e. up to 40.5 mtr, depth from existing river bed level.
Soil samples, both undisturbed & disturbed, removed from various depths were brought to
the laboratory duly sealed for necessary tests such as natural moisture content, composition,
Atterberg’s limits, proctor density, optimum moisture content, field bulk & dry density,
specific gravity , unconfined compressive strength, tri axial test consolidation test etc. All
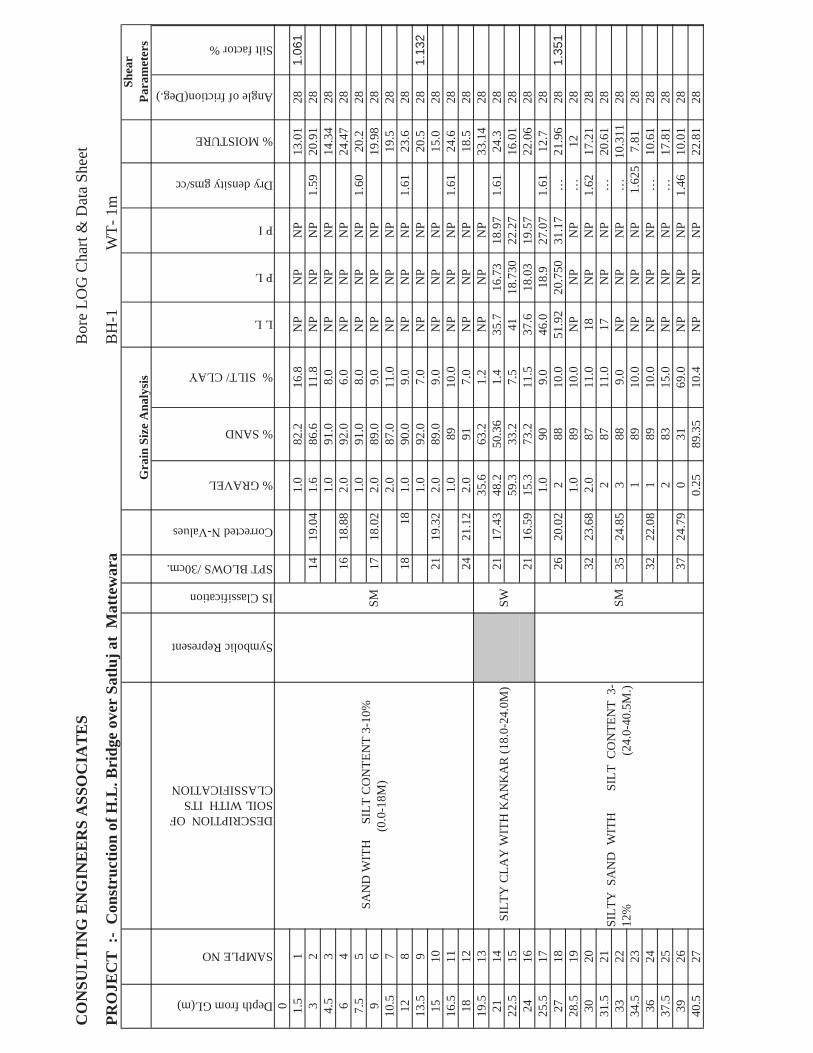
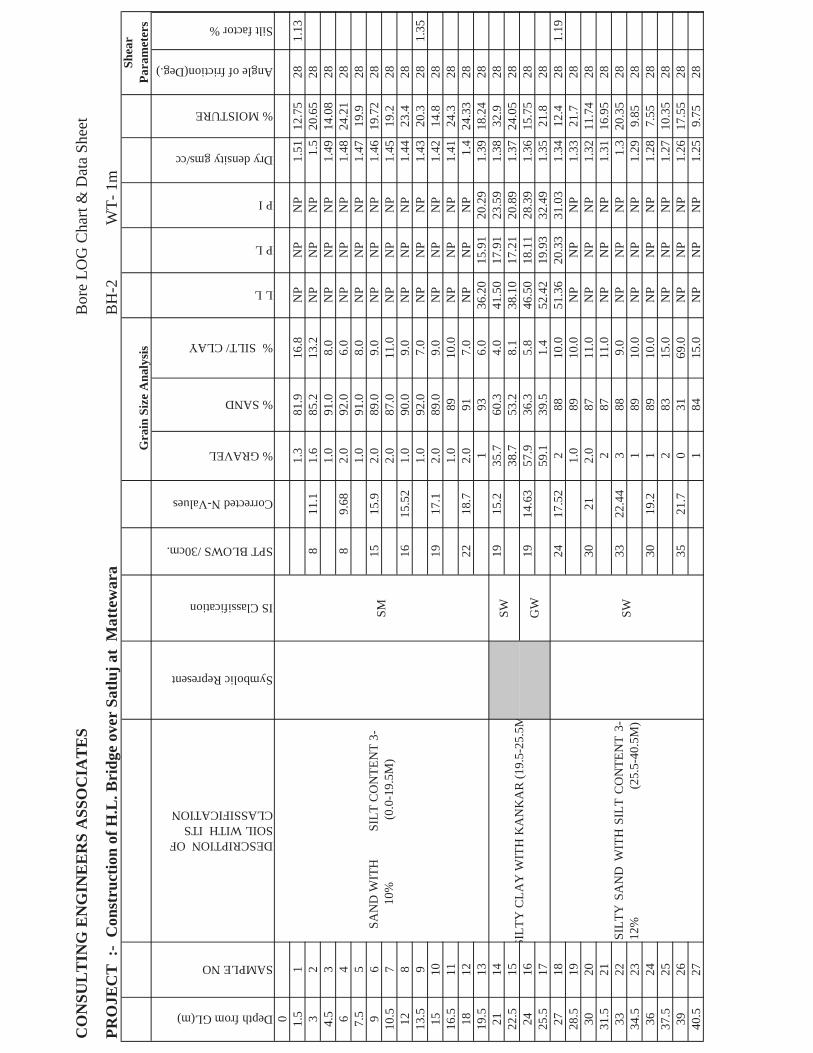
laboratory tests were conducted as per IS: 2720 (relevant parts) Results of all these tests, soil
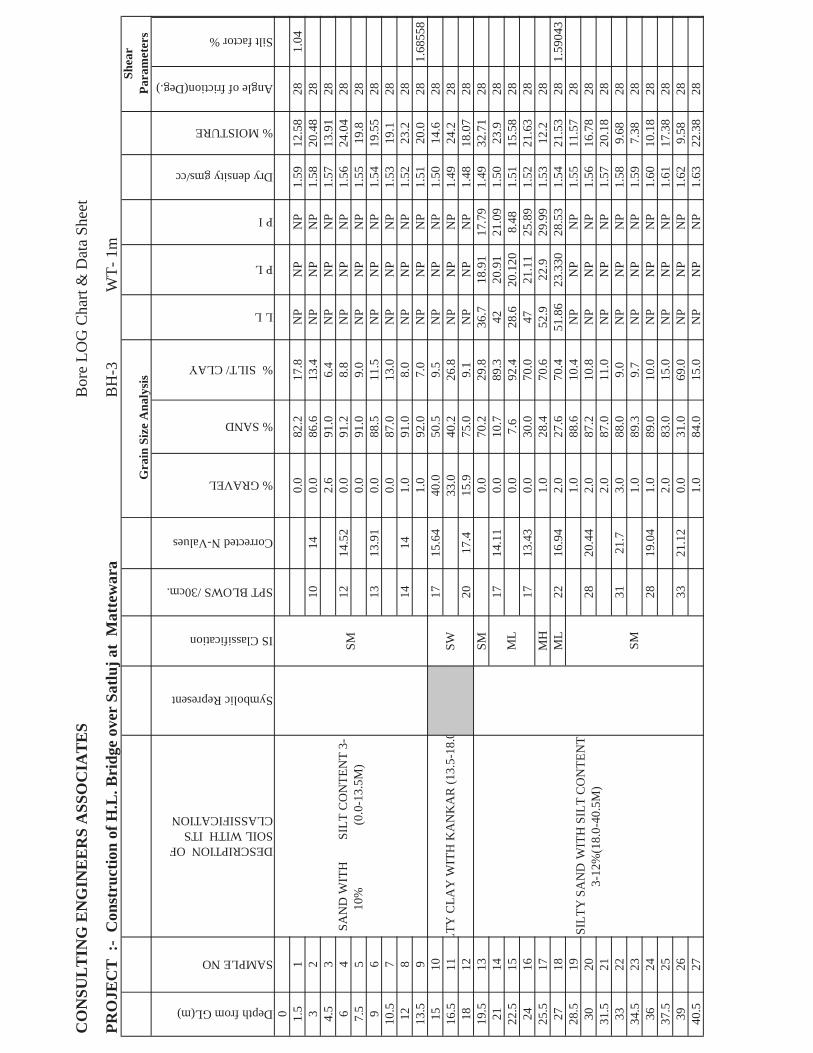
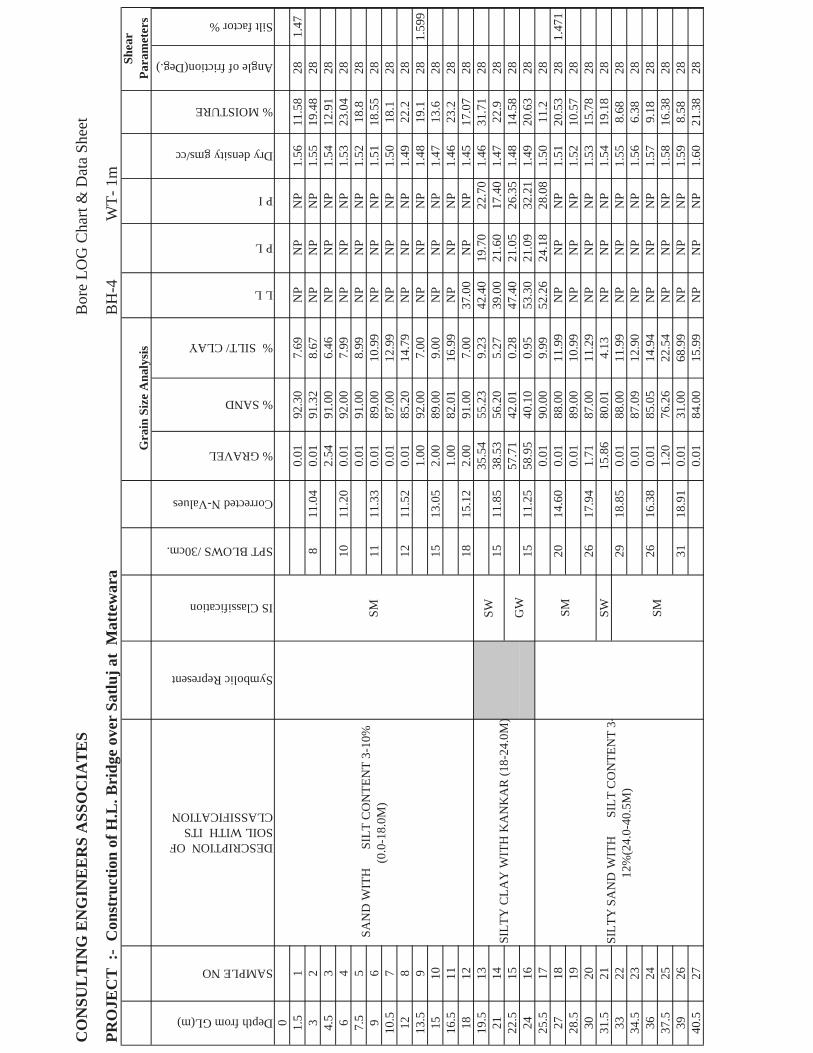
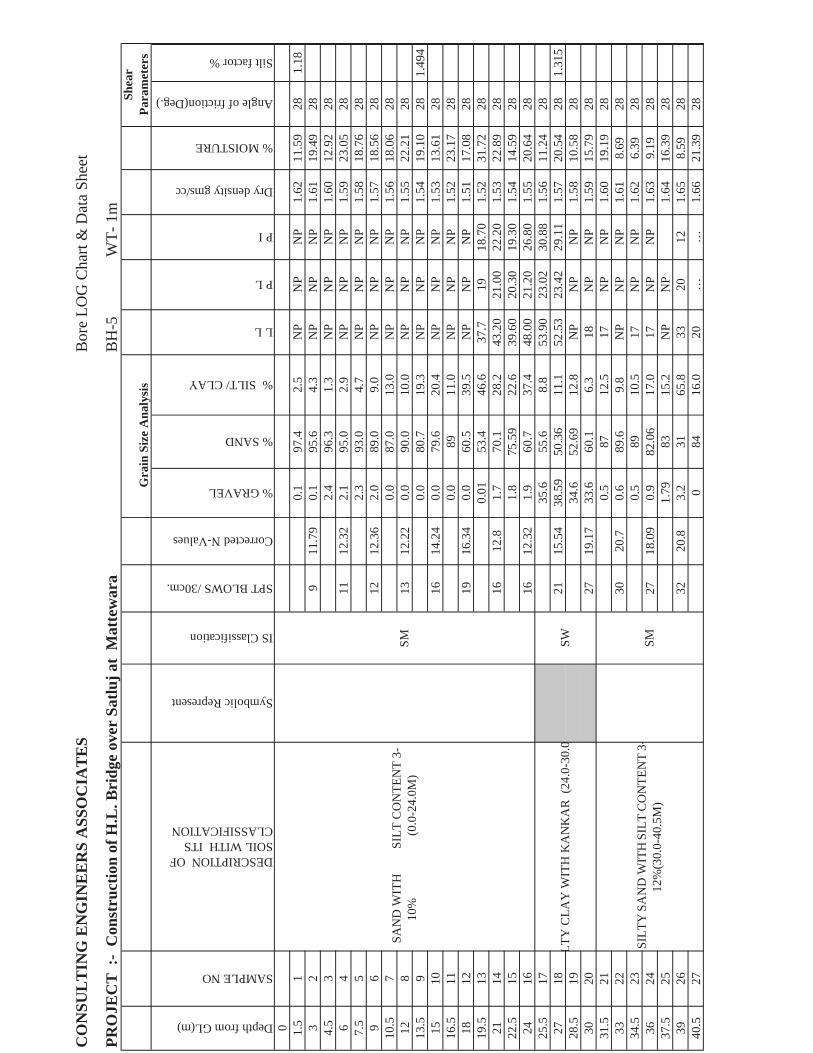
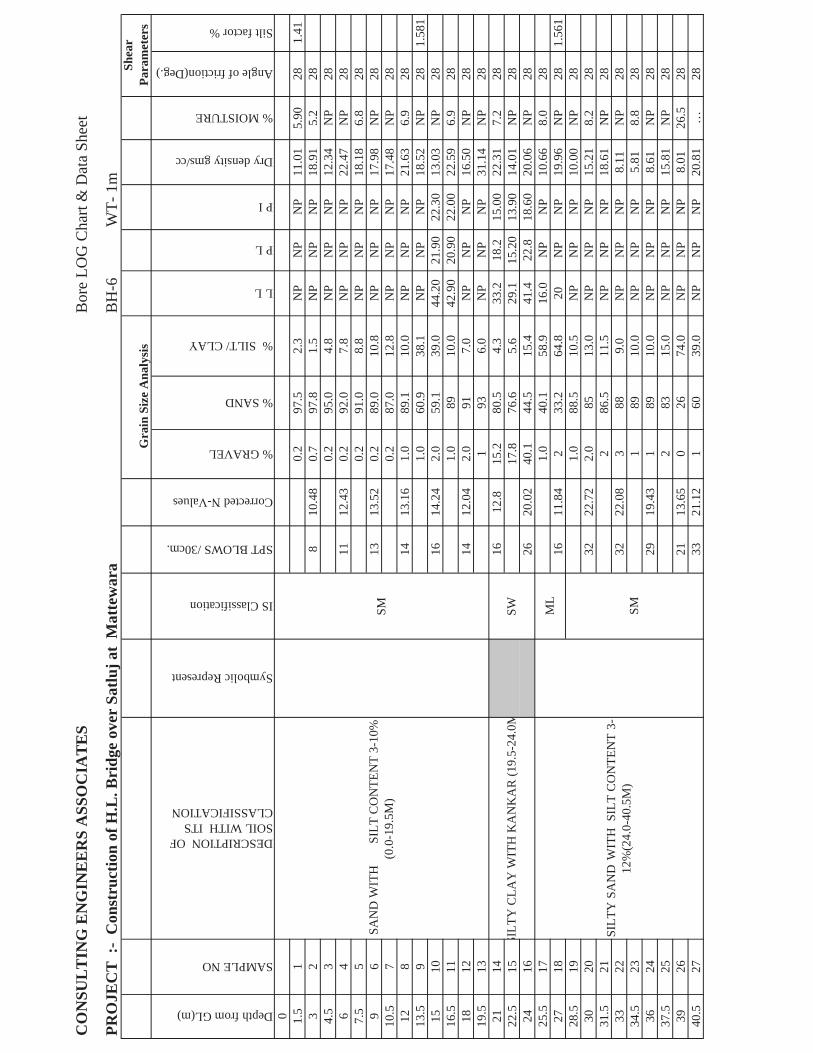
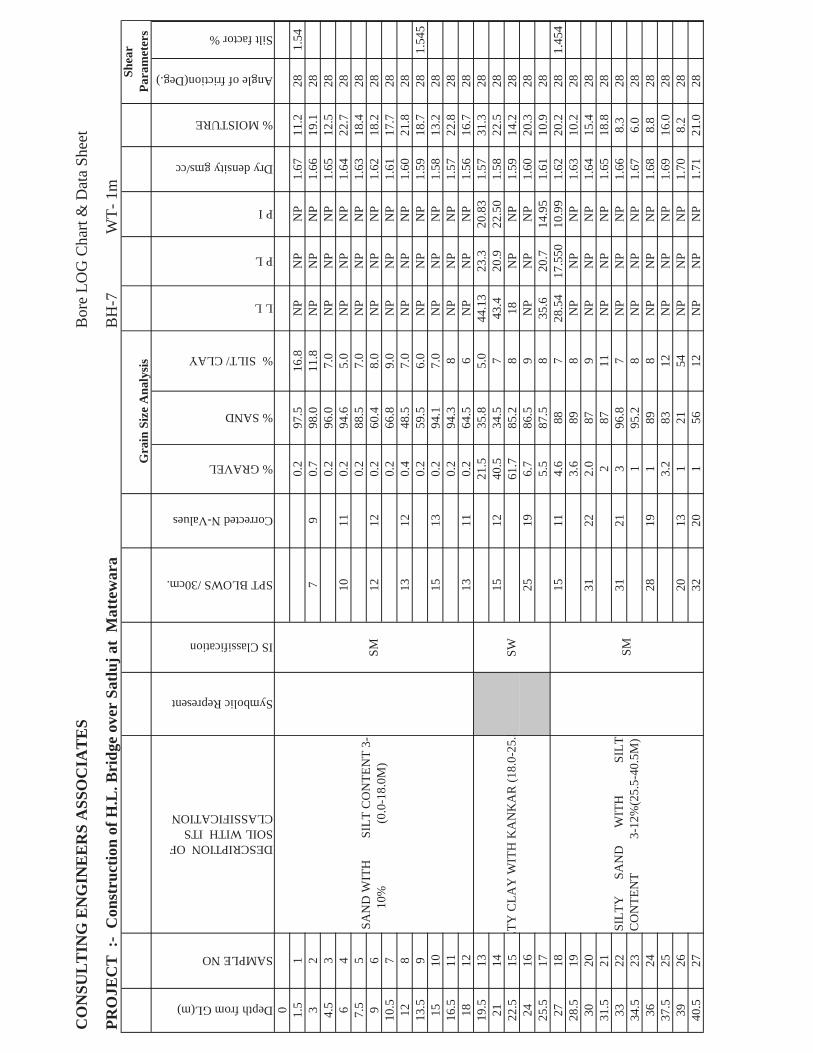
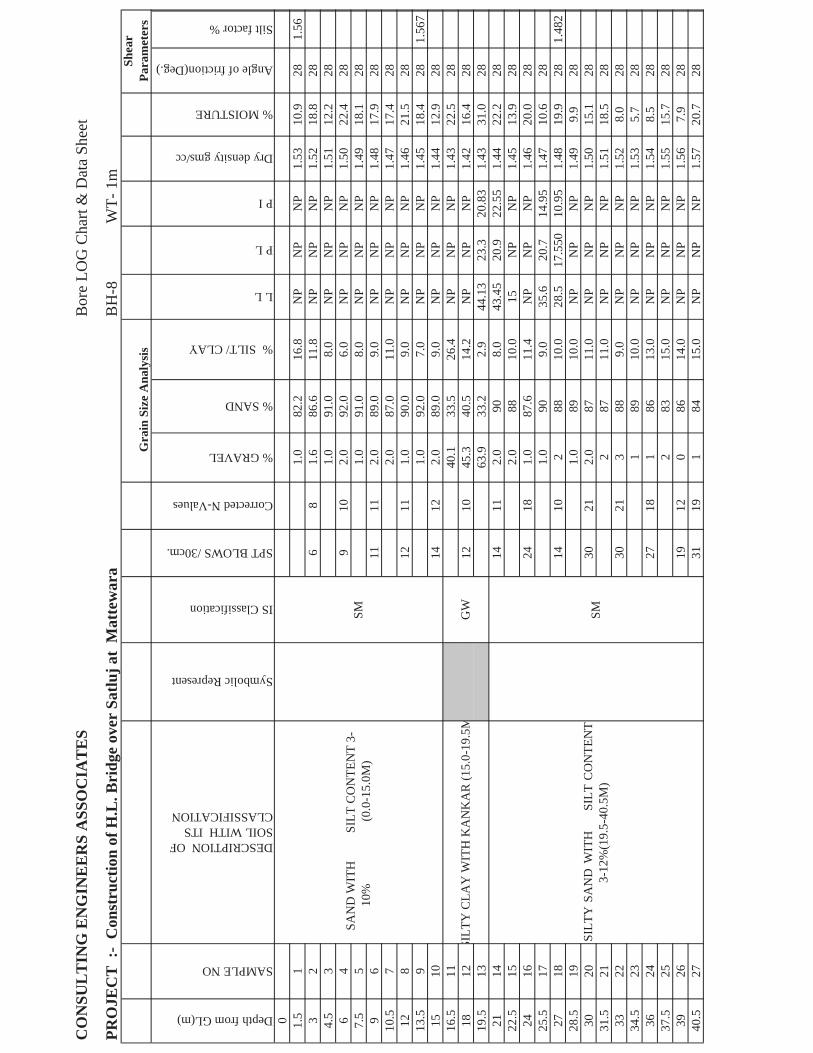
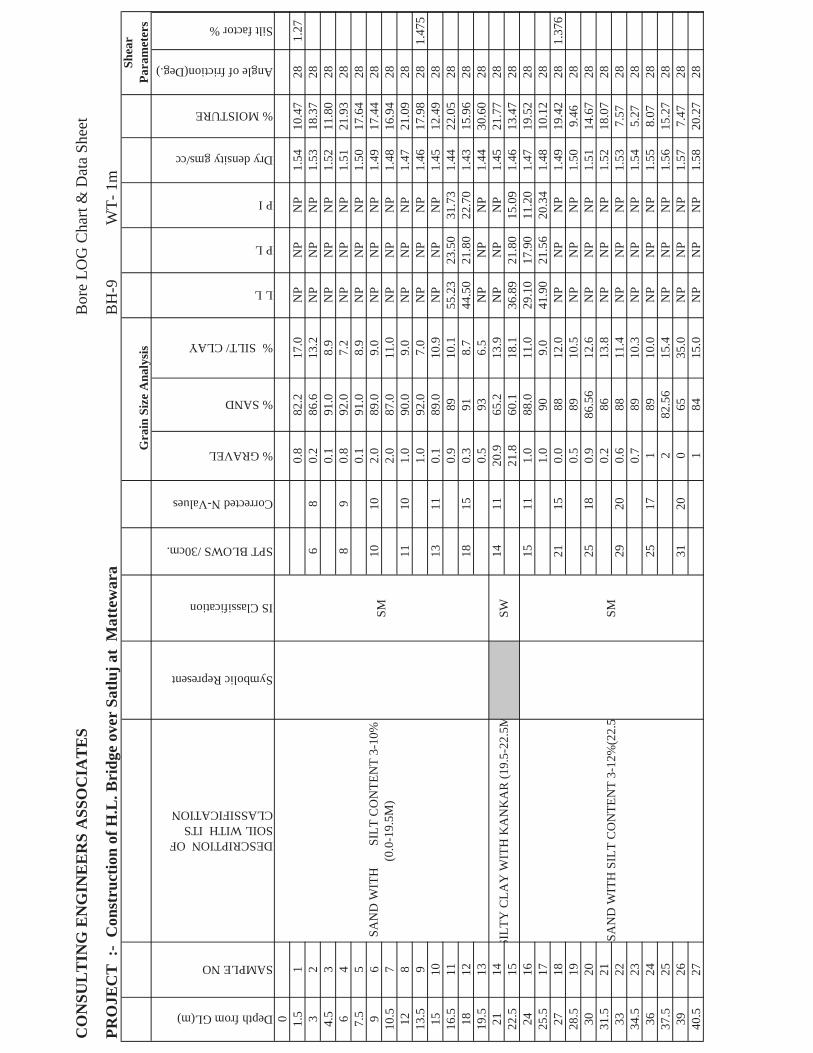
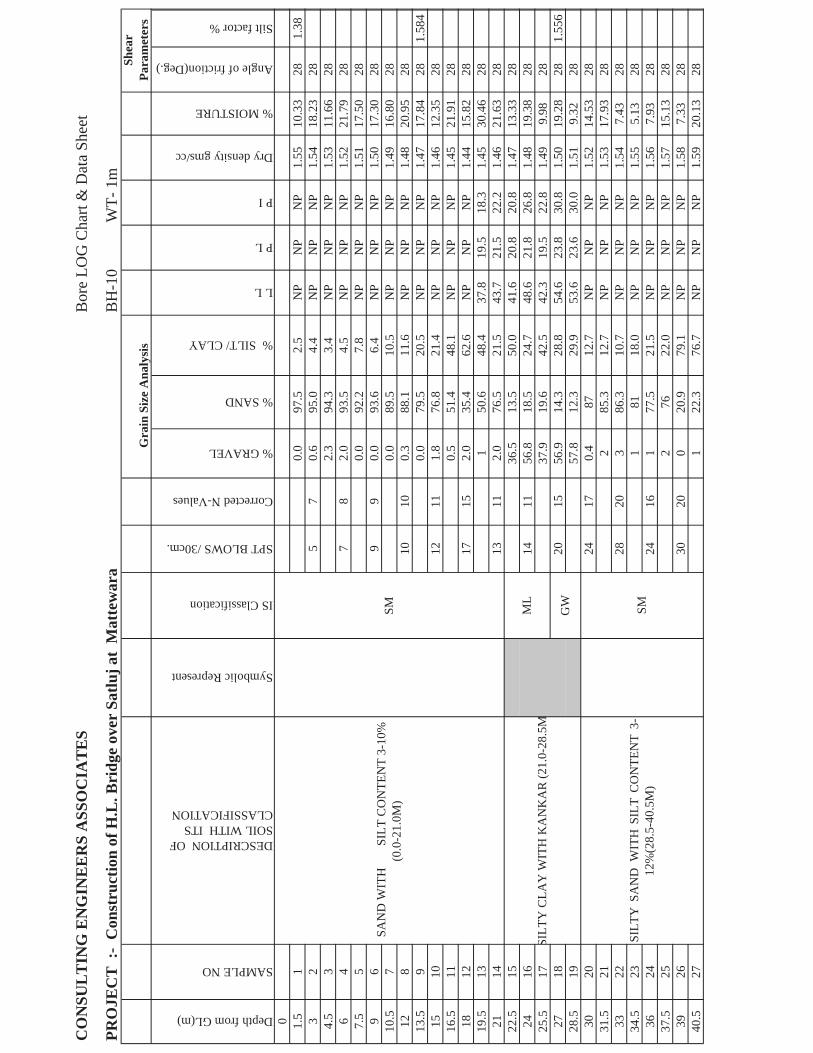
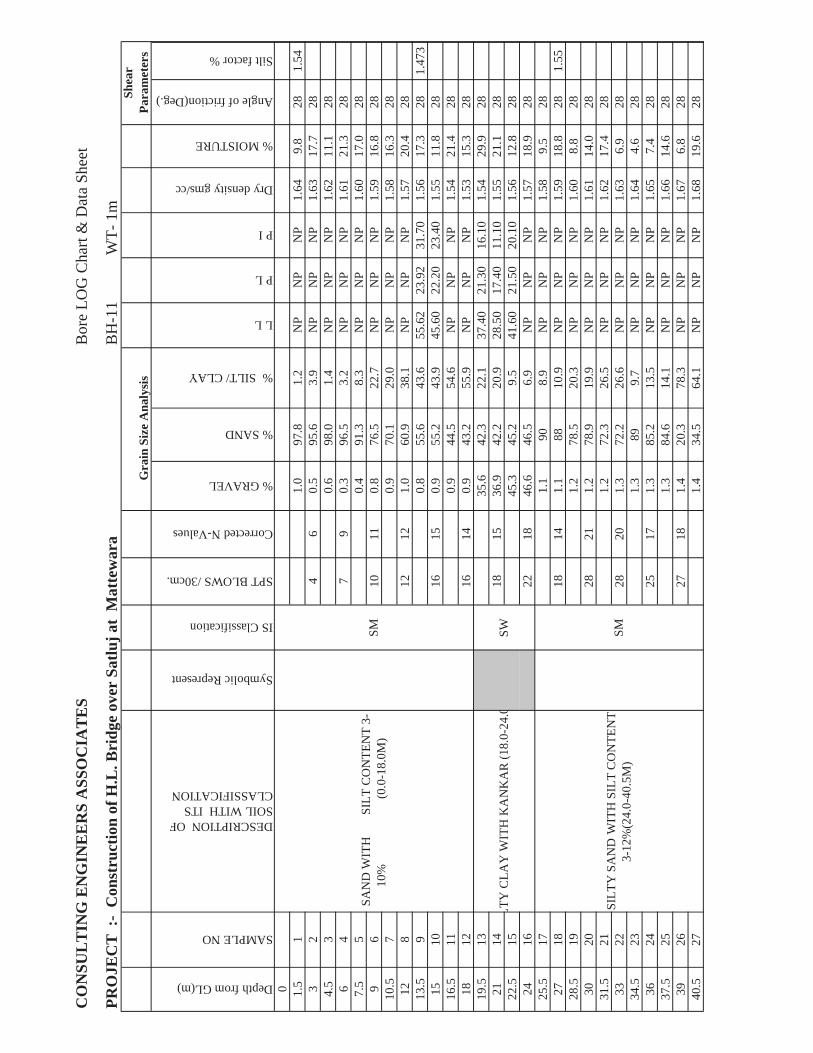
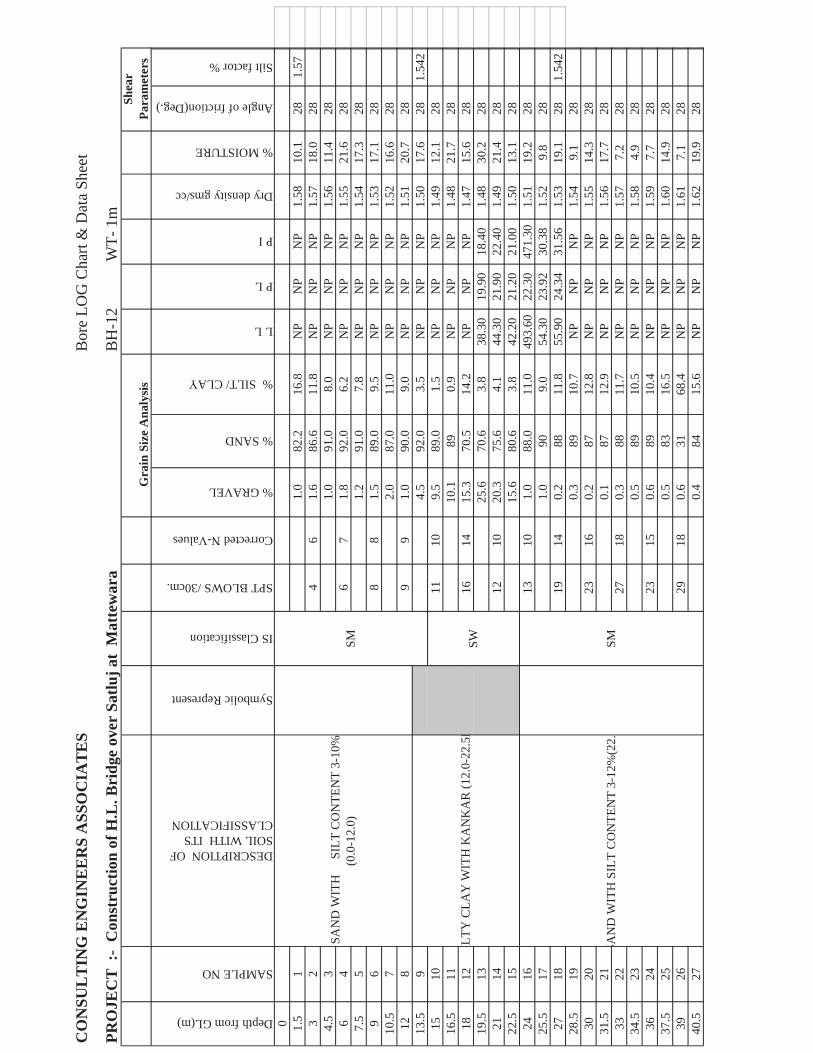
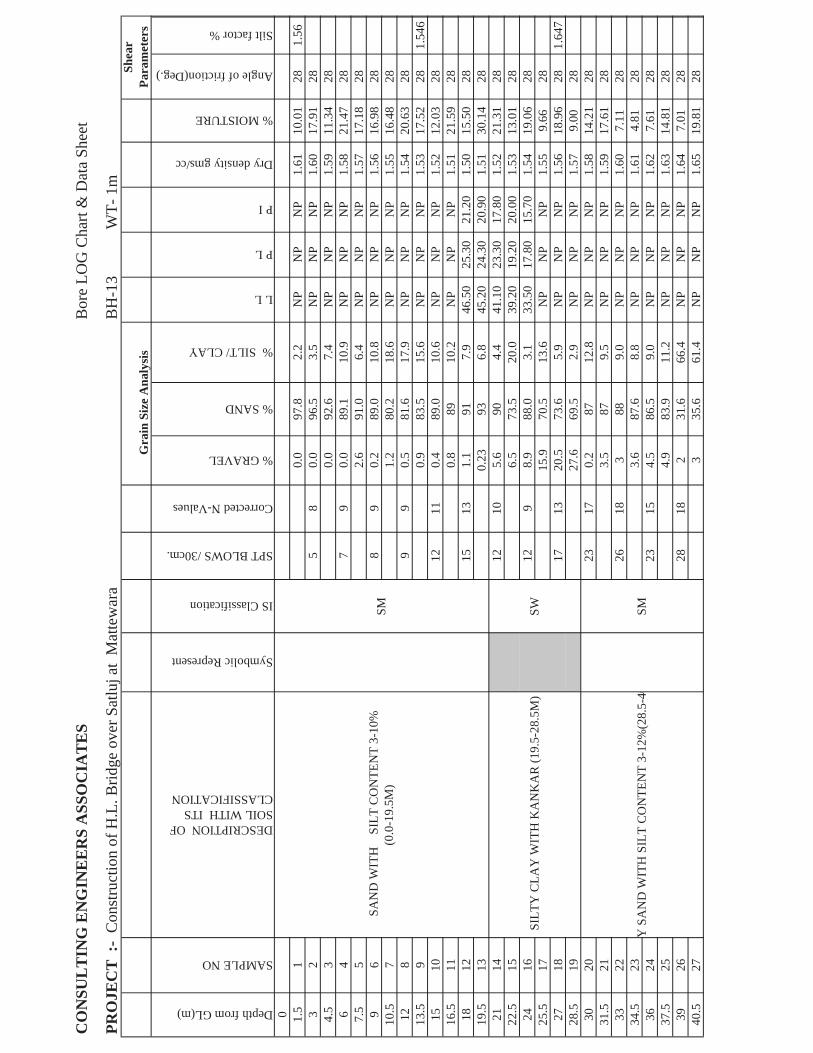
composition & its Indian classification including N-value at various depth and bore log
charts are shown in figures. The N-Values have been corrected for dilatancy and over
burden etc is shown in tables attached. Locations and details of strata of Bore Holes have
been shown on separate sheets attached.
The gradation of coarse fraction after removing more than 40mm gravel, along with silt
factor is shown in tables.
GENERAL OBSERVATIONS
1. The site under investigation is a river bed and the area falls under seismic zone IV as per
Indian seismic code IS:1893
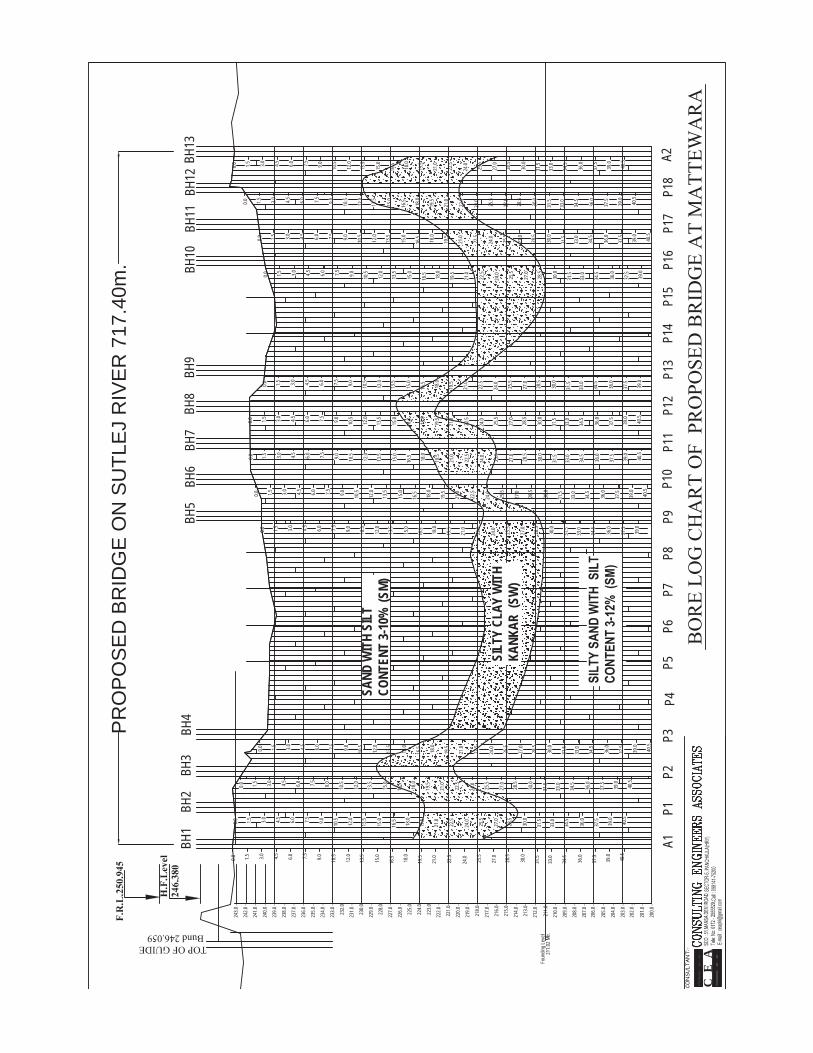
2. The strata comprise of Sand with Silt Content 3-10%, Silty Clay with Kankar and at
bottom Silty Sand with Silt Content 3-12% deposits. The stratum is shown
pictographically in the bore log charts attached with this report.
3. Water table was encountered in all bore holes at a varying depth of 1.0 to 4.0m from
river average bed level.
4. The field bulk density was average 1.76 gm/cc.
5. Shear parameters determined by direct shear test which works out to C= 0 average
value=28.20.
Geo-Technical Investigations Report
Consulting Engineers Associates Panchkula.
COMPUTATION OF BEARING CAPACITY
1. Bearing Capacity From Shear Failure Consideration(Under the PIER):
The net ultimate bearing capacity is calculated from following formula as per IS: 6403-1981.
qd = q(Nq-1)Sq dq + 0.5 B Y N S d W’
Where: qd = Net ultimate bearing capacity,
c = Cohesion,
= angle of shear resistance
q = Effective surcharge,
B = Width of Footing,
Y = Density,
Nc, Nq, N = Bearing capacity factors, local shear failure.
Sc, Sq, S = Shape factors
dc, dq, d = Depth factors
W’ = Water table factor
value corresponding to Average N=20 is 330
For worst case of punching shear failure.
For =33 0, ‘= tan-1(2/3 tan 330) =23.40
C = 0
Consider case of Intermediate shear failure.
Adopt average value of = 28.20
Effective Depth of Well = 12m
Dia. of the Well = 7m.
Relevant bearing capacity factors for local shear failure are:
N’q = 15.61, N’ = 18.25
Y = 1.76 g/cm3
Submerged unit weight Y’ = .76g/cm3
For circular footing,.
Sq = 1.2 and S = 0.6
W’ = 0.5
Df = 12 m B = 7.0 m
dq = d = 1+ 0.1 Df tan (45+ /2) = 1.29 B qd = 249.19 t/m2
Geo-Technical Investigations Report
Consulting Engineers Associates Panchkula.
With F.O.S. = 3.
qnet safe = 249.19 /3 t/m2 = 83.06 t/m2
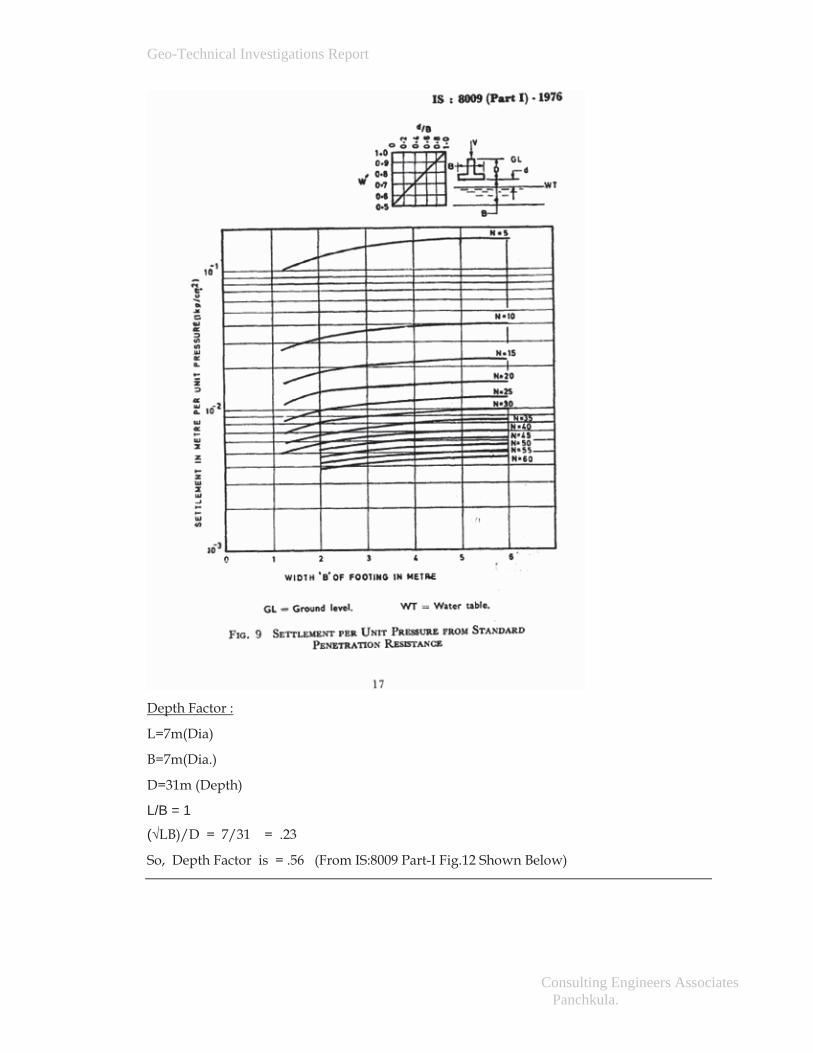
2. Bearing Pressure from Settlement Considerations(S= 75mm).
SPT N Value = 20.
L=7m, B = 7m, D= 31m (Actual Depth).
Settlement per Kg/cm2 = 1.75 x 10 -2 m = 17.5 X 10 -3 m = 17.5 mm.
(By Interpolating the Curve From IS: 8009 Part I Fig.9 Shown Below)
i.e. Settlement per 10 t/m2 = 17.5 mm.
So, for 75mm Settlement, the Load = 10 X 75 / 17.5 t/m2 = 42.857 t/m2.
{75 mm is the Total Permissible Settlement for Sand and Hard Clay in Raft Foundations, i.e.
Well Foundations According to National Building Code of India.}
Geo-Technical Investigations Report
Consulting Engineers Associates Panchkula.
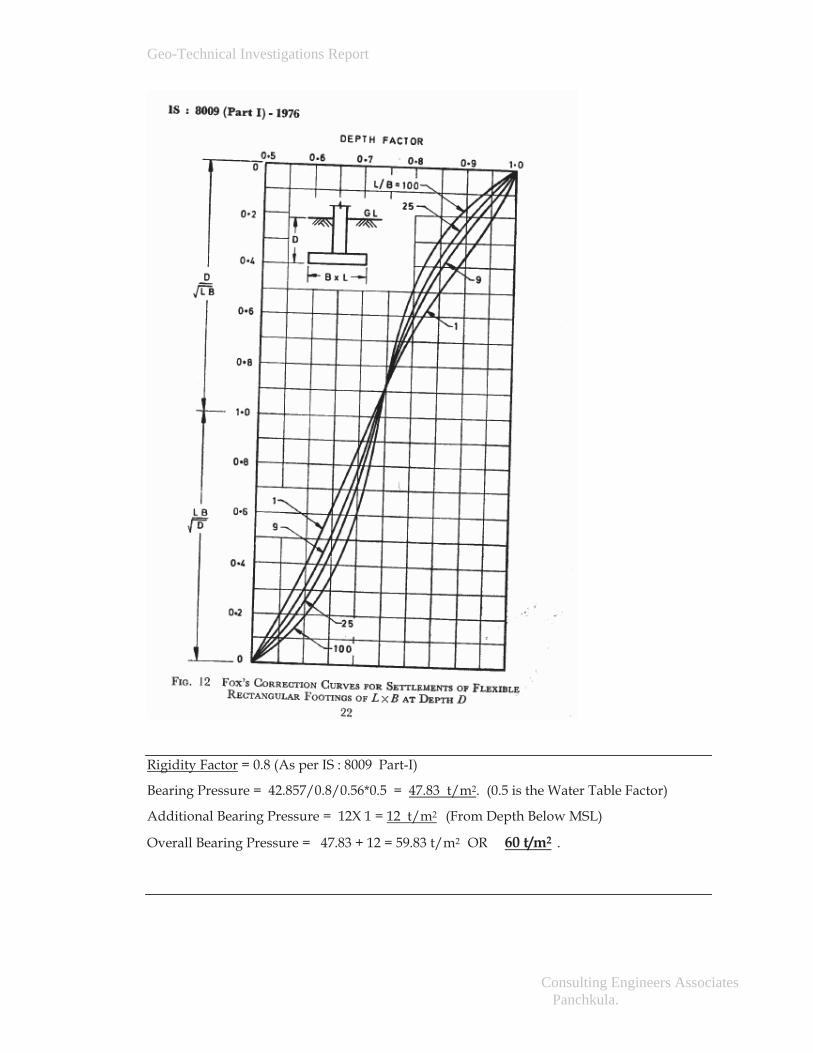
Depth Factor :
L=7m(Dia)
B=7m(Dia.)
D=31m (Depth)
L/B = 1
( LB)/D = 7/31 = .23
So, Depth Factor is = .56 (From IS:8009 Part-I Fig.12 Shown Below)
Geo-Technical Investigations Report
Consulting Engineers Associates Panchkula.
Rigidity Factor = 0.8 (As per IS : 8009 Part-I)
Bearing Pressure = 42.857/0.8/0.56*0.5 = 47.83 t/m2. (0.5 is the Water Table Factor)
Additional Bearing Pressure = 12X 1 = 12 t/m2 (From Depth Below MSL)
Overall Bearing Pressure = 47.83 + 12 = 59.83 t/m2 OR 60 t/m2 .
Geo-Technical Investigations Report
Consulting Engineers Associates Panchkula.
Recommendations
The Recommended Bearing Capacity of Well Foundation at founding level = 60 t/m2
For Consulting Engineers Associates
(Er. I.J. Ghai)
A REPORT ON GEOTECHNICAL INVESTIGATION FOR THE
ASSESSMENT OF NET SAFE BEARING CAPACITY FOR THE
CONSTRUCTION OF H.L. BRIDGE OVER RIVER SATLUJ AT
MATTEWARA ON LUDHIANA - RAHON ROAD, DISTRICT
LUDHIANA, PUNJAB.
PR
OP
OS
ED
BR
IDG
E O
N S
UTL
EJ
RIV
ER
717
.40m
.
A1P1
P2P3
P4P5
P6P7
P8P9
P10
P11
P12
P13
P14
P15
P16
P17
P18
A2
234.0
-
235.0
-
236.0
-
237.0
-
238.0
-
239.0
-
240.0
-
241.0
-
242.0
-
243.0
-
224.0
225.0
226.0
-
227.0
-
228.0
229.0
-
230.0
231.0
-
232.0
233.0
-
215.0
-
216.0
-
217.0
-
218.0
-
219.0
-
220.0
-
221.0
-
222.0
-
223.0
206.0
-20
7.0 -
208.0
-
209.0
-
210.0
-
211.0
-
212.0
-
213.0
-
214.0
-
202.0
-20
3.0 -
204.0
-
205.0
-
200.0
-
201.0
-.
BH1
BH2
BH3
BH4
BH5
BH6
BH8
BH11
BH12
BH13
BH7
BH9
BH10
0.0 1.5 3.0 4.5 6.0 7.5 9.0 10.5
12.0
13.5
15.0
16.5 18.0
19.5
21.0
22.5
24.0 25.5
27.0
28.5
30.0
31.5
33.0
34.5
36.0
37.5
39.0
40.5
0.0 1.5 3.0 4.5 6.0 7.5 9.0 10.5
12.0
13.5
15.0
16.5 18.0
19.5
21.0
22.5
24.0 25.5
27.0
28.5
30.0
31.5
33.0
34.5
36.0
37.5
39.0
40.5
0.0 1.5 3.0 4.5 6.0 7.5 9.0 10.5
12.0
13.5
15.0
16.5 18.0
19.5
21.0
22.5
24.0 25.5
27.0
28.5
30.0
31.5
33.0
34.5
36.0
37.5
39.0
40.5
0.0 1.5 3.0 4.5 6.0 7.5 9.0 10.5
12.0
13.5
15.0
16.5 18.0
19.5
21.0
22.5
24.0 25.5
27.0
28.5
30.0
31.5
33.0
34.5
36.0
37.5
39.0
40.5
0.0 1.5 3.0 4.5 6.0 7.5 9.0 10.5
12.0
13.5
15.0
16.5 18.0
19.5
21.0
22.5
24.0 25.5
27.0
28.5
30.0
31.5
33.0
34.5
36.0
37.5
39.0
0.0 1.5 3.0 4.5 6.0 7.5 9.0 10.5
12.0
13.5
15.0
16.5 18.0
19.5
21.0
22.5
24.0 25.5
27.0
28.5
30.0
31.5
33.0
34.5
36.0
37.5
39.0
40.5
0.0 1.5 3.0 4.5 6.0 7.5 9.0 10.5
12.0
13.5
15.0
16.5 18.0
19.5
21.0
22.5
24.0 25.5
27.0
28.5
30.0
31.5
33.0
34.5
36.0
37.5
39.0
40.5
0.0 1.5 3.0 4.5 6.0 7.5 9.0 10.5
12.0
13.5
15.0
16.5 18.0
19.5
21.0
22.5
24.0 25.5
27.0
28.5
30.0
31.5
33.0
34.5
36.0
37.5
39.0
40.5
0.0 1.5 3.0 4.5 6.0 7.5 9.0 10.5
12.0
13.5
15.0
16.5 18.0
19.5
21.0
22.5
24.0 25.5
27.0
28.5
30.0
31.5
33.0
34.5
36.0
37.5
39.0
0.0 1.5 3.0 4.5 6.0 7.5 9.0 10.5
12.0
13.5
15.0
16.5 18.0
19.5
21.0
22.5
24.0 25.5
27.0
28.5
30.0
31.5
33.0
34.5
36.0
37.5
39.0
0.0 1.5 3.0 4.5 6.0 7.5 9.0 10.5
12.0
13.5
15.0
16.5 18.0
19.5
21.0
22.5
24.0 25.5
28.5
30.0
31.5
33.0
34.5
36.0
37.5
39.0
40.5
0.0 1.5 3.0 4.5 6.0 7.5 9.0 10.5
12.0
13.5
15.0
16.5 18.0
19.5
21.0
22.5
30.0
31.5
33.0
34.5
36.0
37.5
39.0
40.5
0.0 1.5 3.0 4.5 6.0 7.5 9.0 10.5
12.0
13.5
15.0
16.5 18.0
19.5
21.0
22.5
24.0 25.5
27.0
28.5
30.0
31.5
33.0
34.5
36.0
37.5
39.0
40.5
27.0
SAND
WIT
H SI
LTCO
NTEN
T 3-
10%
(SM
)
SILT
Y CL
AY W
ITH
KANK
AR (
SW)
24.0 25.5
27.0
28.5
C E
A
CONSU
LTANT:-
Foun
ding L
evel
211.0
2 Mtr.
BH1
BH4
PR
OP
OS
ED
BR
IDG
E O
VE
RS
ATL
UJ
RIV
ER
AT
RA
HO
N, A
T R
.D 1
4750
0 FE
ET
ON
RA
HO
N-
LUD
HIA
NA
RO
AD
DIS
TRIC
T-LU
DH
IAN
A, P
UN
JAB
.TI
TLE
:-B
OR
E H
OLE
LO
CA
TIO
N
CO
NSU
LT
ING
EN
GIN
EE
RS
ASS
OC
IAT
ES
Bor
e LO
G C
hart
& D
ata
Shee
t
PRO
JEC
T :
- C
onst
ruct
ion
of H
.L. B
ridg
e ov
er S
atlu
j at
Mat
tew
ara
BH
-1W
T- 1
m
Depth from GL(m)
SAMPLE NO
DESCRIPTION OF SOIL WITH ITS CLASSIFICATION
Symbolic Represent
IS Classification
SPT BLOWS /30cm.
Corrected N-Values
% GRAVEL
% SAND
% SILT/ CLAY
L L
P L
P I
Dry density gms/cc
% MOISTURE
Angle of friction(Deg.)
Silt factor %
0 1.5
11.
082
.216
.8N
PN
PN
P13
.01
281.
061
32
1419
.04
1.6
86.6
11.8
NP
NP
NP
1.59
20.9
128
4.5
31.
091
.08.
0N
PN
PN
P14
.34
286
416
18.8
82.
092
.06.
0N
PN
PN
P24
.47
287.
55
1.0
91.0
8.0
NP
NP
NP
1.60
20.2
289
617
18.0
22.
089
.09.
0N
PN
PN
P19
.98
2810
.57
2.0
87.0
11.0
NP
NP
NP
19.5
2812
818
181.
090
.09.
0N
PN
PN
P1.
6123
.628
13.5
91.
092
.07.
0N
PN
PN
P20
.528
1.13
215
1021
19.3
22.
089
.09.
0N
PN
PN
P15
.028
16.5
111.
089
10.0
NP
NP
NP
1.61
24.6
2818
1224
21.1
22.
091
7.0
NP
NP
NP
18.5
2819
.513
35.6
63.2
1.2
NP
NP
NP
33.1
428
2114
2117
.43
48.2
50.3
61.
435
.716
.73
18.9
71.
6124
.328
22.5
1559
.333
.27.
541
18.7
3022
.27
16.0
128
2416
2116
.59
15.3
73.2
11.5
37.6
18.0
319
.57
22.0
628
25.5
171.
090
9.0
46.0
18.9
27.0
71.
6112
.728
2718
2620
.02
288
10.0
51.9
220
.750
31.1
7…
21.9
628
1.35
128
.519
1.0
8910
.0N
PN
PN
P…
1228
3020
3223
.68
2.0
8711
.018
NP
NP
1.62
17.2
128
31.5
212
8711
.017
NP
NP
…20
.61
2833
2235
24.8
53
889.
0N
PN
PN
P…
10.3
1128
34.5
231
8910
.0N
PN
PN
P1.
625
7.81
2836
2432
22.0
81
8910
.0N
PN
PN
P…
10.6
128
37.5
252
8315
.0N
PN
PN
P…
17.8
128
3926
3724
.79
031
69.0
NP
NP
NP
1.46
10.0
128
40.5
270.
2589
.35
10.4
NP
NP
NP
22.8
128
SILT
Y C
LAY
WIT
H K
AN
KA
R (1
8.0-
24.0
M)
SILT
YSA
ND
WIT
HSI
LTC
ON
TEN
T3-
12%
(24.
0-40
.5M
.)
SAN
D W
ITH
S
ILT
CO
NTE
NT
3-10
%(0
.0-1
8M)
Shea
rPa
ram
eter
sG
rain
Siz
e A
naly
sis
SM SMSW
CO
NSU
LT
ING
EN
GIN
EE
RS
ASS
OC
IAT
ES
Bor
e LO
G C
hart
& D
ata
Shee
t
PRO
JEC
T :
- C
onst
ruct
ion
of H
.L. B
ridg
e ov
er S
atlu
j at
Mat
tew
ara
BH
-2W
T- 1
m
Depth from GL(m)
SAMPLE NO
DESCRIPTION OF SOIL WITH ITS CLASSIFICATION
Symbolic Represent
IS Classification
SPT BLOWS /30cm.
Corrected N-Values
% GRAVEL
% SAND
% SILT/ CLAY
L L
P L
P I
Dry density gms/cc
% MOISTURE
Angle of friction(Deg.)
Silt factor %
0 1.5
11.
381
.916
.8N
PN
PN
P1.
5112
.75
281.
133
28
11.1
1.6
85.2
13.2
NP
NP
NP
1.5
20.6
528
4.5
3
1.0
91.0
8.0
NP
NP
NP
1.49
14.0
828
64
89.
682.
092
.06.
0N
PN
PN
P1.
4824
.21
287.
55
1.0
91.0
8.0
NP
NP
NP
1.47
19.9
289
615
15.9
2.0
89.0
9.0
NP
NP
NP
1.46
19.7
228
10.5
72.
087
.011
.0N
PN
PN
P1.
4519
.228
128
1615
.52
1.0
90.0
9.0
NP
NP
NP
1.44
23.4
2813
.59
1.0
92.0
7.0
NP
NP
NP
1.43
20.3
281.
3515
1019
17.1
2.0
89.0
9.0
NP
NP
NP
1.42
14.8
2816
.511
1.0
8910
.0N
PN
PN
P1.
4124
.328
1812
2218
.72.
091
7.0
NP
NP
NP
1.4
24.3
328
19.5
131
936.
036
.20
15.9
120
.29
1.39
18.2
428
2114
1915
.235
.760
.34.
041
.50
17.9
123
.59
1.38
32.9
2822
.515
38.7
53.2
8.1
38.1
017
.21
20.8
91.
3724
.05
2824
1619
14.6
357
.936
.35.
846
.50
18.1
128
.39
1.36
15.7
528
25.5
1759
.139
.51.
452
.42
19.9
332
.49
1.35
21.8
2827
1824
17.5
22
8810
.051
.36
20.3
331
.03
1.34
12.4
281.
1928
.519
1.0
8910
.0N
PN
PN
P1.
3321
.728
3020
3021
2.0
8711
.0N
PN
PN
P1.
3211
.74
2831
.521
287
11.0
NP
NP
NP
1.31
16.9
528
3322
3322
.44
388
9.0
NP
NP
NP
1.3
20.3
528
34.5
231
8910
.0N
PN
PN
P1.
299.
8528
3624
3019
.21
8910
.0N
PN
PN
P1.
287.
5528
37.5
252
8315
.0N
PN
PN
P1.
2710
.35
2839
2635
21.7
031
69.0
NP
NP
NP
1.26
17.5
528
40.5
271
8415
.0N
PN
PN
P1.
259.
7528
Shea
rPa
ram
eter
s
SILT
YSA
ND
WIT
HSI
LTC
ON
TEN
T3-
12%
(25.
5-40
.5M
)
SILT
Y C
LAY
WIT
H K
AN
KA
R (1
9.5-
25.5
M
SAN
D W
ITH
SI
LT C
ON
TEN
T 3-
10%
(0.
0-19
.5M
)
Gra
in S
ize
Ana
lysi
s
SM SW GW
SW
CO
NSU
LT
ING
EN
GIN
EE
RS
ASS
OC
IAT
ES
Bor
e LO
G C
hart
& D
ata
Shee
t
PRO
JEC
T :
- C
onst
ruct
ion
of H
.L. B
ridg
e ov
er S
atlu
j at
Mat
tew
ara
BH
-3W
T- 1
m
Depth from GL(m)
SAMPLE NO
DESCRIPTION OF SOIL WITH ITS CLASSIFICATION
Symbolic Represent
IS Classification
SPT BLOWS /30cm.
Corrected N-Values
% GRAVEL
% SAND
% SILT/ CLAY
L L
P L
P I
Dry density gms/cc
% MOISTURE
Angle of friction(Deg.)
Silt factor %
0 1.5
10.
082
.217
.8N
PN
PN
P1.
5912
.58
281.
043
210
140.
086
.613
.4N
PN
PN
P1.
5820
.48
284.
53
2.6
91.0
6.4
NP
NP
NP
1.57
13.9
128
64
1214
.52
0.0
91.2
8.8
NP
NP
NP
1.56
24.0
428
7.5
50.
091
.09.
0N
PN
PN
P1.
5519
.828
96
1313
.91
0.0
88.5
11.5
NP
NP
NP
1.54
19.5
528
10.5
70.
087
.013
.0N
PN
PN
P1.
5319
.128
128
1414
1.0
91.0
8.0
NP
NP
NP
1.52
23.2
2813
.59
1.0
92.0
7.0
NP
NP
NP
1.51
20.0
281.
6855
815
1017
15.6
440
.050
.59.
5N
PN
PN
P1.
5014
.628
16.5
1133
.040
.226
.8N
PN
PN
P1.
4924
.228
1812
2017
.415
.975
.09.
1N
PN
PN
P1.
4818
.07
2819
.513
SM0.
070
.229
.836
.718
.91
17.7
91.
4932
.71
2821
1417
14.1
10.
010
.789
.342
20.9
121
.09
1.50
23.9
2822
.515
0.0
7.6
92.4
28.6
20.1
208.
481.
5115
.58
2824
1617
13.4
30.
030
.070
.047
21.1
125
.89
1.52
21.6
328
25.5
17M
H1.
028
.470
.652
.922
.929
.99
1.53
12.2
2827
18M
L22
16.9
42.
027
.670
.451
.86
23.3
3028
.53
1.54
21.5
328
1.59
043
28.5
191.
088
.610
.4N
PN
PN
P1.
5511
.57
2830
2028
20.4
42.
087
.210
.8N
PN
PN
P1.
5616
.78
2831
.521
2.0
87.0
11.0
NP
NP
NP
1.57
20.1
828
3322
3121
.73.
088
.09.
0N
PN
PN
P1.
589.
6828
34.5
231.
089
.39.
7N
PN
PN
P1.
597.
3828
3624
2819
.04
1.0
89.0
10.0
NP
NP
NP
1.60
10.1
828
37.5
252.
083
.015
.0N
PN
PN
P1.
6117
.38
2839
2633
21.1
20.
031
.069
.0N
PN
PN
P1.
629.
5828
40.5
271.
084
.015
.0N
PN
PN
P1.
6322
.38
28
Shea
rPa
ram
eter
s
SILT
YSA
ND
WIT
HSI
LTC
ON
TEN
T3-
12%
(18.
0-40
.5M
)
LTY
CLA
Y W
ITH
KA
NK
AR
(13.
5-18
.0
SAN
D W
ITH
SIL
T C
ON
TEN
T 3-
10%
(0.
0-13
.5M
)
Gra
in S
ize
Ana
lysi
s
SM SW ML
SM
CO
NSU
LT
ING
EN
GIN
EE
RS
ASS
OC
IAT
ES
Bor
e LO
G C
hart
& D
ata
Shee
t
PRO
JEC
T :
- C
onst
ruct
ion
of H
.L. B
ridg
e ov
er S
atlu
j at
Mat
tew
ara
BH
-4W
T- 1
m
Depth from GL(m)
SAMPLE NO
DESCRIPTION OF SOIL WITH ITS CLASSIFICATION
Symbolic Represent
IS Classification
SPT BLOWS /30cm.
Corrected N-Values
% GRAVEL
% SAND
% SILT/ CLAY
L L
P L
P I
Dry density gms/cc
% MOISTURE
Angle of friction(Deg.)
Silt factor %
0 1.5
10.
0192
.30
7.69
NP
NP
NP
1.56
11.5
828
1.47
32
811
.04
0.01
91.3
28.
67N
PN
PN
P1.
5519
.48
284.
53
2.54
91.0
06.
46N
PN
PN
P1.
5412
.91
286
410
11.2
00.
0192
.00
7.99
NP
NP
NP
1.53
23.0
428
7.5
50.
0191
.00
8.99
NP
NP
NP
1.52
18.8
289
611
11.3
30.
0189
.00
10.9
9N
PN
PN
P1.
5118
.55
2810
.57
0.01
87.0
012
.99
NP
NP
NP
1.50
18.1
2812
812
11.5
20.
0185
.20
14.7
9N
PN
PN
P1.
4922
.228
13.5
91.
0092
.00
7.00
NP
NP
NP
1.48
19.1
281.
599
1510
1513
.05
2.00
89.0
09.
00N
PN
PN
P1.
4713
.628
16.5
111.
0082
.01
16.9
9N
PN
PN
P1.
4623
.228
1812
1815
.12
2.00
91.0
07.
0037
.00
NP
NP
1.45
17.0
728
19.5
1335
.54
55.2
39.
2342
.40
19.7
022
.70
1.46
31.7
128
2114
1511
.85
38.5
356
.20
5.27
39.0
021
.60
17.4
01.
4722
.928
22.5
1557
.71
42.0
10.
2847
.40
21.0
526
.35
1.48
14.5
828
2416
1511
.25
58.9
540
.10
0.95
53.3
021
.09
32.2
11.
4920
.63
2825
.517
0.01
90.0
09.
9952
.26
24.1
828
.08
1.50
11.2
2827
1820
14.6
00.
0188
.00
11.9
9N
PN
PN
P1.
5120
.53
281.
471
28.5
190.
0189
.00
10.9
9N
PN
PN
P1.
5210
.57
2830
2026
17.9
41.
7187
.00
11.2
9N
PN
PN
P1.
5315
.78
2831
.521
SW15
.86
80.0
14.
13N
PN
PN
P1.
5419
.18
2833
2229
18.8
50.
0188
.00
11.9
9N
PN
PN
P1.
558.
6828
34.5
230.
0187
.09
12.9
0N
PN
PN
P1.
566.
3828
3624
2616
.38
0.01
85.0
514
.94
NP
NP
NP
1.57
9.18
2837
.525
1.20
76.2
622
.54
NP
NP
NP
1.58
16.3
828
3926
3118
.91
0.01
31.0
068
.99
NP
NP
NP
1.59
8.58
2840
.527
0.01
84.0
015
.99
NP
NP
NP
1.60
21.3
828
Shea
rPa
ram
eter
s
SILT
Y C
LAY
WIT
H K
AN
KA
R (1
8-24
.0M
)
SILT
YSA
ND
WIT
HSI
LTC
ON
TEN
T3-
12%
(24.
0-40
.5M
)
SAN
D W
ITH
SILT
CO
NTE
NT
3-10
%(0
.0-1
8.0M
)
Gra
in S
ize
Ana
lysi
s
SM SW GW SM SM
CO
NSU
LT
ING
EN
GIN
EE
RS
ASS
OC
IAT
ES
Bor
e LO
G C
hart
& D
ata
Shee
t
PRO
JEC
T :
- C
onst
ruct
ion
of H
.L. B
ridg
e ov
er S
atlu
j at
Mat
tew
ara
BH
-5W
T- 1
m
Depth from GL(m)
SAMPLE NO
DESCRIPTION OF SOIL WITH ITS CLASSIFICATION
Symbolic Represent
IS Classification
SPT BLOWS /30cm.
Corrected N-Values
% GRAVEL
% SAND
% SILT/ CLAY
L L
P L
P I
Dry density gms/cc
% MOISTURE
Angle of friction(Deg.)
Silt factor %
0 1.5
10.
197
.42.
5N
PN
PN
P1.
6211
.59
281.
183
29
11.7
90.
195
.64.
3N
PN
PN
P1.
6119
.49
284.
53
2.4
96.3
1.3
NP
NP
NP
1.60
12.9
228
64
1112
.32
2.1
95.0
2.9
NP
NP
NP
1.59
23.0
528
7.5
52.
393
.04.
7N
PN
PN
P1.
5818
.76
289
612
12.3
62.
089
.09.
0N
PN
PN
P1.
5718
.56
2810
.57
0.0
87.0
13.0
NP
NP
NP
1.56
18.0
628
128
1312
.22
0.0
90.0
10.0
NP
NP
NP
1.55
22.2
128
13.5
90.
080
.719
.3N
PN
PN
P1.
5419
.10
281.
494
1510
1614
.24
0.0
79.6
20.4
NP
NP
NP
1.53
13.6
128
16.5
110.
089
11.0
NP
NP
NP
1.52
23.1
728
1812
1916
.34
0.0
60.5
39.5
NP
NP
NP
1.51
17.0
828
19.5
130.
0153
.446
.637
.719
18.7
01.
5231
.72
2821
1416
12.8
1.7
70.1
28.2
43.2
021
.00
22.2
01.
5322
.89
2822
.515
1.8
75.5
922
.639
.60
20.3
019
.30
1.54
14.5
928
2416
1612
.32
1.9
60.7
37.4
48.0
021
.20
26.8
01.
5520
.64
2825
.517
35.6
55.6
8.8
53.9
023
.02
30.8
81.
5611
.24
2827
1821
15.5
438
.59
50.3
611
.152
.53
23.4
229
.11
1.57
20.5
428
1.31
528
.519
34.6
52.6
912
.8N
PN
PN
P1.
5810
.58
2830
2027
19.1
733
.660
.16.
318
NP
NP
1.59
15.7
928
31.5
210.
587
12.5
17N
PN
P1.
6019
.19
2833
2230
20.7
0.6
89.6
9.8
NP
NP
NP
1.61
8.69
2834
.523
0.5
8910
.517
NP
NP
1.62
6.39
2836
2427
18.0
90.
982
.06
17.0
17N
PN
P1.
639.
1928
37.5
251.
7983
15.2
NP
NP
1.64
16.3
928
3926
3220
.83.
231
65.8
3320
121.
658.
5928
40.5
270
8416
.020
……
1.66
21.3
928
Shea
rPa
ram
eter
s
LTY
CLA
Y W
ITH
KA
NK
AR
(24
.0-3
0.0
SILT
YSA
ND
WIT
HSI
LTC
ON
TEN
T3-
12%
(30.
0-40
.5M
)
SAN
D W
ITH
SIL
T C
ON
TEN
T 3-
10%
(0.
0-24
.0M
)
Gra
in S
ize
Ana
lysi
s
SMSWSM
CO
NSU
LT
ING
EN
GIN
EE
RS
ASS
OC
IAT
ES
Bor
e LO
G C
hart
& D
ata
Shee
t
PRO
JEC
T :
- C
onst
ruct
ion
of H
.L. B
ridg
e ov
er S
atlu
j at
Mat
tew
ara
BH
-6W
T- 1
m
Depth from GL(m)
SAMPLE NO
DESCRIPTION OF SOIL WITH ITS CLASSIFICATION
Symbolic Represent
IS Classification
SPT BLOWS /30cm.
Corrected N-Values
% GRAVEL
% SAND
% SILT/ CLAY
L L
P L
P I
Dry density gms/cc
% MOISTURE
Angle of friction(Deg.)
Silt factor %
0 1.5
1
0.2
97.5
2.3
NP
NP
NP
11.0
15.
9028
1.41
32
810
.48
0.7
97.8
1.5
NP
NP
NP
18.9
15.
228
4.5
30.
295
.04.
8N
PN
PN
P12
.34
NP
286
411
12.4
30.
292
.07.
8N
PN
PN
P22
.47
NP
287.
55
0.2
91.0
8.8
NP
NP
NP
18.1
86.
828
96
1313
.52
0.2
89.0
10.8
NP
NP
NP
17.9
8N
P28
10.5
70.
287
.012
.8N
PN
PN
P17
.48
NP
2812
814
13.1
61.
089
.110
.0N
PN
PN
P21
.63
6.9
2813
.59
1.0
60.9
38.1
NP
NP
NP
18.5
2N
P28
1.58
115
1016
14.2
42.
059
.139
.044
.20
21.9
022
.30
13.0
3N
P28
16.5
111.
089
10.0
42.9
020
.90
22.0
022
.59
6.9
2818
1214
12.0
42.
091
7.0
NP
NP
NP
16.5
0N
P28
19.5
131
936.
0N
PN
PN
P31
.14
NP
2821
1416
12.8
15.2
80.5
4.3
33.2
18.2
15.0
022
.31
7.2
2822
.515
17.8
76.6
5.6
29.1
15.2
013
.90
14.0
1N
P28
2416
2620
.02
40.1
44.5
15.4
41.4
22.8
18.6
020
.06
NP
2825
.517
1.0
40.1
58.9
16.0
NP
NP
10.6
68.
028
2718
1611
.84
233
.264
.820
NP
NP
19.9
6N
P28
1.56
128
.519
1.0
88.5
10.5
NP
NP
NP
10.0
0N
P28
3020
3222
.72
2.0
8513
.0N
PN
PN
P15
.21
8.2
2831
.521
286
.511
.5N
PN
PN
P18
.61
NP
2833
2232
22.0
83
889.
0N
PN
PN
P8.
11N
P28
34.5
231
8910
.0N
PN
PN
P5.
818.
828
3624
2919
.43
189
10.0
NP
NP
NP
8.61
NP
2837
.525
283
15.0
NP
NP
NP
15.8
1N
P28
3926
2113
.65
026
74.0
NP
NP
NP
8.01
26.5
2840
.527
3321
.12
160
39.0
NP
NP
NP
20.8
1…
28
Shea
rPa
ram
eter
s
SILT
Y C
LAY
WIT
H K
AN
KA
R (1
9.5-
24.0
M
SILT
YSA
ND
WIT
HSI
LTC
ON
TEN
T3-
12%
(24.
0-40
.5M
)
SAN
D W
ITH
SIL
T C
ON
TEN
T 3-
10%
(0
.0-1
9.5M
)
Gra
in S
ize
Ana
lysi
s
SMML
SWSM
CO
NSU
LT
ING
EN
GIN
EE
RS
ASS
OC
IAT
ES
Bor
e LO
G C
hart
& D
ata
Shee
t
PRO
JEC
T :
- C
onst
ruct
ion
of H
.L. B
ridg
e ov
er S
atlu
j at
Mat
tew
ara
BH
-7W
T- 1
m
Depth from GL(m)
SAMPLE NO
DESCRIPTION OF SOIL WITH ITS CLASSIFICATION
Symbolic Represent
IS Classification
SPT BLOWS /30cm.
Corrected N-Values
% GRAVEL
% SAND
% SILT/ CLAY
L L
P L
P I
Dry density gms/cc
% MOISTURE
Angle of friction(Deg.)
Silt factor %
0 1.5
10.
297
.516
.8N
PN
PN
P1.
6711
.228
1.54
32
79
0.7
98.0
11.8
NP
NP
NP
1.66
19.1
284.
53
0.2
96.0
7.0
NP
NP
NP
1.65
12.5
286
410
110.
294
.65.
0N
PN
PN
P1.
6422
.728
7.5
50.
288
.57.
0N
PN
PN
P1.
6318
.428
96
1212
0.2
60.4
8.0
NP
NP
NP
1.62
18.2
2810
.57
0.2
66.8
9.0
NP
NP
NP
1.61
17.7
2812
813
120.
448
.57.
0N
PN
PN
P1.
6021
.828
13.5
90.
259
.56.
0N
PN
PN
P1.
5918
.728
1.54
515
1015
130.
294
.17.
0N
PN
PN
P1.
5813
.228
16.5
110.
294
.38
NP
NP
NP
1.57
22.8
2818
1213
110.
264
.56
NP
NP
NP
1.56
16.7
2819
.513
21.5
35.8
5.0
44.1
323
.320
.83
1.57
31.3
2821
1415
1240
.534
.57
43.4
20.9
22.5
01.
5822
.528
22.5
1561
.785
.28
18N
PN
P1.
5914
.228
2416
2519
6.7
86.5
9N
PN
PN
P1.
6020
.328
25.5
175.
587
.58
35.6
20.7
14.9
51.
6110
.928
2718
1511
4.6
887
28.5
417
.550
10.9
91.
6220
.228
1.45
428
.519
3.6
898
NP
NP
NP
1.63
10.2
2830
2031
222.
087
9N
PN
PN
P1.
6415
.428
31.5
212
8711
NP
NP
NP
1.65
18.8
2833
2231
213
96.8
7N
PN
PN
P1.
668.
328
34.5
231
95.2
8N
PN
PN
P1.
676.
028
3624
2819
189
8N
PN
PN
P1.
688.
828
37.5
253.
283
12N
PN
PN
P1.
6916
.028
3926
2013
121
54N
PN
PN
P1.
708.
228
40.5
2732
201
5612
NP
NP
NP
1.71
21.0
28
Shea
rPa
ram
eter
s
SILT
YSA
ND
WIT
HSI
LTC
ON
TEN
T3-
12%
(25.
5-40
.5M
)
LTY
CLA
Y W
ITH
KA
NK
AR
(18.
0-25
.5
SAN
D W
ITH
SIL
T C
ON
TEN
T 3-
10%
(0.
0-18
.0M
)
Gra
in S
ize
Ana
lysi
s
SM SW SM
CO
NSU
LT
ING
EN
GIN
EE
RS
ASS
OC
IAT
ES
Bor
e LO
G C
hart
& D
ata
Shee
t
PRO
JEC
T :
- C
onst
ruct
ion
of H
.L. B
ridg
e ov
er S
atlu
j at
Mat
tew
ara
BH
-8W
T- 1
m
Depth from GL(m)
SAMPLE NO
DESCRIPTION OF SOIL WITH ITS CLASSIFICATION
Symbolic Represent
IS Classification
SPT BLOWS /30cm.
Corrected N-Values
% GRAVEL
% SAND
% SILT/ CLAY
L L
P L
P I
Dry density gms/cc
% MOISTURE
Angle of friction(Deg.)
Silt factor %
0 1.5
11.
082
.216
.8N
PN
PN
P1.
5310
.928
1.56
32
68
1.6
86.6
11.8
NP
NP
NP
1.52
18.8
284.
53
1.0
91.0
8.0
NP
NP
NP
1.51
12.2
286
49
102.
092
.06.
0N
PN
PN
P1.
5022
.428
7.5
51.
091
.08.
0N
PN
PN
P1.
4918
.128
96
1111
2.0
89.0
9.0
NP
NP
NP
1.48
17.9
2810
.57
2.0
87.0
11.0
NP
NP
NP
1.47
17.4
2812
812
111.
090
.09.
0N
PN
PN
P1.
4621
.528
13.5
91.
092
.07.
0N
PN
PN
P1.
4518
.428
1.56
715
1014
122.
089
.09.
0N
PN
PN
P1.
4412
.928
16.5
1140
.133
.526
.4N
PN
PN
P1.
4322
.528
1812
1210
45.3
40.5
14.2
NP
NP
NP
1.42
16.4
2819
.513
63.9
33.2
2.9
44.1
323
.320
.83
1.43
31.0
2821
1414
112.
090
8.0
43.4
520
.922
.55
1.44
22.2
2822
.515
2.0
8810
.015
NP
NP
1.45
13.9
2824
1624
181.
087
.611
.4N
PN
PN
P1.
4620
.028
25.5
171.
090
9.0
35.6
20.7
14.9
51.
4710
.628
2718
1410
288
10.0
28.5
17.5
5010
.95
1.48
19.9
281.
482
28.5
191.
089
10.0
NP
NP
NP
1.49
9.9
2830
2030
212.
087
11.0
NP
NP
NP
1.50
15.1
2831
.521
287
11.0
NP
NP
NP
1.51
18.5
2833
2230
213
889.
0N
PN
PN
P1.
528.
028
34.5
231
8910
.0N
PN
PN
P1.
535.
728
3624
2718
186
13.0
NP
NP
NP
1.54
8.5
2837
.525
283
15.0
NP
NP
NP
1.55
15.7
2839
2619
120
8614
.0N
PN
PN
P1.
567.
928
40.5
2731
191
8415
.0N
PN
PN
P1.
5720
.728
Shea
rPa
ram
eter
s
SILT
Y C
LAY
WIT
H K
AN
KA
R (1
5.0-
19.5
M
SILT
YSA
ND
WIT
HSI
LTC
ON
TEN
T3-
12%
(19.
5-40
.5M
)
SAN
D W
ITH
SI
LT C
ON
TEN
T 3-
10%
(0.
0-15
.0M
)
Gra
in S
ize
Ana
lysi
s
SM GW SM
CO
NSU
LT
ING
EN
GIN
EE
RS
ASS
OC
IAT
ES
Bor
e LO
G C
hart
& D
ata
Shee
t
PRO
JEC
T :
- C
onst
ruct
ion
of H
.L. B
ridg
e ov
er S
atlu
j at
Mat
tew
ara
BH
-9W
T- 1
m
Depth from GL(m)
SAMPLE NO
DESCRIPTION OF SOIL WITH ITS CLASSIFICATION
Symbolic Represent
IS Classification
SPT BLOWS /30cm.
Corrected N-Values
% GRAVEL
% SAND
% SILT/ CLAY
L L
P L
P I
Dry density gms/cc
% MOISTURE
Angle of friction(Deg.)
Silt factor %
0 1.5
10.
882
.217
.0N
PN
PN
P1.
5410
.47
281.
273
26
80.
286
.613
.2N
PN
PN
P1.
5318
.37
284.
53
0.1
91.0
8.9
NP
NP
NP
1.52
11.8
028
64
89
0.8
92.0
7.2
NP
NP
NP
1.51
21.9
328
7.5
50.
191
.08.
9N
PN
PN
P1.
5017
.64
289
610
102.
089
.09.
0N
PN
PN
P1.
4917
.44
2810
.57
2.0
87.0
11.0
NP
NP
NP
1.48
16.9
428
128
1110
1.0
90.0
9.0
NP
NP
NP
1.47
21.0
928
13.5
91.
092
.07.
0N
PN
PN
P1.
4617
.98
281.
475
1510
1311
0.1
89.0
10.9
NP
NP
NP
1.45
12.4
928
16.5
110.
989
10.1
55.2
323
.50
31.7
31.
4422
.05
2818
1218
150.
391
8.7
44.5
021
.80
22.7
01.
4315
.96
2819
.513
0.5
936.
5N
PN
PN
P1.
4430
.60
2821
1414
1120
.965
.213
.9N
PN
PN
P1.
4521
.77
2822
.515
21.8
60.1
18.1
36.8
921
.80
15.0
91.
4613
.47
2824
1615
111.
088
.011
.029
.10
17.9
011
.20
1.47
19.5
228
25.5
171.
090
9.0
41.9
021
.56
20.3
41.
4810
.12
2827
1821
150.
088
12.0
NP
NP
NP
1.49
19.4
228
1.37
628
.519
0.5
8910
.5N
PN
PN
P1.
509.
4628
3020
2518
0.9
86.5
612
.6N
PN
PN
P1.
5114
.67
2831
.521
0.2
8613
.8N
PN
PN
P1.
5218
.07
2833
2229
200.
688
11.4
NP
NP
NP
1.53
7.57
2834
.523
0.7
8910
.3N
PN
PN
P1.
545.
2728
3624
2517
189
10.0
NP
NP
NP
1.55
8.07
2837
.525
282
.56
15.4
NP
NP
NP
1.56
15.2
728
3926
3120
065
35.0
NP
NP
NP
1.57
7.47
2840
.527
184
15.0
NP
NP
NP
1.58
20.2
728
Gra
in S
ize
Ana
lysi
sSh
ear
Para
met
ers
SAN
D W
ITH
SIL
T C
ON
TEN
T 3-
12%
(22.
5
SILT
Y C
LAY
WIT
H K
AN
KA
R (1
9.5-
22.5
M
SAN
D W
ITH
SIL
T C
ON
TEN
T 3-
10%
(0
.0-1
9.5M
)
SMSWSM
CO
NSU
LT
ING
EN
GIN
EE
RS
ASS
OC
IAT
ES
Bor
e LO
G C
hart
& D
ata
Shee
t
PRO
JEC
T :
- C
onst
ruct
ion
of H
.L. B
ridg
e ov
er S
atlu
j at
Mat
tew
ara
BH
-10
WT-
1m
Depth from GL(m)
SAMPLE NO
DESCRIPTION OF SOIL WITH ITS CLASSIFICATION
Symbolic Represent
IS Classification
SPT BLOWS /30cm.
Corrected N-Values
% GRAVEL
% SAND
% SILT/ CLAY
L L
P L
P I
Dry density gms/cc
% MOISTURE
Angle of friction(Deg.)
Silt factor %
0 1.5
10.
097
.52.
5N
PN
PN
P1.
5510
.33
281.
383
25
70.
695
.04.
4N
PN
PN
P1.
5418
.23
284.
53
2.3
94.3
3.4
NP
NP
NP
1.53
11.6
628
64
78
2.0
93.5
4.5
NP
NP
NP
1.52
21.7
928
7.5
50.
092
.27.
8N
PN
PN
P1.
5117
.50
289
69
90.
093
.66.
4N
PN
PN
P1.
5017
.30
2810
.57
0.0
89.5
10.5
NP
NP
NP
1.49
16.8
028
128
1010
0.3
88.1
11.6
NP
NP
NP
1.48
20.9
528
13.5
90.
079
.520
.5N
PN
PN
P1.
4717
.84
281.
584
1510
1211
1.8
76.8
21.4
NP
NP
NP
1.46
12.3
528
16.5
110.
551
.448
.1N
PN
PN
P1.
4521
.91
2818
1217
152.
035
.462
.6N
PN
PN
P1.
4415
.82
2819
.513
150
.648
.437
.819
.518
.31.
4530
.46
2821
1413
112.
076
.521
.543
.721
.522
.21.
4621
.63
2822
.515
36.5
13.5
50.0
41.6
20.8
20.8
1.47
13.3
328
2416
1411
56.8
18.5
24.7
48.6
21.8
26.8
1.48
19.3
828
25.5
1737
.919
.642
.542
.319
.522
.81.
499.
9828
2718
2015
56.9
14.3
28.8
54.6
23.8
30.8
1.50
19.2
828
1.55
628
.519
57.8
12.3
29.9
53.6
23.6
30.0
1.51
9.32
2830
2024
170.
487
12.7
NP
NP
NP
1.52
14.5
328
31.5
212
85.3
12.7
NP
NP
NP
1.53
17.9
328
3322
2820
386
.310
.7N
PN
PN
P1.
547.
4328
34.5
231
8118
.0N
PN
PN
P1.
555.
1328
3624
2416
177
.521
.5N
PN
PN
P1.
567.
9328
37.5
252
7622
.0N
PN
PN
P1.
5715
.13
2839
2630
200
20.9
79.1
NP
NP
NP
1.58
7.33
2840
.527
122
.376
.7N
PN
PN
P1.
5920
.13
28
Shea
rPa
ram
eter
s
SILT
YSA
ND
WIT
HSI
LTC
ON
TEN
T3-
12%
(28.
5-40
.5M
)
SILT
Y C
LAY
WIT
H K
AN
KA
R (2
1.0-
28.5
M
SAN
D W
ITH
SIL
T C
ON
TEN
T 3-
10%
(0.0
-21.
0M)
Gra
in S
ize
Ana
lysi
s
SMSM GWML
CO
NSU
LT
ING
EN
GIN
EE
RS
ASS
OC
IAT
ES
Bor
e LO
G C
hart
& D
ata
Shee
t
PRO
JEC
T :
- C
onst
ruct
ion
of H
.L. B
ridg
e ov
er S
atlu
j at
Mat
tew
ara
BH
-11
WT-
1m
Depth from GL(m)
SAMPLE NO
DESCRIPTION OF SOIL WITH ITS CLASSIFICATION
Symbolic Represent
IS Classification
SPT BLOWS /30cm.
Corrected N-Values
% GRAVEL
% SAND
% SILT/ CLAY
L L
P L
P I
Dry density gms/cc
% MOISTURE
Angle of friction(Deg.)
Silt factor %
0 1.5
11.
097
.81.
2N
PN
PN
P1.
649.
828
1.54
32
46
0.5
95.6
3.9
NP
NP
NP
1.63
17.7
284.
53
0.6
98.0
1.4
NP
NP
NP
1.62
11.1
286
47
90.
396
.53.
2N
PN
PN
P1.
6121
.328
7.5
50.
491
.38.
3N
PN
PN
P1.
6017
.028
96
1011
0.8
76.5
22.7
NP
NP
NP
1.59
16.8
2810
.57
0.9
70.1
29.0
NP
NP
NP
1.58
16.3
2812
812
121.
060
.938
.1N
PN
PN
P1.
5720
.428
13.5
90.
855
.643
.655
.62
23.9
231
.70
1.56
17.3
281.
473
1510
1615
0.9
55.2
43.9
45.6
022
.20
23.4
01.
5511
.828
16.5
110.
944
.554
.6N
PN
PN
P1.
5421
.428
1812
1614
0.9
43.2
55.9
NP
NP
NP
1.53
15.3
2819
.513
35.6
42.3
22.1
37.4
021
.30
16.1
01.
5429
.928
2114
1815
36.9
42.2
20.9
28.5
017
.40
11.1
01.
5521
.128
22.5
1545
.345
.29.
541
.60
21.5
020
.10
1.56
12.8
2824
1622
1846
.646
.56.
9N
PN
PN
P1.
5718
.928
25.5
171.
190
8.9
NP
NP
NP
1.58
9.5
2827
1818
141.
188
10.9
NP
NP
NP
1.59
18.8
281.
5528
.519
1.2
78.5
20.3
NP
NP
NP
1.60
8.8
2830
2028
211.
278
.919
.9N
PN
PN
P1.
6114
.028
31.5
211.
272
.326
.5N
PN
PN
P1.
6217
.428
3322
2820
1.3
72.2
26.6
NP
NP
NP
1.63
6.9
2834
.523
1.3
899.
7N
PN
PN
P1.
644.
628
3624
2517
1.3
85.2
13.5
NP
NP
NP
1.65
7.4
2837
.525
1.3
84.6
14.1
NP
NP
NP
1.66
14.6
2839
2627
181.
420
.378
.3N
PN
PN
P1.
676.
828
40.5
271.
434
.564
.1N
PN
PN
P1.
6819
.628
Shea
rPa
ram
eter
s
SILT
YSA
ND
WIT
HSI
LTC
ON
TEN
T3-
12%
(24.
0-40
.5M
)
LTY
CLA
Y W
ITH
KA
NK
AR
(18.
0-24
.0
SAN
D W
ITH
SIL
T C
ON
TEN
T 3-
10%
(0
.0-1
8.0M
)
Gra
in S
ize
Ana
lysi
s
SM SW SM
CO
NSU
LT
ING
EN
GIN
EE
RS
ASS
OC
IAT
ES
Bor
e LO
G C
hart
& D
ata
Shee
t
PRO
JEC
T :
- C
onst
ruct
ion
of H
.L. B
ridg
e ov
er S
atlu
j at
Mat
tew
ara
BH
-12
WT-
1m
Depth from GL(m)
SAMPLE NO
DESCRIPTION OF SOIL WITH ITS CLASSIFICATION
Symbolic Represent
IS Classification
SPT BLOWS /30cm.
Corrected N-Values
% GRAVEL
% SAND
% SILT/ CLAY
L L
P L
P I
Dry density gms/cc
% MOISTURE
Angle of friction(Deg.)
Silt factor %
0 1.5
11.
082
.216
.8N
PN
PN
P1.
5810
.128
1.57
32
46
1.6
86.6
11.8
NP
NP
NP
1.57
18.0
284.
53
1.0
91.0
8.0
NP
NP
NP
1.56
11.4
286
46
71.
892
.06.
2N
PN
PN
P1.
5521
.628
7.5
51.
291
.07.
8N
PN
PN
P1.
5417
.328
96
88
1.5
89.0
9.5
NP
NP
NP
1.53
17.1
2810
.57
2.0
87.0
11.0
NP
NP
NP
1.52
16.6
2812
89
91.
090
.09.
0N
PN
PN
P1.
5120
.728
13.5
94.
592
.03.
5N
PN
PN
P1.
5017
.628
1.54
215
1011
109.
589
.01.
5N
PN
PN
P1.
4912
.128
16.5
1110
.189
0.9
NP
NP
NP
1.48
21.7
2818
1216
1415
.370
.514
.2N
PN
PN
P1.
4715
.628
19.5
1325
.670
.63.
838
.30
19.9
018
.40
1.48
30.2
2821
1412
1020
.375
.64.
144
.30
21.9
022
.40
1.49
21.4
2822
.515
15.6
80.6
3.8
42.2
021
.20
21.0
01.
5013
.128
2416
1310
1.0
88.0
11.0
493.
6022
.30
471.
301.
5119
.228
25.5
171.
090
9.0
54.3
023
.92
30.3
81.
529.
828
2718
1914
0.2
8811
.855
.90
24.3
431
.56
1.53
19.1
281.
542
28.5
190.
389
10.7
NP
NP
NP
1.54
9.1
2830
2023
160.
287
12.8
NP
NP
NP
1.55
14.3
2831
.521
0.1
8712
.9N
PN
PN
P1.
5617
.728
3322
2718
0.3
8811
.7N
PN
PN
P1.
577.
228
34.5
230.
589
10.5
NP
NP
NP
1.58
4.9
2836
2423
150.
689
10.4
NP
NP
NP
1.59
7.7
2837
.525
0.5
8316
.5N
PN
PN
P1.
6014
.928
3926
2918
0.6
3168
.4N
PN
PN
P1.
617.
128
40.5
270.
484
15.6
NP
NP
NP
1.62
19.9
28
ILTY
CLA
Y W
ITH
KA
NK
AR
(12.
0-22
.5M
SAN
D W
ITH
SIL
T C
ON
TEN
T 3-
12%
(22.
SAN
D W
ITH
S
ILT
CO
NTE
NT
3-10
%
(0.0
-12.
0)
Gra
in S
ize
Ana
lysi
sSh
ear
Para
met
ers
SMSWSM
CO
NSU
LT
ING
EN
GIN
EE
RS
ASS
OC
IAT
ES
Bor
e LO
G C
hart
& D
ata
Shee
t
PRO
JEC
T :
- C
onst
ruct
ion
of H
.L. B
ridge
ove
r Sat
luj a
t M
atte
war
aB
H-1
3W
T- 1
m
Depth from GL(m)
SAMPLE NO
DESCRIPTION OF SOIL WITH ITS CLASSIFICATION
Symbolic Represent
IS Classification
SPT BLOWS /30cm.
Corrected N-Values
% GRAVEL
% SAND
% SILT/ CLAY
L L
P L
P I
Dry density gms/cc
% MOISTURE
Angle of friction(Deg.)
Silt factor %
0 1.5
10.
097
.82.
2N
PN
PN
P1.
6110
.01
281.
563
25
80.
096
.53.
5N
PN
PN
P1.
6017
.91
284.
53
0.0
92.6
7.4
NP
NP
NP
1.59
11.3
428
64
79
0.0
89.1
10.9
NP
NP
NP
1.58
21.4
728
7.5
52.
691
.06.
4N
PN
PN
P1.
5717
.18
289
68
90.
289
.010
.8N
PN
PN
P1.
5616
.98
2810
.57
1.2
80.2
18.6
NP
NP
NP
1.55
16.4
828
128
99
0.5
81.6
17.9
NP
NP
NP
1.54
20.6
328
13.5
90.
983
.515
.6N
PN
PN
P1.
5317
.52
281.
546
1510
1211
0.4
89.0
10.6
NP
NP
NP
1.52
12.0
328
16.5
110.
889
10.2
NP
NP
NP
1.51
21.5
928
1812
1513
1.1
917.
946
.50
25.3
021
.20
1.50
15.5
028
19.5
130.
2393
6.8
45.2
024
.30
20.9
01.
5130
.14
2821
1412
105.
690
4.4
41.1
023
.30
17.8
01.
5221
.31
2822
.515
6.5
73.5
20.0
39.2
019
.20
20.0
01.
5313
.01
2824
1612
98.
988
.03.
133
.50
17.8
015
.70
1.54
19.0
628
25.5
1715
.970
.513
.6N
PN
PN
P1.
559.
6628
2718
1713
20.5
73.6
5.9
NP
NP
NP
1.56
18.9
628
1.64
728
.519
27.6
69.5
2.9
NP
NP
NP
1.57
9.00
2830
2023
170.
287
12.8
NP
NP
NP
1.58
14.2
128
31.5
213.
587
9.5
NP
NP
NP
1.59
17.6
128
3322
2618
388
9.0
NP
NP
NP
1.60
7.11
2834
.523
3.6
87.6
8.8
NP
NP
NP
1.61
4.81
2836
2423
154.
586
.59.
0N
PN
PN
P1.
627.
6128
37.5
254.
983
.911
.2N
PN
PN
P1.
6314
.81
2839
2628
182
31.6
66.4
NP
NP
NP
1.64
7.01
2840
.527
335
.661
.4N
PN
PN
P1.
6519
.81
28
Y S
AN
D W
ITH
SIL
T C
ON
TEN
T 3-
12%
(28.
5-40
SILT
Y C
LAY
WIT
H K
AN
KA
R (1
9.5-
28.5
M)
SAN
D W
ITH
S
ILT
CO
NTE
NT
3-10
%(0
.0-1
9.5M
)
Gra
in S
ize
Ana
lysi
sSh
ear
Para
met
ers
SMSWSM
PR
OP
OS
ED
BR
IDG
E O
N S
UTL
EJ
RIV
ER
717
.40m
.
A1P1
P2P3
P4P5
P6P7
P8P9
P10
P11
P12
P13
P14
P15
P16
P17
P18
A2
234.0
-
235.0
-
236.0
-
237.0
-
238.0
-
239.0
-
240.0
-
241.0
-
242.0
-
243.0
-
224.0
225.0
226.0
-
227.0
-
228.0
229.0
-
230.0
231.0
-
232.0
233.0
-
215.0
-
216.0
-
217.0
-
218.0
-
219.0
-
220.0
-
221.0
-
222.0
-
223.0
206.0
-20
7.0 -
208.0
-
209.0
-
210.0
-
211.0
-
212.0
-
213.0
-
214.0
-
202.0
-20
3.0 -
204.0
-
205.0
-
200.0
-
201.0
-.
BH1
BH2
BH3
BH4
BH5
BH6
BH8
BH11
BH12
BH13
BH7
BH9
BH10
0.0 1.5 3.0 4.5 6.0 7.5 9.0 10.5
12.0
13.5
15.0
16.5 18.0
19.5
21.0
22.5
24.0 25.5
27.0
28.5
30.0
31.5
33.0
34.5
36.0
37.5
39.0
40.5
0.0 1.5 3.0 4.5 6.0 7.5 9.0 10.5
12.0
13.5
15.0
16.5 18.0
19.5
21.0
22.5
24.0 25.5
27.0
28.5
30.0
31.5
33.0
34.5
36.0
37.5
39.0
40.5
0.0 1.5 3.0 4.5 6.0 7.5 9.0 10.5
12.0
13.5
15.0
16.5 18.0
19.5
21.0
22.5
24.0 25.5
27.0
28.5
30.0
31.5
33.0
34.5
36.0
37.5
39.0
40.5
0.0 1.5 3.0 4.5 6.0 7.5 9.0 10.5
12.0
13.5
15.0
16.5 18.0
19.5
21.0
22.5
24.0 25.5
27.0
28.5
30.0
31.5
33.0
34.5
36.0
37.5
39.0
40.5
0.0 1.5 3.0 4.5 6.0 7.5 9.0 10.5
12.0
13.5
15.0
16.5 18.0
19.5
21.0
22.5
24.0 25.5
27.0
28.5
30.0
31.5
33.0
34.5
36.0
37.5
39.0
0.0 1.5 3.0 4.5 6.0 7.5 9.0 10.5
12.0
13.5
15.0
16.5 18.0
19.5
21.0
22.5
24.0 25.5
27.0
28.5
30.0
31.5
33.0
34.5
36.0
37.5
39.0
40.5
0.0 1.5 3.0 4.5 6.0 7.5 9.0 10.5
12.0
13.5
15.0
16.5 18.0
19.5
21.0
22.5
24.0 25.5
27.0
28.5
30.0
31.5
33.0
34.5
36.0
37.5
39.0
40.5
0.0 1.5 3.0 4.5 6.0 7.5 9.0 10.5
12.0
13.5
15.0
16.5 18.0
19.5
21.0
22.5
24.0 25.5
27.0
28.5
30.0
31.5
33.0
34.5
36.0
37.5
39.0
40.5
0.0 1.5 3.0 4.5 6.0 7.5 9.0 10.5
12.0
13.5
15.0
16.5 18.0
19.5
21.0
22.5
24.0 25.5
27.0
28.5
30.0
31.5
33.0
34.5
36.0
37.5
39.0
0.0 1.5 3.0 4.5 6.0 7.5 9.0 10.5
12.0
13.5
15.0
16.5 18.0
19.5
21.0
22.5
24.0 25.5
27.0
28.5
30.0
31.5
33.0
34.5
36.0
37.5
39.0
0.0 1.5 3.0 4.5 6.0 7.5 9.0 10.5
12.0
13.5
15.0
16.5 18.0
19.5
21.0
22.5
24.0 25.5
28.5
30.0
31.5
33.0
34.5
36.0
37.5
39.0
40.5
0.0 1.5 3.0 4.5 6.0 7.5 9.0 10.5
12.0
13.5
15.0
16.5 18.0
19.5
21.0
22.5
30.0
31.5
33.0
34.5
36.0
37.5
39.0
40.5
0.0 1.5 3.0 4.5 6.0 7.5 9.0 10.5
12.0
13.5
15.0
16.5 18.0
19.5
21.0
22.5
24.0 25.5
27.0
28.5
30.0
31.5
33.0
34.5
36.0
37.5
39.0
40.5
27.0
SAND
WIT
H SI
LTCO
NTEN
T 3-
10%
(SM
)
SILT
Y CL
AY W
ITH
KANK
AR (
SW)
24.0 25.5
27.0
28.5
C E
A
CONSU
LTANT:-
Recommended