Clean Up Australia © 2008 Page 1
RRuubbbbiisshh
RReeppoorrtt
22000088
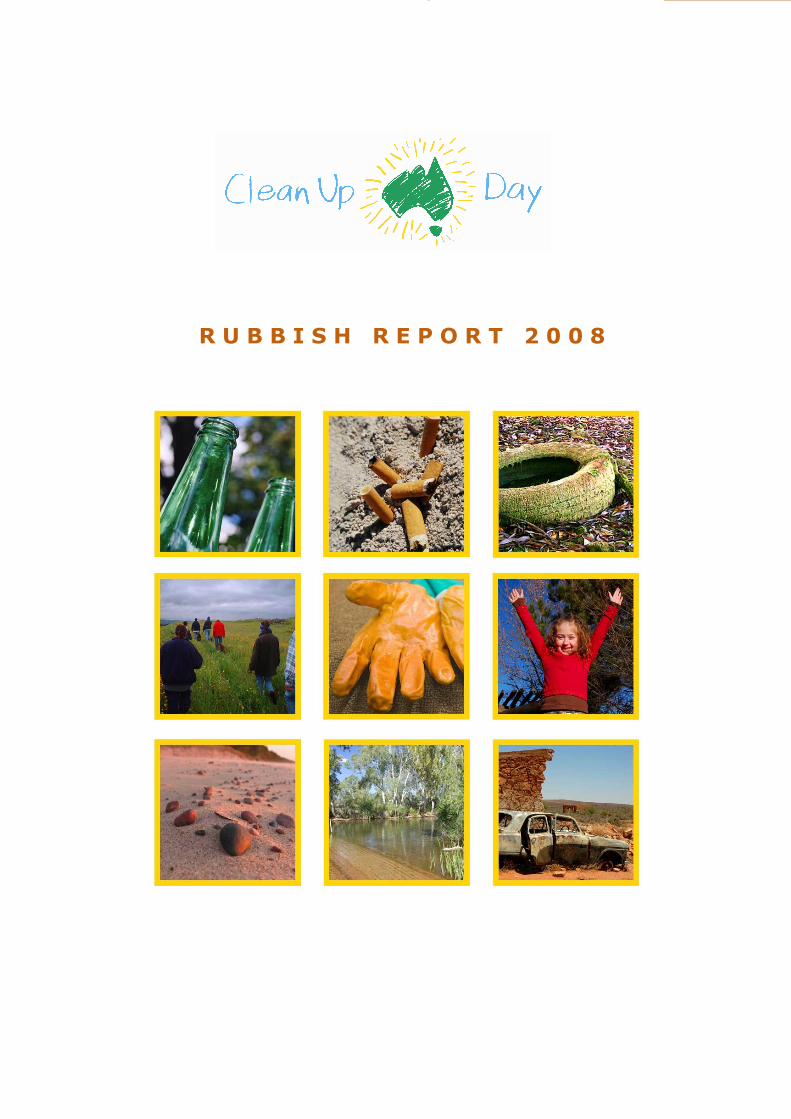
R U B B I S H R E P O R T 2 0 0 8
Clean Up Australia © 2008 Page 2
RRuubbbbiisshh
RReeppoorrtt
22000088
W i t h t h a n k s t o o u r S p o n s o r s a n d
S u p p o r t e r s :
MAJOR SPONSORS SPONSORS
SUPPLIERS
CONTENTS
Page Number
I n t r o d u c t i o n 3
O v e r a l l T r e n d s 4
E x e c u t i v e S umm a r y 5
K e y F i n d i n g s 7
K e y S u r v e y R e s u l t s 7
M e t h o d o l o g y 8
S u r v e y e d S i t e s 9
R e t u r n e d S u r v e y s b y S t a t e 9
R e t u r n e d S u r v e y s b y S i t e T y p e 10
M a j o r S o u r c e s o f R u b b i s h 11
H i s t o r i c a l C om p a r i s o n 12
M a j o r S o u r c e s o f r u b b i s h –
A n a l y s i s o f E a c h C a t e g o r y 14
� P l a s t i c 14
� P o l y s t y r e n e 15
� G l a s s 16
� R u b b e r 17
� P a p e r a n d C a r d b o a r d 18
� M e t a l / A l u m i n i u m 19
� Wo o d 20
� M i s c e l l a n e o u s 21
T h e T o p T e n R u b b i s h I t e m s 22
M o s t ‘ P o l l u t e d ’ S i t e s 23
S i t e R u b b i s h C om p o s i t i o n 25
C a s e S t u d y – T h e B a r w o n R i v e r 26
Clean Up Australia © 2008 Page 3
RRuubbbbiisshh
RReeppoorrtt
22000088
I N T RODUC T I O N
The nation’s largest community-based
environmental event, Clean Up Australia
Day, celebrated its eighteenth year in
2008.
The campaign continues to go from
strength to strength, highlighting the
nation’s most urgent environmental and
waste issues. The link between waste and
greenhouse gases was given the spotlight
in 2008, to urge all Australians to consider
their daily actions and the impact they
have on climate change.
Recycling is a major solution to many
waste problems, and has benefits to the
environment as well as the community.
This was a major focus of the 2008
campaign, which trialled a formal recycling
program across several councils. The aim
of this trial was to gauge community
uptake, council capabilities and gather
overall statistics on how successful
recycling at Clean Up sites can be.
This linked into the launch of the Clean Up
Our Climate campaign, which aims to raise
awareness and educate the community
about Climate Change. Clean Up our
Climate provides practical solutions;
empowering individuals, schools and
businesses to reduce their carbon
emissions. Recycling is a positive action
which can significantly reduce carbon
emissions and this is one of the key
messages of the campaign.
On Clean Up Australia Day 2008 (March
2nd), Ian Kiernan AO, Chairman and
Founder of Clean Up Australia (CUA),
highlighted the vital need for governments
to look at real solutions to encourage
recycling – such as a container deposit
legislation or a ‘refund scheme’ for all
states, this is currently only in South
Australia (SA).
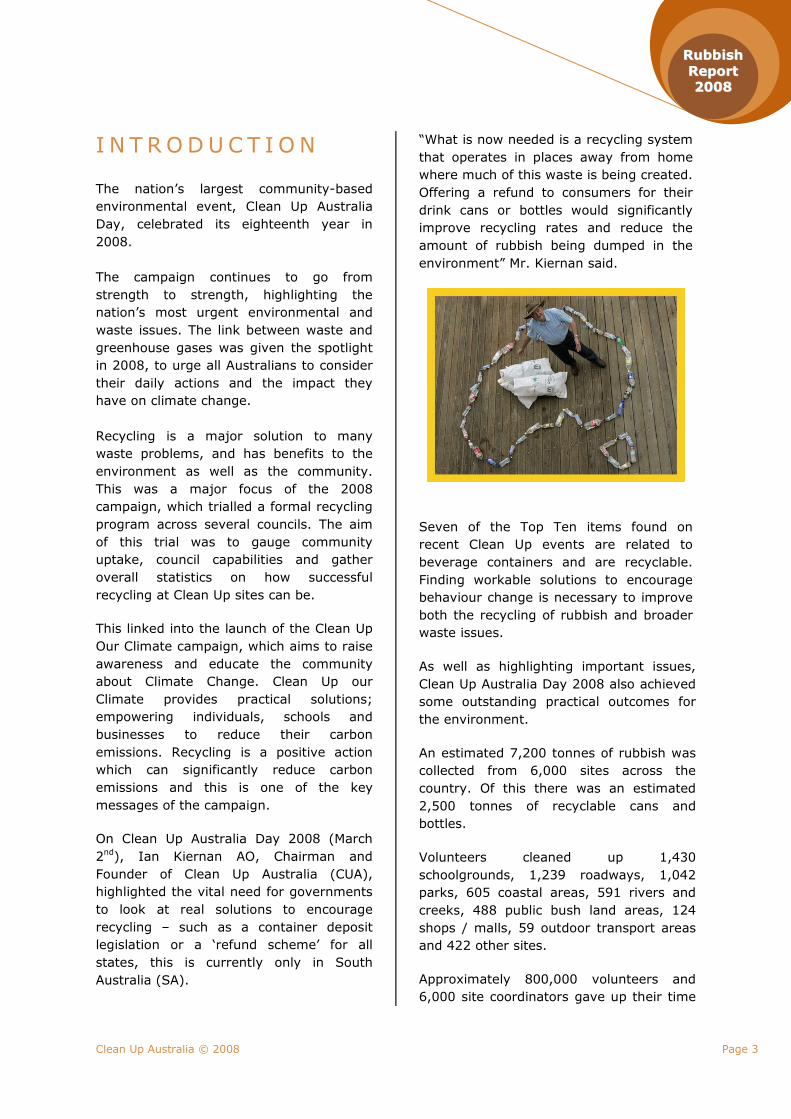
“What is now needed is a recycling system
that operates in places away from home
where much of this waste is being created.
Offering a refund to consumers for their
drink cans or bottles would significantly
improve recycling rates and reduce the
amount of rubbish being dumped in the
environment” Mr. Kiernan said.
Seven of the Top Ten items found on
recent Clean Up events are related to
beverage containers and are recyclable.
Finding workable solutions to encourage
behaviour change is necessary to improve
both the recycling of rubbish and broader
waste issues.
As well as highlighting important issues,
Clean Up Australia Day 2008 also achieved
some outstanding practical outcomes for
the environment.
An estimated 7,200 tonnes of rubbish was
collected from 6,000 sites across the
country. Of this there was an estimated
2,500 tonnes of recyclable cans and
bottles.
Volunteers cleaned up 1,430
schoolgrounds, 1,239 roadways, 1,042
parks, 605 coastal areas, 591 rivers and
creeks, 488 public bush land areas, 124
shops / malls, 59 outdoor transport areas
and 422 other sites.
Approximately 800,000 volunteers and
6,000 site coordinators gave up their time
Clean Up Australia © 2008 Page 4
RRuubbbbiisshh
RReeppoorrtt
22000088
Australia
produces more
than 1.3 million
tonnes of plastic
every year.
That’s more than
71kg per person.
to come and help Clean Up the
environment.
Many of these volunteers took the extra
time to sample the rubbish collected, to
help Clean Up identify rubbish trends and
observations across the nation. This
sampling of rubbish feeds into the annual
Rubbish Report, which has been produced
by Clean Up every year since 1991.
O V E R A L L T R E NDS
This year the overall trends identified
contain both ‘good’ and ‘bad’ news.
The ‘good’ news is that the amount of
representative rubbish at each site has
decreased. The number of sites surveyed
decreased by 14% this year, as the
number of sites overall were less than the
previous year. Taking the decrease of site
numbers into account, the average number
of pieces counted at each site declined
from 408 in 2007, to 344 in 2008 – a
decrease of 15%. This decrease could be
perhaps a positive sign; that there is some
decline in people leaving rubbish in the
environment.
The ‘bad’ news is that the majority of this
rubbish is recyclable, and in theory, should
be ending up in a recycle facility rather
than in the environment. Plastic ranked the
top rubbish item once again, making up
31.7% of the total rubbish found – most of
the plastic items found are commonly
recyclable through usual municipal
collections. With measures such as efficient
public place recycling, together with
kerbside collections, many of these items
could be put back into the resource
stream, saving carbon emissions and the
environment.
The Top Ten most commonly found rubbish
items tend to have remained relatively
consistent over the years. Always the
number one most commonly found item is
the cigarette butt. This continues to be a
major waste issue across the country. The
act of littering cigarette butts has many
secondary effects such as bushfires, toxin
leaching and wildlife ingestion. Whilst
cigarette butts are not commonly
recyclable, there is no excuse for this item
not being disposed of properly.
Clean Up Australia © 2008 Page 5
RRuubbbbiisshh
RReeppoorrtt
22000088
E X E C U T I V E
S UMMAR Y
RUBBISH SURVEYED
� Of the 6,000 sites cleaned up
around Australia, 1,058 or 17.6%
were analysed for this report. The
% analysed was consistent with
last year’s participation in the
Rubbish Report.
� The total number of sites analysed
decreased from 1,203 to 1,058 – a
decline of 12%.
� The quality of data returned
increased on 2007 results, with
98% being determined as ‘valid’.
� More than 7,200 tonnes of rubbish
was collected during the Clean Up
Australia campaign across
Australia.
� This year a total of 363,854 items
formed the sample of rubbish counted for analysis.
SITES SURVEYED
� New South Wales (NSW) once
again returned the highest number
of surveys (421), and this year
Queensland (QLD) once again
returned the second most surveys
(223) ahead of Victoria (VIC)
(192).
� Roadways were the most surveyed
sites, accounting for 19.9% of all
sites surveyed.
� The least number of surveys were
completed at Shops / Malls,
accounting for 0.6% of all sites surveyed.
MAJOR SOURCES OF RUBBISH
� For the 14th consecutive year
plastics made up the majority of
rubbish collected accounting for
31.7% of surveyed rubbish. This is
slightly down from 2007 when
plastic was 33.1%, and 33.7% in
2006.
� Miscellaneous items moved up to
second place again (this source
dropped to 4th place in 2007) in
terms of being a major source of
rubbish. This category achieved
17.7% of the total because it
contains the number one rubbish
item found, cigarette butts.
� Metal / Aluminium was the third
largest source of rubbish making
up 14.6% of the total. This shows
an increase on last year from 5th
place, and 13.4%.
� Glass was found to make up 13.1%
of the total, a 2.4% decrease from
last year taking it down from
second to fourth place.
� Paper was the 5th most common
type of rubbish found (12.6%),
followed by Polystyrene (4.8%),
Wood (3.8%) and Rubber (1.7%)
THE TOP TEN RUBBISH ITEMS
� Cigarette Butts were once again
the most commonly found rubbish
item in 2008 for the 13th year in a
row, accounting for 29.6% of the
Top Ten, and 14.5% of all items
surveyed. This shows an increase
on 2006 of 5.9% among the Top
Ten, and 2.3% of all items.
� Glass alcoholic beverage containers
climbed to 2nd place from 4th place
from last year. The item
represented 5.4% of the Top Ten
and 11.1% of the total.
� Close behind was plastic chip and
confectionery bags, with 5.4% of
the Top Ten and 11.0% of all items
found, and holding a consistent 3rd
place again this year.
� Plastic bottle caps & lids ranked
fourth (4.2%) in the Top Ten and
made up 8.5% of the total rubbish
items surveyed.
� Glass pieces dropped to 5th place,
from 2nd last year, accounting for
3.7% of the Top Ten and 7.5% of
all items.
� PET drink containers rose from 9th
place to 6th place in 2008, making
up 3.6% of the Top Ten and 7.3%
of the total.
� Metal / Aluminium items took out
the next three rankings (7th, 8th
and 9th) with alcoholic beverage
cans making up 6.9% of the Top

Clean Up Australia © 2008 Page 6
RRuubbbbiisshh
RReeppoorrtt
22000088
Interesting items
found included: a
microwave oven, a
toilet, locked cash
boxes, Christmas
decorations,
binoculars, a
slippery dip!
Ten, soft drink cans at 6.6% and
metal bottle caps at 6.0%.
� The 10th most common items found
were small pieces of paper making
up 2.7% of the total items found
and 5.6% of the Top Ten.
� Glass soft drink bottles just missed
out on a Top Ten spot, coming in at
11th place and 2.7% of all rubbish items.
MOST POLLUTED SITE TYPES
� There was an overall decrease of
15% in the average pieces of
rubbish found at each site in 2008
from 408 to 344 pieces.
� Outdoor transport showed up as
the most ‘polluted’ site type with
the most pieces of rubbish found at
each site on average. The high
average value of 662 pieces per
site can be explained by the small
sample size of 7, and a couple of
sites finding a large number of a
particular type of rubbish such as
cigarette butts.
� Roadsides were in fact found to be
second most ‘polluted’ with an
average of 408 pieces per site. This
demonstrated a 15.5% increase on
the previous year and with one of
the highest sample sizes, this was
one of the only categories to have
found an increase in the number of
pieces found.
� The Park / Waterfront category
showed the third highest average
number of rubbish pieces per site
at 362, representing a 9.1%
decline on 2007 results.
� Rivers / Creeks also declined to
359 pieces (4%) on last year.
� School Grounds showed a marked
decline as well, of 28% and an
average of 341 pieces.
� Beach / Coastal areas and public
bushland decreased. With Public
Bushland being most notable with a
54% decrease.
� Shops / Malls declined by 58%
however as with Outdoor Transport
areas, this decline represents a
very small sample size.
� The overall decline on the number
of rubbish pieces at most site
types, giving an average of 344
pieces continues a longer term
trend of decline, with some
fluctuations. In 2004 there was an
average 592 pieces and in 2005 it
was 507 pieces, so this 15%
decline on last year is a strong
indication that rubbish at sites is declining.
K E Y F I ND I NG S
Clean Up Australia © 2008 Page 7
RRuubbbbiisshh
RReeppoorrtt
22000088
� The average pieces of rubbish at
each site dropped by an overall
15%, with most site types declining
in number; notably Public Bushland
by 54%. Roadsides went against
the trend and increased in their
average by 15.5%.
� The amount of recyclable materials
found dominated the Top Ten with
7 of the 10 items related to
beverage containers and commonly
recyclable – making up a total of
53.8% of the Top Ten.
� The number of cigarette butts
found experienced a decline from
2006 to 2007 and a 5.9% increase
in 2008. Cigarette butts still
dominate significantly, accounting
for over double of any other items
in the Top Ten.
� Eight out of the Top Ten items are related to packaging.
K E Y S U R V E Y
R E S U L T S
PLASTIC
Plastic was once again the most common
source of rubbish found accounting for
31.7% of all rubbish found (a 1.4%
decrease from 2007). This reveals a slight
trend of decline since 2004 when plastic
comprised 37% of all sources of rubbish.
Since 1991, Plastics have made up
between 26.8 and 41.4% of all rubbish
collected on Clean Up Day.
GLASS
The amount of glass rubbish surveyed
decreased this year to 13.3% (down 2.2%
from 2007). Interestingly, the usual top
category of glass pieces was overtaken by
glass alcoholic beverage bottles which
made up 41.5% of all glass, or 5.4% of the
total rubbish found.
MISCELLANEOUS
Miscellaneous items increased slightly
(3.3%) from last year, comprising 17.7%
of all items found. The main item in the
miscellaneous category which ranks this so
high is cigarette butts, which make up
82.3% of this category.
RUBBER
Rubber regained its place this year as the
smallest source of rubbish surveyed,
making up just 1.7% of the total, a decrease from 2.3% in 2007.
WOOD
Wood was also a relatively small source of
rubbish making up just 3.8% of all rubbish
found. This showed an increase of 2%
from 2007. Within this category, corks
accounted for 55.8%, ice cream sticks for
20.2% and construction materials for 15%.
PAPER AND CARDBOARD
Paper and Cardboard contributed 12.6% of
the total rubbish found, which was a
decrease from both 2006 and 2007 (down 3.3% over the two years).
METAL AND ALUMINIUM
Metal and Aluminium accounted for 14.6%
of the total sources of rubbish, which was
a slight increase of 0.7% from 2007. The
main four items which are found within this
category are alcoholic cans (23%), soft
drink cans (22%), bottle caps/lids (20.1%)
and foil / confectionary wrappers (14.4%).
POLYSTYRENE
Polystyrene was another relatively small
source of rubbish, making up 4.8% of the
total. This was a slight increase on last
year’s 4.4%, though a decrease from 2006 (5.2%).
ME THODO LOG Y
Clean Up Australia © 2008 Page 8
RRuubbbbiisshh
RReeppoorrtt
22000088
The Clean Up Australia Rubbish Report is a
snapshot of the rubbish collected on Clean
Up Australia Day. First produced in 1991,
the Rubbish Report has proven to be an
invaluable resource in identifying trends in
the types and dispersal of rubbish
throughout Australia and highlights the
importance of avoiding, reducing, re-using and recycling rubbish.
Rubbish Report Survey Forms are issued
with Clean Up kits to site coordinators. The
past few years, rubbish report forms have
been distributed to all site coordinators
and included as part of the ‘End of Clean
Up Report’ though still positioned as an
optional exercise. This has increased the
number of Rubbish Report surveys filled out.
The survey requires those taking part to
identify and count a proportion of the
rubbish collected at their site. One in five
bags of rubbish collected is analysed, with
a maximum of 10 bags surveyed per site.
If less than five bags are collected, the
contents of just one bag are counted. As
we begin to see an increase in sites which
separate recyclable items from non-
recyclable, this methodology will need an
adjustment so that a sample of both
recyclable and non-recyclable items is assured.
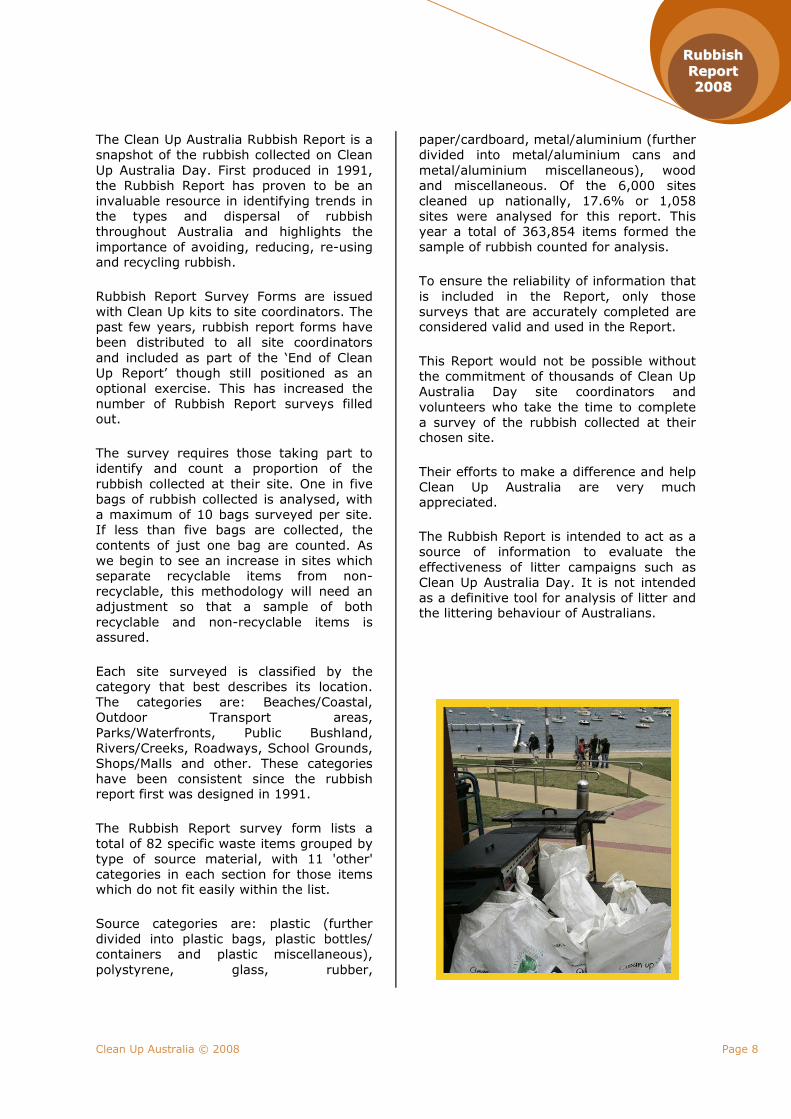
Each site surveyed is classified by the
category that best describes its location.
The categories are: Beaches/Coastal,
Outdoor Transport areas,
Parks/Waterfronts, Public Bushland,
Rivers/Creeks, Roadways, School Grounds,
Shops/Malls and other. These categories
have been consistent since the rubbish report first was designed in 1991.
The Rubbish Report survey form lists a
total of 82 specific waste items grouped by
type of source material, with 11 'other'
categories in each section for those items which do not fit easily within the list.
Source categories are: plastic (further
divided into plastic bags, plastic bottles/
containers and plastic miscellaneous),
polystyrene, glass, rubber,
paper/cardboard, metal/aluminium (further
divided into metal/aluminium cans and
metal/aluminium miscellaneous), wood
and miscellaneous. Of the 6,000 sites
cleaned up nationally, 17.6% or 1,058
sites were analysed for this report. This
year a total of 363,854 items formed the
sample of rubbish counted for analysis.
To ensure the reliability of information that
is included in the Report, only those
surveys that are accurately completed are considered valid and used in the Report.
This Report would not be possible without
the commitment of thousands of Clean Up
Australia Day site coordinators and
volunteers who take the time to complete
a survey of the rubbish collected at their chosen site.
Their efforts to make a difference and help
Clean Up Australia are very much appreciated.
The Rubbish Report is intended to act as a
source of information to evaluate the
effectiveness of litter campaigns such as
Clean Up Australia Day. It is not intended
as a definitive tool for analysis of litter and the littering behaviour of Australians.
Clean Up Australia © 2008 Page 9
RRuubbbbiisshh
RReeppoorrtt
22000088
SURV E Y ED S I T E S
Data on all rubbish items surveyed has been collated and presented into two large tables,
organised by Site Type and State.
Please refer to separate data tables ‘Surveyed Items by Site Type’ and ‘Surveyed Items by
State’ for all results.
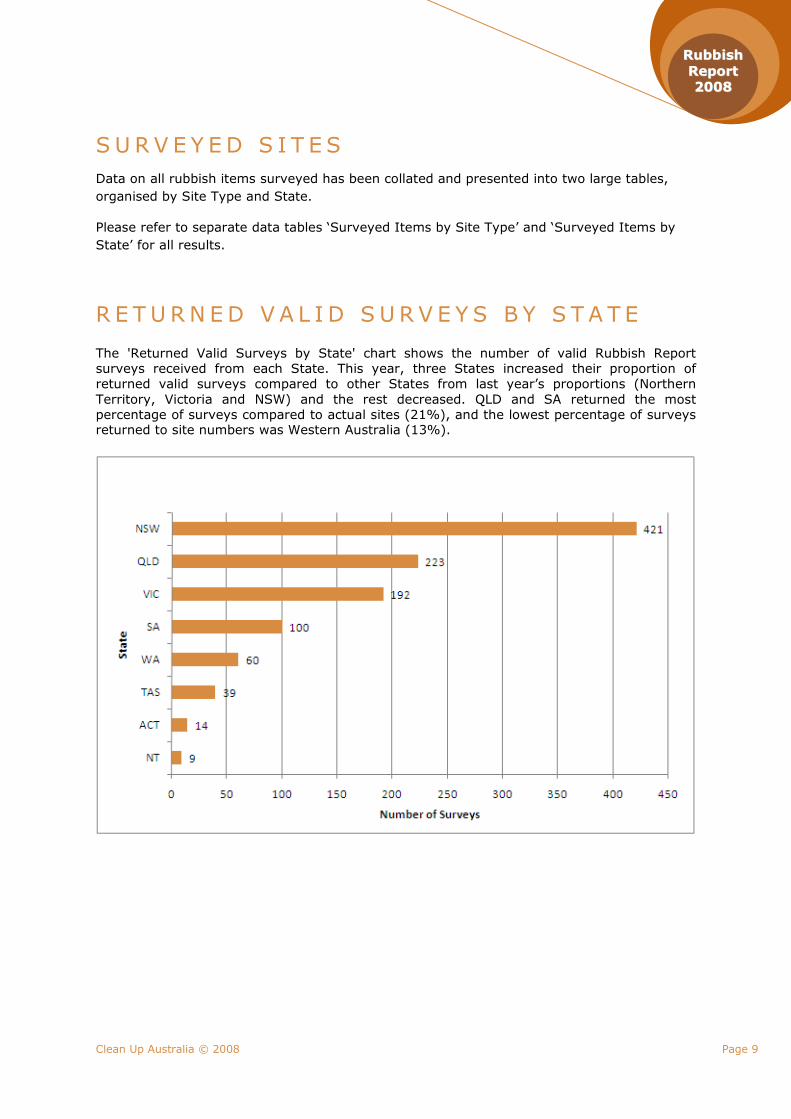
R E T U RN ED V A L I D S UR V E Y S B Y S T A T E
The 'Returned Valid Surveys by State' chart shows the number of valid Rubbish Report
surveys received from each State. This year, three States increased their proportion of
returned valid surveys compared to other States from last year’s proportions (Northern
Territory, Victoria and NSW) and the rest decreased. QLD and SA returned the most
percentage of surveys compared to actual sites (21%), and the lowest percentage of surveys returned to site numbers was Western Australia (13%).
Clean Up Australia © 2008 Page 10
RRuubbbbiisshh
RReeppoorrtt
22000088
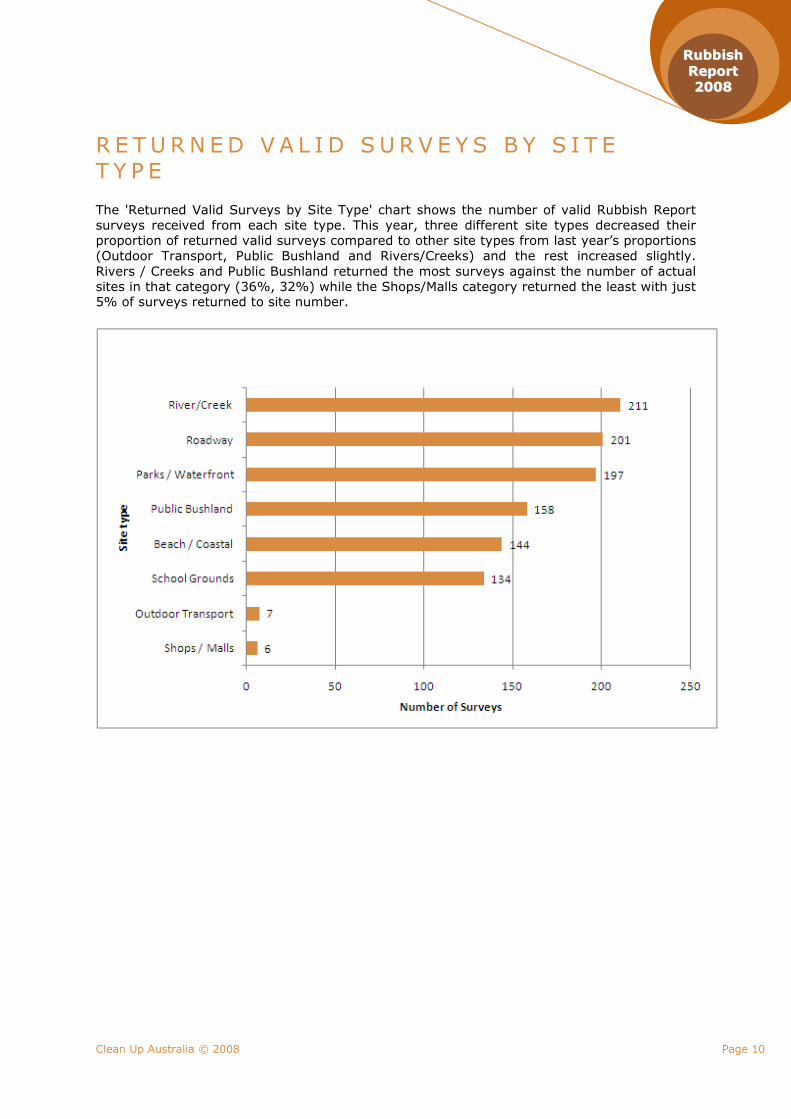
R E T U RN ED V A L I D S UR V E Y S B Y S I T E
T Y P E
The 'Returned Valid Surveys by Site Type' chart shows the number of valid Rubbish Report
surveys received from each site type. This year, three different site types decreased their
proportion of returned valid surveys compared to other site types from last year’s proportions
(Outdoor Transport, Public Bushland and Rivers/Creeks) and the rest increased slightly.
Rivers / Creeks and Public Bushland returned the most surveys against the number of actual
sites in that category (36%, 32%) while the Shops/Malls category returned the least with just 5% of surveys returned to site number.
Clean Up Australia © 2008 Page 11
RRuubbbbiisshh
RReeppoorrtt
22000088
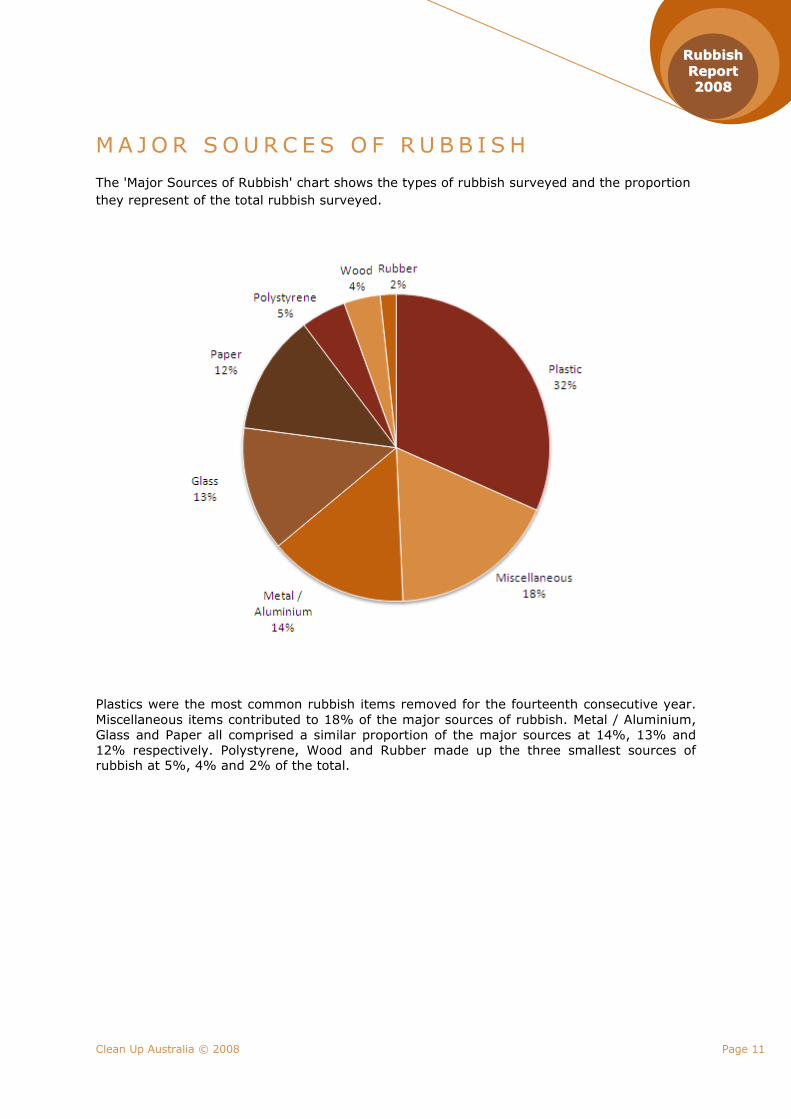
MA JO R S OURC E S O F R U B B I S H
The 'Major Sources of Rubbish' chart shows the types of rubbish surveyed and the proportion
they represent of the total rubbish surveyed.
Plastics were the most common rubbish items removed for the fourteenth consecutive year.
Miscellaneous items contributed to 18% of the major sources of rubbish. Metal / Aluminium,
Glass and Paper all comprised a similar proportion of the major sources at 14%, 13% and
12% respectively. Polystyrene, Wood and Rubber made up the three smallest sources of rubbish at 5%, 4% and 2% of the total.
Clean Up Australia © 2008 Page 12
RRuubbbbiisshh
RReeppoorrtt
22000088
H I S TO R I C A L COM P A R I S ON
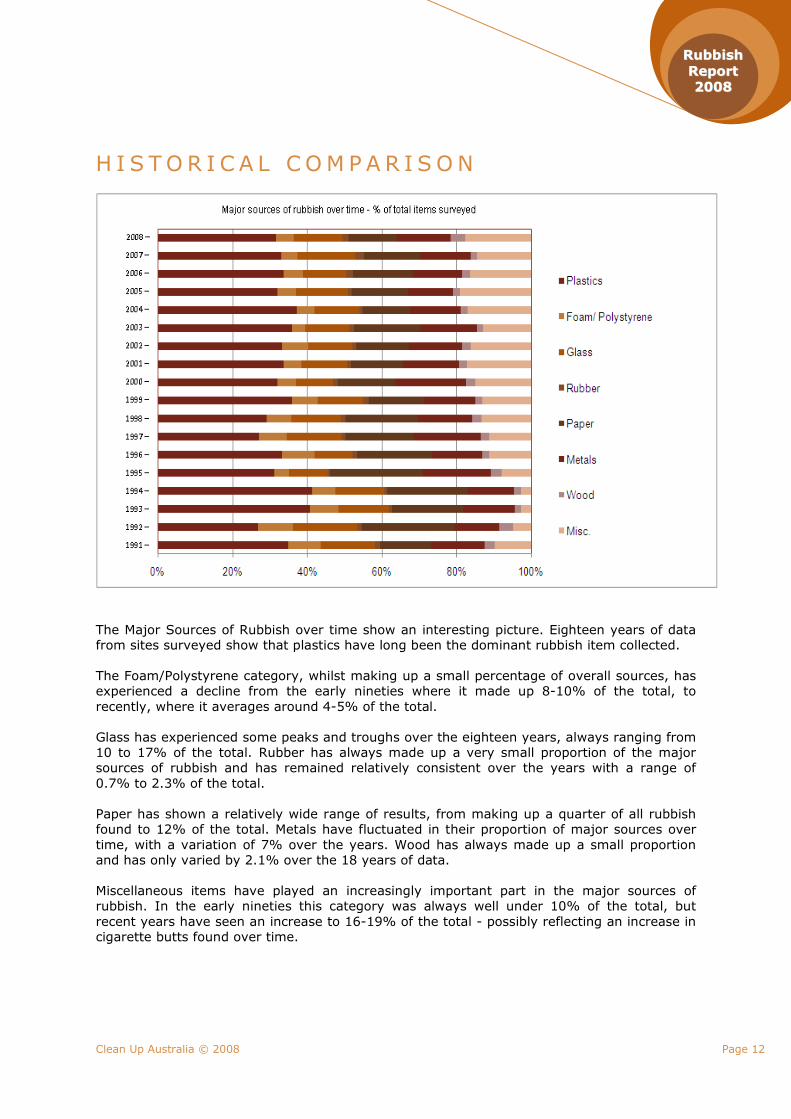
The Major Sources of Rubbish over time show an interesting picture. Eighteen years of data
from sites surveyed show that plastics have long been the dominant rubbish item collected.
The Foam/Polystyrene category, whilst making up a small percentage of overall sources, has
experienced a decline from the early nineties where it made up 8-10% of the total, to
recently, where it averages around 4-5% of the total.
Glass has experienced some peaks and troughs over the eighteen years, always ranging from
10 to 17% of the total. Rubber has always made up a very small proportion of the major
sources of rubbish and has remained relatively consistent over the years with a range of
0.7% to 2.3% of the total.
Paper has shown a relatively wide range of results, from making up a quarter of all rubbish
found to 12% of the total. Metals have fluctuated in their proportion of major sources over
time, with a variation of 7% over the years. Wood has always made up a small proportion
and has only varied by 2.1% over the 18 years of data.
Miscellaneous items have played an increasingly important part in the major sources of
rubbish. In the early nineties this category was always well under 10% of the total, but
recent years have seen an increase to 16-19% of the total - possibly reflecting an increase in
cigarette butts found over time.
Clean Up Australia © 2008 Page 13
RRuubbbbiisshh
RReeppoorrtt
22000088
Historical data used in this graph is shown here:
Year
Plastics
%
Foam/
Poly
%
Glass
%
Rubber
%
Paper
%
Metals
%
Wood
%
Misc.
%
Total
Items
%
1991 35.0 8.6 14.4 1.5 13.6 14.3 2.8 9.6 100.0
1992 26.8 9.5 17.1 1.2 24.9 11.9 3.7 4.8 100.0
1993 40.8 7.7 13.3 1.0 18.9 13.9 1.7 2.8 100.0
1994 41.4 6.3 13.0 0.7 21.6 12.3 2.0 2.6 100.0
1995 31.2 4.0 10.3 0.7 24.9 18.1 3.0 7.8 100.0
1996 33.4 8.7 10.1 1.3 19.9 13.6 1.8 11.2 100.0
1997 27.0 7.5 14.7 1.0 18.3 17.9 2.3 11.2 100.0
1998 29.1 6.6 13.4 1.2 19.5 14.5 2.4 13.3 100.0
1999 36.0 6.8 12.3 1.4 15.0 13.6 1.9 13.0 100.0
2000 32.1 4.9 10.1 1.2 15.2 19.1 2.5 14.9 100.0
2001 33.7 4.8 12.1 1.2 13.8 15.2 2.0 17.2 100.0
2002 33.4 6.9 11.8 1.2 14.1 14.1 2.3 16.2 100.0
2003 36.0 3.5 11.8 1.3 17.7 15.2 1.7 12.7 100.0
2004 37.3 4.8 11.8 1.0 12.7 13.5 1.9 17.0 100.0
2005 32.0 5.0 14.0 1.0 15.0 12.0 2.0 19.0 100.0
2006 33.7 5.2 11.7 1.8 15.9 13.2 2.1 16.4 100.0
2007 33.1 4.4 15.5 2.3 15.1 13.4 1.8 14.4 100.0
2008 31.7 4.8 13.1 1.7 12.6 14.6 3.8 17.7 100.0
Clean Up Australia © 2008 Page 14
RRuubbbbiisshh
RReeppoorrtt
22000088
MAJOR SOURCES OF RUBBISH – ANALYSIS OF
EACH CATEGORY
P L A S T I C
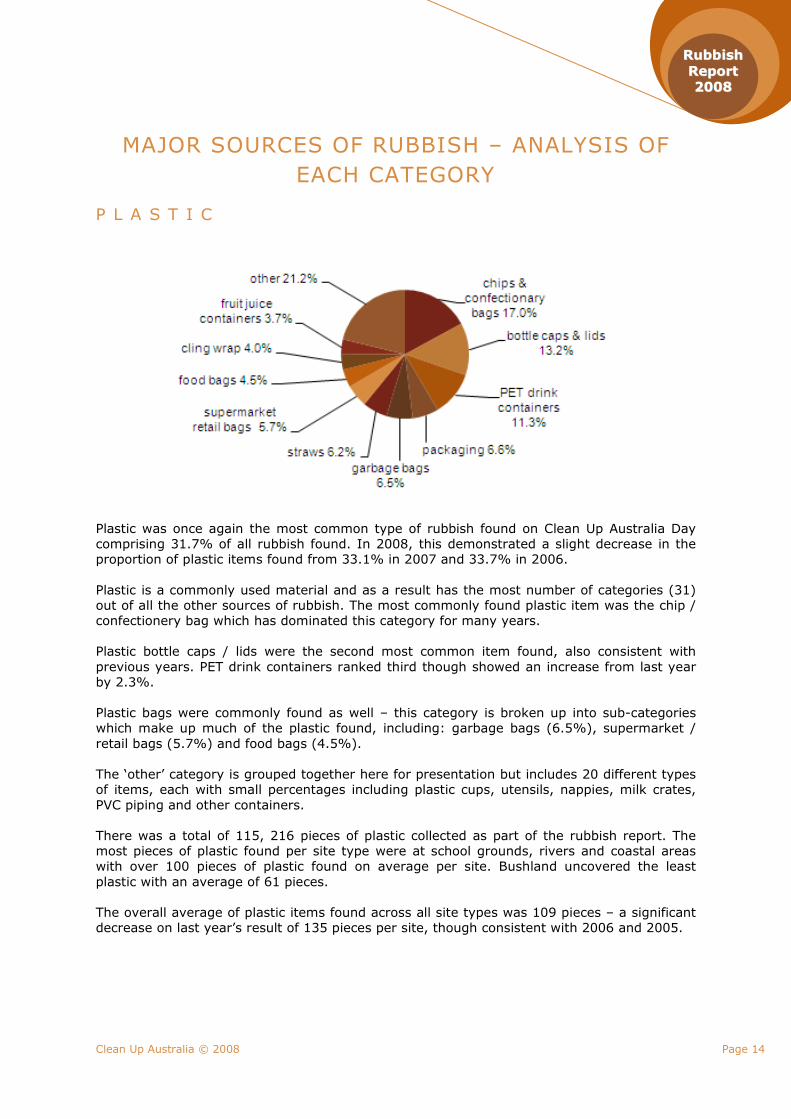
Plastic was once again the most common type of rubbish found on Clean Up Australia Day
comprising 31.7% of all rubbish found. In 2008, this demonstrated a slight decrease in the
proportion of plastic items found from 33.1% in 2007 and 33.7% in 2006.
Plastic is a commonly used material and as a result has the most number of categories (31)
out of all the other sources of rubbish. The most commonly found plastic item was the chip /
confectionery bag which has dominated this category for many years.
Plastic bottle caps / lids were the second most common item found, also consistent with
previous years. PET drink containers ranked third though showed an increase from last year
by 2.3%.
Plastic bags were commonly found as well – this category is broken up into sub-categories
which make up much of the plastic found, including: garbage bags (6.5%), supermarket /
retail bags (5.7%) and food bags (4.5%).
The ‘other’ category is grouped together here for presentation but includes 20 different types
of items, each with small percentages including plastic cups, utensils, nappies, milk crates,
PVC piping and other containers.
There was a total of 115, 216 pieces of plastic collected as part of the rubbish report. The
most pieces of plastic found per site type were at school grounds, rivers and coastal areas
with over 100 pieces of plastic found on average per site. Bushland uncovered the least
plastic with an average of 61 pieces.
The overall average of plastic items found across all site types was 109 pieces – a significant
decrease on last year’s result of 135 pieces per site, though consistent with 2006 and 2005.
Clean Up Australia © 2008 Page 15
RRuubbbbiisshh
RReeppoorrtt
22000088
P O L Y S T Y R E N E
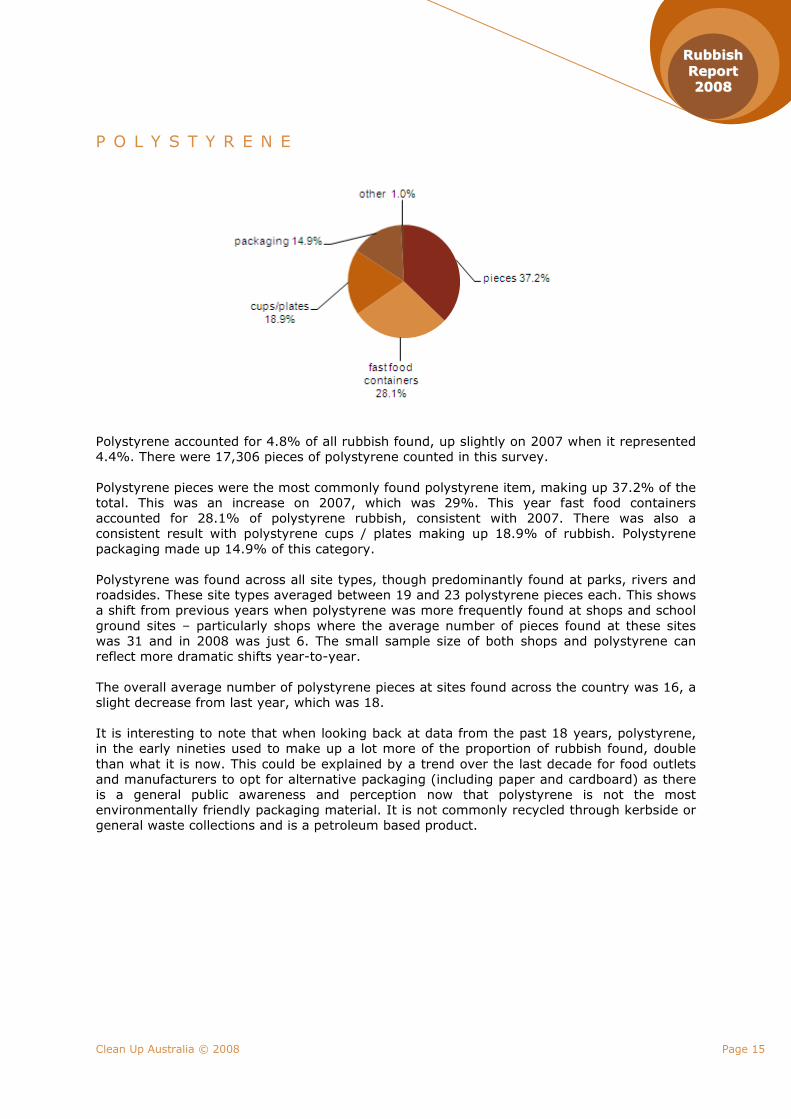
Polystyrene accounted for 4.8% of all rubbish found, up slightly on 2007 when it represented
4.4%. There were 17,306 pieces of polystyrene counted in this survey.
Polystyrene pieces were the most commonly found polystyrene item, making up 37.2% of the
total. This was an increase on 2007, which was 29%. This year fast food containers
accounted for 28.1% of polystyrene rubbish, consistent with 2007. There was also a
consistent result with polystyrene cups / plates making up 18.9% of rubbish. Polystyrene
packaging made up 14.9% of this category.
Polystyrene was found across all site types, though predominantly found at parks, rivers and
roadsides. These site types averaged between 19 and 23 polystyrene pieces each. This shows
a shift from previous years when polystyrene was more frequently found at shops and school
ground sites – particularly shops where the average number of pieces found at these sites
was 31 and in 2008 was just 6. The small sample size of both shops and polystyrene can
reflect more dramatic shifts year-to-year.
The overall average number of polystyrene pieces at sites found across the country was 16, a
slight decrease from last year, which was 18.
It is interesting to note that when looking back at data from the past 18 years, polystyrene,
in the early nineties used to make up a lot more of the proportion of rubbish found, double
than what it is now. This could be explained by a trend over the last decade for food outlets
and manufacturers to opt for alternative packaging (including paper and cardboard) as there
is a general public awareness and perception now that polystyrene is not the most
environmentally friendly packaging material. It is not commonly recycled through kerbside or
general waste collections and is a petroleum based product.
Clean Up Australia © 2008 Page 16
RRuubbbbiisshh
RReeppoorrtt
22000088
G L A S
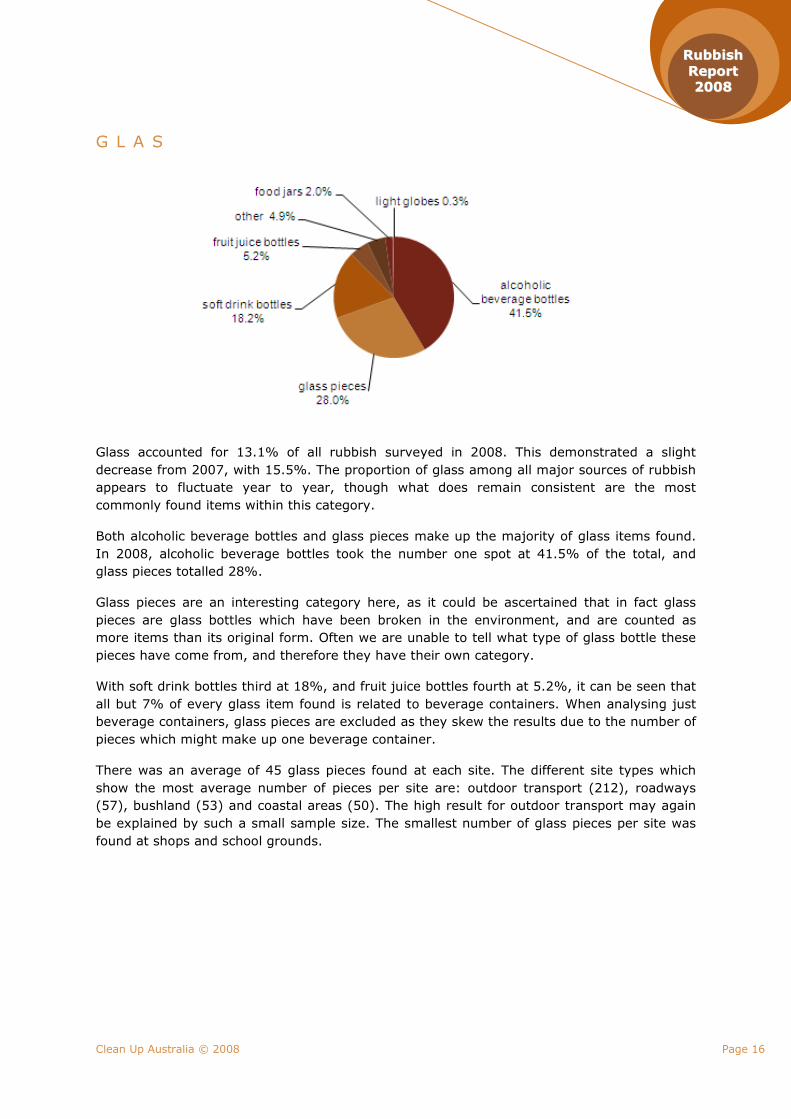
Glass accounted for 13.1% of all rubbish surveyed in 2008. This demonstrated a slight
decrease from 2007, with 15.5%. The proportion of glass among all major sources of rubbish
appears to fluctuate year to year, though what does remain consistent are the most
commonly found items within this category.
Both alcoholic beverage bottles and glass pieces make up the majority of glass items found.
In 2008, alcoholic beverage bottles took the number one spot at 41.5% of the total, and
glass pieces totalled 28%.
Glass pieces are an interesting category here, as it could be ascertained that in fact glass
pieces are glass bottles which have been broken in the environment, and are counted as
more items than its original form. Often we are unable to tell what type of glass bottle these
pieces have come from, and therefore they have their own category.
With soft drink bottles third at 18%, and fruit juice bottles fourth at 5.2%, it can be seen that
all but 7% of every glass item found is related to beverage containers. When analysing just
beverage containers, glass pieces are excluded as they skew the results due to the number of
pieces which might make up one beverage container.
There was an average of 45 glass pieces found at each site. The different site types which
show the most average number of pieces per site are: outdoor transport (212), roadways
(57), bushland (53) and coastal areas (50). The high result for outdoor transport may again
be explained by such a small sample size. The smallest number of glass pieces per site was
found at shops and school grounds.
Clean Up Australia © 2008 Page 17
RRuubbbbiisshh
RReeppoorrtt
22000088
R U B B E R
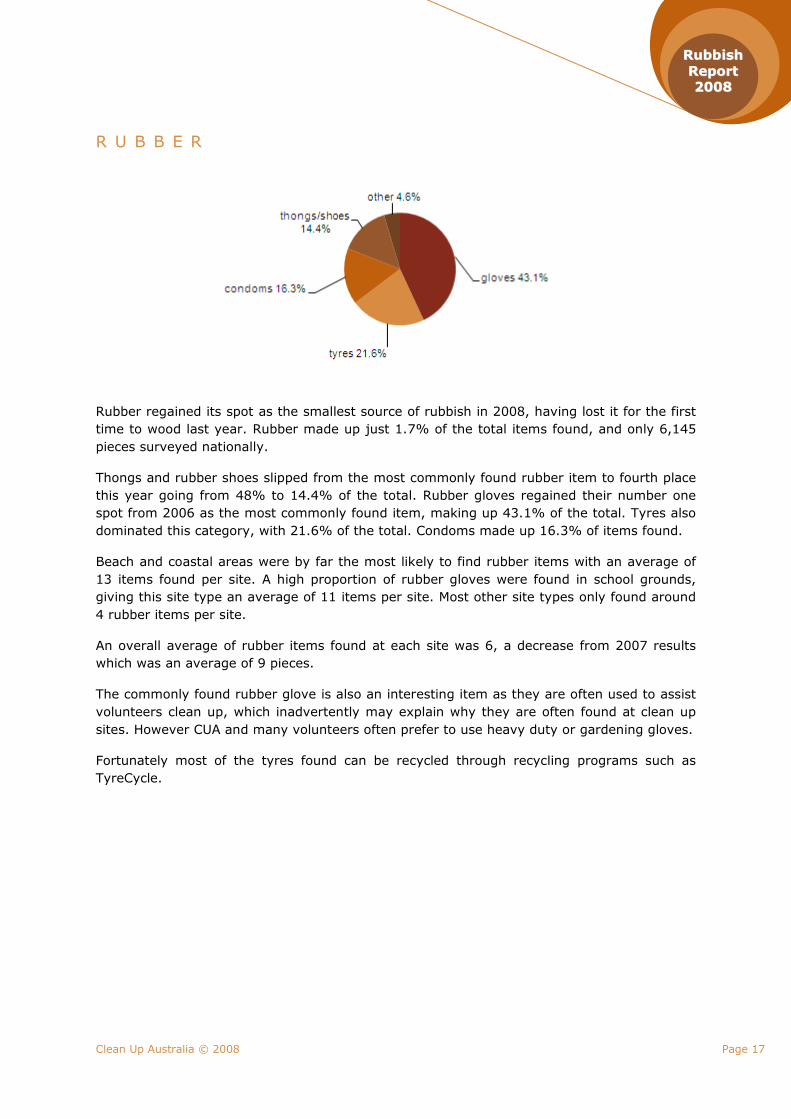
Rubber regained its spot as the smallest source of rubbish in 2008, having lost it for the first
time to wood last year. Rubber made up just 1.7% of the total items found, and only 6,145
pieces surveyed nationally.
Thongs and rubber shoes slipped from the most commonly found rubber item to fourth place
this year going from 48% to 14.4% of the total. Rubber gloves regained their number one
spot from 2006 as the most commonly found item, making up 43.1% of the total. Tyres also
dominated this category, with 21.6% of the total. Condoms made up 16.3% of items found.
Beach and coastal areas were by far the most likely to find rubber items with an average of
13 items found per site. A high proportion of rubber gloves were found in school grounds,
giving this site type an average of 11 items per site. Most other site types only found around
4 rubber items per site.
An overall average of rubber items found at each site was 6, a decrease from 2007 results
which was an average of 9 pieces.
The commonly found rubber glove is also an interesting item as they are often used to assist
volunteers clean up, which inadvertently may explain why they are often found at clean up
sites. However CUA and many volunteers often prefer to use heavy duty or gardening gloves.
Fortunately most of the tyres found can be recycled through recycling programs such as
TyreCycle.
Clean Up Australia © 2008 Page 18
RRuubbbbiisshh
RReeppoorrtt
22000088
P A P E R & C A R D B O A R D
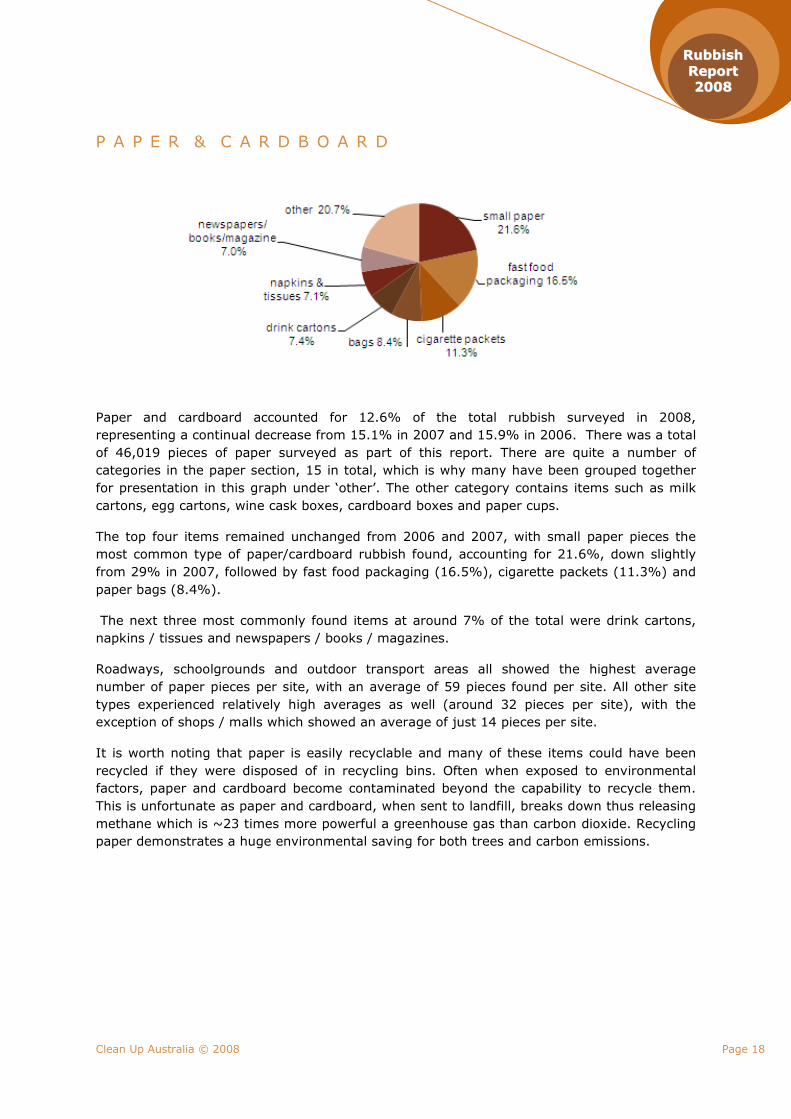
Paper and cardboard accounted for 12.6% of the total rubbish surveyed in 2008,
representing a continual decrease from 15.1% in 2007 and 15.9% in 2006. There was a total
of 46,019 pieces of paper surveyed as part of this report. There are quite a number of
categories in the paper section, 15 in total, which is why many have been grouped together
for presentation in this graph under ‘other’. The other category contains items such as milk
cartons, egg cartons, wine cask boxes, cardboard boxes and paper cups.
The top four items remained unchanged from 2006 and 2007, with small paper pieces the
most common type of paper/cardboard rubbish found, accounting for 21.6%, down slightly
from 29% in 2007, followed by fast food packaging (16.5%), cigarette packets (11.3%) and
paper bags (8.4%).
The next three most commonly found items at around 7% of the total were drink cartons,
napkins / tissues and newspapers / books / magazines.
Roadways, schoolgrounds and outdoor transport areas all showed the highest average
number of paper pieces per site, with an average of 59 pieces found per site. All other site
types experienced relatively high averages as well (around 32 pieces per site), with the
exception of shops / malls which showed an average of just 14 pieces per site.
It is worth noting that paper is easily recyclable and many of these items could have been
recycled if they were disposed of in recycling bins. Often when exposed to environmental
factors, paper and cardboard become contaminated beyond the capability to recycle them.
This is unfortunate as paper and cardboard, when sent to landfill, breaks down thus releasing
methane which is ~23 times more powerful a greenhouse gas than carbon dioxide. Recycling
paper demonstrates a huge environmental saving for both trees and carbon emissions.
Clean Up Australia © 2008 Page 19
RRuubbbbiisshh
RReeppoorrtt
22000088
M E T A L / A L U M I N I U M
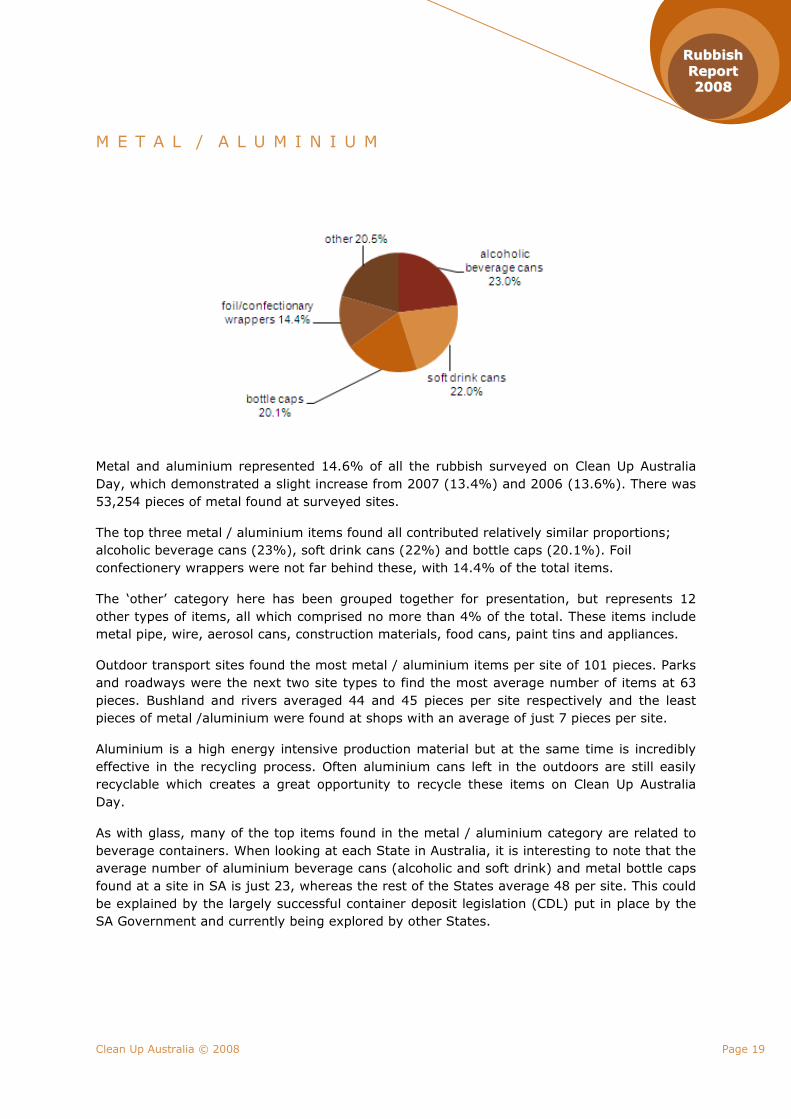
Metal and aluminium represented 14.6% of all the rubbish surveyed on Clean Up Australia
Day, which demonstrated a slight increase from 2007 (13.4%) and 2006 (13.6%). There was
53,254 pieces of metal found at surveyed sites.
The top three metal / aluminium items found all contributed relatively similar proportions;
alcoholic beverage cans (23%), soft drink cans (22%) and bottle caps (20.1%). Foil
confectionery wrappers were not far behind these, with 14.4% of the total items.
The ‘other’ category here has been grouped together for presentation, but represents 12
other types of items, all which comprised no more than 4% of the total. These items include
metal pipe, wire, aerosol cans, construction materials, food cans, paint tins and appliances.
Outdoor transport sites found the most metal / aluminium items per site of 101 pieces. Parks
and roadways were the next two site types to find the most average number of items at 63
pieces. Bushland and rivers averaged 44 and 45 pieces per site respectively and the least
pieces of metal /aluminium were found at shops with an average of just 7 pieces per site.
Aluminium is a high energy intensive production material but at the same time is incredibly
effective in the recycling process. Often aluminium cans left in the outdoors are still easily
recyclable which creates a great opportunity to recycle these items on Clean Up Australia
Day.
As with glass, many of the top items found in the metal / aluminium category are related to
beverage containers. When looking at each State in Australia, it is interesting to note that the
average number of aluminium beverage cans (alcoholic and soft drink) and metal bottle caps
found at a site in SA is just 23, whereas the rest of the States average 48 per site. This could
be explained by the largely successful container deposit legislation (CDL) put in place by the
SA Government and currently being explored by other States.
Clean Up Australia © 2008 Page 20
RRuubbbbiisshh
RReeppoorrtt
22000088
W O O D
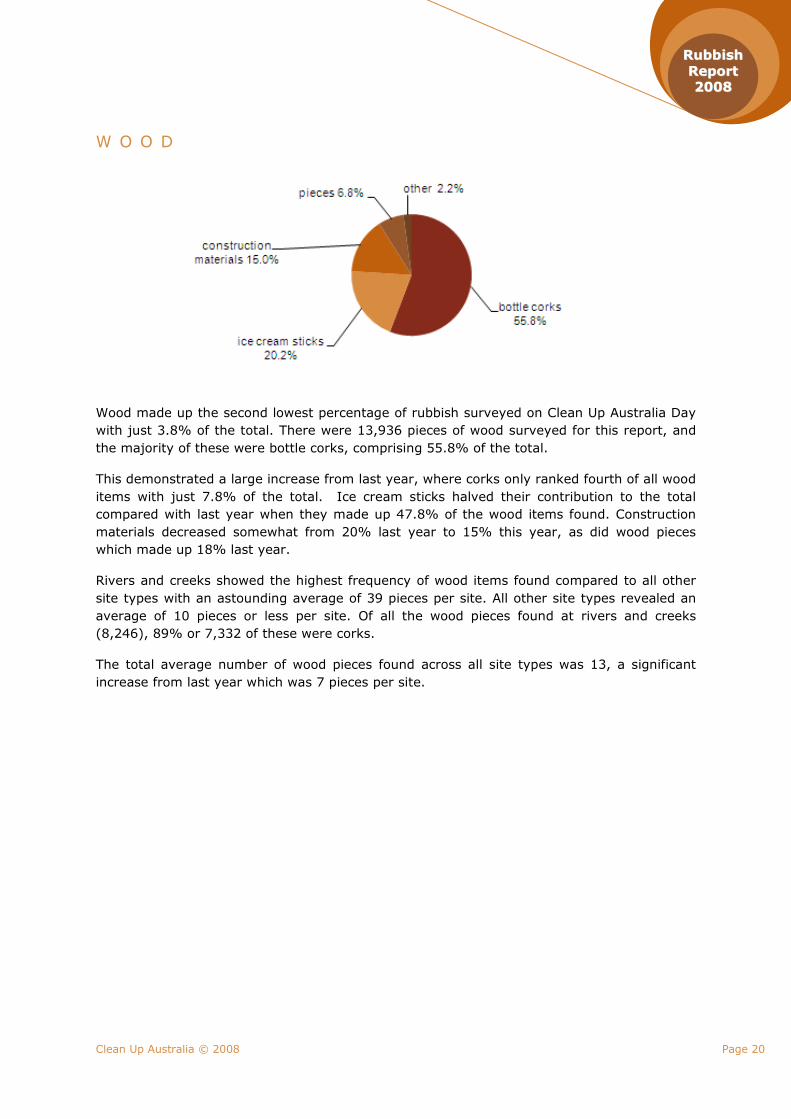
Wood made up the second lowest percentage of rubbish surveyed on Clean Up Australia Day
with just 3.8% of the total. There were 13,936 pieces of wood surveyed for this report, and
the majority of these were bottle corks, comprising 55.8% of the total.
This demonstrated a large increase from last year, where corks only ranked fourth of all wood
items with just 7.8% of the total. Ice cream sticks halved their contribution to the total
compared with last year when they made up 47.8% of the wood items found. Construction
materials decreased somewhat from 20% last year to 15% this year, as did wood pieces
which made up 18% last year.
Rivers and creeks showed the highest frequency of wood items found compared to all other
site types with an astounding average of 39 pieces per site. All other site types revealed an
average of 10 pieces or less per site. Of all the wood pieces found at rivers and creeks
(8,246), 89% or 7,332 of these were corks.
The total average number of wood pieces found across all site types was 13, a significant
increase from last year which was 7 pieces per site.
Clean Up Australia © 2008 Page 21
RRuubbbbiisshh
RReeppoorrtt
22000088
M I S C E L L A N E O U S
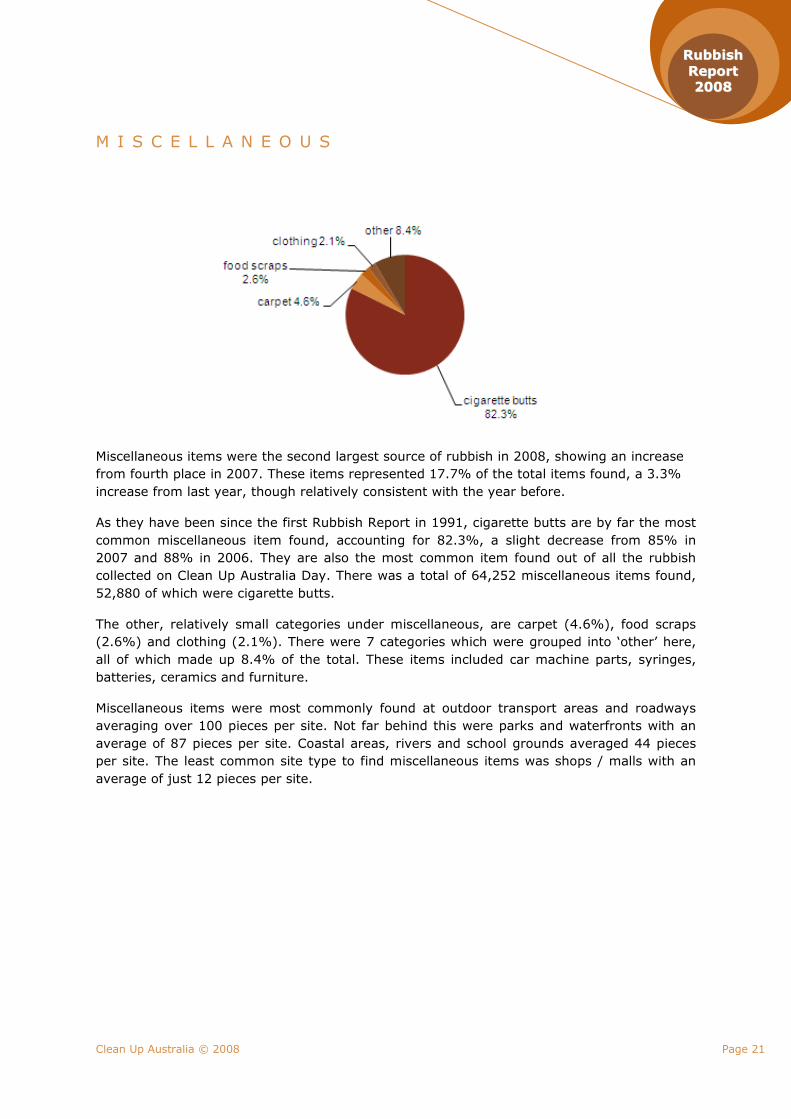
Miscellaneous items were the second largest source of rubbish in 2008, showing an increase
from fourth place in 2007. These items represented 17.7% of the total items found, a 3.3%
increase from last year, though relatively consistent with the year before.
As they have been since the first Rubbish Report in 1991, cigarette butts are by far the most
common miscellaneous item found, accounting for 82.3%, a slight decrease from 85% in
2007 and 88% in 2006. They are also the most common item found out of all the rubbish
collected on Clean Up Australia Day. There was a total of 64,252 miscellaneous items found,
52,880 of which were cigarette butts.
The other, relatively small categories under miscellaneous, are carpet (4.6%), food scraps
(2.6%) and clothing (2.1%). There were 7 categories which were grouped into ‘other’ here,
all of which made up 8.4% of the total. These items included car machine parts, syringes,
batteries, ceramics and furniture.
Miscellaneous items were most commonly found at outdoor transport areas and roadways
averaging over 100 pieces per site. Not far behind this were parks and waterfronts with an
average of 87 pieces per site. Coastal areas, rivers and school grounds averaged 44 pieces
per site. The least common site type to find miscellaneous items was shops / malls with an
average of just 12 pieces per site.
Clean Up Australia © 2008 Page 22
RRuubbbbiisshh
RReeppoorrtt
22000088
THE TOP TEN RUBBISH ITEMS
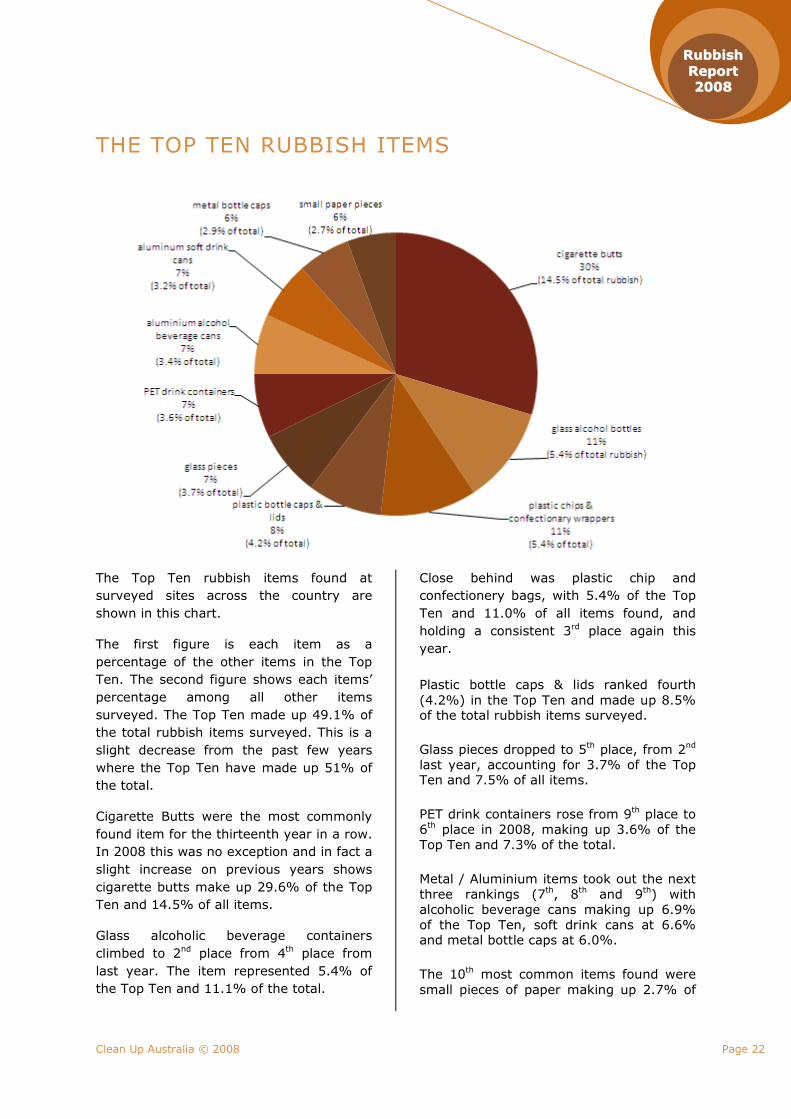
The Top Ten rubbish items found at
surveyed sites across the country are
shown in this chart.
The first figure is each item as a
percentage of the other items in the Top
Ten. The second figure shows each items’
percentage among all other items
surveyed. The Top Ten made up 49.1% of
the total rubbish items surveyed. This is a
slight decrease from the past few years
where the Top Ten have made up 51% of
the total.
Cigarette Butts were the most commonly
found item for the thirteenth year in a row.
In 2008 this was no exception and in fact a
slight increase on previous years shows
cigarette butts make up 29.6% of the Top
Ten and 14.5% of all items.
Glass alcoholic beverage containers
climbed to 2nd place from 4th place from
last year. The item represented 5.4% of
the Top Ten and 11.1% of the total.
Close behind was plastic chip and
confectionery bags, with 5.4% of the Top
Ten and 11.0% of all items found, and
holding a consistent 3rd place again this
year.
Plastic bottle caps & lids ranked fourth
(4.2%) in the Top Ten and made up 8.5% of the total rubbish items surveyed.
Glass pieces dropped to 5th place, from 2nd
last year, accounting for 3.7% of the Top Ten and 7.5% of all items.
PET drink containers rose from 9th place to
6th place in 2008, making up 3.6% of the
Top Ten and 7.3% of the total.
Metal / Aluminium items took out the next
three rankings (7th, 8th and 9th) with
alcoholic beverage cans making up 6.9%
of the Top Ten, soft drink cans at 6.6% and metal bottle caps at 6.0%.
The 10th most common items found were
small pieces of paper making up 2.7% of
Clean Up Australia © 2008 Page 23
RRuubbbbiisshh
RReeppoorrtt
22000088
the total items found and 5.6% of the Top Ten.
Glass soft drink bottles just missed out on
a Top Ten spot, coming in at 11th place
and 2.7% of all rubbish items.
Seven of the Top Ten items were related
to beverage containers including bottle
caps and glass pieces. These beverage
container related items made up 26.4% of
the Top Ten, and 53.8% of all rubbish
items.
Plastic supermarket bags slipped a further
few places to 18th from last year’s 15th
place. There was a decrease in their
percentage of total rubbish from 2.1% to
1.8%.
The same seven of the Top Ten items
which are related to beverage containers
also are the recyclable items among the
Top Ten.
Glass alcoholic beverage bottles, plastic
bottle caps & lids, glass pieces, PET drink
containers, aluminium alcoholic beverage
cans, soft drink cans and metal bottle caps
are all now recyclable.
Cigarette butts, chips and confectionery
wrappers and small paper pieces
(presuming they are contaminated from
being in the environment) are not easily
recyclable.
MOST ‘POLLUTED ’ S ITES
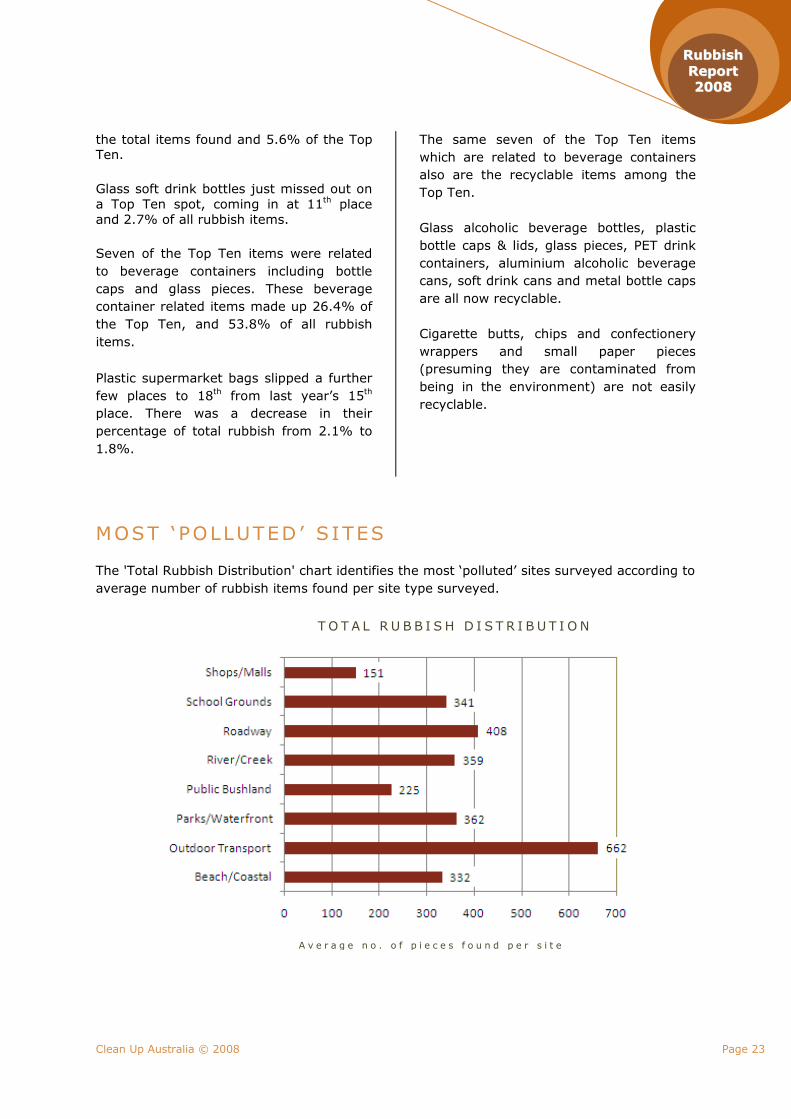
The 'Total Rubbish Distribution' chart identifies the most ‘polluted’ sites surveyed according to
average number of rubbish items found per site type surveyed.
T O T A L R U B B I S H D I S T R I B U T I O N
A v e r a g e n o . o f p i e c e s f o u n d p e r s i t e
Clean Up Australia © 2008 Page 24
RRuubbbbiisshh
RReeppoorrtt
22000088
Glass is 100%
recyclable.
Over 30% of the
raw material used
in glass
production now
comes from
recycled glass.
There was an overall decrease of 15% in
the average pieces of rubbish found at each site in 2008 from 408 to 344 pieces.
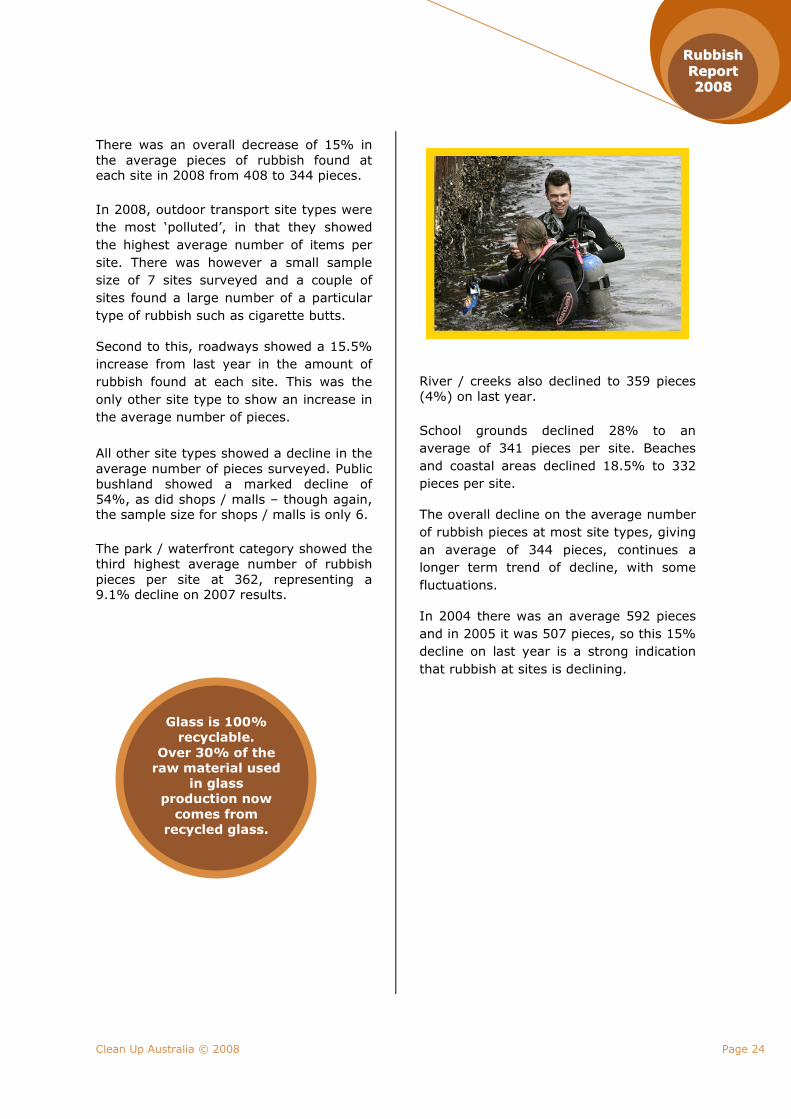
In 2008, outdoor transport site types were
the most ‘polluted’, in that they showed
the highest average number of items per
site. There was however a small sample
size of 7 sites surveyed and a couple of
sites found a large number of a particular
type of rubbish such as cigarette butts.
Second to this, roadways showed a 15.5%
increase from last year in the amount of
rubbish found at each site. This was the
only other site type to show an increase in
the average number of pieces.
All other site types showed a decline in the
average number of pieces surveyed. Public
bushland showed a marked decline of
54%, as did shops / malls – though again, the sample size for shops / malls is only 6.
The park / waterfront category showed the
third highest average number of rubbish
pieces per site at 362, representing a 9.1% decline on 2007 results.
River / creeks also declined to 359 pieces
(4%) on last year.
School grounds declined 28% to an
average of 341 pieces per site. Beaches
and coastal areas declined 18.5% to 332
pieces per site.
The overall decline on the average number
of rubbish pieces at most site types, giving
an average of 344 pieces, continues a
longer term trend of decline, with some
fluctuations.
In 2004 there was an average 592 pieces
and in 2005 it was 507 pieces, so this 15%
decline on last year is a strong indication
that rubbish at sites is declining.
Clean Up Australia © 2008 Page 25
RRuubbbbiisshh
RReeppoorrtt
22000088
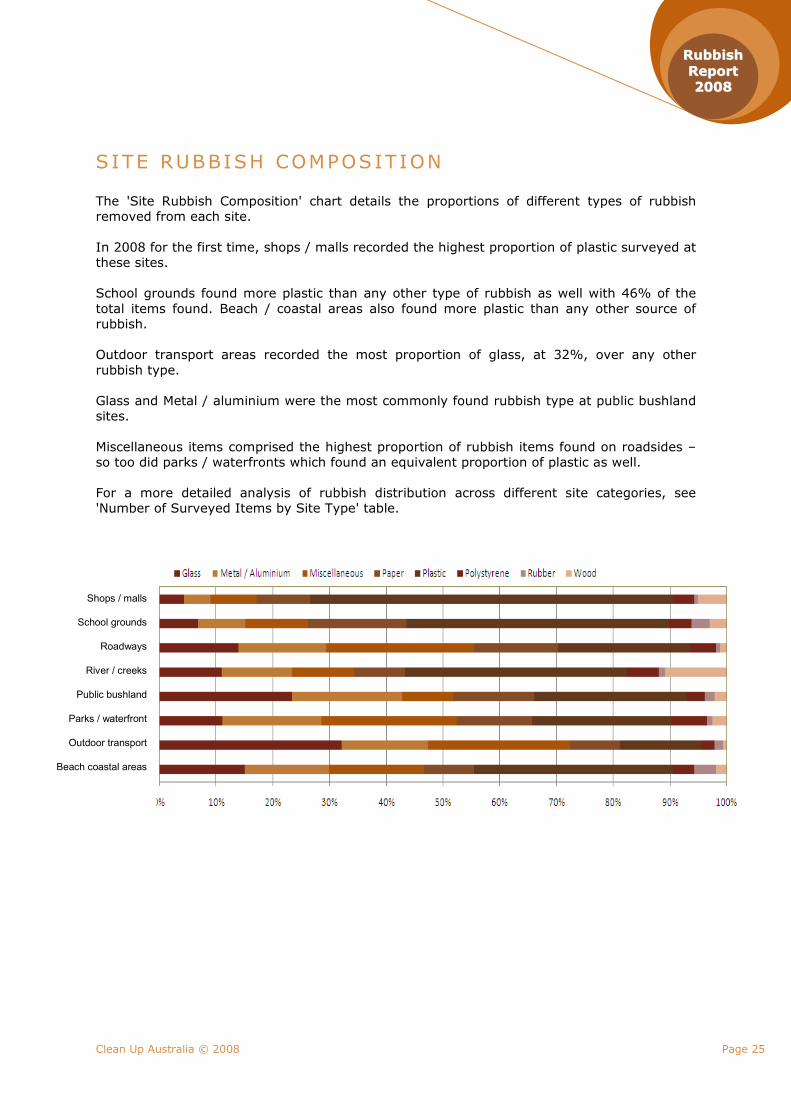
SITE RUBBISH COMPOSIT ION
The 'Site Rubbish Composition' chart details the proportions of different types of rubbish
removed from each site.
In 2008 for the first time, shops / malls recorded the highest proportion of plastic surveyed at
these sites.
School grounds found more plastic than any other type of rubbish as well with 46% of the
total items found. Beach / coastal areas also found more plastic than any other source of
rubbish.
Outdoor transport areas recorded the most proportion of glass, at 32%, over any other
rubbish type.
Glass and Metal / aluminium were the most commonly found rubbish type at public bushland
sites.
Miscellaneous items comprised the highest proportion of rubbish items found on roadsides –
so too did parks / waterfronts which found an equivalent proportion of plastic as well.
For a more detailed analysis of rubbish distribution across different site categories, see
'Number of Surveyed Items by Site Type' table.
Shops / malls
School grounds
Roadways
River / creeks
Public bushland
Parks / waterfront
Outdoor transport
Beach coastal areas
Clean Up Australia © 2008 Page 26
RRuubbbbiisshh
RReeppoorrtt
22000088
CASE STUDY – THE
BARWON RIVER
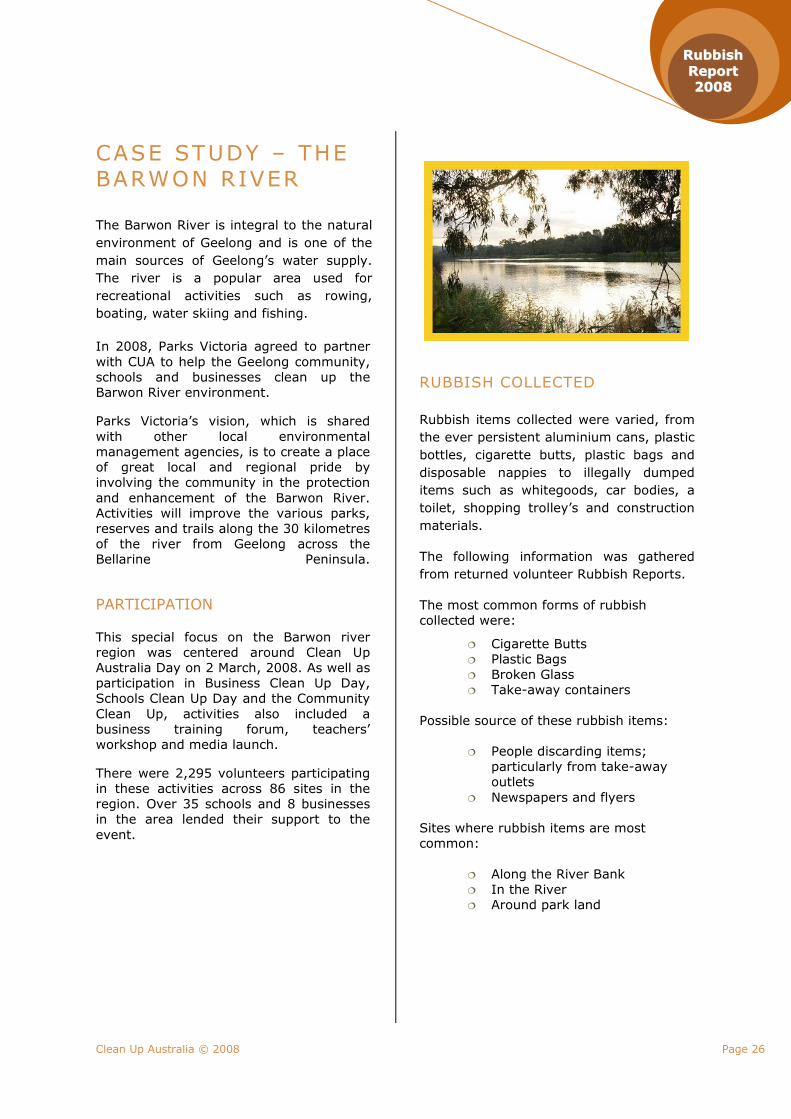
The Barwon River is integral to the natural
environment of Geelong and is one of the
main sources of Geelong’s water supply.
The river is a popular area used for
recreational activities such as rowing,
boating, water skiing and fishing.
In 2008, Parks Victoria agreed to partner
with CUA to help the Geelong community,
schools and businesses clean up the
Barwon River environment.
Parks Victoria’s vision, which is shared
with other local environmental
management agencies, is to create a place
of great local and regional pride by
involving the community in the protection
and enhancement of the Barwon River.
Activities will improve the various parks,
reserves and trails along the 30 kilometres
of the river from Geelong across the
Bellarine Peninsula.
PARTICIPATION
This special focus on the Barwon river
region was centered around Clean Up
Australia Day on 2 March, 2008. As well as
participation in Business Clean Up Day,
Schools Clean Up Day and the Community
Clean Up, activities also included a
business training forum, teachers’
workshop and media launch.
There were 2,295 volunteers participating
in these activities across 86 sites in the
region. Over 35 schools and 8 businesses
in the area lended their support to the
event.
RUBBISH COLLECTED
Rubbish items collected were varied, from
the ever persistent aluminium cans, plastic
bottles, cigarette butts, plastic bags and
disposable nappies to illegally dumped
items such as whitegoods, car bodies, a
toilet, shopping trolley’s and construction
materials.
The following information was gathered
from returned volunteer Rubbish Reports.
The most common forms of rubbish
collected were:
� Cigarette Butts
� Plastic Bags
� Broken Glass
� Take-away containers
Possible source of these rubbish items:
� People discarding items;
particularly from take-away
outlets
� Newspapers and flyers
Sites where rubbish items are most
common:
� Along the River Bank
� In the River
� Around park land
Clean Up Australia © 2008 Page 27
RRuubbbbiisshh
RReeppoorrtt
22000088
RECYCLING TRIAL
Local councils have played a vital role in
the success of Clean Up Australia Day in
two major ways: firstly, by promoting the
event to community groups and secondly
by collecting the rubbish after the event.
In 2008, a total of 75 groups (schools,
business and community) were involved in
a recycling trial.
As part of the Barwon River focus, CUA
trialled a recycling program in five council
areas:
• Greater Geelong City Council
• Queenscliffe Borough
• Colac-Otway Shire Council
• Golden Plains Shire Council
• Surf City Coast Shire Council
Materials provided to site coordinators for
Clean Up Australia Day traditionally
included white polypropylene bags for
rubbish collection.
As part of this trial, each registered site
coordinator, whose site fell within these
council areas, was issued with 15 yellow
recycling bags.
Each yellow recycling bag listed which
items should be placed in the bag,
including: aluminium cans, glass bottles,
steel cans, plastic containers, clean paper
or cardboard.
CUA would like to be able to use this trial
to accurately report on the recyclable
items which have been diverted from
landfill. The raw materials and energy
savings would then be calculable and
together we could communicate the
benefit of Clean Up Australia Day, not only
in terms of removing rubbish but also in
terms of resource recovery and carbon
emissions saved.
Barwon Regional Waste Management
Group (BRWMG) has been retained to sort
and record the recyclables collected in the
region.
From the Rubbish Report results, a sample
of 10 sites was taken from across the
Barwon Region. These 10 sites were made
up of:
� 1 beach / coastal site
� 1 public bushland
� 3 school grounds
� 3 parks / waterways
� 2 roadways
All 10 of these sites participated in the
recycling trial. It can be seen how effective
recycling can be on clean up sites by
looking at the composition of the rubbish
collected and the potential for it to be
recycled.
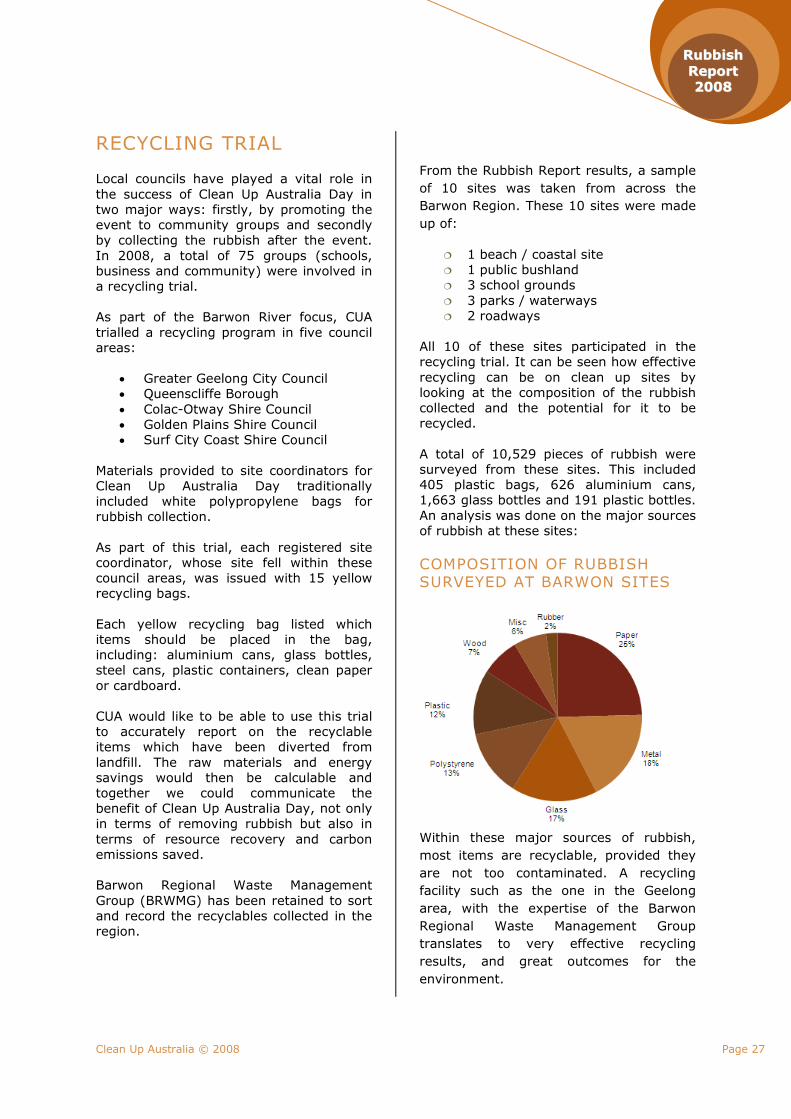
A total of 10,529 pieces of rubbish were
surveyed from these sites. This included
405 plastic bags, 626 aluminium cans,
1,663 glass bottles and 191 plastic bottles.
An analysis was done on the major sources
of rubbish at these sites:
COMPOSITION OF RUBBISH
SURVEYED AT BARWON SITES
Within these major sources of rubbish,
most items are recyclable, provided they
are not too contaminated. A recycling
facility such as the one in the Geelong
area, with the expertise of the Barwon
Regional Waste Management Group
translates to very effective recycling
results, and great outcomes for the
environment.
Clean Up Australia © 2008 Page 28
RRuubbbbiisshh
RReeppoorrtt
22000088
MAJOR SPONSORS
SPONSORS
SUPPLIERS
For more information visit www.cleanup.org.au or call 1800 CUA DAY (1800 282 329).
Clean Up Australia Ltd, 18 Bridge Road, Glebe NSW 2037
Recommended