Clean Miles Standard Workshop2018 Base Year Emissions Inventory
September 25, 2019
1

Purpose
• Establish 2018 base year emissions inventory • Discuss data sources, methodology and assumptions• Present preliminary results • Solicit feedback on the assumptions
2

Important Note• The data analysis and results presented in this workshop
are preliminary• The analysis is conducted using March 2019 data
submittals• Staff has worked closely with TNCs since March to QA/QC
the data – updates were incorporated• Preliminary results presented in this workshop may not
reflect all of the latest updates
3
Outline
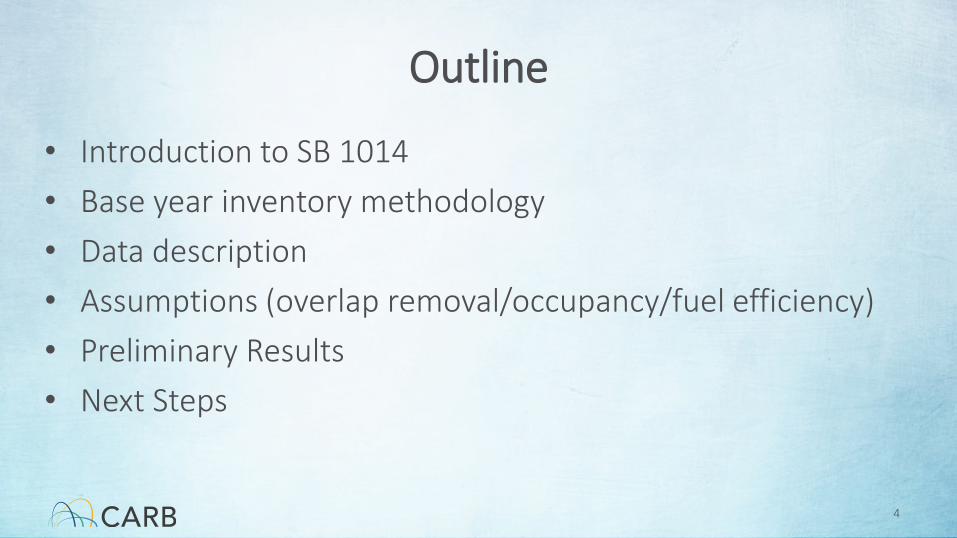
• Introduction to SB 1014• Base year inventory methodology• Data description• Assumptions (overlap removal/occupancy/fuel efficiency)• Preliminary Results• Next Steps
4

Clean Miles Standard
5
(Introduction) (Methodology) (Data Description) (Overlap Removal) (Occupancy) (Fuel Efficiency) (Preliminary Results)

Transportation Network Companies• California Public Utilities Commission (CPUC) Definition: “A
Transportation Network Company (TNC) is a company or organization operating in California that provides transportation services using an online-enabled platform to connect passengers with drivers using their personal vehicles.”
• In California, the CPUC oversees regulation and permitting of TNCs such as charter-party carriers. There may up to 14 different companies providing services
6
(Introduction) (Methodology) (Data Description) (Overlap Removal) (Occupancy) (Fuel Efficiency) (Preliminary Results)

Principles of the New Regulation1. Decrease GHG emissions and increase zero-emission miles2. Promote pooling, active transport, and transit usage3. Forward-looking with automated vehicles4. Aligned with other State policies5. Maximize transportation access equity
7
(Introduction) (Methodology) (Data Description) (Overlap Removal) (Occupancy) (Fuel Efficiency) (Preliminary Results)

Base Year Emissions Inventory • SB1014 requires CARB to establish a GHG base year (2018)
emissions for TNCs on a per passenger mile
8
(Introduction) (Methodology) (Data Description) (Overlap Removal) (Occupancy) (Fuel Efficiency) (Preliminary Results)
Affect PMT

Periods Defined for TNC Miles
9
(Introduction) (Methodology) (Data Description) (Overlap Removal) (Occupancy) (Fuel Efficiency) (Preliminary Results)

10
Grams CO2
PMT=
VMT (miles) x Real World Fuel Consumption (gal/mi) x Conversion Factor (gCO2/gal)
Ride VMT (miles) x Occupancy + Active/Transit PMT
VMT in periods 1, 2, & 3
Only period 3 VMT Does not include driver
Fuel Dependent
Assumed - zero
• Fuel economy Affects the numerator only
• Increasing fuel economy reduces• TNC gCO2/PMT • CA Fleet GHGs• No affect on VMT
• Deadheading affects only the numerator• Decreasing deadhead VMT reduces
• TNC gCO2/PMT • CA Fleet GHGs• CA Fleet VMT
• Occupancy affects only the denominator
• Increasing occupancy reduces • TNC gCO2/PMT
Methodology(Introduction) (Methodology) (Data Description) (Overlap Removal) (Occupancy) (Fuel Efficiency) (Preliminary Results)

Data Description• CARB received approximately 1.4 billion trip records for
600k vehicles operating for TNCs• Data from 14 TNC companies received in March, 2019• Data issues: Faulty VINs; Self-overlapping trips
11
1. Unique trip ID2. Unique driver ID3. Vehicle ID number 4. Make and model name
5. Trip periods (P1,P2,P3)6. Vehicle miles traveled(VMT) by period7. Date/time for trips start and end8. Zip codes
9. Latitude and longitude 10. Average speeds11. Pooled or shared rides12. Surge period
Data Fields
(Introduction) (Methodology) (Data Description) (Overlap Removal) (Occupancy) (Fuel Efficiency) (Preliminary Results)

Some preliminary statistics…
12
(Introduction) (Methodology) (Data Description) (Overlap Removal) (Occupancy) (Fuel Efficiency) (Preliminary Results)
* Total VMT/ Number of P3 Trips

13
Grams CO2
PMT=
VMT (miles) x Real World Fuel Consumption x Conversion Factor
Ride VMT (miles) x Occupancy + Active/Transit PMT
MethodologyLet’s start with VMT and Ride VMT
(Introduction) (Methodology) (Data Description) (Overlap Removal) (Occupancy) (Fuel Efficiency) (Preliminary Results)
• Calculating actual VMT• Revising data to identify unique, real VMT for each vehicle

Multi-Apping• A common practice of drivers being available for service on
multiple platforms at the same time.• To avoid double counting, instances of multi-apping should be
identified and removed accordingly (i.e., “combined”)
14
Company A
Company B
Combined
P1P2P3?
(Introduction) (Methodology) (Data Description) (Overlap Removal) (Occupancy) (Fuel Efficiency) (Preliminary Results)
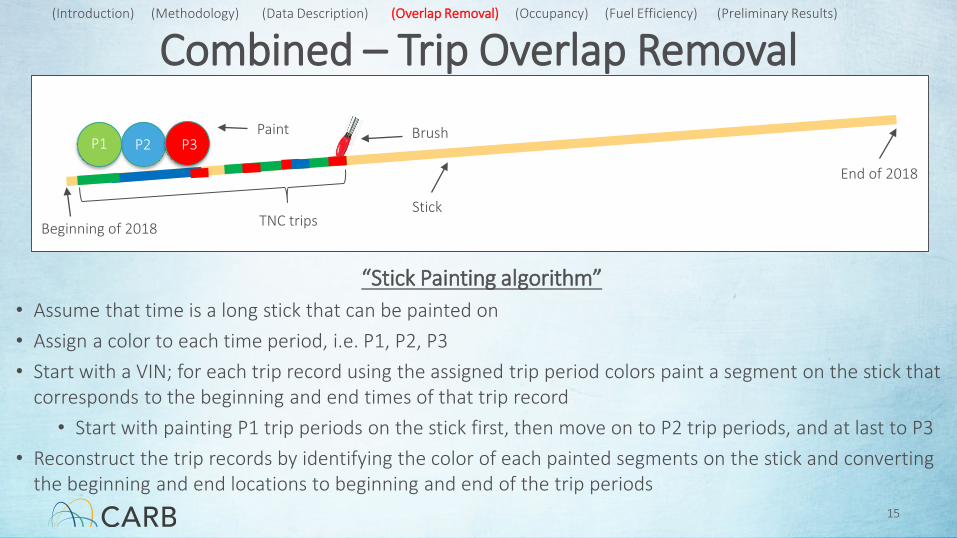
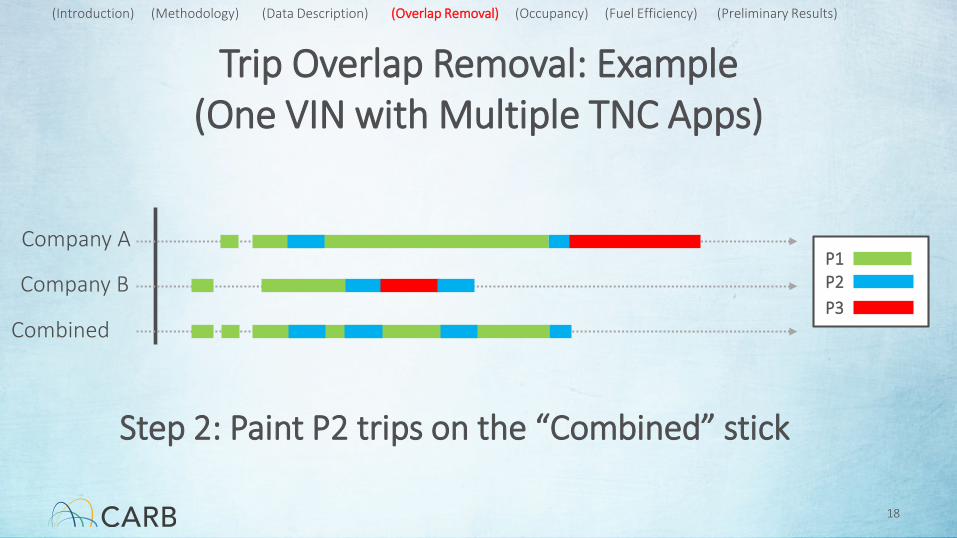
Combined – Trip Overlap Removal
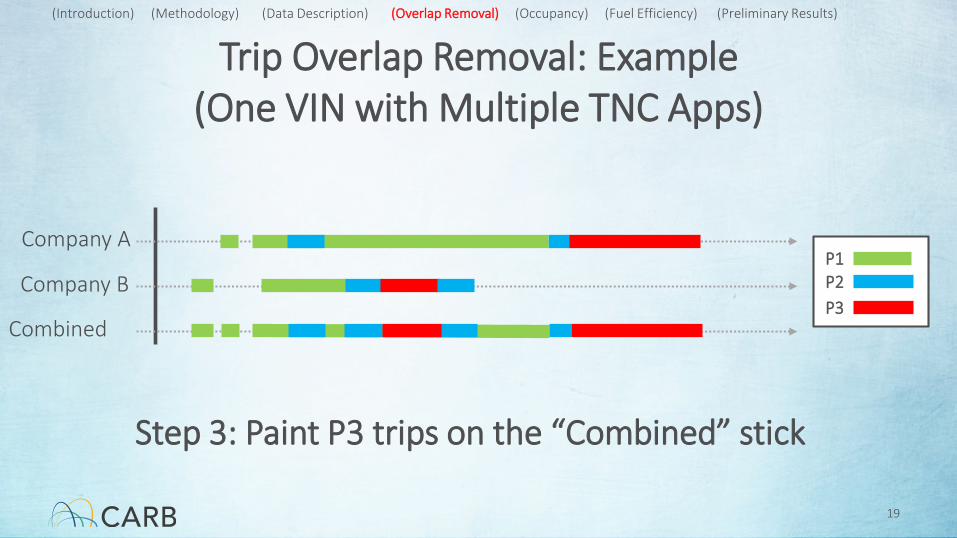
“Stick Painting algorithm”• Assume that time is a long stick that can be painted on• Assign a color to each time period, i.e. P1, P2, P3• Start with a VIN; for each trip record using the assigned trip period colors paint a segment on the stick that
corresponds to the beginning and end times of that trip record• Start with painting P1 trip periods on the stick first, then move on to P2 trip periods, and at last to P3
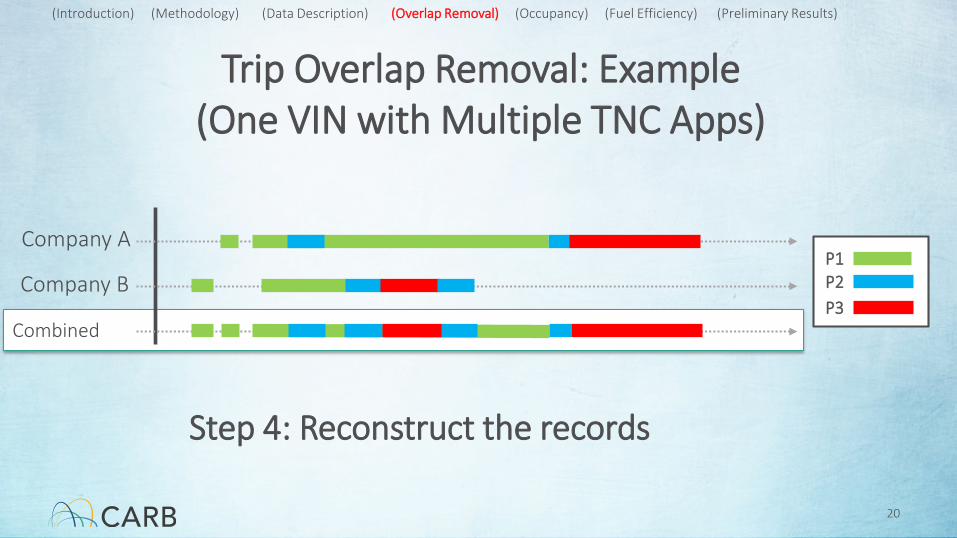
• Reconstruct the trip records by identifying the color of each painted segments on the stick and converting the beginning and end locations to beginning and end of the trip periods
15
Beginning of 2018
End of 2018
TNC tripsStick
BrushPaintP1 P2 P3
(Introduction) (Methodology) (Data Description) (Overlap Removal) (Occupancy) (Fuel Efficiency) (Preliminary Results)

Trip Overlap Removal: Example (One VIN with Multiple TNC Apps)
16
Company A
Company B
Combined
P1P2P3?
(Introduction) (Methodology) (Data Description) (Overlap Removal) (Occupancy) (Fuel Efficiency) (Preliminary Results)

Trip Overlap Removal: Example (One VIN with Multiple TNC Apps)
17
Combined
P1P2P3
Step 1: Paint P1 trips on the “Combined” stick
Company A
Company B
(Introduction) (Methodology) (Data Description) (Overlap Removal) (Occupancy) (Fuel Efficiency) (Preliminary Results)
Trip Overlap Removal: Example (One VIN with Multiple TNC Apps)
18
Combined
P1P2P3
Step 2: Paint P2 trips on the “Combined” stick
Company A
Company B
(Introduction) (Methodology) (Data Description) (Overlap Removal) (Occupancy) (Fuel Efficiency) (Preliminary Results)
Trip Overlap Removal: Example (One VIN with Multiple TNC Apps)
19
Combined
P1P2P3
Step 3: Paint P3 trips on the “Combined” stick
Company A
Company B
(Introduction) (Methodology) (Data Description) (Overlap Removal) (Occupancy) (Fuel Efficiency) (Preliminary Results)
Trip Overlap Removal: Example (One VIN with Multiple TNC Apps)
20
Combined
P1P2P3
Step 4: Reconstruct the records
Company A
Company B
(Introduction) (Methodology) (Data Description) (Overlap Removal) (Occupancy) (Fuel Efficiency) (Preliminary Results)

21
Grams CO2
PMT=
VMT (miles) x Real World Fuel Consumption x Conversion Factor
Ride VMT (miles) x Occupancy + Active/Transit PMT
Methodology
Occupancy is a key factor determining PMT
(Introduction) (Methodology) (Data Description) (Overlap Removal) (Occupancy) (Fuel Efficiency) (Preliminary Results)
• Occupancy data is not provided by TNCs

Occupancy
• CA fleet average occupancy (PMT/VMT) is 1.68, estimated using data from the 2010 – 2012 California Household Travel Survey
• Scientific studies have found the following on average occupancy for TNCs:
a) Circella et.al 2019 CA average occupancies: 1.90 (N = 1,287)
b) Henao et.al 2018 Colorado average occupancy = 1.34 (N = 416)
• CARB has also conducted an in-house study to collect occupancy information
22
Weekday = 1.69, Weeknight = 1.93,Weekend Day = 1.95, Weekend Night = 2.16
(Introduction) (Methodology) (Data Description) (Overlap Removal) (Occupancy) (Fuel Efficiency) (Preliminary Results)

CARB Occupancy Project
• Goal: Determine occupancy rates for pooled and non-pooled rides, and collect activity information to develop drive cycles
23
• 2 week study period • TNC drivers maintain a daily trip diary• Data loggers record on-board vehicle data
(Introduction) (Methodology) (Data Description) (Overlap Removal) (Occupancy) (Fuel Efficiency) (Preliminary Results)
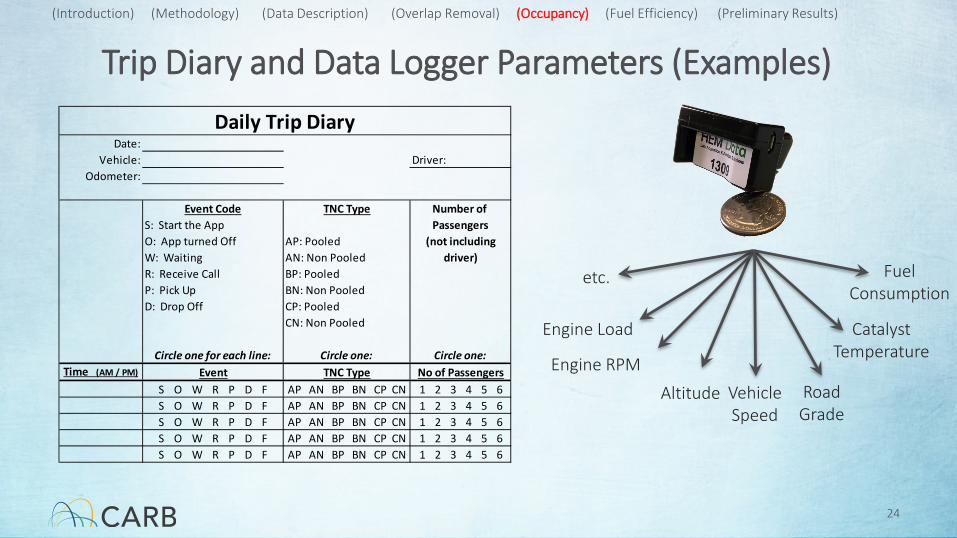
Trip Diary and Data Logger Parameters (Examples)
24
Engine RPMVehicle Speed
Catalyst Temperature
Fuel Consumption
Engine Load
Road Grade
Altitude
etc.
(Introduction) (Methodology) (Data Description) (Overlap Removal) (Occupancy) (Fuel Efficiency) (Preliminary Results)
Date:Vehicle: Driver:
Odometer:
Event Code TNC Type Number of S: Start the App PassengersO: App turned Off AP: Pooled (not includingW: Waiting AN: Non Pooled driver)R: Receive Call BP: PooledP: Pick Up BN: Non PooledD: Drop Off CP: Pooled
CN: Non Pooled
Circle one for each line: Circle one: Circle one:Time (AM / PM) Event TNC Type No of Passengers
S O W R P D F AP AN BP BN CP CN 1 2 3 4 5 6S O W R P D F AP AN BP BN CP CN 1 2 3 4 5 6S O W R P D F AP AN BP BN CP CN 1 2 3 4 5 6S O W R P D F AP AN BP BN CP CN 1 2 3 4 5 6S O W R P D F AP AN BP BN CP CN 1 2 3 4 5 6
Daily Trip Diary
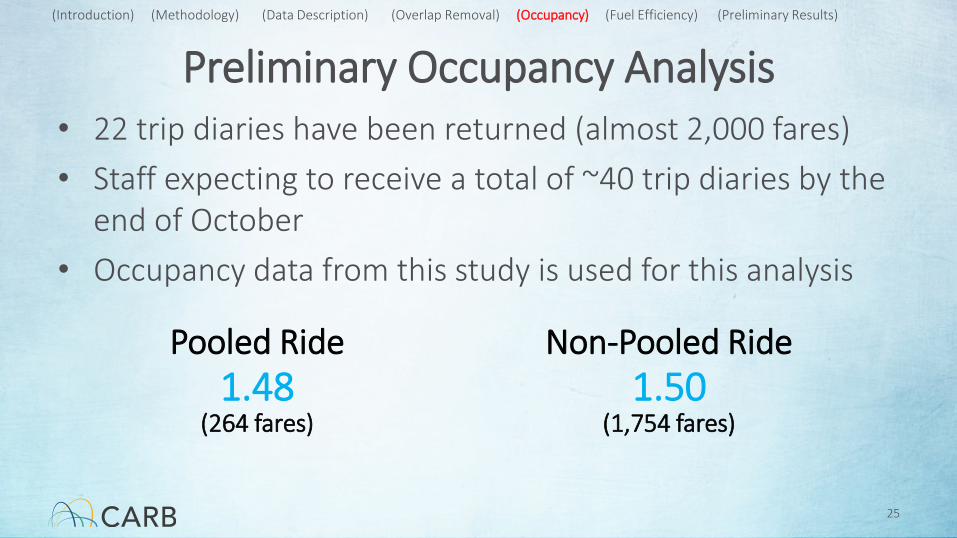
Preliminary Occupancy Analysis• 22 trip diaries have been returned (almost 2,000 fares) • Staff expecting to receive a total of ~40 trip diaries by the
end of October• Occupancy data from this study is used for this analysis
25
Pooled Ride1.48
Non-Pooled Ride1.50
(264 fares) (1,754 fares)
(Introduction) (Methodology) (Data Description) (Overlap Removal) (Occupancy) (Fuel Efficiency) (Preliminary Results)
26
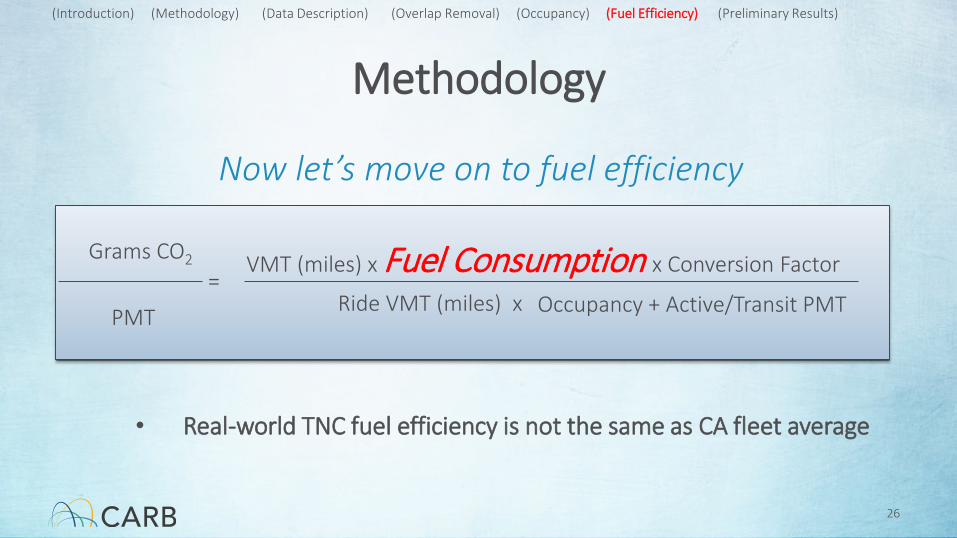
Grams CO2
PMT=
VMT (miles) x Fuel Consumption x Conversion Factor
Ride VMT (miles) x Occupancy + Active/Transit PMT
Methodology
Now let’s move on to fuel efficiency
(Introduction) (Methodology) (Data Description) (Overlap Removal) (Occupancy) (Fuel Efficiency) (Preliminary Results)
• Real-world TNC fuel efficiency is not the same as CA fleet average
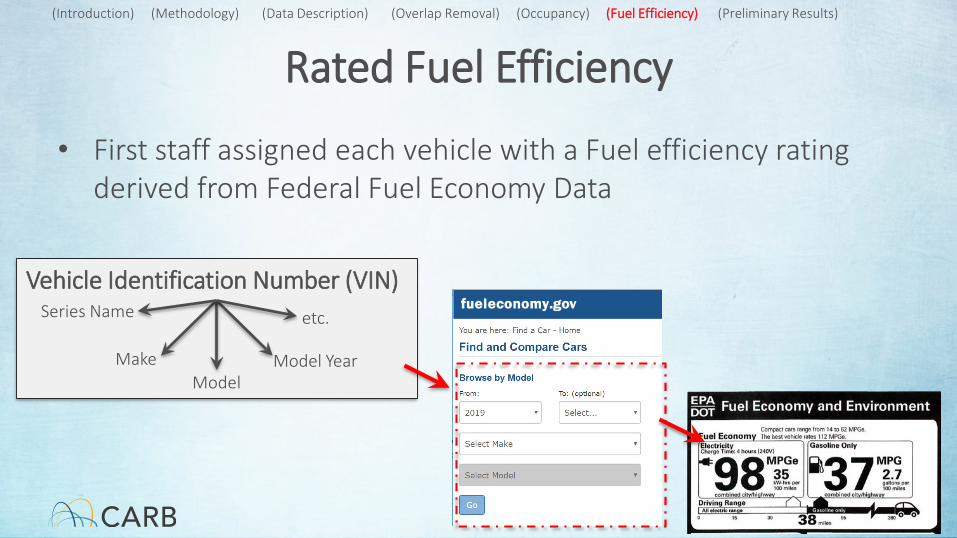
Rated Fuel Efficiency
• First staff assigned each vehicle with a Fuel efficiency rating derived from Federal Fuel Economy Data
27
Vehicle Identification Number (VIN)
MakeModel
Model Year
etc.Series Name
(Introduction) (Methodology) (Data Description) (Overlap Removal) (Occupancy) (Fuel Efficiency) (Preliminary Results)
28
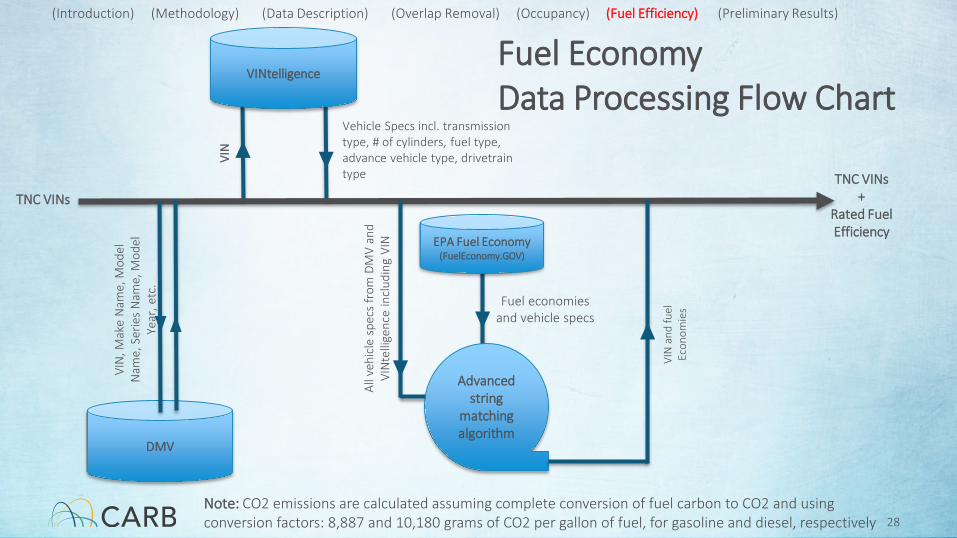
Fuel EconomyData Processing Flow Chart
DMV
VINtelligence
VIN
, Mak
e N
ame,
Mod
el
Nam
e, S
erie
s N
ame,
Mod
el
Year
, etc
.
VIN
Vehicle Specs incl. transmission type, # of cylinders, fuel type, advance vehicle type, drivetrain type
All v
ehic
le s
pecs
from
DM
V an
d VI
Nte
llige
nce
incl
udin
g VI
N EPA Fuel Economy(FuelEconomy.GOV)
Advancedstring
matching algorithm
Fuel economies and vehicle specs
VIN
and
fuel
Ec
onom
ies
TNC VINsTNC VINs
+Rated Fuel Efficiency
Note: CO2 emissions are calculated assuming complete conversion of fuel carbon to CO2 and using conversion factors: 8,887 and 10,180 grams of CO2 per gallon of fuel, for gasoline and diesel, respectively
(Introduction) (Methodology) (Data Description) (Overlap Removal) (Occupancy) (Fuel Efficiency) (Preliminary Results)

Rated Fuel EconomiesTNC-wide vs. California LDV (MY2008+)
29
TNC fleet tend to have higher rated fuel efficiency values than California average passenger vehicles
(Introduction) (Methodology) (Data Description) (Overlap Removal) (Occupancy) (Fuel Efficiency) (Preliminary Results)
1.0
0.8
0.6
0.4
0.2
0.0
Cum
ulat
ive
Prob
abilit
y
140120100806040200Fuel Economies (MPG)
Statewide TNC-wide

05
101520253035
2.5 7.5 12.5 17.5 22.5 27.5 32.5 37.5 42.5 47.5 52.5 57.5 62.5 67.5
Mile
s pe
r Gal
lon
Average Vehicle Speed
Real MPG (EMFAC2017*)
In-Use Fuel Efficiency Varies by Driving Condition
• Fuel efficiencies are corrected for various driving conditions
30
City Fuel Efficiency
*MY2012 – 2018 Passenger Vehicles
(Introduction) (Methodology) (Data Description) (Overlap Removal) (Occupancy) (Fuel Efficiency) (Preliminary Results)

EMFAC2017 vs. TNC 40-Vehicle Study
31
0.00
0.50
1.00
1.50
2.00
2.50
5 10 15 20 25 30 35 40 45 50 55 60 65 70
Nor
mal
ized
CO
2
Speed Bin
CO2 Normalized at 30 mph: TNC vs. EMFAC
average TNC EMFAC 2017
TNC fleet has lower emission rates compared to EMFAC at higher speeds
(Introduction) (Methodology) (Data Description) (Overlap Removal) (Occupancy) (Fuel Efficiency) (Preliminary Results)

How Electric Vehicles are identified?• Decoded VIN numbers to identify Battery, Plug-in hybrid, and Fuel Cell
Electric vehicles• Assumed 15% eVMT for PHEVs (preliminary assumptions)• 0.7% eVMT (30.2 million miles) as compared to total TNC VMT (i.e., 4.2
billion miles)
32
(Introduction) (Methodology) (Data Description) (Overlap Removal) (Occupancy) (Fuel Efficiency) (Preliminary Results)

Preliminary Results
33
(Introduction) (Methodology) (Data Description) (Overlap Removal) (Occupancy) (Fuel Efficiency) (Preliminary Results)

VMT By Time Period
34
(Introduction) (Methodology) (Data Description) (Overlap Removal) (Occupancy) (Fuel Efficiency) (Preliminary Results)

Change in VMT Before And After Trip Overlap Removal
35
(Introduction) (Methodology) (Data Description) (Overlap Removal) (Occupancy) (Fuel Efficiency) (Preliminary Results)
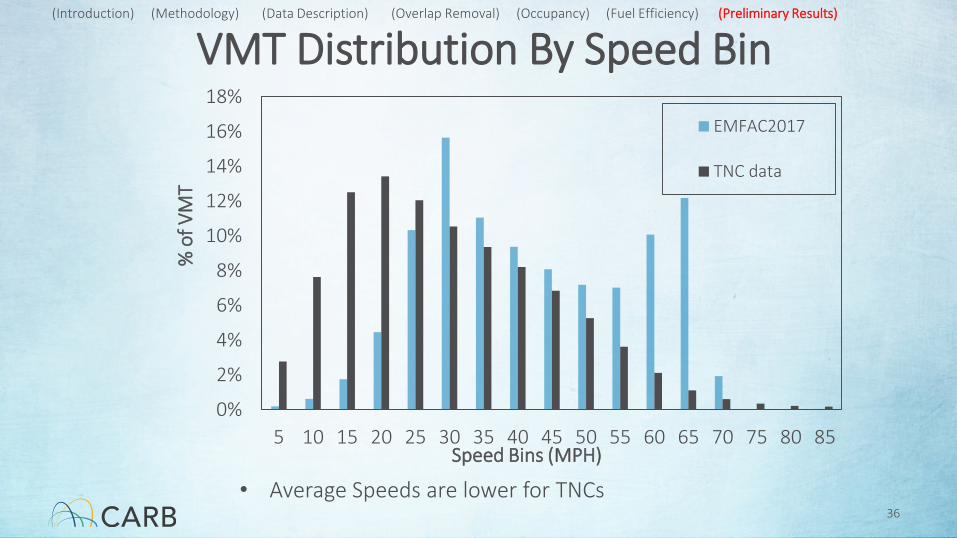
VMT Distribution By Speed Bin
36
0%
2%
4%
6%
8%
10%
12%
14%
16%
18%
5 10 15 20 25 30 35 40 45 50 55 60 65 70 75 80 85
% o
f VM
T
Speed Bins (MPH)
EMFAC2017
TNC data
(Introduction) (Methodology) (Data Description) (Overlap Removal) (Occupancy) (Fuel Efficiency) (Preliminary Results)
• Average Speeds are lower for TNCs
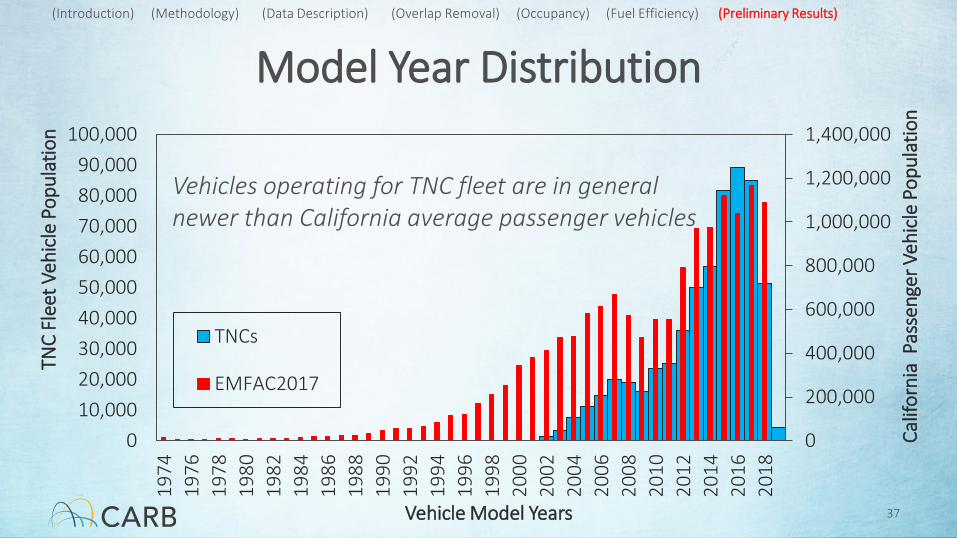
Model Year Distribution
37
0
200,000
400,000
600,000
800,000
1,000,000
1,200,000
1,400,000
010,00020,00030,00040,00050,00060,00070,00080,00090,000
100,00019
7419
7619
7819
8019
8219
8419
8619
8819
9019
9219
9419
9619
9820
0020
0220
0420
0620
0820
1020
1220
1420
1620
18
Calif
orni
a P
asse
nger
Veh
icle
Pop
ulat
ion
TNC
Flee
t Veh
icle
Pop
ulat
ion
Vehicle Model Years
TNCs
EMFAC2017
Vehicles operating for TNC fleet are in general newer than California average passenger vehicles
(Introduction) (Methodology) (Data Description) (Overlap Removal) (Occupancy) (Fuel Efficiency) (Preliminary Results)

Fleet Average In-Use Fuel Efficiency (Corrected for Driving Conditions)
38
26.0
28.0
2021222324252627282930
CA TNC
Fuel
Effi
cien
cy (M
PG)
(Introduction) (Methodology) (Data Description) (Overlap Removal) (Occupancy) (Fuel Efficiency) (Preliminary Results)
• The efficiency gain of newer model years vehicle might get slightly offset by slower trip average speeds

Out of 2.53 Billion Miles of P3 VMT
Pooling
39
(Introduction) (Methodology) (Data Description) (Overlap Removal) (Occupancy) (Fuel Efficiency) (Preliminary Results)
• Pool ride do not necessarily reflect the rides that were matched to another passenger. It may include rides that were not matched too.

Base Year g CO2 per PMT
40
(Introduction) (Methodology) (Data Description) (Overlap Removal) (Occupancy) (Fuel Efficiency) (Preliminary Results)
• Although TNC fleet has better in-use fuel efficiency, lower occupancy and higher deadhead VMT drive higher emissions (+ 75% emissions per PMT)
• For California fleet average; PMT/VMT of 1.68 was used
BAU in CY2018 Occupancy =1.5Deadheading=40%
CA-like assumptionsOccupancy = 1.68Deadheading=0%
0
50
100
150
200
250
300
350
400
CA TNC
g CO
2 pe
r PM
T
189
202
355
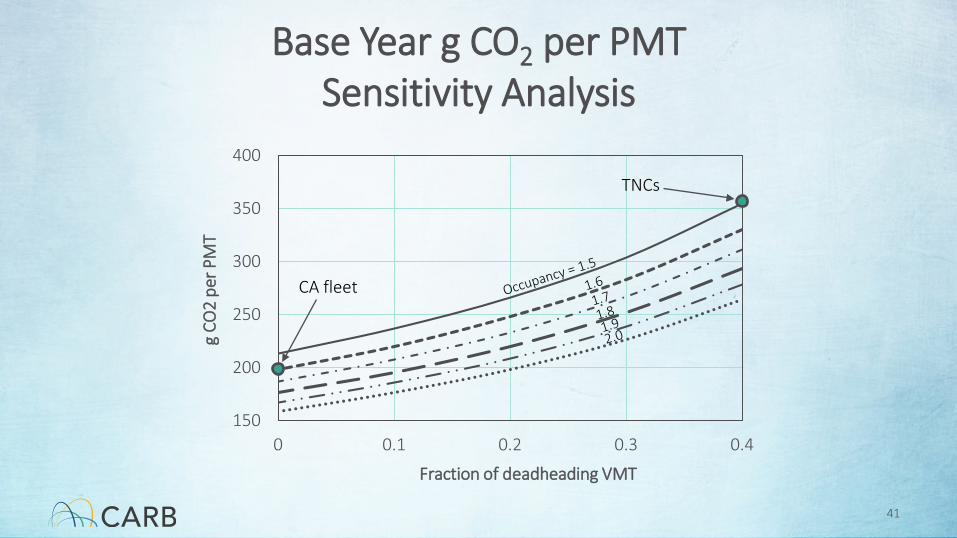
Base Year g CO2 per PMTSensitivity Analysis
41
150
200
250
300
350
400
0 0.1 0.2 0.3 0.4
g CO
2 pe
r PM
T
Fraction of deadheading VMT
CA fleet
TNCs

Next Steps
• Finalized data analysis using latest data submittal by TNCs• Late 2019 - Release draft emissions inventory
documentation• Early 2020 – Potential informational board item on initial
inventory and program overview• Q4 2019 – Workshop on regulatory concepts
42
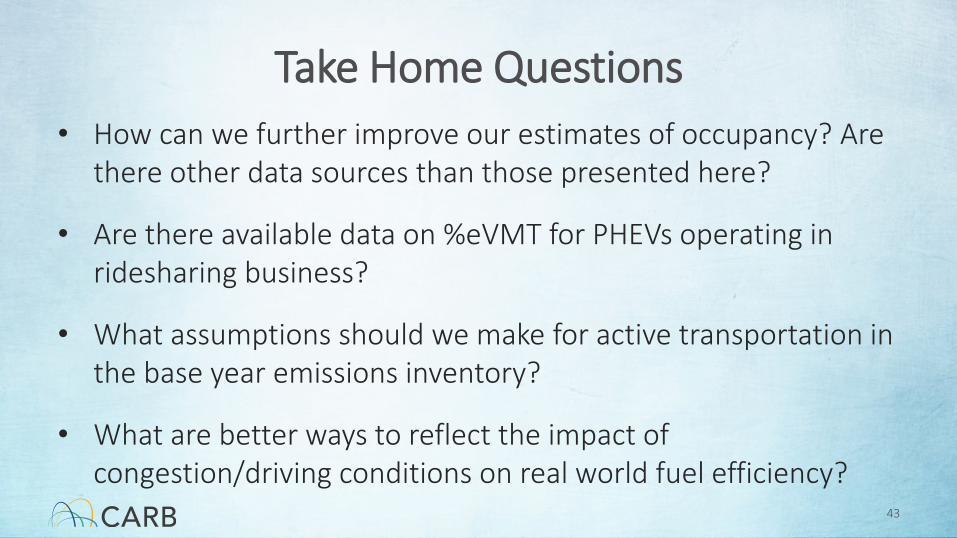
Take Home Questions• How can we further improve our estimates of occupancy? Are
there other data sources than those presented here?
• Are there available data on %eVMT for PHEVs operating in ridesharing business?
• What assumptions should we make for active transportation in the base year emissions inventory?
• What are better ways to reflect the impact of congestion/driving conditions on real world fuel efficiency?
43

Comments and Questions
• Please submit your comments related to 2018 base year emissions by October 25, 2019
• Questions and comments can be emailed to [email protected]
• For more information on the Clean Mile Standards, please visit our website at: https://ww2.arb.ca.gov/our-work/programs/clean-miles-standard
44
Recommended