Production of this document is made possible by financial contributions from Health Canada and provincial and territorial governments. The views expressed herein do not necessarily represent the views of Health Canada or any provincial or territorial government.
All rights reserved.
The contents of this publication may be reproduced unaltered, in whole or in part and by any means, solely for non-commercial purposes, provided that the Canadian Institute for Health Information is properly and fully acknowledged as the copyright owner. Any reproduction or use of this publication or its contents for any commercial purpose requires the prior written authorization of the Canadian Institute for Health Information. Reproduction or use that suggests endorsement by, or affiliation with, the Canadian Institute for Health Information is prohibited.
For permission or information, please contact CIHI:
Canadian Institute for Health Information495 Richmond Road, Suite 600Ottawa, Ontario K2A 4H6
Phone: 613-241-7860Fax: [email protected]
© 2017 Canadian Institute for Health Information
Cette publication est aussi disponible en français sous le titre Outil d’évaluation des sources de données de l’ICIS.

Table of contents 1 Introduction ............................................................................................................................. 4
Structure of the tool ........................................................................................................... 6
Dimensions, characteristics and criteria ............................................................................ 6
2 Data source key characteristics ............................................................................................ 14
3 General criteria...................................................................................................................... 16
4 Survey/sample data source characteristics and criteria ........................................................ 38
Appendix A: Assessment scope matrix ....................................................................................... 44
References .................................................................................................................................. 53

CIHI’s Data Source Assessment Tool
4
1 Introduction CIHI’s Data Source Assessment Tool provides a set of criteria that enable the Canadian Institute for Health Information (CIHI) to comprehensively assess its data sources across 5 dimensions of quality and to determine the fitness for use of a given data set. CIHI uses the term “fitness for use” to define quality, in line with international standards and best practice.1 It means that quality is defined in the context of data users and their needs. Data does not need to be perfect — this is an unattainable goal; however, with appropriate knowledge about a given data set or product, users can make an informed decision about whether they may confidently use the data to answer their business or research question.
At CIHI, data source assessment is a corporately governed process that reflects CIHI’s commitment to producing and maintaining high-quality data for a wide variety of uses. This tool can be applied to many different types of data sources, and it is comprehensive enough to meet the quality information needs of data users while also supporting data stewards and CIHI overall (Table 1).
For those who supply data to CIHI or who use CIHI’s data or information products, this document provides useful information about how CIHI evaluates the data it receives. This tool can also be used by organizations interested in doing their own data quality assessments. The criteria can be adapted, expanded or reduced based on the needs and priorities of an organization or program. Used in full, the criteria can create quality benchmarks for measuring future improvement, identify major issues and generate quality-related metadata in a standard way that can then be packaged for user documentation. Used in part, they can help inform specific, high-priority quality issues or initiatives; for example, they can be considered when undertaking the development (or redevelopment) of a data source. The results of an assessment can guide appropriate data use and inform analytical plans, and they can also contribute to the creation of key quality indicators and other metrics for reporting.

CIHI’s Data Source Assessment Tool
5
Table 1 Quality assessment information use
Audience Use
Data stewards • Set quality improvement priorities and plans by identifying − What needs to be fixed or improved − What needs to be monitored − What needs to be reported
• Provide summary information about quality management processes
Data users • Support and expand data use by understanding − How the data is created and processed − How it’s currently used − How it could potentially be used − How it should not be used, based on existing limitations − How to access the data and its metadata
CIHI • Establish corporate knowledge of processes and practices, and identify opportunities to improve efficiency
• Generate metadata to facilitate data use • Identify, understand and leverage existing successful approaches to quality improvement • Identify systematic quality challenges across the organization • Monitor changes in data quality
This assessment tool replaces a past version that was included as part of CIHI’s 2009 Data Quality Framework, which itself has been replaced by a new Information Quality Framework. The new framework is broader in scope, providing an overarching structure to integrate all quality-related activities across CIHI. It signifies an important shift in focus from data to information quality and to managing not just the quality of the data coming into CIHI but also the quality of the information products that CIHI releases.
As the quality of the data sources used is a core component of information quality, a tool to provide a common approach to assessing those sources remains a key part of CIHI’s new framework. The tool has been updated as the result of extensive internal consultation within CIHI and a scan of international best practices.1–5
CIHI’s Data Source Assessment Tool
6
Structure of the tool This tool contains 2 sets of criteria:
• A general set for assessing the quality of all types of data sources. It is a comprehensive set of criteria and is designed to be used flexibly, as not all criteria will apply to all data sources. The assessment scope matrix found in Appendix A provides guidance on which criteria are most relevant to different types of data sources.
• A supplementary set, to be used in addition to the general set, for assessing the quality of survey-/sampling-specific components of data sources that contain survey results or sample data. As CIHI has relatively few data sources containing survey/sample data, the criteria were organized this way to facilitate implementation.
Each set of criteria is preceded by a section that captures key characteristics about the data source and, if applicable, the survey/sample components. The information captured in the key characteristics sections provides important context for interpreting the assessment results and, along with the assessment scope matrix, can also help determine which criteria may apply to a given data source.
Dimensions, characteristics and criteria Quality is a multi-dimensional concept, and CIHI’s 5 dimensions of quality encompass those found in the National Quality Assurance Framework that was developed by an expert international working group in conjunction with the United Nations Statistical Commission.1 These dimensions are used by CIHI to assess quality relative to users’ needs and are intended to work in balance with one another, depending on users’ needs and priorities.
5 dimensions of quality Relevance: Does the information meet users’ current and potential future needs?
Accuracy and reliability: Does the information correctly and consistently describe what it was designed to measure?
Comparability and coherence: Is the information consistent over time and across providers and can it easily be combined with other sources?
Timeliness and punctuality: Is the information current and released on schedule?
Accessibility and clarity: Is the information and its supporting documentation easily accessed and clearly presented in a way that can be understood?

CIHI’s Data Source Assessment Tool
7
These 5 dimensions of quality are broken down into characteristics that describe specific aspects of quality that must be understood to determine whether the data is fit for its intended use. Each characteristic is further made up of one or more criteria, which are the individual questions used to facilitate assessment. It is the response to these criteria, or the degree to which they are met, that allows users to identify the strengths and limitations of a given data source. Quality characteristics by dimension are outlined in tables 2A to 2E below, while the detailed criteria are presented in Section 3.
Table 2A Quality characteristics, by dimension — Relevance
Characteristic Description
Release and use The ways in which data is made available for use and its subsequent utilization for various purposes. If data is being used, it is an indication that it is meeting an information need in some way. However, the opposite may not be true; data that sees little use may still be relevant but may have other issues (e.g., is not accessible).
This is assessed by monitoring usage metrics, where available, and describing other known uses of the data.
Value The contribution of a data source to filling priority information gaps and whether it successfully serves to address its purpose. Data that no longer meets users’ needs is at risk of becoming irrelevant.
This is assessed by monitoring the perceived value of the data with regard to main users’ and stakeholders’ current and emerging information needs.
Adaptability Whether a data source is well positioned and flexible enough to address the current and future information needs of its main users. Data sources that cannot adapt may be at risk of becoming irrelevant.
This is assessed by evaluating whether user needs are effectively and proactively identified, and then by monitoring any corresponding changes to the data source.

CIHI’s Data Source Assessment Tool
8
Table 2B Quality characteristics, by dimension — Accuracy and reliability
Characteristic Description
Coverage* The degree to which the data available for use covers the population for whom information is wanted (the population of interest). Coverage governs most use, as it is critical to understanding which populations statements can and cannot be made for based on the data.
This is assessed by defining populations and calculating and monitoring coverage rates, including over- and under-coverage, and describing the impact of any limitations in the coverage (e.g., bias due to differences between units from which no information was received and those from which information was received).
Item availability The degree to which the individual records received contain complete, valid information. The effect on fitness for use depends on many factors, including the importance of the missing/invalid responses to a given data element and whether there is any pattern to the missing values.
This is assessed by routine data profiling that includes calculating and monitoring rates of valid, invalid, missing and outlier values.
Lineage Lineage describes the process and flow of data and its influences from the point of origin through to end usage. Understanding lineage allows users to have trust in the data and allows data stewards to identify where in the supply chain quality issues might occur. Complete documentation of lineage is key metadata for a data source.
This is assessed by documenting what is known about data lineage, describing any known variations and identifying any gaps in knowledge.
Capture and collection
The quality management practices that are in place to capture information in a usable format and prepare it for submission/transmission. Monitoring quality along the entire data supply chain can help to identify where and when issues might originate or occur.
This is assessed by identifying what measures, processes and standards are in place to maintain constructive relationships with data providers, minimize response burden and facilitate effective data flows.
CIHI’s Data Source Assessment Tool
9
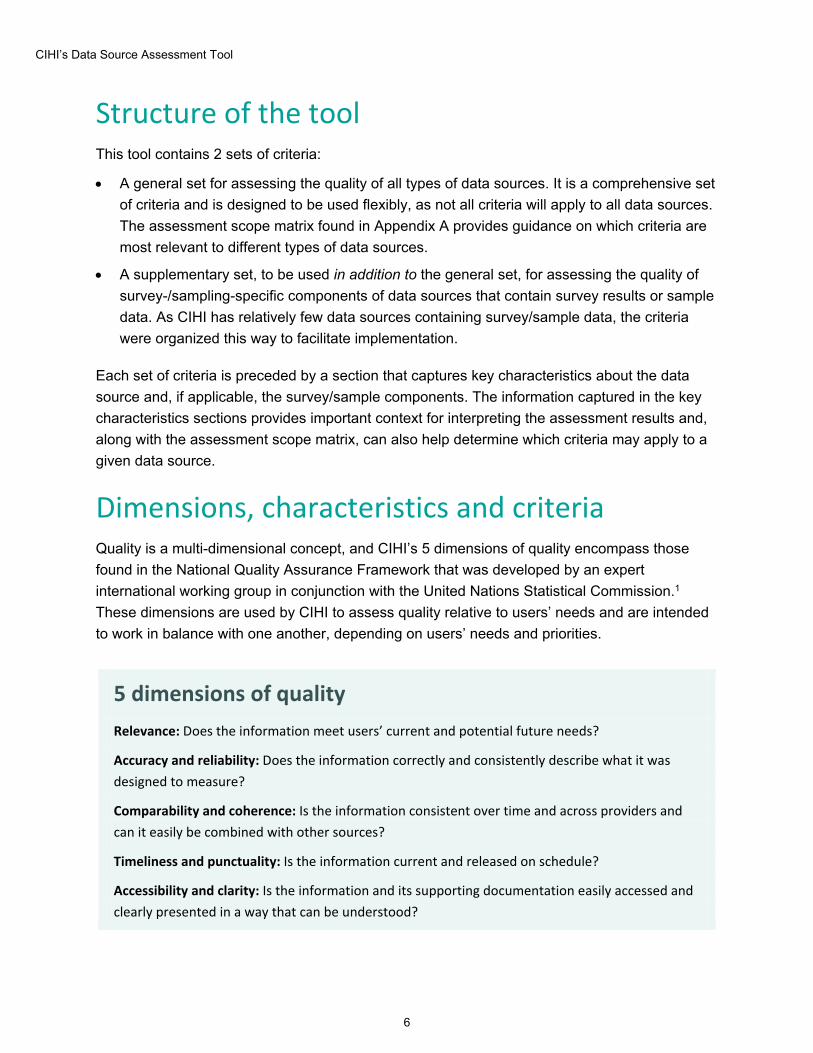
Characteristic Description
Measurement error
The difference between the value that is reported and the true but unknown value that should have been reported. Data users should understand how data may be affected by measurement error in order to interpret results appropriately. Measurement error includes the concepts of bias (to what degree the difference between the reported values and the values that should have been reported occurs in a systematic way) and of consistency or reliability (the amount of variation that would occur if repeated measurements were done).
This is assessed by quantifying or estimating measurement error where possible (e.g., through validation studies) or by describing potential sources of measurement error even if the degree of error is not known.
Processing The application of programs or procedures that generally transform the data as it is received into a form that is suitable for analysis. This may include validation, correction, imputation and the creation of derived variables. Understanding processing is integral to data lineage, which (as mentioned above) is key metadata about a data source that allows users to trust the data. Documentation of processing is also important for data stewards, as it allows for continuity of operations when there are changes in staff.
This is assessed by identifying whether processing is fully documented, including how it is done and whether transformed data can be identified and differentiated from the original data.
Note * Coverage is assessed differently for survey/sample data sources, as outlined in Table 3A.

CIHI’s Data Source Assessment Tool
10
Table 2C Quality characteristics, by dimension — Comparability and coherence
Characteristic Description
Concordance The degree to which data is in agreement with other similar and relevant sources. Users often want to bring together information from different data sources to more fully report on specific themes and topics, and they need consistent information to do so. Sometimes one data source can act as a standard against which to compare another. Unexpected differences in the comparisons may signal a quality issue in one or more of the sources.
This is assessed by comparing aggregate statistics from other sources of data that capture the same or similar information, while being cognizant of differences that may impact the comparison.
Standardization The level to which common definitions and/or groupings are used to collect data. Using standards can ensure comparability and facilitate analysis, whereas a lack of standardization can have the opposite effect.
This is assessed by identifying where existing standards can be or are being used, as well as how they are used (e.g., whether there are variations or deviations from the standard) and supported.
Linkage The process of joining records (either within a single data source or from multiple data sources) by using one or more common linking data elements. Linking data allows for more detailed and/or complete reporting and analysis and can address important questions that could not otherwise be examined.
This is assessed by identifying whether linkage is possible through linkage variables (and their response) and, where possible, calculating linkage rates based on their availability.
Jurisdictional comparability
The degree to which the data allows for reasonable comparisons between and within provinces and territories. Meaningful comparisons among jurisdictions can be used to support effective system management, quality improvement and decision-making, whereas unreasonable comparisons can have the opposite effect. Determining comparability helps ensure appropriate use of the data.
This is assessed by documenting any jurisdictional differences and their potential impact on the data and its use for comparative reporting.
Historical comparability
The consistency of data concepts and methods over time, which in turn allows valid comparisons of different estimates at different points in time. Determining comparability helps ensure appropriate use of the data.
This is assessed by conducting trend analysis to identify and examine changes in data over time. Another aspect is how well-known changes to the data source are documented for users.

CIHI’s Data Source Assessment Tool
11
Table 2D Quality characteristics, by dimension — Timeliness and punctuality
Characteristic Description
Release timeliness
The currency of the data at the time of release. The elapsed duration (as defined below) should be short enough that the data remains relevant for its main purposes.
This is assessed by measuring the time elapsed between the actual date of release and the end of the data reference period.
Release punctuality
Whether the data was released on time. This is an important consideration for users, because it enables them to develop their own operational plans. Delays may provide an indication of quality issues during the production process.
This is assessed by identifying delayed releases and the underlying causes.
Submission timeliness
Whether the data is submitted on time by data providers. Submission timeliness is critical for achieving timely and punctual release of results.
This is assessed by measuring the magnitude of late data submissions, identifying the underlying causes and evaluating any mechanisms designed to improve timeliness.
Processing timeliness
Whether the data, once received, is processed as efficiently as possible. Processing timeliness is critical for timely and punctual release of results.
This is assessed by understanding the processing procedures and systems, and reviewing them regularly for efficiency.

CIHI’s Data Source Assessment Tool
12
Table 2E Quality characteristics, by dimension — Accessibility and clarity
Characteristic Description
Accessibility The ease with which data can be obtained, including knowledge that the data exists and the suitability of the format of the data. Accessibility is key to data quality, as data that users do not know about, cannot locate or cannot bring into their own working environment for whatever reason will not be of use to them.
This is assessed by determining whether a single version of the data (source of truth) is maintained in a standard format that is repeated each release. This allows users to more easily repeat analyses that will be consistent with previous results.
Interpretability The degree to which users have the required documentation and metadata available to understand the data. Having this information available helps ensure appropriate use of the data.
This is assessed by determining whether or not all documentation necessary to appropriately interpret and use the data is available and up to date. This also includes documentation specific to preliminary (not finalized) data use and post-release revisions to the data.
Some of the criteria specific to survey and sample data found in Section 4 measure characteristics described above (historical comparability, coverage, item availability [response], measurement error [bias], capture and collection), while some are related to characteristics specific to survey and sample data as outlined in tables 3A and 3B below.

CIHI’s Data Source Assessment Tool
13
Table 3A Survey and sample data quality characteristics, by dimension — Accuracy and reliability
Characteristic Description
Survey/sampling frame
Describes the frame maintenance procedures and any monitoring processes. For recurring surveys, it is essential to keep the frame up to date to maintain adequate coverage of the target population and to document any changes in the frame that can impact survey estimates.
This is assessed by identifying whether adequate processes are in place and by documenting changes and their potential impacts.
Questionnaire design
The processes by which the data collection instrument was developed and its suitability for collecting the data needed to produce the desired estimates.
This can be assessed by determining whether the instrument was designed to maximize response, considering known constraints, and the degree to which it was tested.
Coverage The degree to which the data available for use covers the population for whom information is wanted (the population of interest). For survey/sample data, the degree to which the frame (a list of the units available for sampling) covers the population of interest, and information about the achieved sample. Coverage governs most use, as it is critical to understanding which populations statements can and cannot be made for based on the data.
This is assessed by calculating and monitoring response rates and describing the potential impact of any coverage limitations (e.g., insufficient sample size, frame under-/over-coverage) on key study estimates.
Non-response bias
Describes the extent to which the survey data is subject to non-response (missing data) and any potential bias as a result of the non-response (due to the answers from responders being different from potential answers from non-responders). It is critical to understand how representative of the population of interest the sampled respondents included in the survey are.
This is assessed by describing potential differences between responders and non-responders, estimating the level of non-response bias and documenting any steps taken to reduce the impact of any bias.
Precision of estimates
An indication of how close the sample-based estimates are likely to be to the actual population values.
This is assessed by calculating sampling errors to determine whether the variance of the estimate, compared with the estimate itself, is at an acceptable level. Design effects can also be calculated to assess the impact of the sample design on the precision of estimates.

CIHI’s Data Source Assessment Tool
14
Table 3B Survey and sample data quality characteristics, by dimension — Accessibility and clarity
Characteristic Description
Survey/sample design
The degree to which the survey and sampling methodology that was used is fully documented for users, including the rationale for the chosen survey/sample design based on the population for which estimates need to be made and the desired precision of these estimates.
This is assessed by determining whether the key components of the design are fully documented, including the rationale for the chosen design and what it was based on (e.g., available sampling frame, collection period).
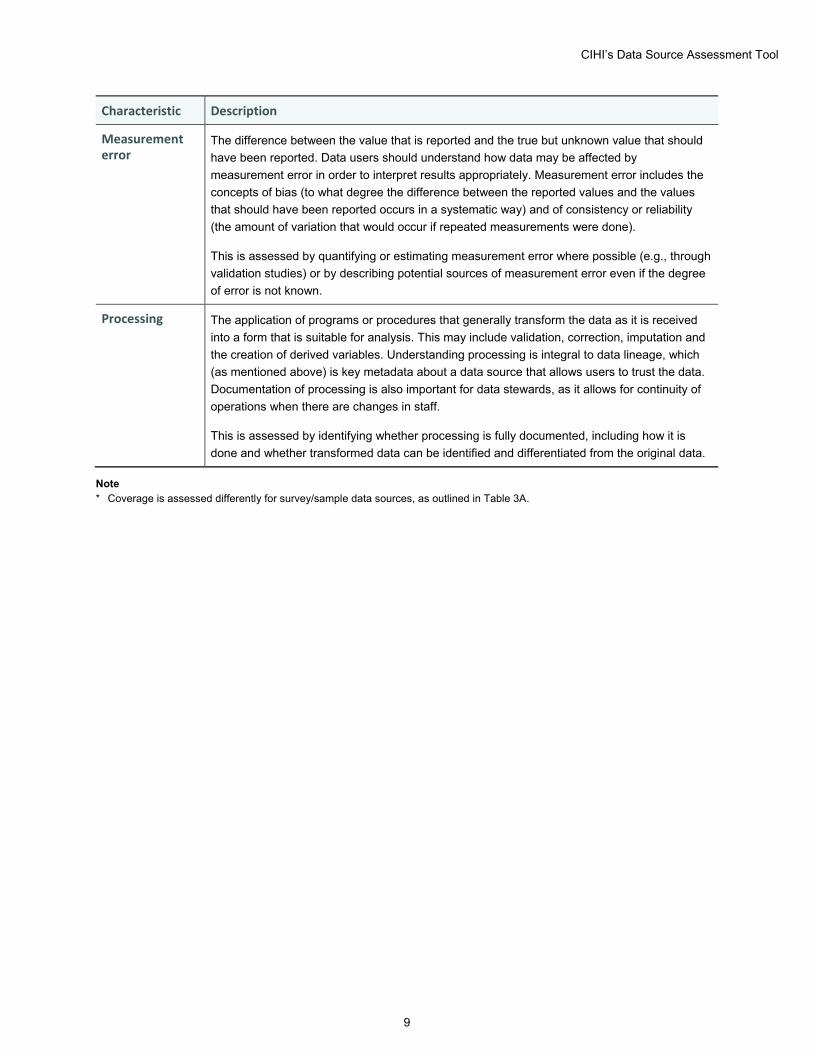
2 Data source key characteristics The information captured in this section provides important context for interpreting the assessment results and, along with the assessment scope matrix found in Appendix A, can also help determine which criteria may apply to a given data source. The metadata generated can also be used to partially populate or maintain an inventory of an organization’s data sources (Table 4). For each characteristic, examples of the type of detail required are provided.
Table 4 Data source key characteristics
Characteristic Details
Data source purpose Information need that the data source addresses
Population of interest Group of units for which information is wanted
Data source type • Production database: Subject to operational quality management processes
• Analytical/third-party data files: May be subject to fewer and less-operational quality management processes
• Other
Data source content • Unit(s) of analysis
• Survey data
• Sample data
• Census data
• Longitudinal data
• Aggregate data
• Record-level data
CIHI’s Data Source Assessment Tool
15
Characteristic Details
Maturity • Pilot or demonstration data
• One-time or ad hoc submission or acquisition
• New ongoing feed: Less than 5 years in operation
• Established ongoing feed: 5 years or more in operation
Data input file formats • Text
• XML
• Web form
• Data entry application (non-web)
• Excel
• Proprietary statistical software format (e.g., SAS)
• Other
Submission • Commitment to participate (mandated, partially mandated, voluntary)
• Minimum submission frequency
• Vendor system use
• Corrections or resubmissions accepted
• Non-standard data accepted (e.g., free text, variable-definition fields)
Data provider types • Provincial/territorial government
• Federal government
• Health care organization
• Regulatory body
• Health care provider
• Source internal to organization (e.g., a different department or branch)
• Other

CIHI’s Data Source Assessment Tool
16
3 General criteria Tables 5A to 5E outline the data source assessment criteria, by characteristic and dimension, and also include assessment details.
Table 5A Data source assessment criteria, by dimension — Relevance
Characteristic Criterion Details Assessment
Release and use
1: All known uses of the data from the data source are documented
Describe reporting based on the data source, including scheduled and ad hoc releases and/or updates, and private and public reporting.
Record usage metrics: number of registered users, web metrics (downloads, page views, etc.), data requests, etc.
Describe known external uses of the data such as (but not limited to) funding models, products, tools, indicators, classifications/groupings, analyses and policy formation.
Yes
Partial (partially documented)
No
Value 2: The data source contains information that can inform priority themes and populations
Describe how the data source informs the theme or population. Consider actual and potential uses.
Yes
No
3: Quality improvement action plans exist and are implemented to improve relevance and meet emerging needs
Provide action plan document.
Summarize efforts implemented via action plans that are directly related to improving relevance and addressing emerging needs (e.g., working groups, analytical projects, stakeholder consultation).
Describe reasons why action plans do not exist or have not been acted on, including any plans to address.
Yes
Partial (plans exist but have not been implemented)
No

CIHI’s Data Source Assessment Tool
17
Characteristic Criterion Details Assessment
Adaptability 4a: Mechanisms to identify client and stakeholder needs exist and are evaluated for effectiveness
Identify mechanisms used (e.g., advisory committee, survey) and evaluate effectiveness as high, medium or low based on the following guidelines:
High: Mechanism identifies needs shared by multiple stakeholders; potential for improving fitness for use for a wide audience; history of initiating quality improvements related to strategic priorities.
Medium: Mechanism identifies needs specific to a jurisdiction or client that are unlikely to conflict with those of other clients; needs identified are usually acted upon as time allows if reasonably feasible for most stakeholders; occasionally results in improvement in quality if feedback is addressed/implemented.
Low: Mechanism identifies needs that are highly client-specific and not usually related to strategic priorities; addressing identified needs is usually unrealistic due to system and/or resource constraints; rarely results in improvement in quality if feedback is addressed/implemented.
Describe reason why any mechanisms to identify client and stakeholder needs do not exist, or do exist but have not been evaluated, including any planned activities to address.
Yes
Partial (mechanisms exist but are not evaluated)
No
4b: Client and stakeholder needs are prioritized and implemented
Describe major changes to systems or standards as a result of identified stakeholder needs.
Describe any needs identified for which no activity is planned, including whether temporary workarounds are in place and documented.
Yes
Partial (needs are prioritized but not implemented)
No

CIHI’s Data Source Assessment Tool
18
Table 5B Data source assessment criteria, by dimension — Accuracy and reliability
Characteristic Criterion Details Assessment
Coverage* 5a: Populations of interest, populations of reference and submitted populations are documented, and coverage is quantifiable at both the submitting unit level and the unit(s) of analysis
Indicate whether populations of interest, populations of reference and submitted populations are documented and quantifiable; if not, describe why and any plans to address.
Definitions
Population of interest: The population for which information is wanted (wanted submitters).
Population of reference: The population for which information should be available (expected submitters).
Submitted population: The population for which information was actually received (confirmed submitters).
Yes
Partial (populations are documented but not quantifiable)
No
5b: Coverage rates are documented via standardized tables and are updated routinely or with each data release
Provide population counts and coverage rates at both submitting unit level and record level (unit of analysis) using the following formulas:
Population of interest units (A) Population of reference units (B) Submitting units (C) Unit coverage of population of interest (D = C ÷ A) Unit under-coverage of population of interest (E = 1 − D) Unit response (unit coverage of population of reference) (F = C ÷ B) Unit non-response (unit under-coverage of population of reference) (G = 1 − F)
Describe coverage table update process, including frequency. If coverage is not documented or routinely updated, describe why, including any planned activities to address.
Yes
Partial (coverage is documented but not in a standardized way, is not updated with each data release or both)
No

CIHI’s Data Source Assessment Tool
19
Characteristic Criterion Details Assessment
Coverage* (cont’d)
5c: Significant coverage issues that impact analysis and interpretation are documented for users
Describe significant coverage issues that limit interpretation and use, considering impact at different reporting levels (e.g., national versus regional). If significant coverage issues are not documented, describe why, including any plans to address.
Yes
No
Not applicable (no significant coverage issues)
6a: Processes exist to identify and handle duplicate and potential duplicate records within the data
Describe process for identifying duplicates.
Calculate rate of duplicates using the following formula: Number of duplicates = (A) Total units of analysis = (B) Duplicate unit of analysis rate = (A) ÷ (B) × 100
Indicate whether duplicates are removed; if not, indicate whether they are documented to allow users to remove them.
If duplicates cannot be identified, describe why, including any plans to address, and provide an estimate of over-coverage and/or describe potential sources of over-coverage.
Yes
Partial (duplicates are identified but not handled)
No
6b: Problems with duplicate records that can impact analysis and interpretation are documented for users and updated with each data release
Describe significant duplicate record issues that could limit interpretation and use. If issues with duplicates are not documented, describe why, including any plans to address.
Yes
Partial (problems are documented but not updated with each release)
No
Not applicable (no problems with duplicates)

CIHI’s Data Source Assessment Tool
20
Characteristic Criterion Details Assessment
Coverage* (cont’d)
7: Records are complete for data sources that are designed to be longitudinal
If data follows a set or expected update cycle that allows for quantification of missing events, provide missing longitudinal record rate based on required assessment or other frequency.
If data is longitudinal but there is no set update cycle (i.e., updates are based on ad hoc events), provide any information on whether completeness has ever been evaluated and the approach used.
Yes
No (includes unknown)
Not applicable (not longitudinal)
Item availability
8a: Standard data profiling results, including rates of valid, invalid, missing and outlier values, are documented and updated routinely or with each data release
Provide a data profile for key data elements (overall and by jurisdiction) that must include, at minimum, valid, invalid and missing value rates. Key data elements are those that are most important for analysis or are most widely used, and usually include socio-demographic, identification, geographic and linkage elements in addition to key content elements (e.g., diagnostic elements in an administrative health data source).
Describe data profile update process, including frequency.
If data profiling is not done or not routinely updated, describe why, including any plans to address.
Definitions
Valid: Data conforms to data source specifications (e.g., not applicable is a valid value rather than a missing value).
Invalid: Data does not conform to data source specifications.
Missing: Data is missing or unknown (unavailable).
Outlier: A data value appears unusual with respect to the distribution of the data.
Yes
Partial (data profiling is done but not in a standardized way, not done routinely/with each data release or both)
No
8b: Standard data profiling results, including rates of valid, invalid, missing and outlier values, fall within an acceptable range
For key variables included in the data profile, calculate the percentage where availability of valid data is less than 95%.
Definition
Acceptable range: Rate of valid data is 95% or higher for a given data element.
Yes
No
CIHI’s Data Source Assessment Tool
21
Characteristic Criterion Details Assessment
Item availability(cont’d)
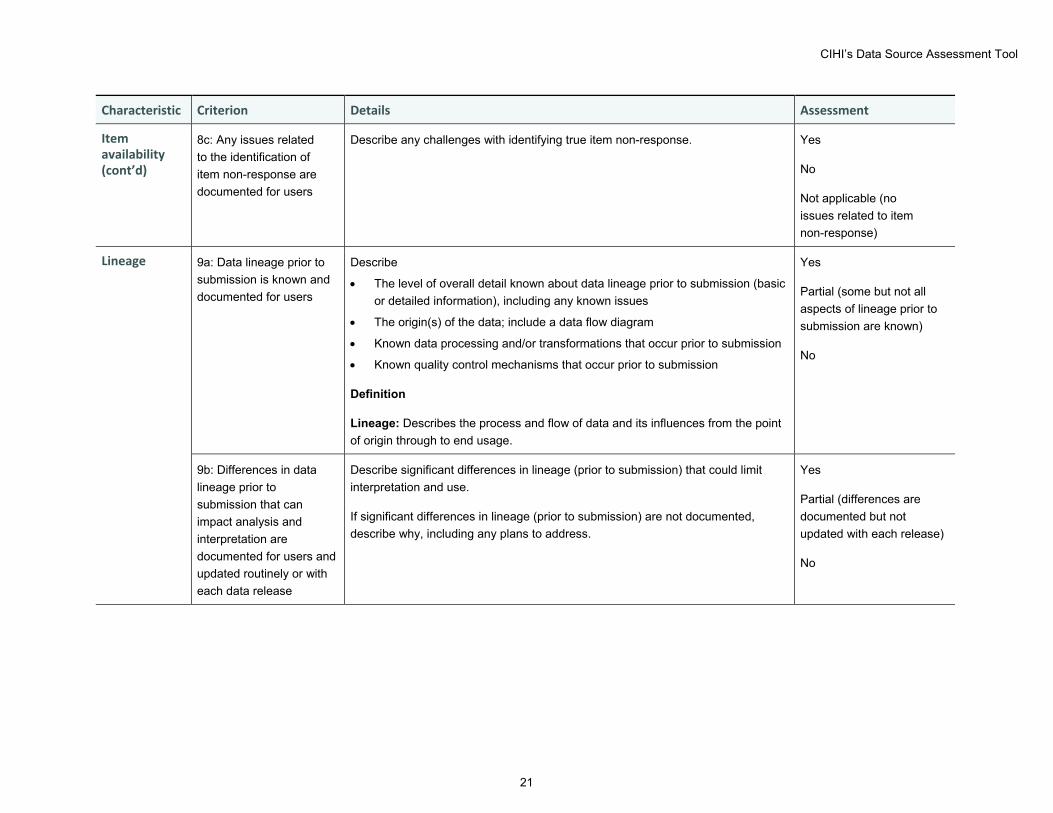
8c: Any issues related to the identification of item non-response are documented for users
Describe any challenges with identifying true item non-response. Yes
No
Not applicable (no issues related to item non-response)
Lineage 9a: Data lineage prior to submission is known and documented for users
Describe
• The level of overall detail known about data lineage prior to submission (basic or detailed information), including any known issues
• The origin(s) of the data; include a data flow diagram
• Known data processing and/or transformations that occur prior to submission
• Known quality control mechanisms that occur prior to submission
Definition
Lineage: Describes the process and flow of data and its influences from the point of origin through to end usage.
Yes
Partial (some but not all aspects of lineage prior to submission are known)
No
9b: Differences in data lineage prior to submission that can impact analysis and interpretation are documented for users and updated routinely or with each data release
Describe significant differences in lineage (prior to submission) that could limit interpretation and use.
If significant differences in lineage (prior to submission) are not documented, describe why, including any plans to address.
Yes
Partial (differences are documented but not updated with each release)
No

CIHI’s Data Source Assessment Tool
22
Characteristic Criterion Details Assessment
Capture and collection
10: Mechanisms to support data providers in capturing high-quality information and to reduce response burden exist and are evaluated for effectiveness
Identify mechanisms used (e.g., client support, committee, documentation, processes) and evaluate effectiveness as high, medium or low based on the following guidelines:
High: Mechanism is widely used by or has been the subject of positive feedback from data providers, and has proven to significantly improve data capture and reduce response burden for most data providers.
Medium: Mechanism is sometimes used by or has elicited feedback from data providers, and has proven to moderately improve data capture and reduce response burden for some data providers.
Low: Mechanism is rarely used and has little to no impact on data capture or response burden.
Describe reason why any mechanisms to support data providers do not exist, or do exist but have not been evaluated, including any planned activities to address.
Yes
Partial (mechanisms exist but are not evaluated)
No
11: All data submissions comply with standard submission specifications or requirements
Provide link to data submission specifications or requirements document.
Provide level of compliance with submission specifications.
Identify which submission types do not comply, including amount of data that is non-compliant (if possible), and describe reason and any plans to address.
Indicate whether data submissions are manipulated by CIHI to meet specifications or requirements (and to what extent).
Yes
Partial (data required minor intervention prior to meeting database-specific submission specifications)
No
Not applicable (no submission specifications/requirements)
CIHI’s Data Source Assessment Tool
23
Characteristic Criterion Details Assessment
Capture and collection (cont’d)
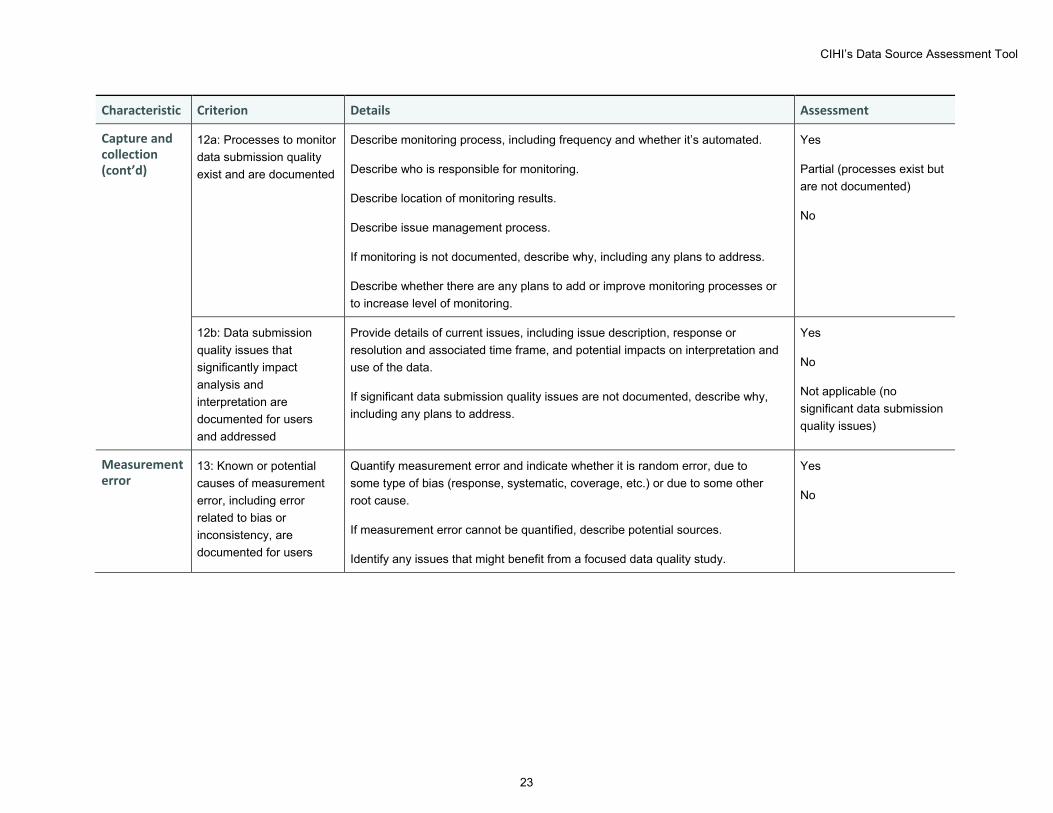
12a: Processes to monitor data submission quality exist and are documented
Describe monitoring process, including frequency and whether it’s automated.
Describe who is responsible for monitoring.
Describe location of monitoring results.
Describe issue management process.
If monitoring is not documented, describe why, including any plans to address.
Describe whether there are any plans to add or improve monitoring processes or to increase level of monitoring.
Yes
Partial (processes exist but are not documented)
No
12b: Data submission quality issues that significantly impact analysis and interpretation are documented for users and addressed
Provide details of current issues, including issue description, response or resolution and associated time frame, and potential impacts on interpretation and use of the data.
If significant data submission quality issues are not documented, describe why, including any plans to address.
Yes
No
Not applicable (no significant data submission quality issues)
Measurement error
13: Known or potential causes of measurement error, including error related to bias or inconsistency, are documented for users
Quantify measurement error and indicate whether it is random error, due to some type of bias (response, systematic, coverage, etc.) or due to some other root cause.
If measurement error cannot be quantified, describe potential sources.
Identify any issues that might benefit from a focused data quality study.
Yes
No
CIHI’s Data Source Assessment Tool
24
Characteristic Criterion Details Assessment
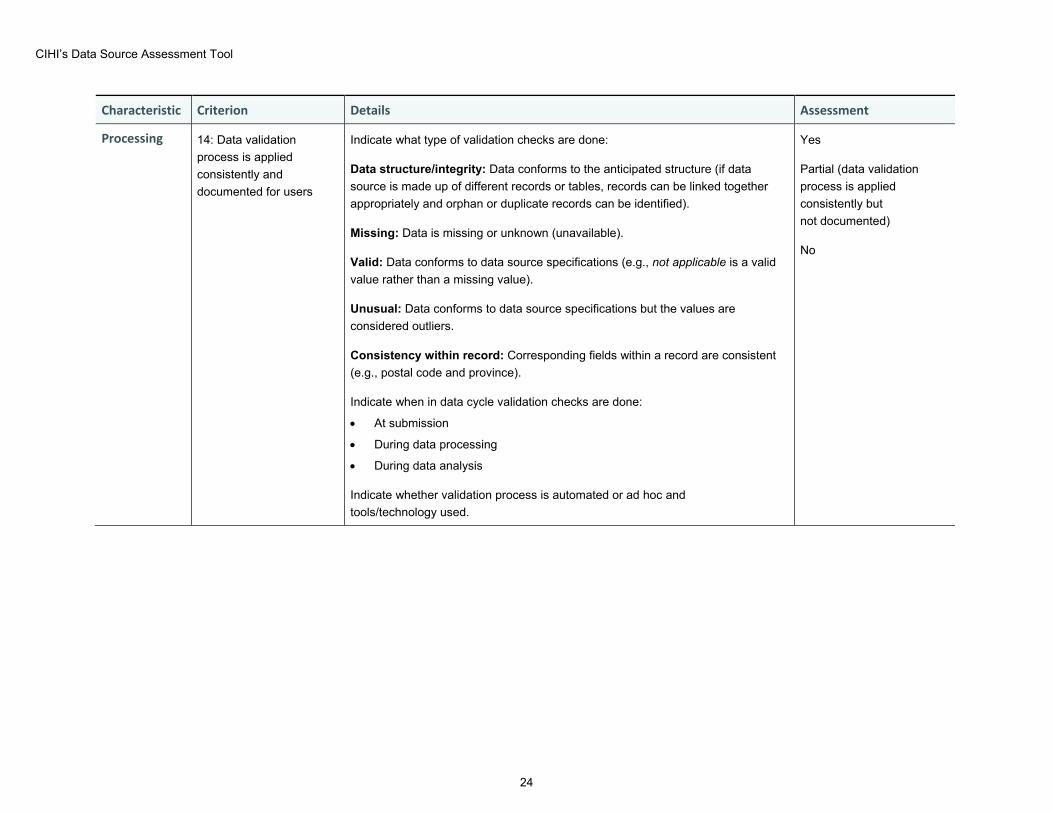
Processing 14: Data validation process is applied consistently and documented for users
Indicate what type of validation checks are done:
Data structure/integrity: Data conforms to the anticipated structure (if data source is made up of different records or tables, records can be linked together appropriately and orphan or duplicate records can be identified).
Missing: Data is missing or unknown (unavailable).
Valid: Data conforms to data source specifications (e.g., not applicable is a valid value rather than a missing value).
Unusual: Data conforms to data source specifications but the values are considered outliers.
Consistency within record: Corresponding fields within a record are consistent (e.g., postal code and province).
Indicate when in data cycle validation checks are done:
• At submission
• During data processing
• During data analysis
Indicate whether validation process is automated or ad hoc and tools/technology used.
Yes
Partial (data validation process is applied consistently but not documented)
No
CIHI’s Data Source Assessment Tool
25
Characteristic Criterion Details Assessment
Processing (cont’d)
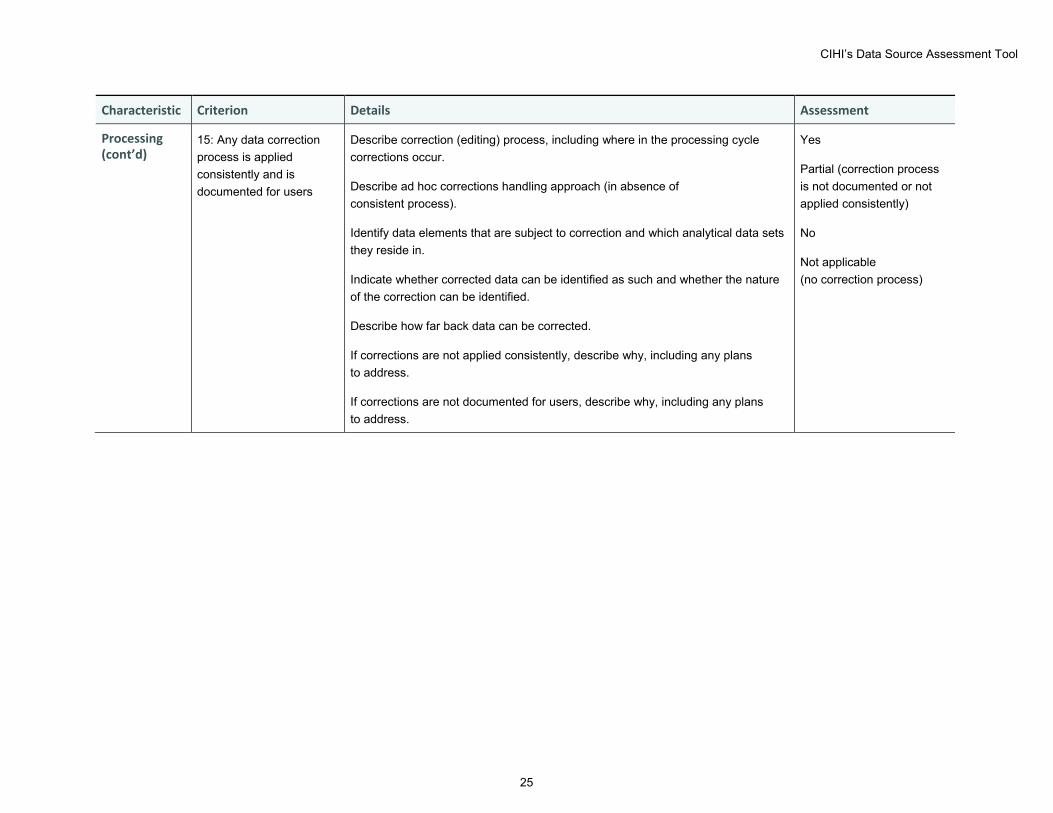
15: Any data correction process is applied consistently and is documented for users
Describe correction (editing) process, including where in the processing cycle corrections occur.
Describe ad hoc corrections handling approach (in absence of consistent process).
Identify data elements that are subject to correction and which analytical data sets they reside in.
Indicate whether corrected data can be identified as such and whether the nature of the correction can be identified.
Describe how far back data can be corrected.
If corrections are not applied consistently, describe why, including any plans to address.
If corrections are not documented for users, describe why, including any plans to address.
Yes
Partial (correction process is not documented or not applied consistently)
No
Not applicable (no correction process)

CIHI’s Data Source Assessment Tool
26
Characteristic Criterion Details Assessment
Processing (cont’d)
16: Any data imputation process is applied consistently and is documented for users
Describe imputation process, including where in the processing cycle it occurs.
Describe ad hoc imputation approach (in absence of consistent process).
Identify data elements that are subject to imputation and which analytical data sets they reside in.
Indicate whether imputed data can be identified and whether original values are retained (and where).
Describe any potential impact of imputation on statistical results; if this assessment has not been done, indicate why and any plans to address.
If imputation is not applied consistently, describe why, including any plans to address.
If imputation process is not documented for users, describe why, including any plans to address.
Yes
Partial (imputation process is not documented or not applied consistently)
No
Not applicable (no imputation)
17: Derived data elements are fully documented for users
Describe derivation methodology, including where it occurs in processing cycle.
Identify data elements that are derived and indicate whether they are available on all analytical data sets (if not, describe differences).
If derived variables are not documented, describe why, including any plans to address.
Yes
No
Not applicable (no derived data elements)
18: Systematic processing errors are documented for users
Provide details of current issues, including error description, response or resolution, and associated time frame, and potential impacts on interpretation and use of the data.
If systematic processing errors are not documented, describe why, including any plans to address.
Yes
No
Not applicable (no systematic processing errors)
Note * Coverage is measured differently for survey/sample data sources as outlined in criterion S6 in Table 7C.

CIHI’s Data Source Assessment Tool
27
Table 5C Data source assessment criteria, by dimension — Comparability and coherence
Characteristic Criterion Details Assessment
Concordance 19: Aggregated statistics have been compared, fully or partially, with other sources that provide the same or similar information on the same subject matter, and any differences are identified and explained to users
Identify type of comparison (e.g., exact match, ballpark estimate, combination).
Identify compared sources and provide results of comparison.
Explain reasons for differences (if applicable and known).
If aggregate statistics have not been compared with another source, describe why, including any plans to address.
Yes
No
Standardization 20: Exceptions to corporate data dictionary standards are documented for users
Provide assessment of compliance with corporate data standards (lagging, progressing, advancing, leading), including date of last assessment.
Yes
No
21: Where appropriate, specific classes of data are collected according to established national or international standards, and any variations on the standards used are documented for users
Indicate what standards or classifications are used.
Indicate whether any variations on the above are used (e.g., reference lists, subsets) and rationale.
If existing standards are not used for data collection, describe why, including any plans to address.
Yes
Partial (standards are used but variations are not documented)
No
Not applicable (no relevant standards)

CIHI’s Data Source Assessment Tool
28
Characteristic Criterion Details Assessment
Standardization (cont’d)
22: Consistent conversion between versions of standards and across different standards used within the data source is supported
Describe support mechanism used:
• Standard aggregation/groupings
• Mapping tables
• Lookup tables
• Crosswalks
• Guidelines
• Other
If mechanisms are not in place to support consistent conversion, describe why, including any plans to address.
Yes
No
Not applicable (no relevant standards)
Linkage 23a: Data elements that link unique clients are available, are clearly identified and remain stable over time
Identify client linkage data elements and provide
• Definition
• Item response rate for current and previous years
• Trend assessment (stable, declining, improving, fluctuating, etc.)
Yes
Partial (linkage elements are not clearly identified or are not stable over time, based on trend)
No
Not applicable
23b: Client linkage limitations that impact analysis and interpretation are documented for users
Describe any known issues with linkage elements.
If client linkage issues are not documented for users, describe why, including any plans to address.
Yes
No
Not applicable (no linkage limitations)

CIHI’s Data Source Assessment Tool
29
Characteristic Criterion Details Assessment
Linkage (cont’d)
24a: Data elements that link unique organizations are available, are clearly identified and remain stable over time
Identify organization linkage data elements and provide
• Definition
• Item response rate for current and previous years
• Trend assessment (stable, declining, improving, fluctuating, etc.)
Yes
Partial (linkage elements are not clearly identified or are not stable over time, based on trend)
No
Not applicable
24b: Organization linkage limitations that impact analysis and interpretation are documented for users
Describe any known issues with linkage elements.
If organization linkage issues are not documented for users, describe why, including any plans to address.
Yes
No
Not applicable (no linkage limitations)
25a: Data elements that link unique health care providers are available, are clearly identified and remain stable over time
Identify provider linkage data elements and provide
• Definition
• Item response rate for current and previous years
• Trend assessment (stable, declining, improving, fluctuating, etc.)
Yes
Partial (linkage elements are not clearly identified or are not stable over time, based on trend)
No
Not applicable
25b: Health care provider linkage limitations that impact analysis and interpretation are documented for users
Describe any known issues with linkage elements.
If provider linkage issues are not documented for users, describe why, including any plans to address.
Yes
No
Not applicable (no linkage limitations)
CIHI’s Data Source Assessment Tool
30
Characteristic Criterion Details Assessment
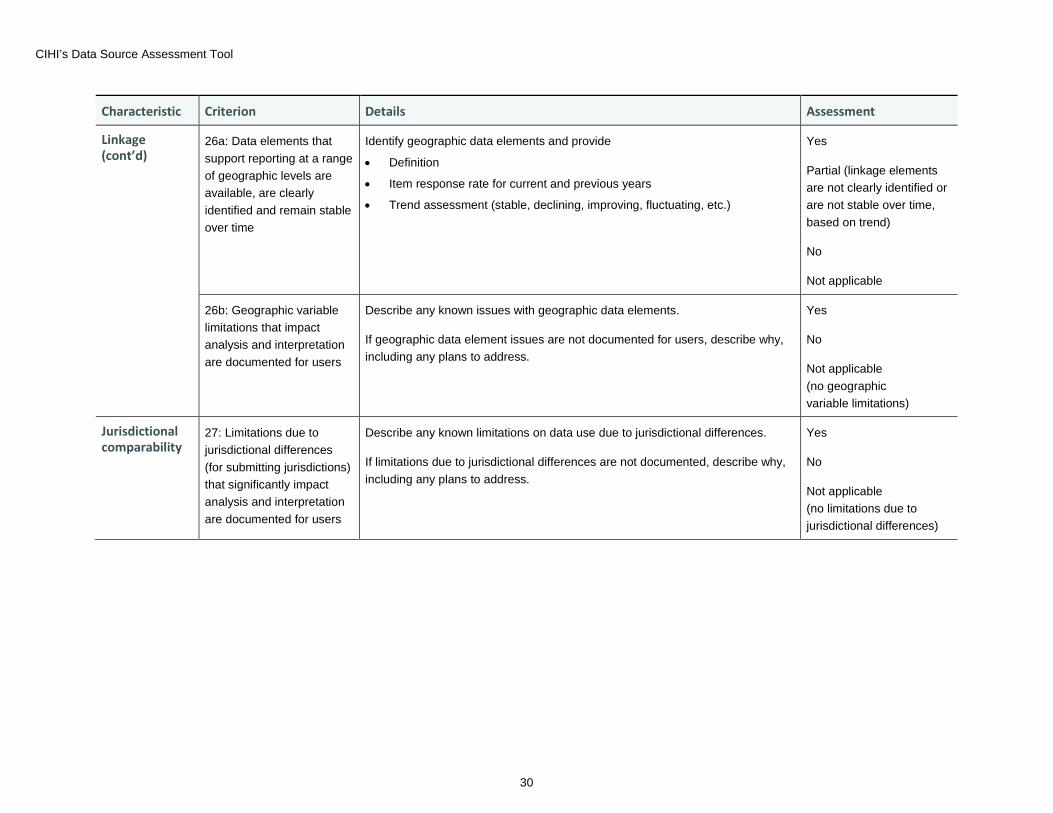
Linkage (cont’d)
26a: Data elements that support reporting at a range of geographic levels are available, are clearly identified and remain stable over time
Identify geographic data elements and provide
• Definition
• Item response rate for current and previous years
• Trend assessment (stable, declining, improving, fluctuating, etc.)
Yes
Partial (linkage elements are not clearly identified or are not stable over time, based on trend)
No
Not applicable
26b: Geographic variable limitations that impact analysis and interpretation are documented for users
Describe any known issues with geographic data elements.
If geographic data element issues are not documented for users, describe why, including any plans to address.
Yes
No
Not applicable (no geographic variable limitations)
Jurisdictional comparability
27: Limitations due to jurisdictional differences (for submitting jurisdictions) that significantly impact analysis and interpretation are documented for users
Describe any known limitations on data use due to jurisdictional differences.
If limitations due to jurisdictional differences are not documented, describe why, including any plans to address.
Yes
No
Not applicable (no limitations due to jurisdictional differences)

CIHI’s Data Source Assessment Tool
31
Characteristic Criterion Details Assessment
Historical comparability
28: Historical changes to the data source are centrally documented for users and can easily be tracked
Describe data source components that changes are documented for and indicate time period covered by documentation:
• Data elements (definitions, codes, etc.)
• Concepts
• Methodology
• Population
• Data capture
• Data submission
• Data providers
• Data processing
• Other
If historical changes to the data source are not centrally documented, describe why, including any plans to address.
Yes
No
Not applicable (no historical changes)
29a: Trend analysis is used to evaluate changes in core data elements
Describe trend analysis approach.
Describe whether trend analysis showed any major issues or a potential decrease in quality, including any plans to address findings.
If changes in core data elements have not been evaluated using trend analysis, describe why, including any plans to address.
Yes
No
Not applicable (insufficient time points for trending)
29b: Changes in core data elements that significantly impact analysis and interpretation are documented for users
Describe changes to core data elements and provide explanations for trend anomalies.
If changes to core data elements have not been documented, describe why, including any plans to address.
Yes
No
Not applicable (no changes or changes have no significant impact on use)
CIHI’s Data Source Assessment Tool
32
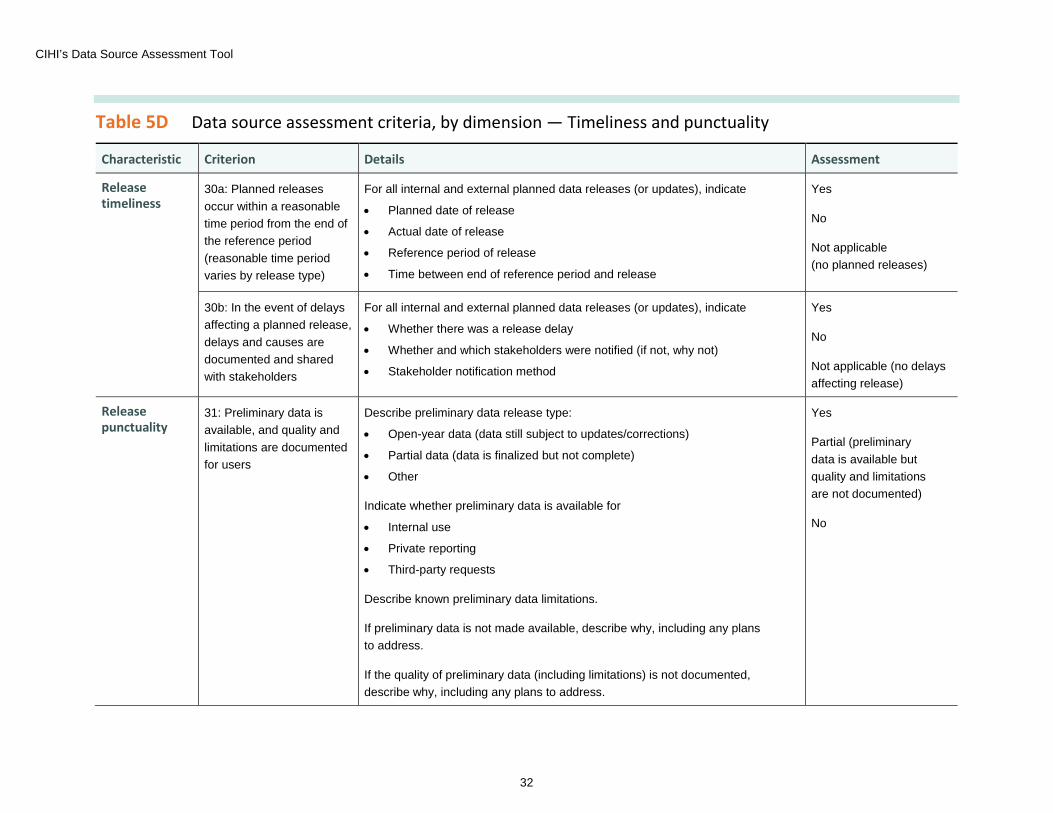
Table 5D Data source assessment criteria, by dimension — Timeliness and punctuality
Characteristic Criterion Details Assessment
Release timeliness
30a: Planned releases occur within a reasonable time period from the end of the reference period (reasonable time period varies by release type)
For all internal and external planned data releases (or updates), indicate
• Planned date of release
• Actual date of release
• Reference period of release
• Time between end of reference period and release
Yes
No
Not applicable (no planned releases)
30b: In the event of delays affecting a planned release, delays and causes are documented and shared with stakeholders
For all internal and external planned data releases (or updates), indicate
• Whether there was a release delay
• Whether and which stakeholders were notified (if not, why not)
• Stakeholder notification method
Yes
No
Not applicable (no delays affecting release)
Release punctuality
31: Preliminary data is available, and quality and limitations are documented for users
Describe preliminary data release type:
• Open-year data (data still subject to updates/corrections)
• Partial data (data is finalized but not complete)
• Other
Indicate whether preliminary data is available for
• Internal use
• Private reporting
• Third-party requests
Describe known preliminary data limitations.
If preliminary data is not made available, describe why, including any plans to address.
If the quality of preliminary data (including limitations) is not documented, describe why, including any plans to address.
Yes
Partial (preliminary data is available but quality and limitations are not documented)
No

CIHI’s Data Source Assessment Tool
33
Characteristic Criterion Details Assessment
Submission timeliness
32a: Data is submitted on time by data providers
Indicate rate of late submissions (file level or record level as applicable).
For file-level late submission, indicate the number of days elapsed after the submission deadline for receipt of the files, for each jurisdiction and overall.
For record-level submission, indicate the proportion of records submitted after the submission deadline, for each jurisdiction and overall, according to the following formula:
A ÷ B × 100%, where A = the number of records submitted after the annual or quarterly submission deadline B = the total number of records submitted within the reporting year or quarter
Yes
No
32b: Mechanisms created or changes made to address issues or improve submission timeliness are evaluated for effectiveness
Identify submission timeliness improvement mechanisms used (e.g., public/private timeliness indicators, data provider engagement) and evaluate effectiveness as high, medium or low based on the following guidelines:
High: Mechanism has resulted in known timeliness improvement efforts that have significantly reduced late submissions or shortened submission timelines by many data providers.
Medium: Mechanism has resulted in known timeliness improvement efforts that have reduced some late submissions by some data providers.
Low: Mechanism has resulted in little to no reduction in late submissions.
If submission timeliness improvement mechanisms are not in place, describe why, including any plans to address.
Yes
No
CIHI’s Data Source Assessment Tool
34
Characteristic Criterion Details Assessment
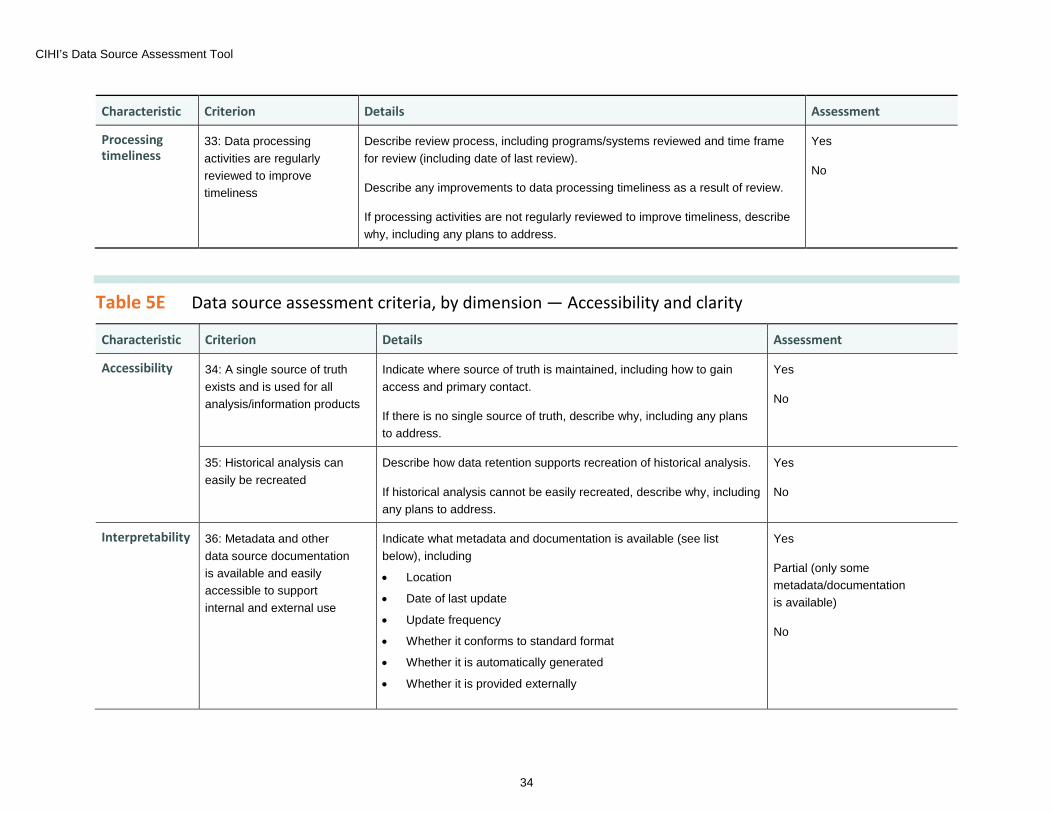
Processing timeliness
33: Data processing activities are regularly reviewed to improve timeliness
Describe review process, including programs/systems reviewed and time frame for review (including date of last review).
Describe any improvements to data processing timeliness as a result of review.
If processing activities are not regularly reviewed to improve timeliness, describe why, including any plans to address.
Yes
No
Table 5E Data source assessment criteria, by dimension — Accessibility and clarity
Characteristic Criterion Details Assessment
Accessibility 34: A single source of truth exists and is used for all analysis/information products
Indicate where source of truth is maintained, including how to gain access and primary contact.
If there is no single source of truth, describe why, including any plans to address.
Yes
No
35: Historical analysis can easily be recreated
Describe how data retention supports recreation of historical analysis.
If historical analysis cannot be easily recreated, describe why, including any plans to address.
Yes
No
Interpretability 36: Metadata and other data source documentation is available and easily accessible to support internal and external use
Indicate what metadata and documentation is available (see list below), including
• Location
• Date of last update
• Update frequency
• Whether it conforms to standard format
• Whether it is automatically generated
• Whether it is provided externally
Yes
Partial (only some metadata/documentation is available)
No

CIHI’s Data Source Assessment Tool
35
Characteristic Criterion Details Assessment
Interpretability (cont’d)
Metadata and documentation should cover the following:
Concepts and definitions
• Glossary of terms and abbreviations
• Populations of interest and reference
• Analytical entities
• Data structure
• Data elements
Processes and methods
• Data providers
• Data collection
• Data processing
• Quality control
• Timeliness
Data quality (including metrics, issues and limitations)
• Coverage
• Item availability
• Duplicate records
• Formation of analytical entities
• Consistency, bias and other measurement issues
• Jurisdictional comparability
• Comparability with other sources

CIHI’s Data Source Assessment Tool
36
Characteristic Criterion Details Assessment
Interpretability (cont’d)
Historical changes/comparison of data over time
• Changes in population
• Changes in content and data collection standards
• Changes to processes and methods
• Changes in data quality
• Historical revisions
Technical/operational documentation
• System design artefacts
• Standard operating procedures for production
37: A revision policy exists for all data releases and is made known to external data users
Describe revision policy and whether it follows any stipulated revision guidelines. Include the types of revisions covered (late data submission, corrections to previously released and used data, etc.).
If revision policy does not exist, describe why, including any plans to address.
If revision policy is not made public, describe why, including any plans to address.
Definitions
Revision: A change to the data or to the estimates based on the data after the data has been released.
Revision policy: Database-specific policy that outlines when to release revised data based on the severity of errors or updates.
Yes
Partial (revision policy exists but is not public)
No

CIHI’s Data Source Assessment Tool
37
Characteristic Criterion Details Assessment
Interpretability (cont’d)
38: Impact of any revisions is assessed and documented for users
Describe recent revisions (at minimum for prior year), including whether revision policy was applied (if applicable).
Describe results of impact assessment, including root cause and future mitigation plans.
If impact of revisions was not documented for users, describe why, including any plans to address.
Definition
Revision: A change to the data or to the estimates based on the data after the data has been released.
Yes
Partial (impact of revisions assessed but not documented)
No
Not applicable (no revisions)

CIHI’s Data Source Assessment Tool
38
4 Survey/sample data source characteristics and criteria
These supplementary characteristics and criteria are to be used in addition to the general set to describe and assess the quality of the survey-/sampling-specific components related to data sources that contain survey results or sample data.
Table 6 Data source key characteristics for survey or sample data
Characteristic Details
Frame Target population: This is the population of interest; ideally, this coincides with the sampling frame, but it may not always.
Sampling frame: This is the population to be sampled from; it may be different from the target population as described above.
Collection period
Sample design Type of sampling • Simple random sample
• Clustered sample
• Multi-stage sample
• Stratified sample
• Systematic sample
• Other
Required response rate (e.g., to allow for desired precision of estimates)
Possible precision of estimates (based on frame and sample size)
Weighting Indicate whether results are weighted for differences in probabilities of selection.
If yes, describe weighting methodology or approach.

CIHI’s Data Source Assessment Tool
39
Table 7A Survey/sample assessment criteria, by dimension — Accessibility and clarity
Characteristic Criterion Details Assessment
Survey/sample design
S1: Survey/sample design is fully documented for users
Describe rationale for chosen survey/sample design.
Provide overview of design.
If survey/sample design is not documented for users, describe why, including plans to address.
Yes
No
Table 7B Survey/sample assessment criteria, by dimension — Comparability and coherence
Characteristic Criterion Details Assessment
Historical comparability
S2: For recurring surveys, changes to survey/sample design over time are documented for users
Describe changes in sample design over time for recurring surveys.
Describe impact of changes on results and trending.
If changes in sample design over time are not documented for users, describe why, including any plans to address.
Yes
No
Not applicable (survey not recurring)

CIHI’s Data Source Assessment Tool
40
Table 7C Survey/sample assessment criteria, by dimension — Accuracy and reliability
Characteristic Criterion Details Assessment
Survey/sampling frame
S3: For recurring surveys, a systematic approach is in place for updating the frame and for monitoring coverage and response patterns to maintain adequate coverage of the target population
Describe frame maintenance approach.
Indicate when frame was last updated.
If a systematic frame maintenance and monitoring approach is not in place, describe why, including plans to address.
Yes
No
Not applicable (survey not recurring)
Questionnaire design
S4: Questionnaire (or other data collection instrument) was designed to maximize response rate while minimizing respondent and processing burden
Describe rationale for chosen questionnaire/instrument and associated capture and collection processes. Consider the following:
• Are the questions justified and sufficient for reaching the analytical goals of the survey?
• Are instruments designed to minimize cost and time? Do they allow for automated data capture?
• Are follow-up procedures in place to handle missing data or other issues?
• Are support mechanisms in place to encourage accurate response?
• Is information available to manage and monitor all aspects of the collection (e.g., response rates, edit failure rates, respondent feedback, quality control information, expenditures)?
If questionnaire was not designed to maximize response rate or minimize respondent or processing burden, describe why, including any plans to address.
Yes
No

CIHI’s Data Source Assessment Tool
41
Characteristic Criterion Details Assessment
Questionnaire design (cont’d)
S5: Questionnaire (or other data collection instrument) was pre-tested for each mode of collection to ensure accuracy and robustness
Describe pre-testing approach.
Describe testing results and adjustments made to questionnaire/instrument (if any).
If pre-testing was not done, describe why, including any plans to address.
Yes
Partial (testing occurred but not for each mode of collection)
No
Coverage* S6a: Unit response/non-response is documented and assessed for users
Describe (overall and/or by category)
• Target sample size (based on sample design)
• Set sample size (number of units drawn from the frame)
• Achieved sample size
• Unit response rate
• Potential impact on key estimates
If unit response/non-response is not documented for users, describe why, including any plans to address.
Yes
No
S6b: Significant issues related to coverage of sample-based data that impact analysis and interpretation are documented
Describe any deficiencies around coverage: sample size, frame coverage and coverage (based on survey characteristics).
Describe the potential impact of these deficiencies on key estimates.
Describe any methods used to address coverage issues and potential coverage error.
If significant issues related to coverage are not documented, describe why, including plans to address.
Yes
No
Not applicable (no significant coverage issues)

CIHI’s Data Source Assessment Tool
42
Characteristic Criterion Details Assessment
Capture and collection
S7: Differences in collection that may impact results are assessed and documented for users
For the following collection characteristics, describe any differences, including potential impact and plans to address:
• Collection method or mode
• Field period
• Jurisdictional variations
• Language
• Survey frequency
• Other
If potential impact of different collection modes on results was not assessed, describe why, including any plans to address.
If the reason potential impact of different collection modes on results is not documented, describe why, including any plans to address.
Yes
Partial (impact was assessed but not documented)
No
Not applicable (no differences in collection)
Non-response bias
S8: Non-response bias is assessed and documented for users
Describe potential sources of non-response (unit and item non-response).
Provide an estimate of bias (if possible) or describe potential differences between responders and non-responders, and refer to any relevant studies.
Describe methods used to address non-response.
When weighting is required, indicate whether a weight is associated with each sampled unit in the database after the data processing is complete.
If non-response bias was not assessed, describe why, including any plans to address.
If potential non-response bias was not documented for users, describe why, including any plans to address.
Yes
Partial (non-response bias was assessed but not documented for users)
No

CIHI’s Data Source Assessment Tool
43
Characteristic Criterion Details Assessment
Precision of estimates
S9: Survey/sample design effects on estimation are assessed and documented for users
Describe how design estimates were done, including which survey estimates they were done for and whether a typical design effect was derived.
If design effects were not estimated, describe why, including any plans to address.
If design effects on estimation are not documented for users, describe why, including any plans to address.
Yes
Partial (design effects calculated but not documented for users)
No
S10: The precision of estimates is at an acceptable level
For key estimates, identify
• Variance of the estimate
• Standard error
• Coefficient of variation
• 95% confidence interval
Describe any feedback from users on the fitness of the estimates for their intended use.
Identify any estimates where precision is not at an acceptable level, including potential reasons and any plans to address. Acceptable level can be determined based on proximity to “possible precision of estimates” indicated in survey/sample key characteristics, and intended use of the information. A general guideline is that the coefficient of variation should be less than 16.6%.
Yes
No
Note * Coverage is measured differently for survey/sample data sources and criterion S6 should replace the general coverage criteria (criteria 5a, 5b, 5c) in Table 5B for assessments of
survey/sample data sources.

CIHI’s Data Source Assessment Tool
44
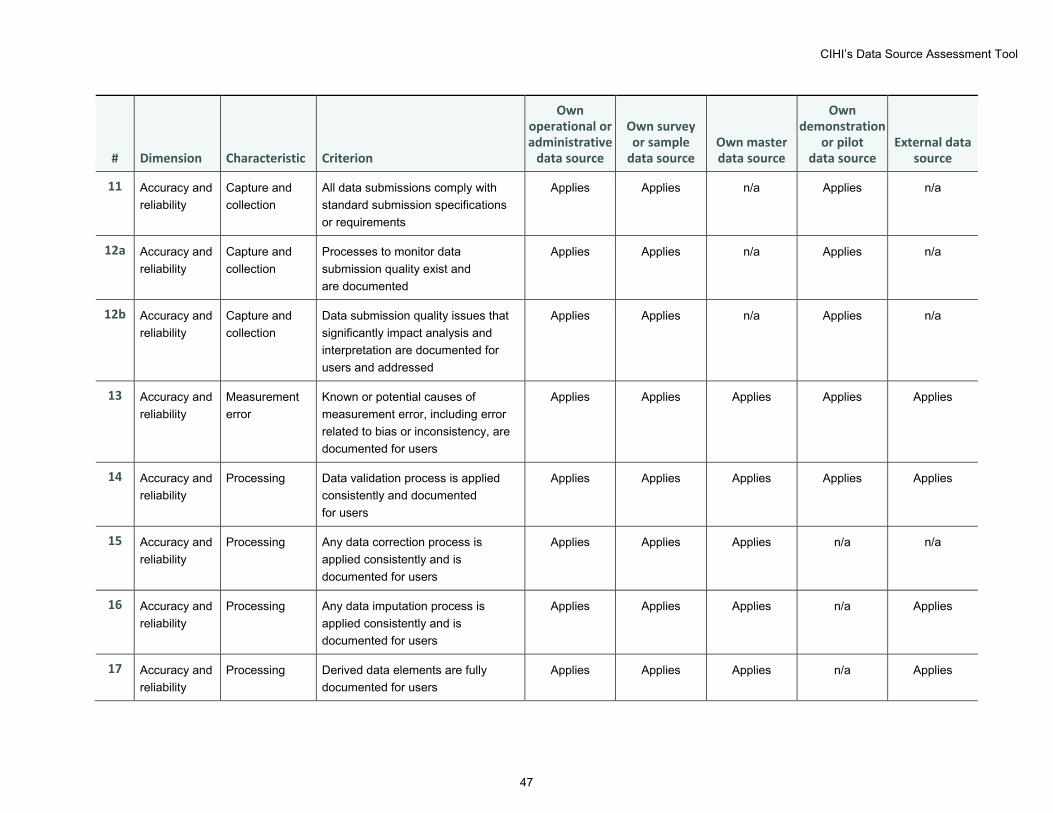
Appendix A: Assessment scope matrix This matrix identifies which criteria are most relevant to different types of data sources. It is meant to be used as a guideline to determine the scope of an assessment. Some criteria may be relevant but not reasonably assessable and therefore considered out of scope for an assessment; in cases like these, this should be documented in the assessment results.
Table A1 Assessment criteria scope matrix
# Dimension Characteristic Criterion
Own operational or administrative
data source
Own survey or sample
data source Own master data source
Own demonstration
or pilot data source
External data source
1 Relevance Release and use
All known uses of the data from the data source are documented
Applies Applies Applies n/a n/a
2 Relevance Value The data source contains information that can inform priority themes and populations
Applies Applies n/a Applies Applies
3 Relevance Value Quality improvement action plans exist and are implemented to improve relevance and meet emerging needs
Applies Applies Applies n/a n/a
4a Relevance Adaptability Mechanisms to identify client and stakeholder needs exist and are evaluated for effectiveness
Applies Applies Applies Applies n/a
4b Relevance Adaptability Client and stakeholder needs are prioritized and implemented
Applies Applies Applies Applies n/a

CIHI’s Data Source Assessment Tool
45
# Dimension Characteristic Criterion
Own operational or administrative
data source
Own survey or sample
data source Own master data source
Own demonstration
or pilot data source
External data source
5a Accuracy and reliability
Coverage Populations of interest, populations of reference and submitted populations are documented, and coverage is quantifiable at both the submitting unit level and the unit(s) of analysis
Applies Applies n/a Applies Applies
5b Accuracy and reliability
Coverage Coverage rates are documented via standardized tables and are updated routinely or with each data release
Applies n/a Applies n/a Applies
5c Accuracy and reliability
Coverage Significant coverage issues that impact analysis and interpretation are documented for users
Applies n/a n/a Applies Applies
6a Accuracy and reliability
Coverage Processes exist to identify and handle duplicate and potential duplicate records within the data
Applies Applies Applies Applies n/a
6b Accuracy and reliability
Coverage Problems with duplicate records that can impact analysis and interpretation are documented for users and updated with each data release
Applies Applies Applies Applies Applies
7 Accuracy and reliability
Coverage Records are complete for data sources that are designed to be longitudinal
Applies Applies n/a Applies Applies

CIHI’s Data Source Assessment Tool
46
# Dimension Characteristic Criterion
Own operational or administrative
data source
Own survey or sample
data source Own master data source
Own demonstration
or pilot data source
External data source
8a Accuracy and reliability
Item availability Standard data profiling results, including rates of valid, invalid, missing and outlier values, are documented and updated routinely or with each data release
Applies Applies Applies Applies Applies
8b Accuracy and reliability
Item availability Standard data profiling results, including rates of valid, invalid, missing and outlier values, fall within an acceptable range
Applies Applies Applies Applies Applies
8c Accuracy and reliability
Item availability Any issues related to the identification of item non-response are documented for users
Applies Applies Applies Applies Applies
9a Accuracy and reliability
Lineage Data lineage prior to submission is known and documented for users
Applies Applies Applies Applies Applies
9b Accuracy and reliability
Lineage Differences in data lineage prior to submission that can impact analysis and interpretation are documented for users and updated routinely or with each data release
Applies Applies Applies Applies Applies
10 Accuracy and reliability
Capture and collection
Mechanisms to support data providers in capturing high-quality information and to reduce response burden exist and are evaluated for effectiveness
Applies Applies n/a Applies n/a
CIHI’s Data Source Assessment Tool
47
# Dimension Characteristic Criterion
Own operational or administrative
data source
Own survey or sample
data source Own master data source
Own demonstration
or pilot data source
External data source
11 Accuracy and reliability
Capture and collection
All data submissions comply with standard submission specifications or requirements
Applies Applies n/a Applies n/a
12a Accuracy and reliability
Capture and collection
Processes to monitor data submission quality exist and are documented
Applies Applies n/a Applies n/a
12b Accuracy and reliability
Capture and collection
Data submission quality issues that significantly impact analysis and interpretation are documented for users and addressed
Applies Applies n/a Applies n/a
13 Accuracy and reliability
Measurement error
Known or potential causes of measurement error, including error related to bias or inconsistency, are documented for users
Applies Applies Applies Applies Applies
14 Accuracy and reliability
Processing Data validation process is applied consistently and documented for users
Applies Applies Applies Applies Applies
15 Accuracy and reliability
Processing Any data correction process is applied consistently and is documented for users
Applies Applies Applies n/a n/a
16 Accuracy and reliability
Processing Any data imputation process is applied consistently and is documented for users
Applies Applies Applies n/a Applies
17 Accuracy and reliability
Processing Derived data elements are fully documented for users
Applies Applies Applies n/a Applies

CIHI’s Data Source Assessment Tool
48
# Dimension Characteristic Criterion
Own operational or administrative
data source
Own survey or sample
data source Own master data source
Own demonstration
or pilot data source
External data source
18 Accuracy and reliability
Processing Systematic processing errors are documented for users
Applies Applies Applies n/a n/a
19 Comparability and coherence
Concordance Aggregated statistics have been compared, fully or partially, with other sources that provide the same or similar information on the same subject matter, and any differences are identified and explained to users
Applies Applies Applies Applies Applies
20 Comparability and coherence
Standardization Exceptions to corporate data dictionary standards are documented for users
Applies Applies Applies n/a n/a
21 Comparability and coherence
Standardization Where appropriate, specific classes of data are collected according to established national or international standards, and any variations on the standards used are documented for users
Applies Applies Applies Applies Applies
22 Comparability and coherence
Standardization Consistent conversion between versions of standards and across different standards used within the data source is supported
Applies Applies Applies n/a Applies
23a Comparability and coherence
Linkage Data elements that link unique clients are available, are clearly identified and remain stable over time
Applies Applies Applies Applies Applies

CIHI’s Data Source Assessment Tool
49
# Dimension Characteristic Criterion
Own operational or administrative
data source
Own survey or sample
data source Own master data source
Own demonstration
or pilot data source
External data source
23b Comparability and coherence
Linkage Client linkage limitations that impact analysis and interpretation are documented for users
Applies Applies Applies Applies Applies
24a Comparability and coherence
Linkage Data elements that link unique organizations are available, are clearly identified and remain stable over time
Applies Applies Applies Applies Applies
24b Comparability and coherence
Linkage Organization linkage limitations that impact analysis and interpretation are documented for users
Applies Applies Applies Applies Applies
25a Comparability and coherence
Linkage Data elements that link unique health care providers are available, are clearly identified and remain stable over time
Applies Applies Applies Applies Applies
25b Comparability and coherence
Linkage Health care provider linkage limitations that impact analysis and interpretation are documented for users
Applies Applies Applies Applies Applies
26a Comparability and coherence
Linkage Data elements that support reporting at a range of geographic levels are available, are clearly identified and remain stable over time
Applies Applies Applies Applies Applies
26b Comparability and coherence
Linkage Geographic variable limitations that impact analysis and interpretation are documented for users
Applies Applies Applies Applies Applies
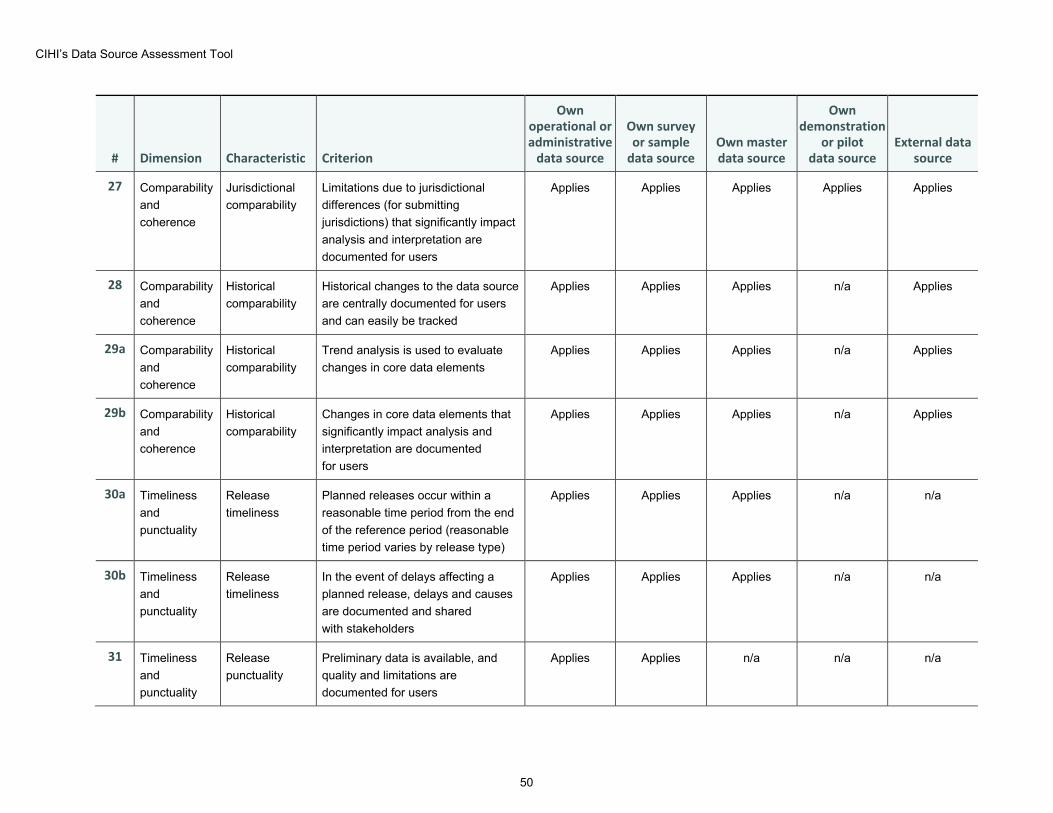
CIHI’s Data Source Assessment Tool
50
# Dimension Characteristic Criterion
Own operational or administrative
data source
Own survey or sample
data source Own master data source
Own demonstration
or pilot data source
External data source
27 Comparability and coherence
Jurisdictional comparability
Limitations due to jurisdictional differences (for submitting jurisdictions) that significantly impact analysis and interpretation are documented for users
Applies Applies Applies Applies Applies
28 Comparability and coherence
Historical comparability
Historical changes to the data source are centrally documented for users and can easily be tracked
Applies Applies Applies n/a Applies
29a Comparability and coherence
Historical comparability
Trend analysis is used to evaluate changes in core data elements
Applies Applies Applies n/a Applies
29b Comparability and coherence
Historical comparability
Changes in core data elements that significantly impact analysis and interpretation are documented for users
Applies Applies Applies n/a Applies
30a Timeliness and punctuality
Release timeliness
Planned releases occur within a reasonable time period from the end of the reference period (reasonable time period varies by release type)
Applies Applies Applies n/a n/a
30b Timeliness and punctuality
Release timeliness
In the event of delays affecting a planned release, delays and causes are documented and shared with stakeholders
Applies Applies Applies n/a n/a
31 Timeliness and punctuality
Release punctuality
Preliminary data is available, and quality and limitations are documented for users
Applies Applies n/a n/a n/a

CIHI’s Data Source Assessment Tool
51
# Dimension Characteristic Criterion
Own operational or administrative
data source
Own survey or sample
data source Own master data source
Own demonstration
or pilot data source
External data source
32a Timeliness and punctuality
Submission timeliness
Data is submitted on time by data providers
Applies Applies n/a n/a n/a
32b Timeliness and punctuality
Submission timeliness
Mechanisms created or changes made to address issues or improve submission timeliness are evaluated for effectiveness
Applies Applies n/a n/a n/a
33 Timeliness and punctuality
Processing timeliness
Data processing activities are regularly reviewed to improve timeliness
Applies Applies Applies n/a n/a
34 Accessibility and clarity
Accessibility A single source of truth exists and is used for all analysis/information products
Applies Applies Applies Applies Applies
35 Accessibility and clarity
Accessibility Historical analysis can easily be recreated
Applies Applies Applies n/a n/a
36 Accessibility and clarity
Interpretability Metadata and other data source documentation is available and easily accessible to support internal and external use
Applies Applies Applies Applies Applies
37 Accessibility and clarity
Interpretability A revision policy exists for all data releases and is made known to external data users
Applies Applies n/a n/a n/a
38 Accessibility and clarity
Interpretability Impact of any revisions is assessed and documented for users
Applies Applies Applies n/a n/a

CIHI’s Data Source Assessment Tool
52
# Dimension Characteristic Criterion
Own operational or administrative
data source
Own survey or sample
data source Own master data source
Own demonstration
or pilot data source
External data source
S1 Accessibility and clarity
Survey/sample design
Survey/sample design is fully documented for users
n/a Applies n/a n/a n/a
S2 Comparability and coherence
Historical comparability
For recurring surveys, changes to survey/sample design over time are documented for users
n/a Applies n/a n/a n/a
S3 Accuracy and reliability
Survey/sampling frame
For recurring surveys, a systematic approach is in place for updating the frame and for monitoring coverage and response patterns to maintain adequate coverage of the target population
n/a Applies n/a n/a n/a
S4 Accuracy and reliability
Questionnaire design
Questionnaire (or other data collection instrument) was designed to maximize response rate while minimizing respondent and processing burden
n/a Applies n/a n/a n/a
S5 Accuracy and reliability
Questionnaire design
Questionnaire (or other data collection instrument) was pre-tested for each mode of collection to ensure accuracy and robustness
n/a Applies n/a n/a n/a
S6a Accuracy and reliability
Coverage Unit response/non-response is documented and assessed for users
n/a Applies n/a n/a n/a
S6b Accuracy and reliability
Coverage Significant issues related to coverage of sample-based data that impact analysis and interpretation are documented
n/a Applies n/a n/a n/a
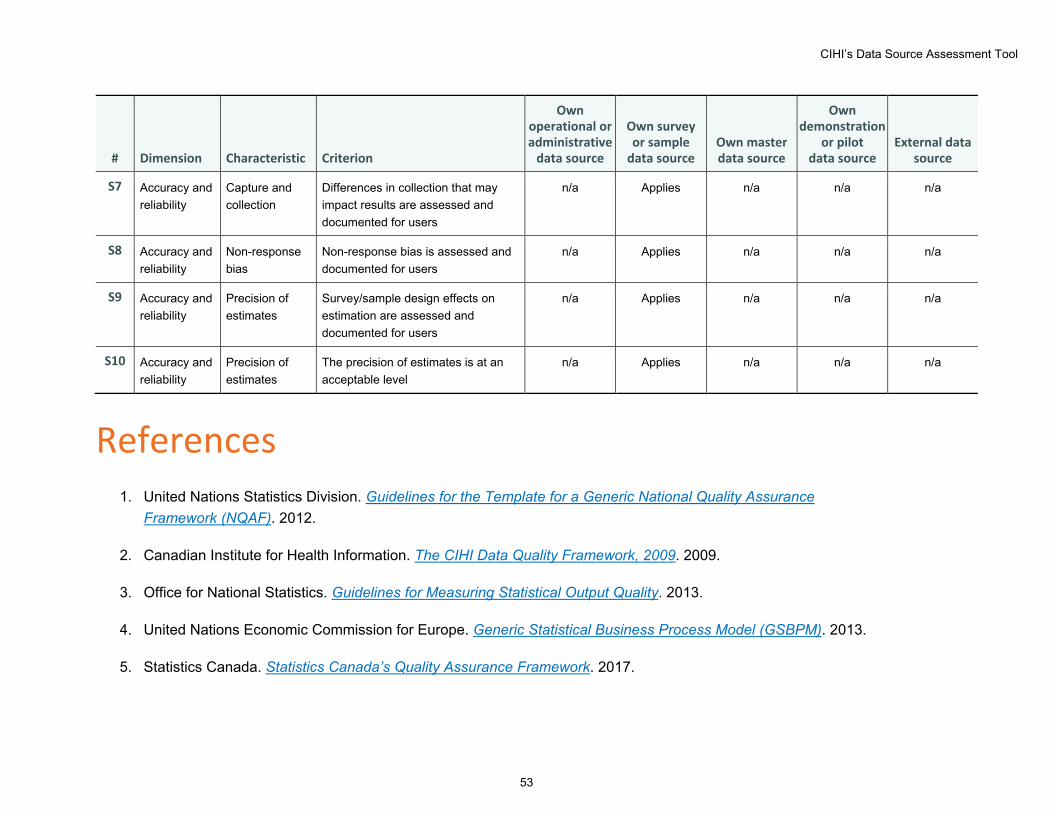
CIHI’s Data Source Assessment Tool
53
# Dimension Characteristic Criterion
Own operational or administrative
data source
Own survey or sample
data source Own master data source
Own demonstration
or pilot data source
External data source
S7 Accuracy and reliability
Capture and collection
Differences in collection that may impact results are assessed and documented for users
n/a Applies n/a n/a n/a
S8 Accuracy and reliability
Non-response bias
Non-response bias is assessed and documented for users
n/a Applies n/a n/a n/a
S9 Accuracy and reliability
Precision of estimates
Survey/sample design effects on estimation are assessed and documented for users
n/a Applies n/a n/a n/a
S10 Accuracy and reliability
Precision of estimates
The precision of estimates is at an acceptable level
n/a Applies n/a n/a n/a
References 1. United Nations Statistics Division. Guidelines for the Template for a Generic National Quality Assurance
Framework (NQAF). 2012.
2. Canadian Institute for Health Information. The CIHI Data Quality Framework, 2009. 2009.
3. Office for National Statistics. Guidelines for Measuring Statistical Output Quality. 2013.
4. United Nations Economic Commission for Europe. Generic Statistical Business Process Model (GSBPM). 2013.
5. Statistics Canada. Statistics Canada’s Quality Assurance Framework. 2017.
[email protected] Ottawa495 Richmond Road
Suite 600
Ottawa, Ont.
K2A 4H6
613-241-7860
CIHI Toronto 4110 Yonge Street
Suite 300
Toronto, Ont.
M2P 2B7
416-481-2002
CIHI Victoria 880 Douglas Street
Suite 600
Victoria, B.C.
V8W 2B7
250-220-4100
CIHI Montréal 1010 Sherbrooke Street West
Suite 602
Montréal, Que.
H3A 2R7
514-842-2226
cihi.ca15667-0617
Recommended