Introduction to Chromatography (HPLC)
2
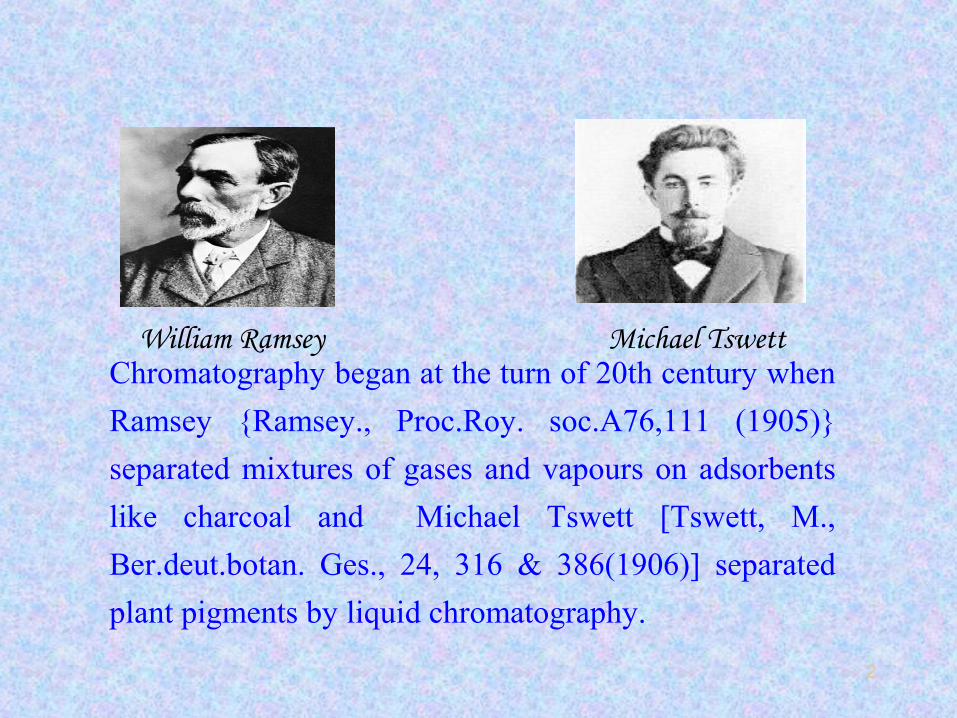
Chromatography began at the turn of 20th century when
Ramsey {Ramsey., Proc.Roy. soc.A76,111 (1905)}
separated mixtures of gases and vapours on adsorbents
like charcoal and Michael Tswett [Tswett, M.,
Ber.deut.botan. Ges., 24, 316 & 386(1906)] separated
plant pigments by liquid chromatography.
William Ramsey Michael Tswett

3
Tswett is credited as being the "Father of
Chromatography" principally because he coined the term
chromatography (literally colour writing) and
scientifically described the process.
4
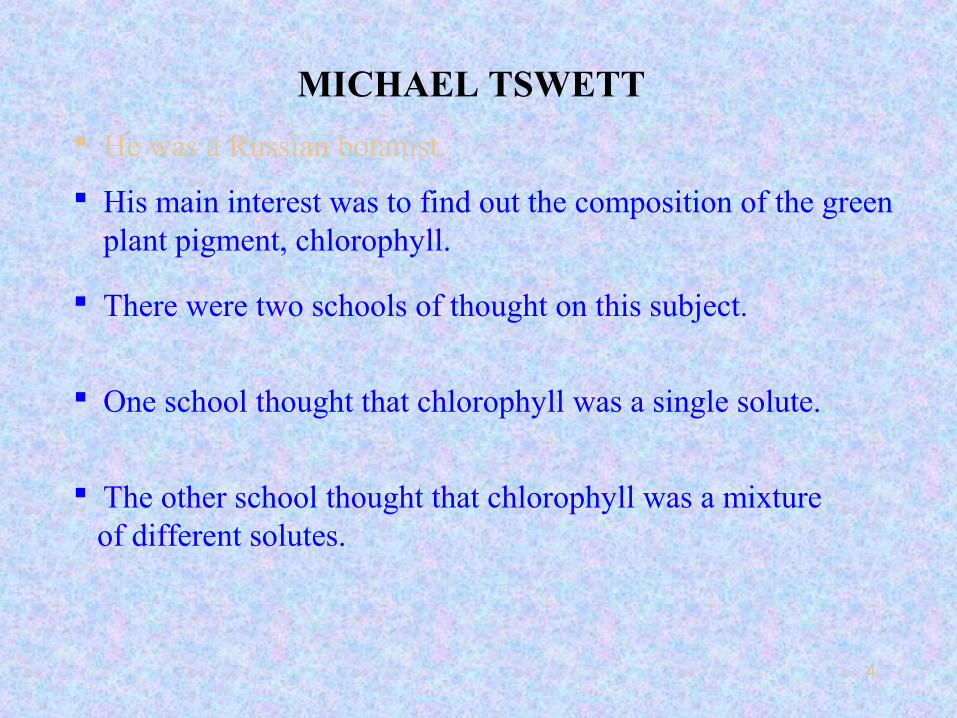
MICHAEL TSWETT
He was a Russian botanist.
His main interest was to find out the composition of the green plant pigment, chlorophyll.
There were two schools of thought on this subject.
One school thought that chlorophyll was a single solute.
The other school thought that chlorophyll was a mixture of different solutes.
5
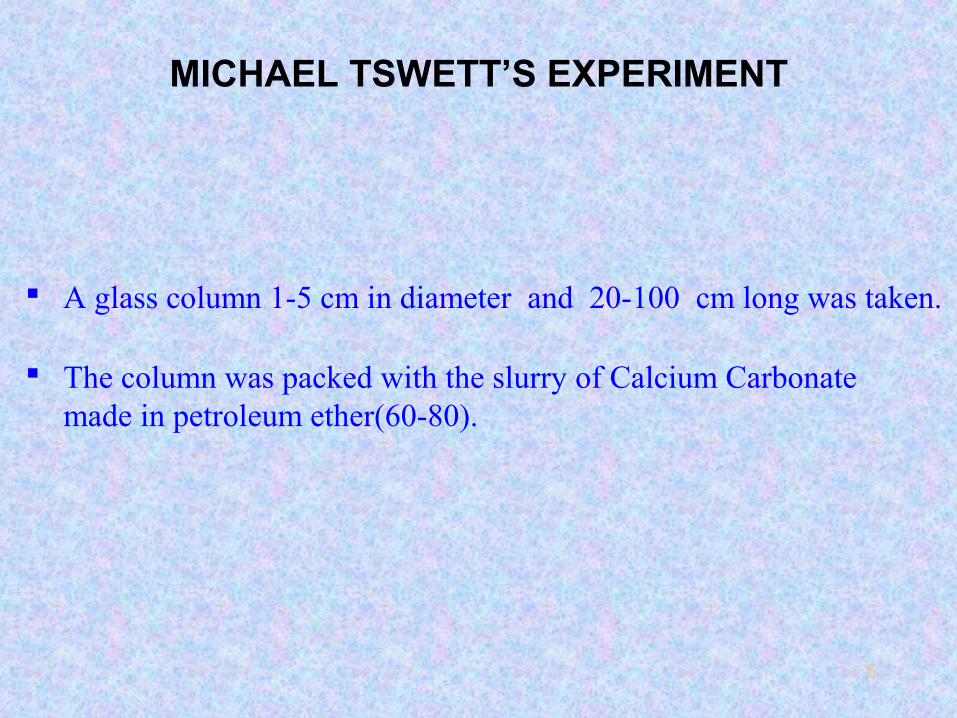
A glass column 1-5 cm in diameter and 20-100 cm long was taken.
The column was packed with the slurry of Calcium Carbonate made in petroleum ether(60-80).
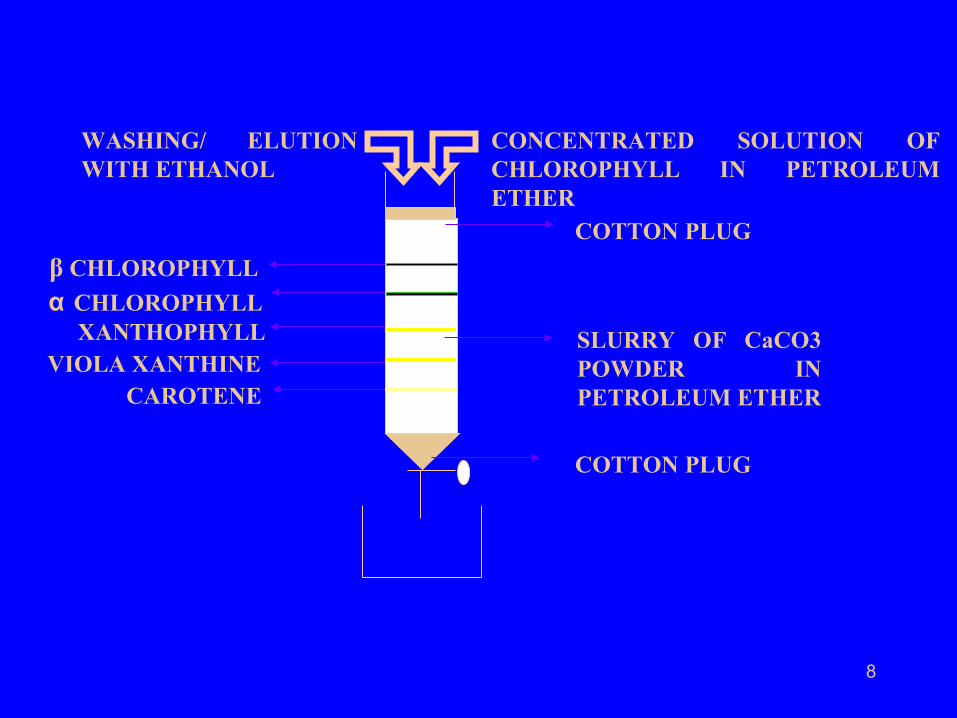
MICHAEL TSWETT’S EXPERIMENT
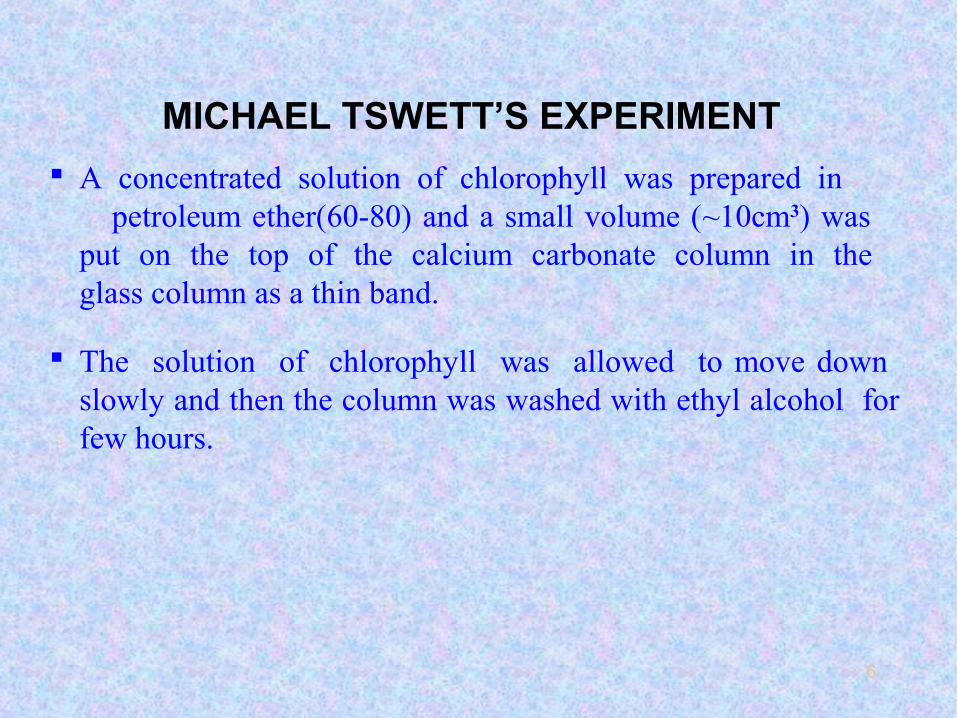
6
The solution of chlorophyll was allowed to move down slowly and then the column was washed with ethyl alcohol for few hours.
A concentrated solution of chlorophyll was prepared in petroleum ether(60-80) and a small volume (~10cm3) was put on the top of the calcium carbonate column in the glass column as a thin band.
MICHAEL TSWETT’S EXPERIMENT
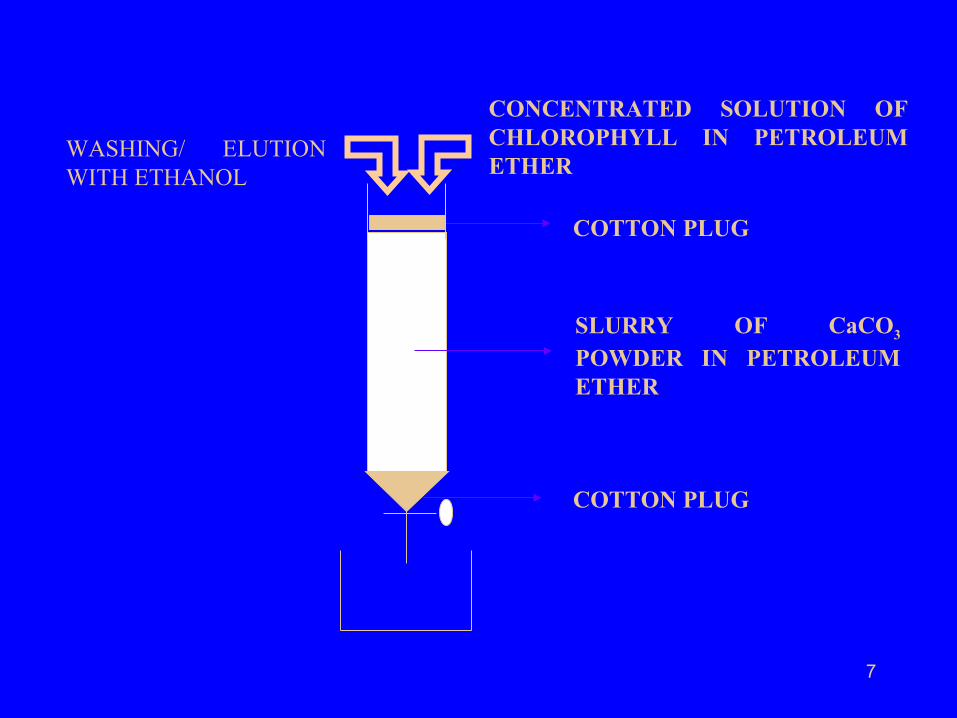
7
COTTON PLUG
SLURRY OF CaCO3 POWDER IN PETROLEUM ETHER
COTTON PLUG
CONCENTRATED SOLUTION OF CHLOROPHYLL IN PETROLEUM ETHER
WASHING/ ELUTION WITH ETHANOL
8
β CHLOROPHYLL
α CHLOROPHYLL XANTHOPHYLL VIOLA XANTHINE CAROTENE
COTTON PLUG
SLURRY OF CaCO3 POWDER IN PETROLEUM ETHER
COTTON PLUG
CONCENTRATED SOLUTION OF CHLOROPHYLL IN PETROLEUM ETHER
WASHING/ ELUTION WITH ETHANOL
9
• Each band was removed from the column and identified.
• It was concluded that chlorophyll is a mixture
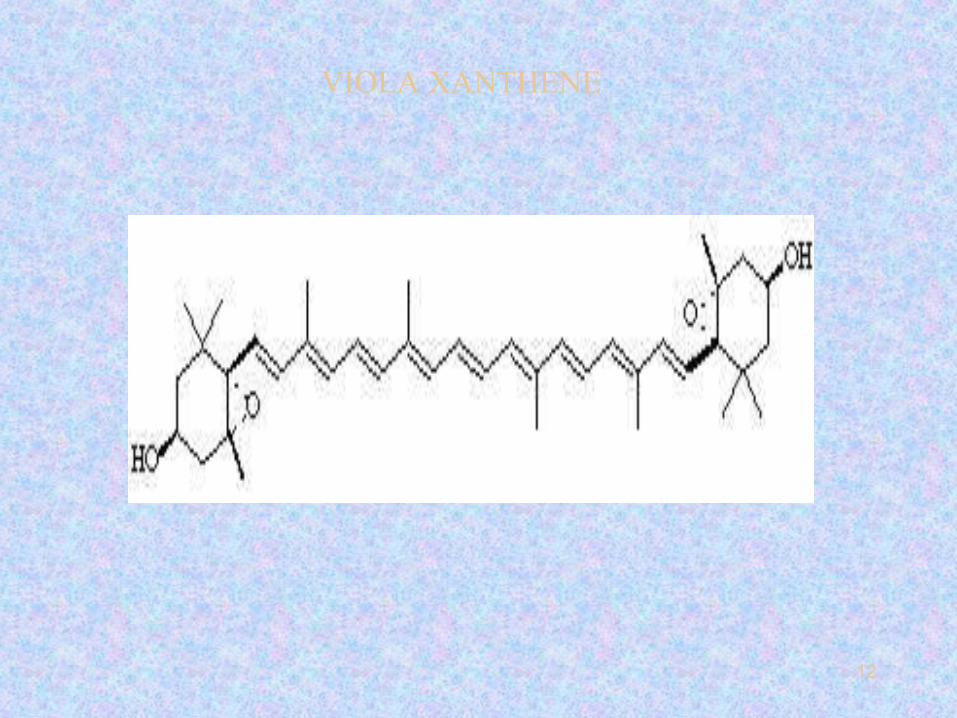
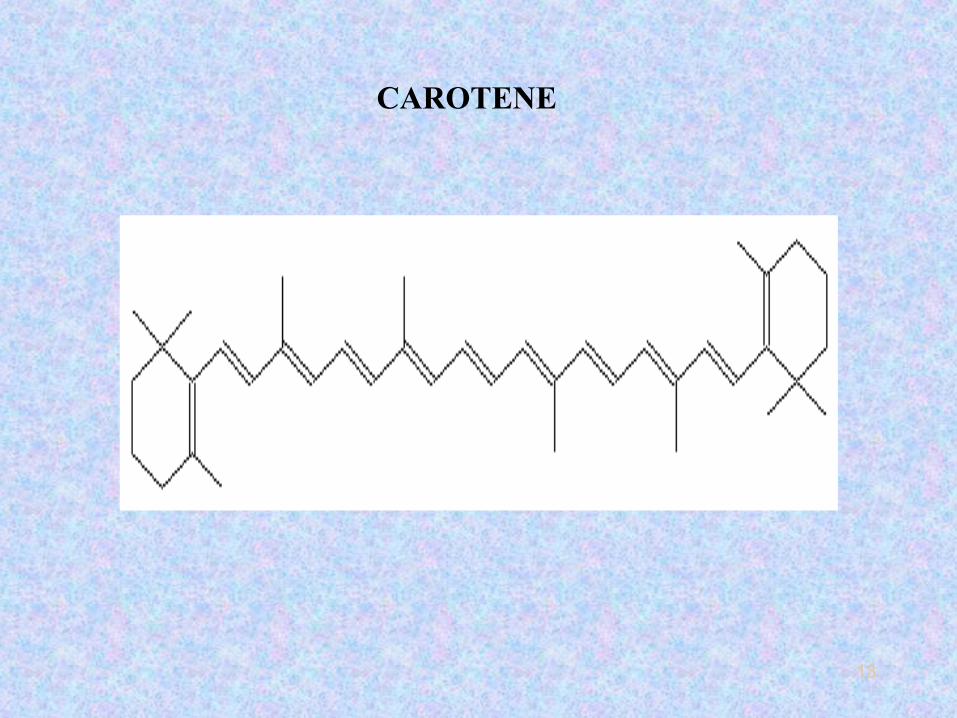
of five different solutes. α –chlorophyll, β - chlorophyll,
xanthophyll, viola xanthene, and carotene .
10
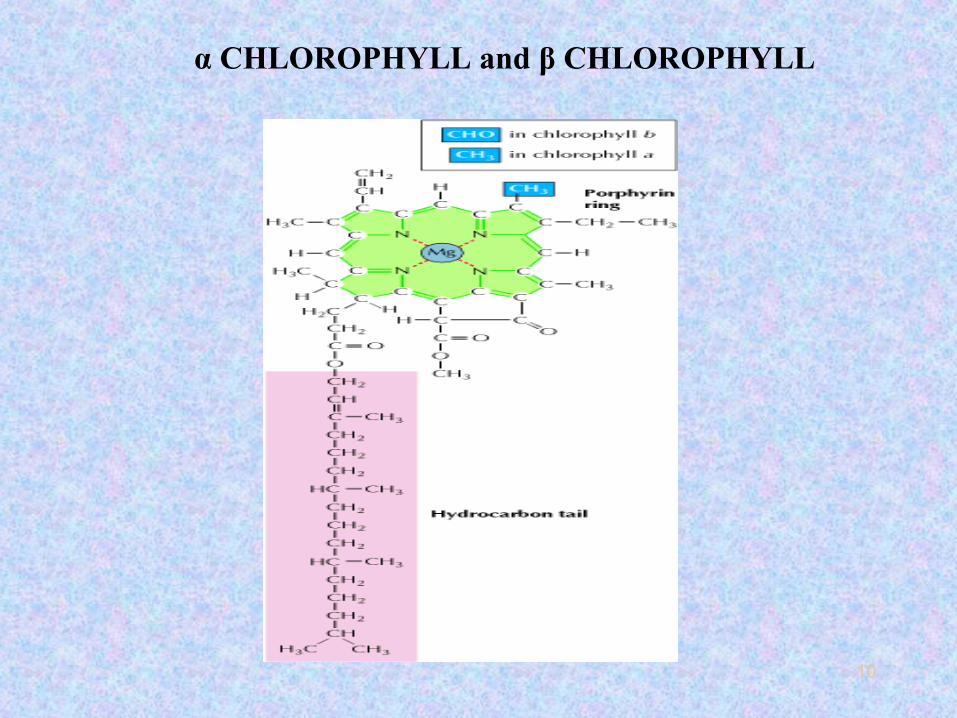
α CHLOROPHYLL and β CHLOROPHYLL
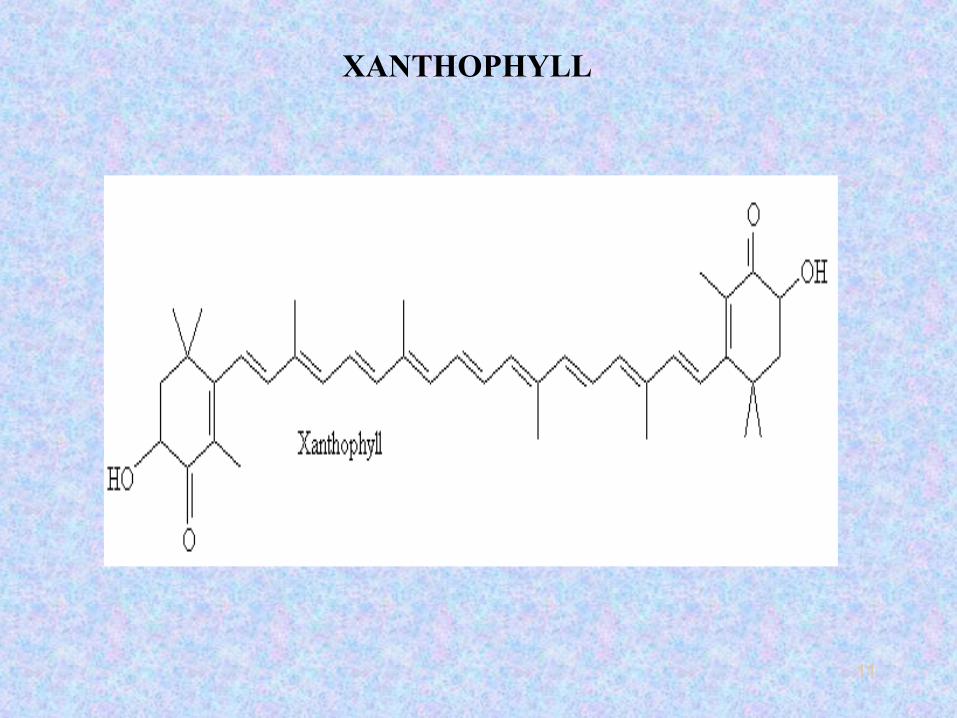
11
XANTHOPHYLL
12
VIOLA XANTHENE
13
CAROTENE
14
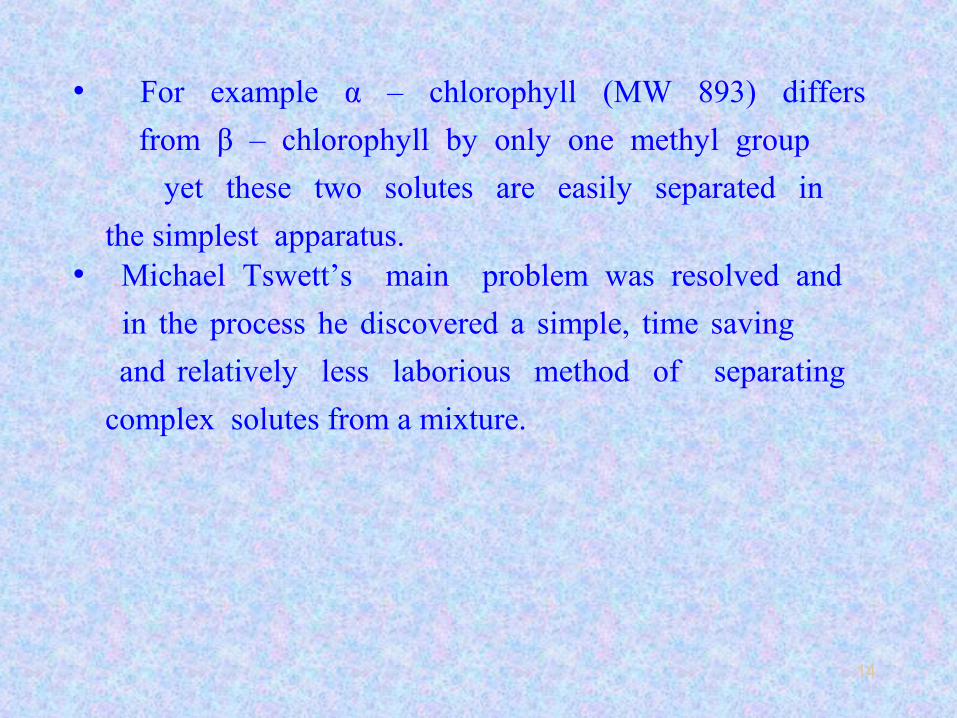
• Michael Tswett’s main problem was resolved and
in the process he discovered a simple, time saving
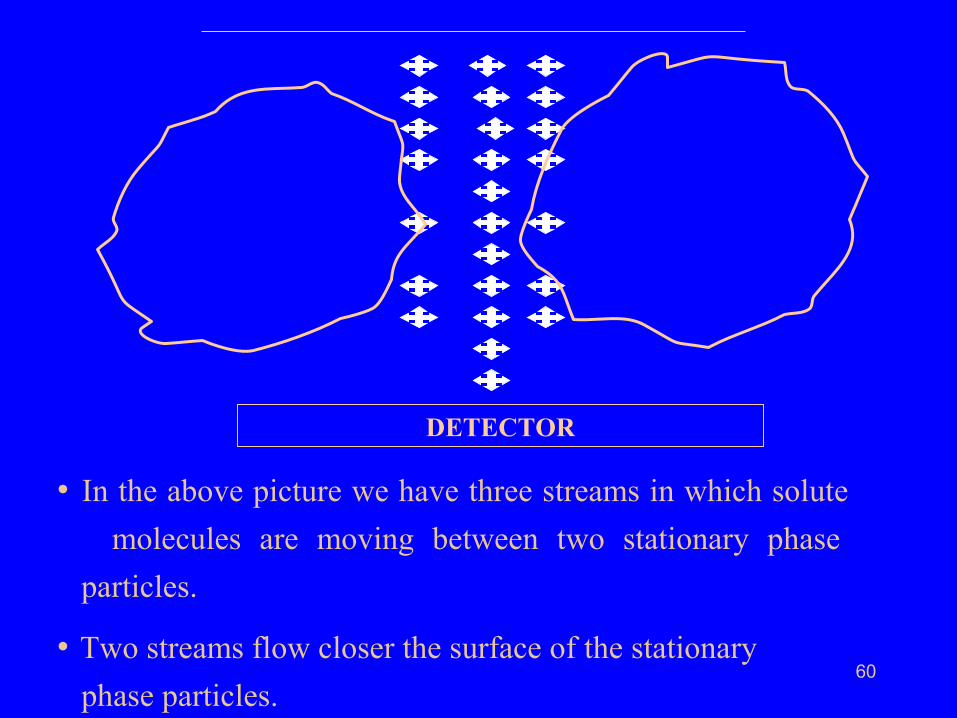
and relatively less laborious method of separating
complex solutes from a mixture.
• For example α – chlorophyll (MW 893) differs
from β – chlorophyll by only one methyl group
yet these two solutes are easily separated in
the simplest apparatus.
15
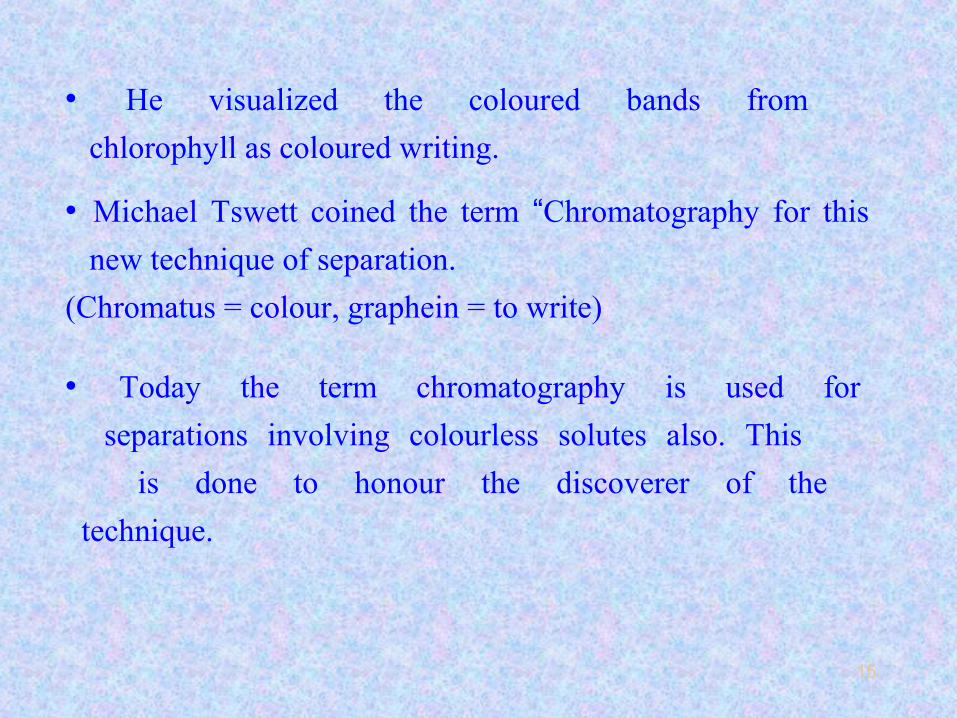
• Today the term chromatography is used for
separations involving colourless solutes also. This
is done to honour the discoverer of the
technique.
• Michael Tswett coined the term “Chromatography for this
new technique of separation.
(Chromatus = colour, graphein = to write)
• He visualized the coloured bands from
chlorophyll as coloured writing.

16
As a chemist, a researcher or simply as an
inquisitive person, two questions come to our
mind on the results of Tswett’s experiment.
1. Why do the five solutes separate on the column?
2. How do the five solutes separate on the column?
17
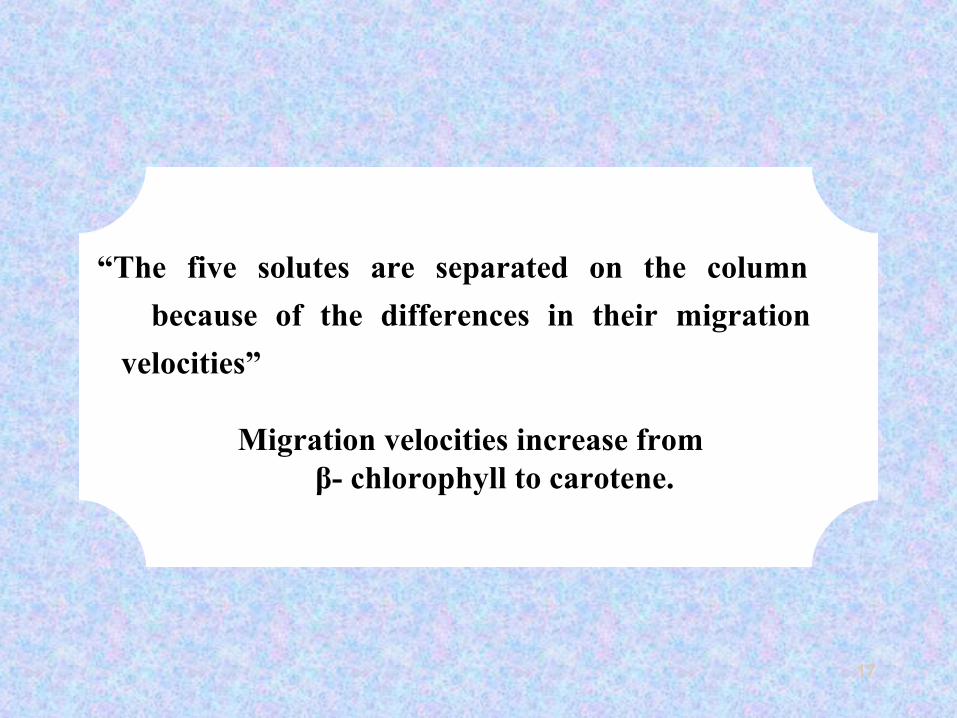
Migration velocities increase from β- chlorophyll to carotene.
“The five solutes are separated on the column
because of the differences in their migration
velocities”
18
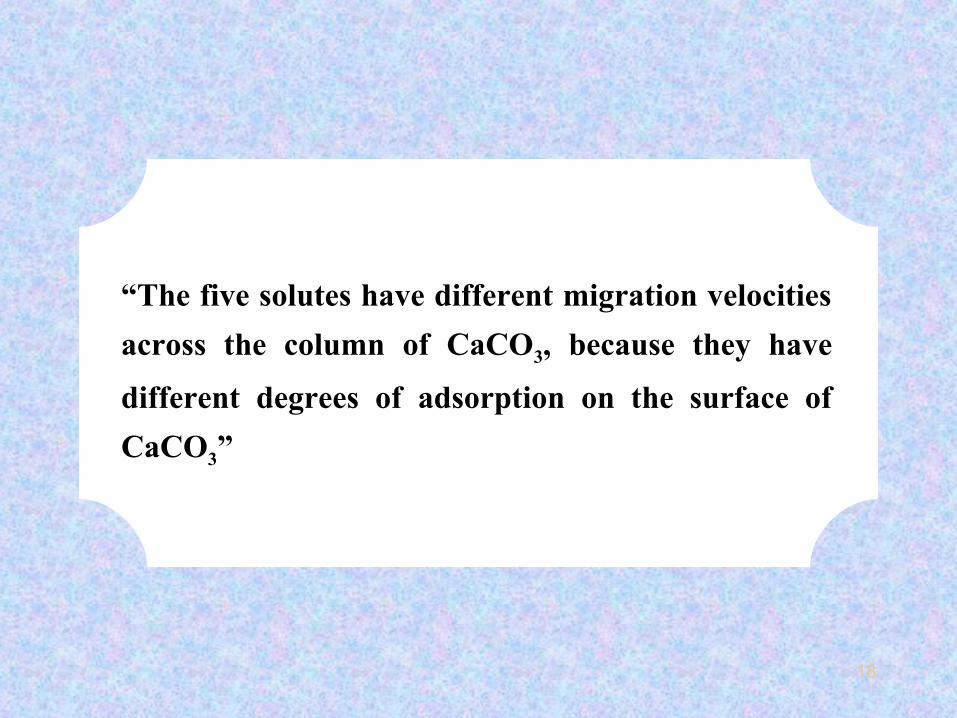
“The five solutes have different migration velocities
across the column of CaCO3, because they have
different degrees of adsorption on the surface of
CaCO3”
19
Carotene has the least degree of adsorption on
CaCO3 surface and hence the highest
migration velocity while β- chlorophyll has the
highest degree of adsorption on CaCO3
surface and hence the lowest migration velocity of
the five solutes.

20
This is the basis of “Adsorption column
chromatography”.
21
Adsorbents
The most important agent in chromatography is the adsorbent.
Therefore, utmost care is to be bestowed in the selection of
proper adsorption material and also the process of building
up a column with it and the maintenance of the column.
22
It must be insoluble in the solution under analysis and the
solvent that is used for elution
Essential requirements to be satisfied by every adsorbent
It should not chemically react with the mixture under analysis.
It should generally be colourless, but this is not a rigid
rule as there are instances where coloured adsorbents
have been used successfully.
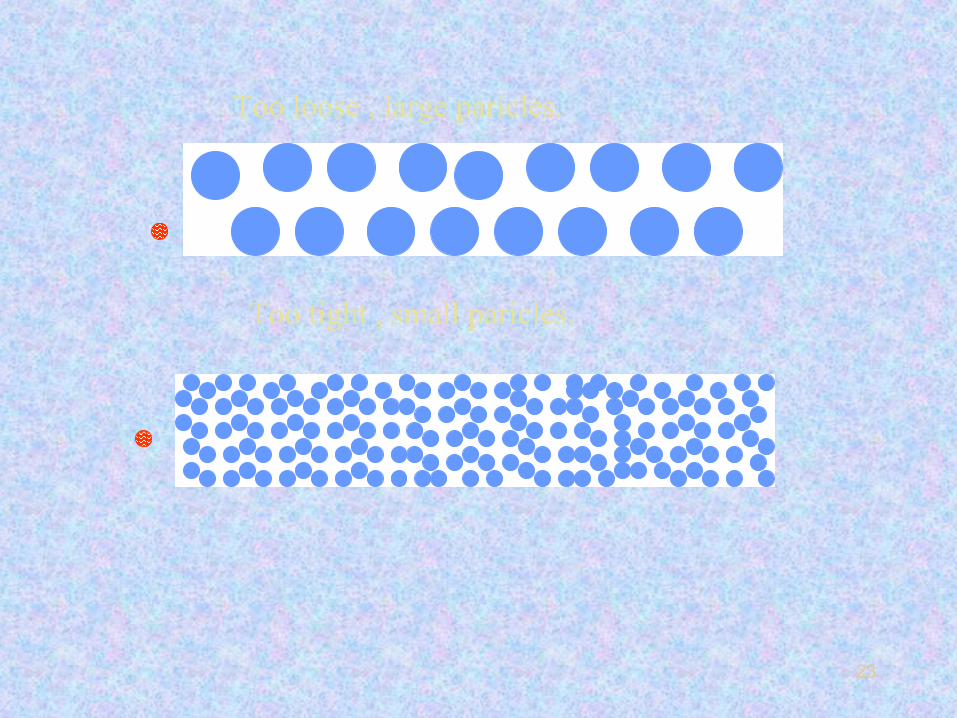
Particle-size of the adsorbent material is of primary importance
for successful separation.
23
Too loose , large paricles.
Too tight , small paricles.
24
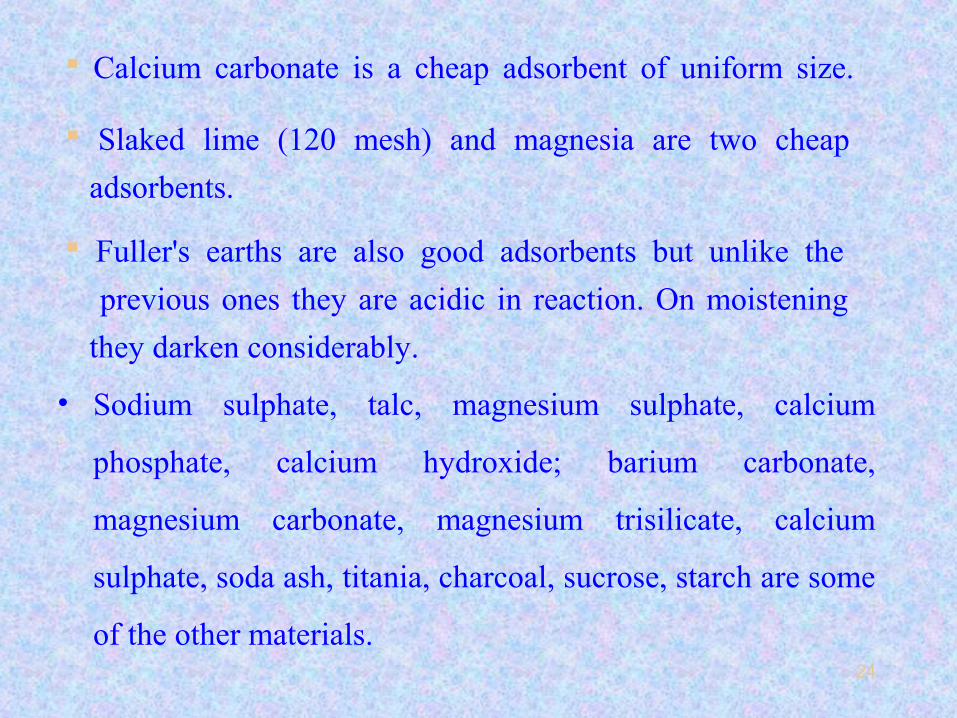
Slaked lime (120 mesh) and magnesia are two cheap
adsorbents.
Fuller's earths are also good adsorbents but unlike the
previous ones they are acidic in reaction. On moistening
they darken considerably.
Calcium carbonate is a cheap adsorbent of uniform size.
• Sodium sulphate, talc, magnesium sulphate, calcium
phosphate, calcium hydroxide; barium carbonate,
magnesium carbonate, magnesium trisilicate, calcium
sulphate, soda ash, titania, charcoal, sucrose, starch are some
of the other materials.
25
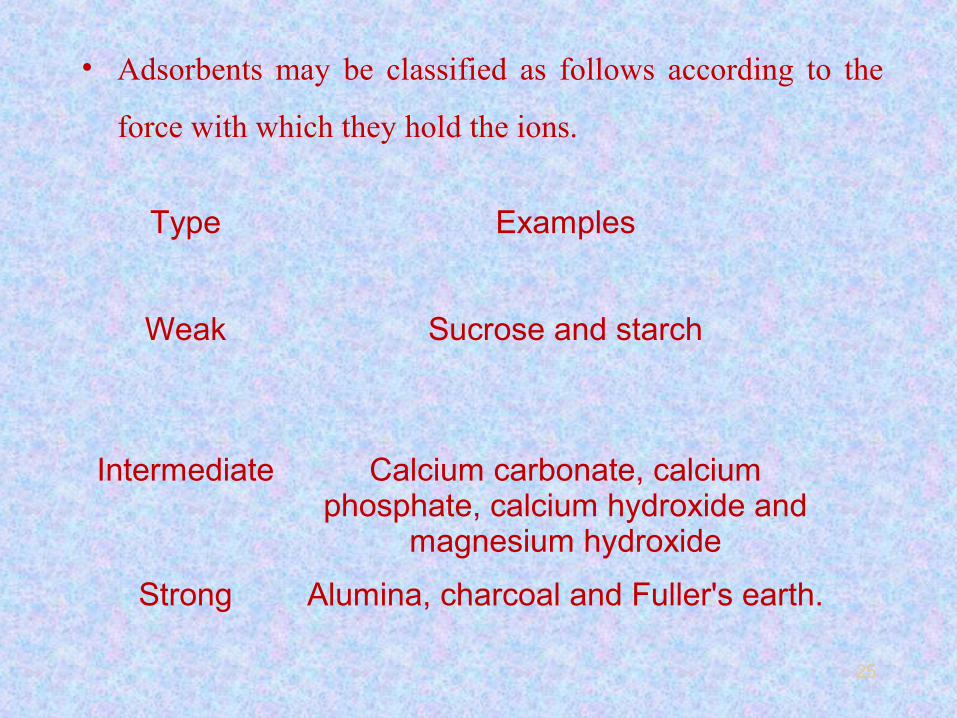
• Adsorbents may be classified as follows according to the
force with which they hold the ions.
Type Examples
Weak Sucrose and starch
Intermediate Calcium carbonate, calcium phosphate, calcium hydroxide and
magnesium hydroxide
Strong Alumina, charcoal and Fuller's earth.
26
From Tswett’s experiment if we change slurry
of CaCO3 and replace it with slurry of Al2O3,
will the five solutes form chlorophyll separate
and will the sequence of separation remain the
same?
In Tswett’s experiment if we replace chlorophyll
extract with a mixture of A+B+C+D+E solutes,
will the solutes separate and what will be the
sequence of their separation?
27
In Tswett’s experiment if we replace chlorophyll
extract with a mixture of A+B+C+D+E solutes,
will the solutes separate and what will be the
sequence of their separation?
If we have understood the concept of
adsorption, then it should not be difficult to
answer the above two questions.
28
In the first instance, we have changed the adsorbent, other
things remaining unchanged.
The five adsorbates have a new surface of Al2O3.
If they exhibit differences in the degree of their
adsorption on the surface of Al2O3, they will get
separated.
29
In the second instance, we have changed the five
solutes, other things remaining unchanged.
Although the surface of CaCO3 is the same as
that in Tswett’s experiment, the five solutes are
different.
They will get separated, if they exhibit differences in the degree of
their adsorption on the surface of CaCO3.
30
Let us consider a situation where in the glass
column we put a liquid which remains stationary
even if the tap is opened.
If we allow three solutes A, B and C to pass
through the chromatographic column and realize
their separation after some time, we can ask
again the same two questions which we did in
adsorption chromatography.
Another liquid which is immiscible with the stationary
liquid moves through it.
31
Why do the three solutes separate?
How do the three solutes separate?
The three solutes separate because they have
different migration velocities.
Solute ‘A’ has the highest migration velocity of the
three and reaches the end of the column first.
Solute ‘C’ has the lowest migration velocity of the
three and reaches the end of the column last.
32
The migration velocity increases from solute ‘C’
to solute ‘A’.
Solute ‘A’ travels the fastest because it is more
soluble in the liquid which moves across the
stationary liquid.
Solute ‘C’ on the other hand is more
soluble in the stationary phase and
hence lags behind.
33
The principle of separation here is differences in solubility
or partitioning of solutes between the stationary and mobile
liquid phases.
It is called as “Partition Column Chromatography”.
34
If they do not show differences with
reference to any property they cannot be
separated.
For solutes to get separated from a
mixture, they must exhibit some
differences with reference to some property
like solubility, boiling point, adsorption,
partitioning etc.,
35
Stationary phase: Phase which remains
stationary. It could be a solid or a liquid bonded to an inert
solid support.
Mobile phase: A phase which moves across the
stationary phase. It could be a gas or a liquid.
Elution: The process of washing a chromatographic
column with a liquid or a gas.
Solutes: This term is used in place of compounds or
substances.
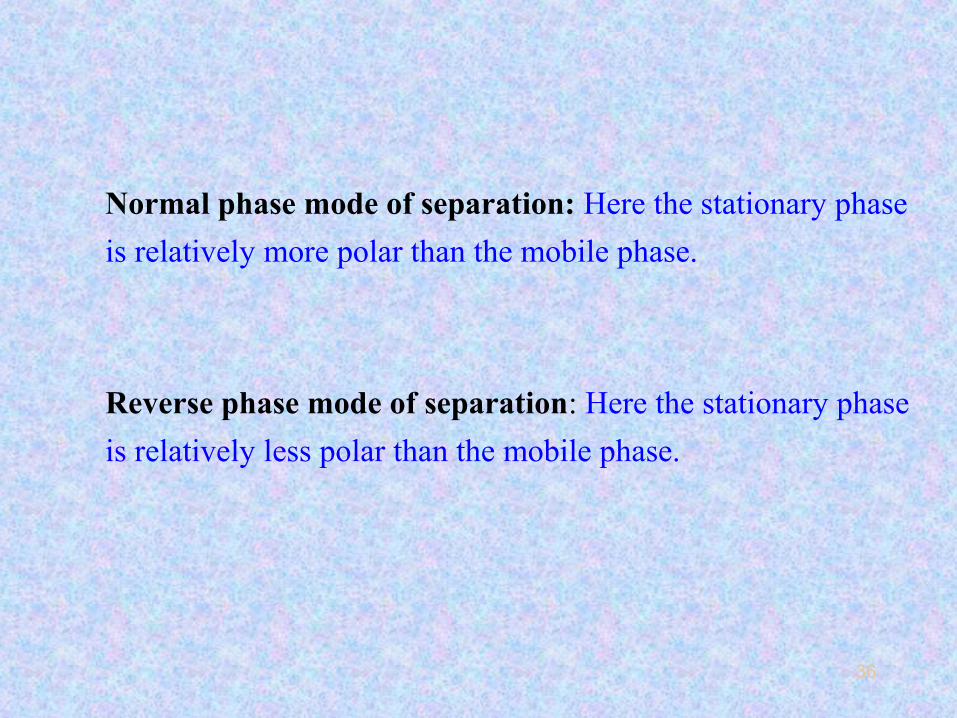
36
Normal phase mode of separation: Here the stationary phase
is relatively more polar than the mobile phase.
Reverse phase mode of separation: Here the stationary phase
is relatively less polar than the mobile phase.
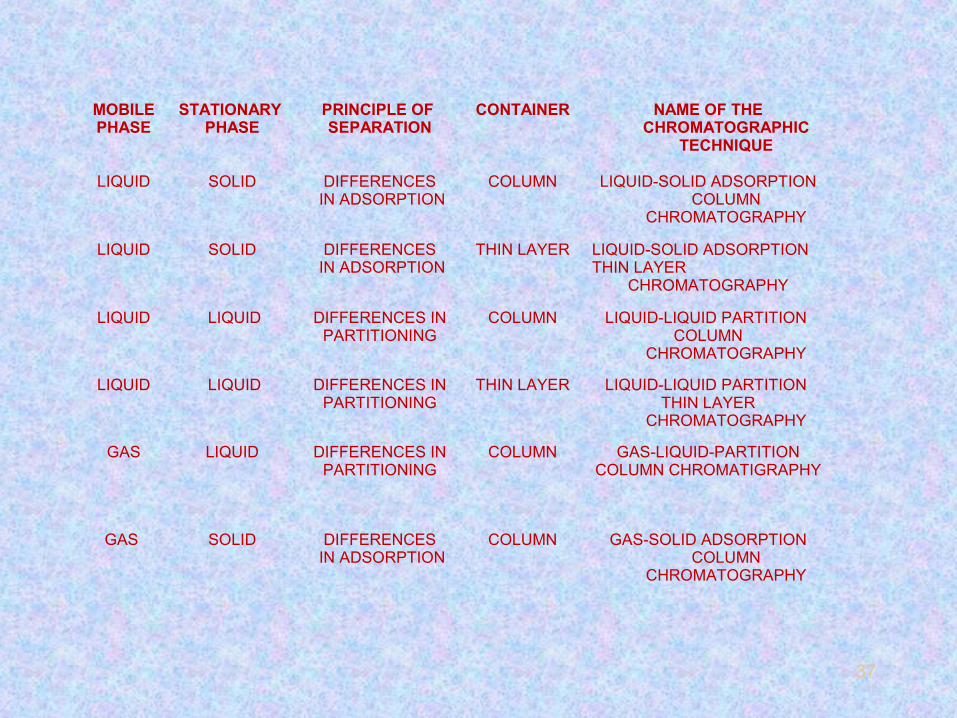
37
MOBILEPHASE
STATIONARY PHASE
PRINCIPLE OF SEPARATION
CONTAINER NAME OF THE CHROMATOGRAPHIC
TECHNIQUE
LIQUID SOLID DIFFERENCES IN ADSORPTION
COLUMN LIQUID-SOLID ADSORPTION COLUMN
CHROMATOGRAPHY
LIQUID SOLID DIFFERENCES IN ADSORPTION
THIN LAYER LIQUID-SOLID ADSORPTION THIN LAYER
CHROMATOGRAPHY
LIQUID LIQUID DIFFERENCES INPARTITIONING
COLUMN LIQUID-LIQUID PARTITION COLUMN
CHROMATOGRAPHY
LIQUID LIQUID DIFFERENCES INPARTITIONING
THIN LAYER LIQUID-LIQUID PARTITION THIN LAYER
CHROMATOGRAPHY
GAS LIQUID DIFFERENCES INPARTITIONING
COLUMN GAS-LIQUID-PARTITIONCOLUMN CHROMATIGRAPHY
GAS SOLID DIFFERENCES IN ADSORPTION
COLUMN GAS-SOLID ADSORPTION COLUMN
CHROMATOGRAPHY
38
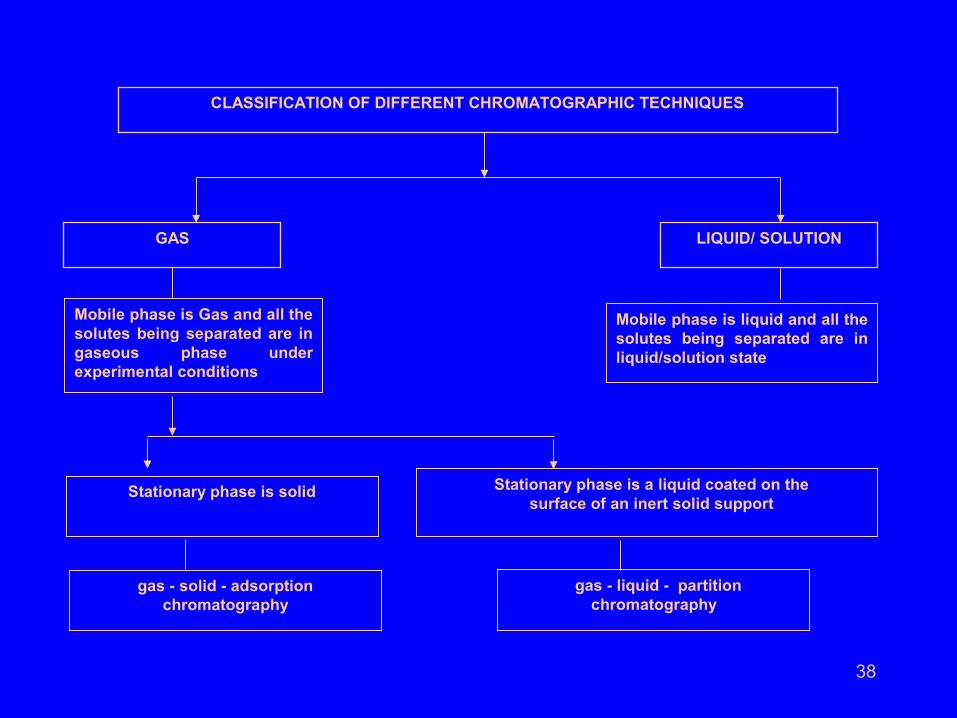
GAS LIQUID/ SOLUTION
CLASSIFICATION OF DIFFERENT CHROMATOGRAPHIC TECHNIQUES
Stationary phase is solid Stationary phase is a liquid coated on the surface of an inert solid support
gas - solid - adsorption chromatography
gas - liquid - partition chromatography
Mobile phase is Gas and all the solutes being separated are in gaseous phase under experimental conditions
Mobile phase is liquid and all the solutes being separated are in liquid/solution state
39
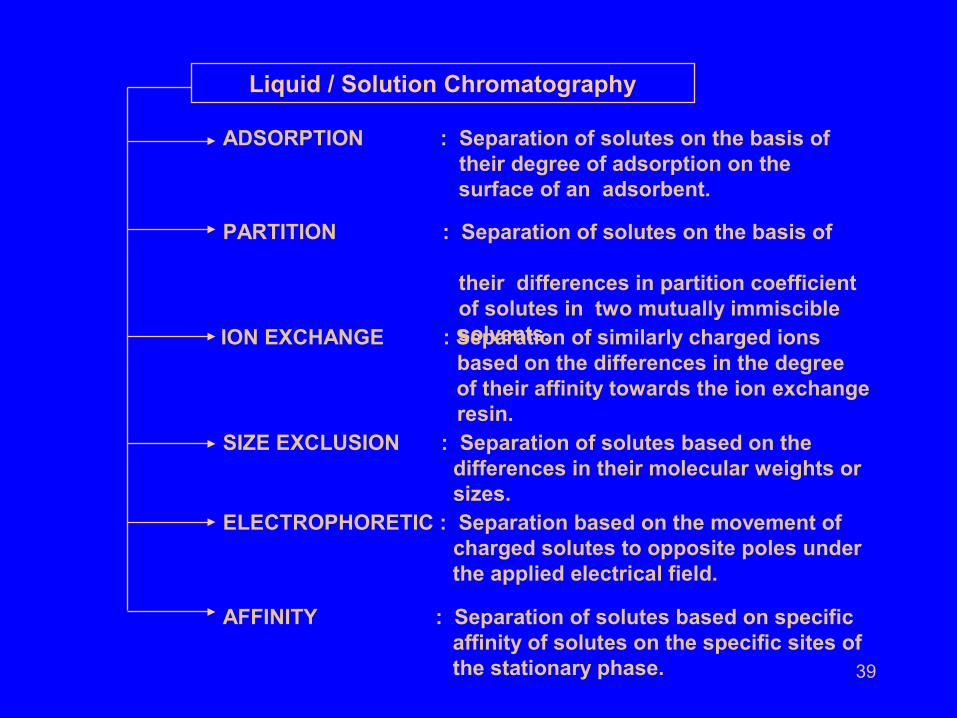
Liquid / Solution Chromatography
ADSORPTION : Separation of solutes on the basis of their degree of adsorption on the surface of an adsorbent.
PARTITION : Separation of solutes on the basis of their differences in partition coefficient of solutes in two mutually immiscible solvents. ION EXCHANGE : Separation of similarly charged ions based on the differences in the degree of their affinity towards the ion exchange resin. SIZE EXCLUSION : Separation of solutes based on the differences in their molecular weights or sizes. ELECTROPHORETIC : Separation based on the movement of charged solutes to opposite poles under the applied electrical field.
AFFINITY : Separation of solutes based on specific affinity of solutes on the specific sites of the stationary phase.
40
• Let us consider a chromatographic column on which
three solutes A, B and C are separated in that order.
• Let there be sensor or a detector fixed at the other
end of the column.
• The detector can sense and count the number of
molecules of solute entering into it.
• The detector does not sense and count the
number of molecules of mobile phase entering
into it.
41
42
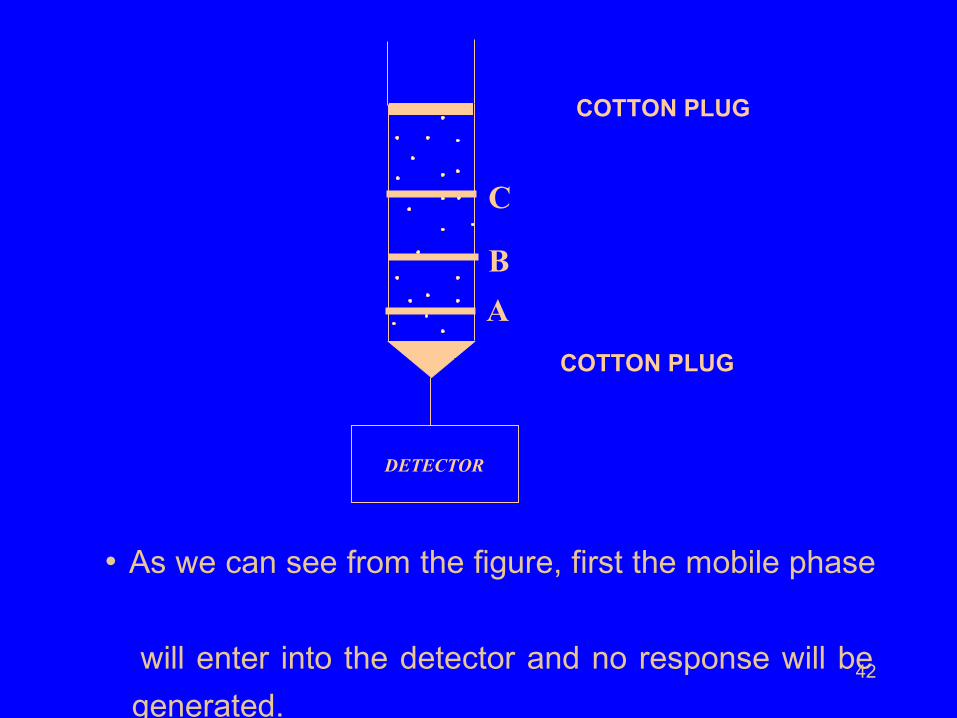
• As we can see from the figure, first the mobile phase
will enter into the detector and no response will be
generated.
DETECTOR
A
B
C
COTTON PLUG
COTTON PLUG
43
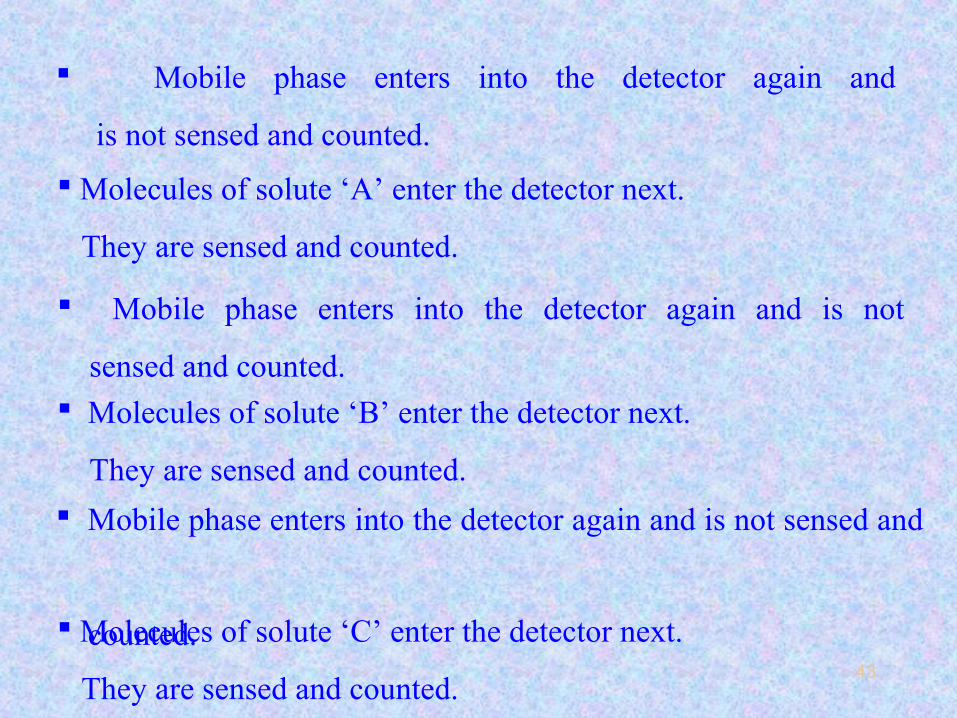
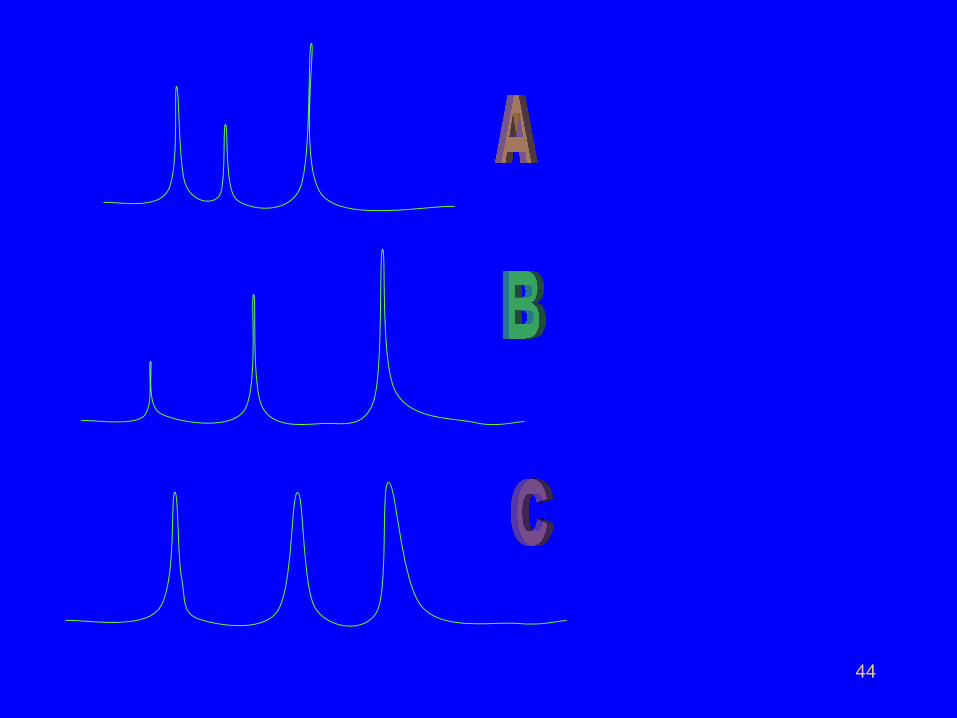
Molecules of solute ‘B’ enter the detector next.
They are sensed and counted.
Mobile phase enters into the detector again and is not sensed and
counted. Molecules of solute ‘C’ enter the detector next.
They are sensed and counted.
Mobile phase enters into the detector again and is not
sensed and counted.
Molecules of solute ‘A’ enter the detector next.
They are sensed and counted.
Mobile phase enters into the detector again and
is not sensed and counted.
44
45
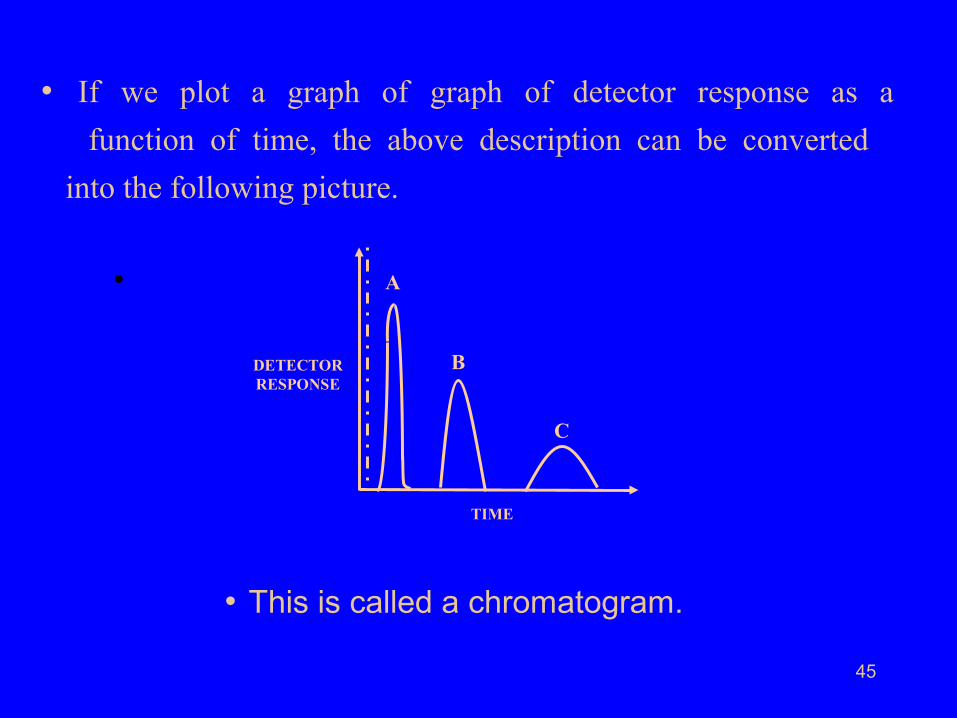
• If we plot a graph of graph of detector response as a
function of time, the above description can be converted
into the following picture.
•
• This is called a chromatogram.
A
B
C
DETECTORRESPONSE
TIME
46
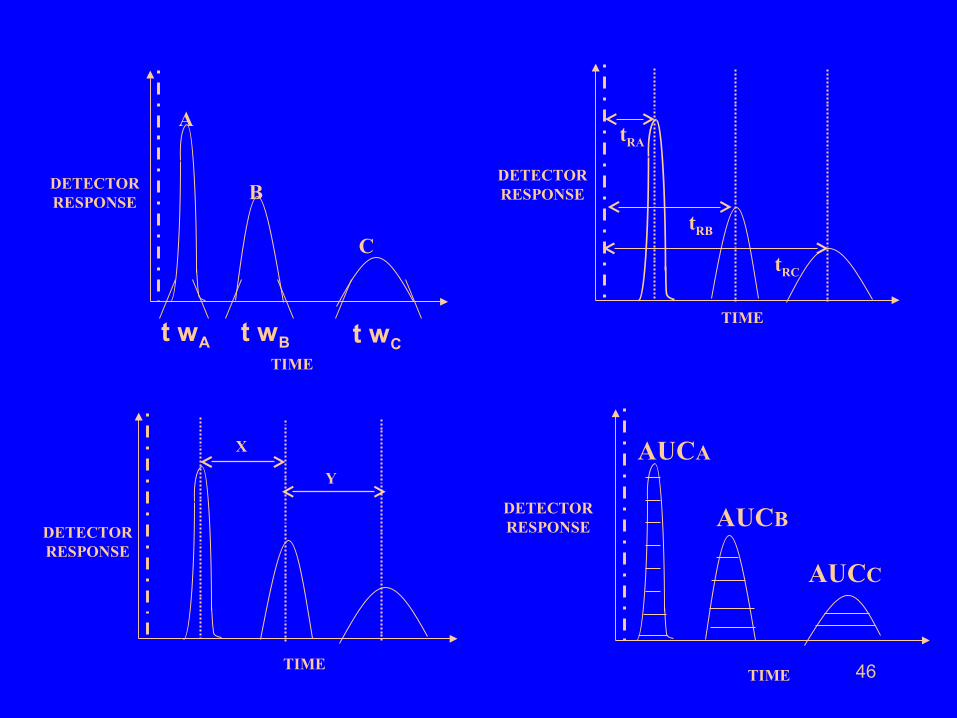
A
B
C
DETECTORRESPONSE
TIME
tRA
tRB
tRC
DETECTORRESPONSE
TIME
X
Y
DETECTORRESPONSE
TIME
AUCA
AUCB
AUCC
TIME
DETECTORRESPONSE
t wA t wB t wC
47
• A normal chromatogram has certain characteristic features.
All the peaks are bell shaped symmetrical peaks.
Neighbouring peaks are separated by some distance.
Each peak has a characteristic retention time
(distance between center of the peak and the
reference point) under given experimental conditions.
This is useful in qualitative Chromatographic analysis.
48
Each peak has certain area under curve (AUC) and
AUC α Concentration of Solute. This is useful in
quantitative chromatographic analysis. A separate
calibration graph is needed for each peak in a
chromatogram.
Each peak has certain width at base which
increases with increase in retention time.
49
Both qualitative and quantitative chromatographic
analysis are relative methods of analysis in which
the standard solutes and the sample solutes are
chromatographed under the same experimental
conditions.
Volumetric and Gravimetric methods, on the other
hand, are the examples of absolute methods of
quantitative analysis.
50
• It is observed in practical Chromatographic
separations that the spots or bands or peaks are
always broad. They are never very sharp.
What could be the reason for this?
• If we observe our earlier Chromatogram
carefully, we see that for each solute, solute
molecules start eluting at a particular time and the
elution is complete after a few seconds.
51
• It means that all the molecules of the same solute do
not travel across the stationary phase with the same
speed. Some travel faster than others. Therefore
some reach the detector first and others latter.
• In other words molecules of the same solute spread across
the stationary phase which results in band broadening.
52
• We can visualize four important causes leading to molecular
spreading and band broadening.
• We must find out at least some important causes for molecular
spreading and band broadening.
53
• We should know in the beginning that the particles of
stationary phases are approximately spherical in nature and
the particles are not exactly of the same size.
• When we say that the particle size is 100µ, it really
means that it is the average particle size and that every
particle is not of exact 100µ diameter.
• Secondly, the spherical particles are always
porous in nature. That is, the surface is not
smooth.
54
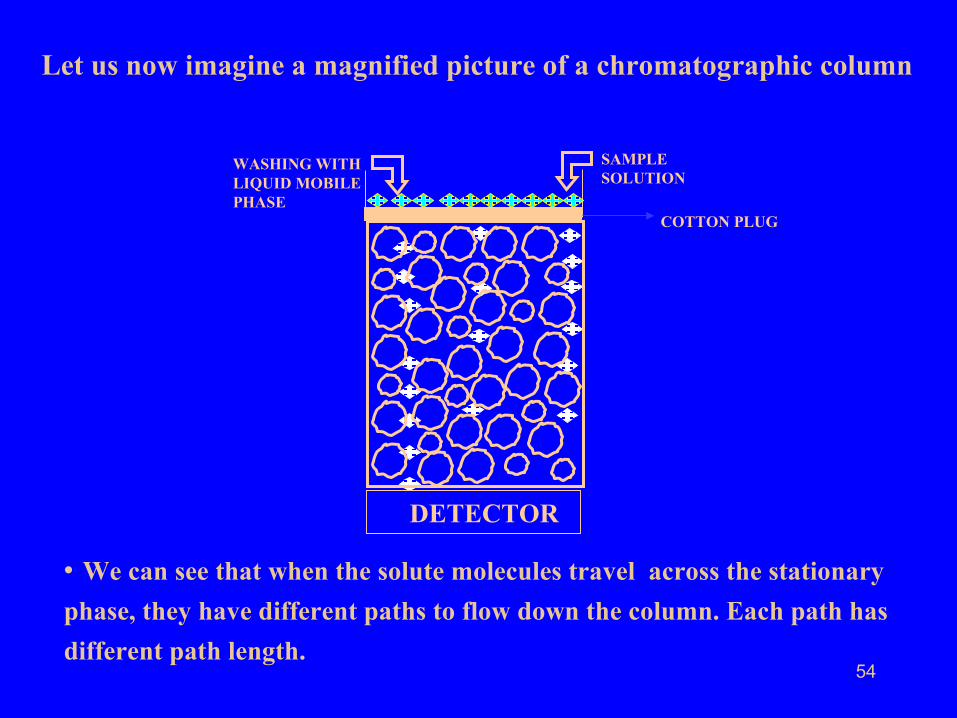
Let us now imagine a magnified picture of a chromatographic column
• We can see that when the solute molecules travel across the stationary
phase, they have different paths to flow down the column. Each path has
different path length.
COTTON PLUG
DETECTOR
SAMPLE SOLUTION
WASHING WITH LIQUID MOBILE PHASE
55
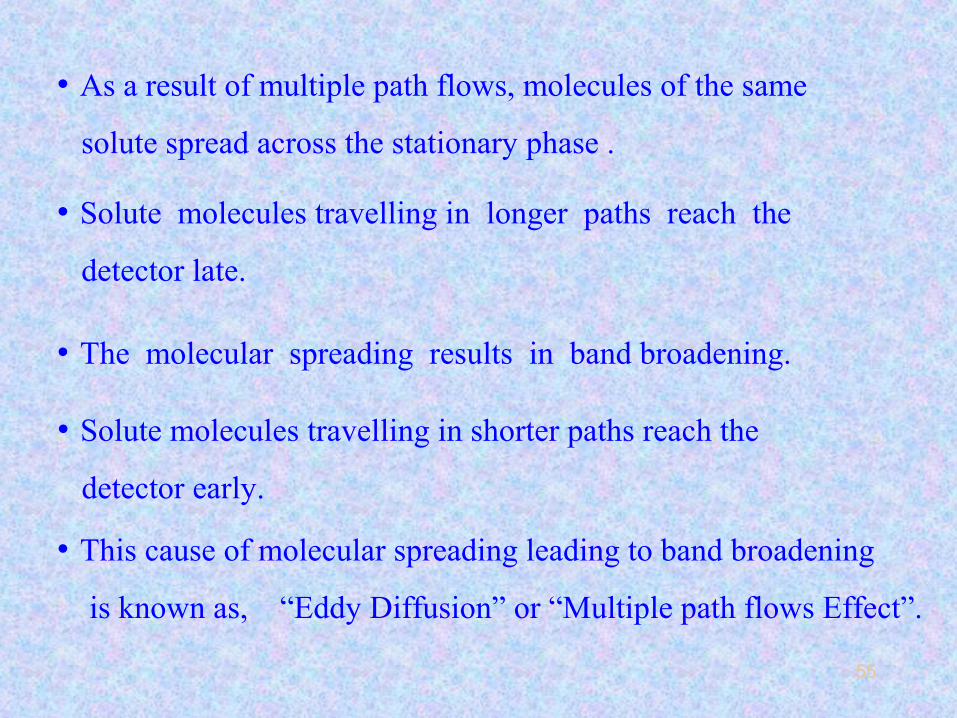
• The molecular spreading results in band broadening.
• This cause of molecular spreading leading to band broadening
is known as, “Eddy Diffusion” or “Multiple path flows Effect”.
• Solute molecules travelling in shorter paths reach the
detector early.
• Solute molecules travelling in longer paths reach the
detector late.
• As a result of multiple path flows, molecules of the same
solute spread across the stationary phase .
56
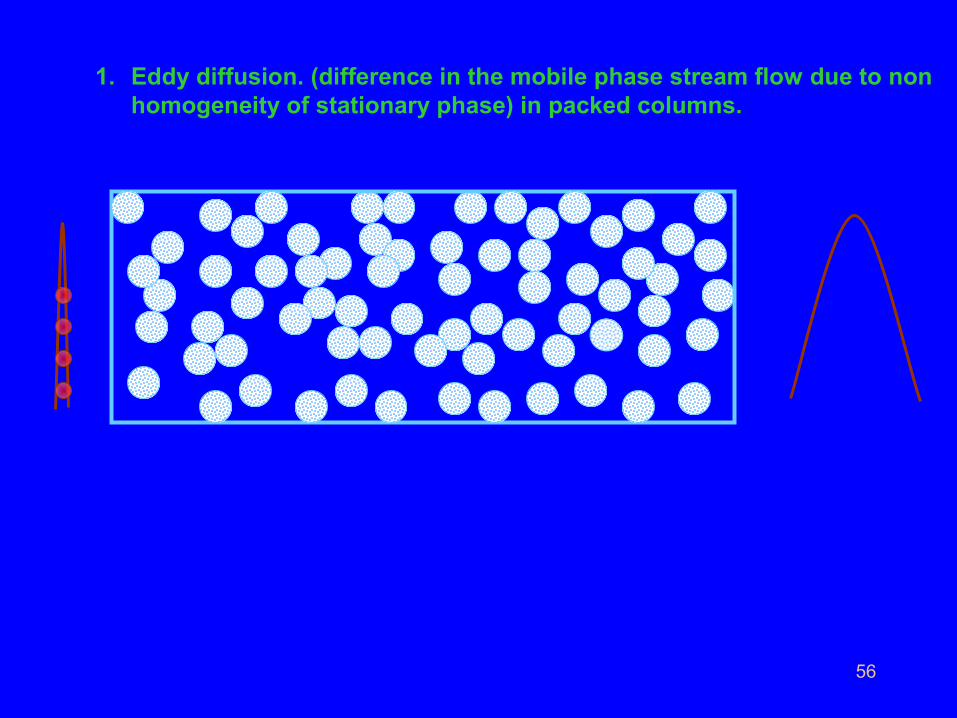
1. Eddy diffusion. (difference in the mobile phase stream flow due to non homogeneity of stationary phase) in packed columns.
57
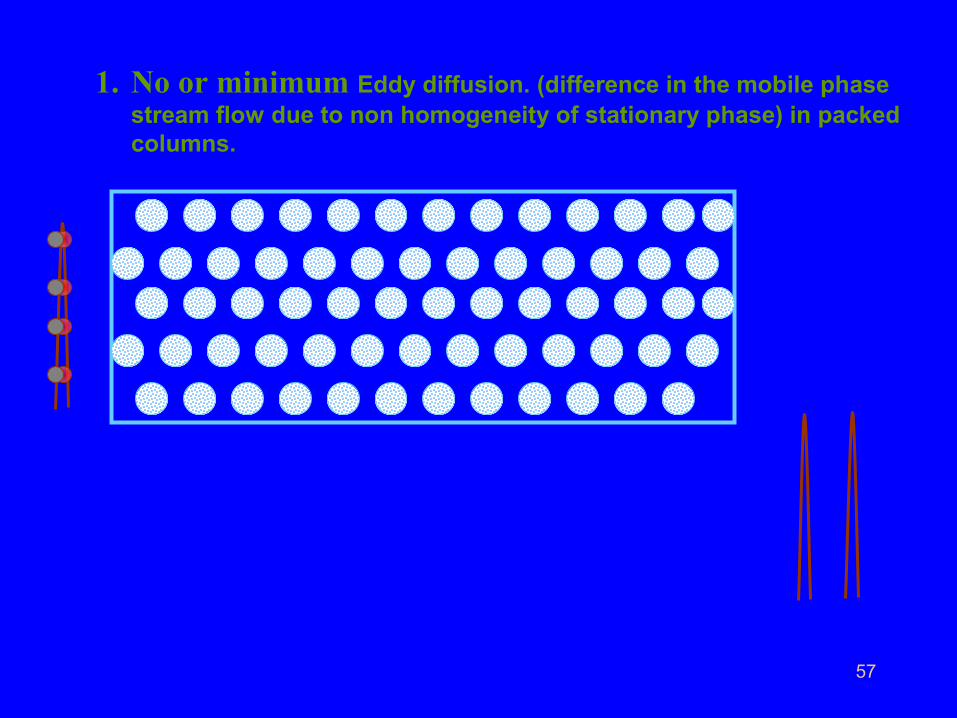
1. No or minimum Eddy diffusion. (difference in the mobile phase stream flow due to non homogeneity of stationary phase) in packed columns.
58
Can Eddy diffusion be avoided?
• Even if we bring the stationary phase particles closer
together than what they are in the above picture, there
will always be some distance between the
neighbouring particles.
• What is achieved by compact packing of stationary
phase particles in the column probably is that the
numbers of multiple path flows are minimized and
the extent of molecular spreading leading to band
broadening is reduced.
• Eddy diffusion, therefore, cannot be avoided, it can be optimized.
59
• Let us now have a magnified picture of two neighbouring
stationary phase particles.
60
• In the above picture we have three streams in which solute
molecules are moving between two stationary phase
particles.
• Two streams flow closer the surface of the stationary
phase particles.
DETECTOR
61
• Solute molecules in these streams experience resistance
to flow from the surface of the stationary phase particles.
• Their migration velocity will be relatively smaller than those
solute molecules traveling in the middle.
• This obviously results in molecular spreading adding
to band broadening.
• This cause is known as mobile phase mass transfer
and cannot be eliminated.
62
• In closely packed column the contribution of
this cause called “Mobile phase mass transfer” will
be more than in a loosely packed column.
• In a loosely packed column the contribution of
Eddy diffusion will be more.
• In practice we have to strike a balance.
63
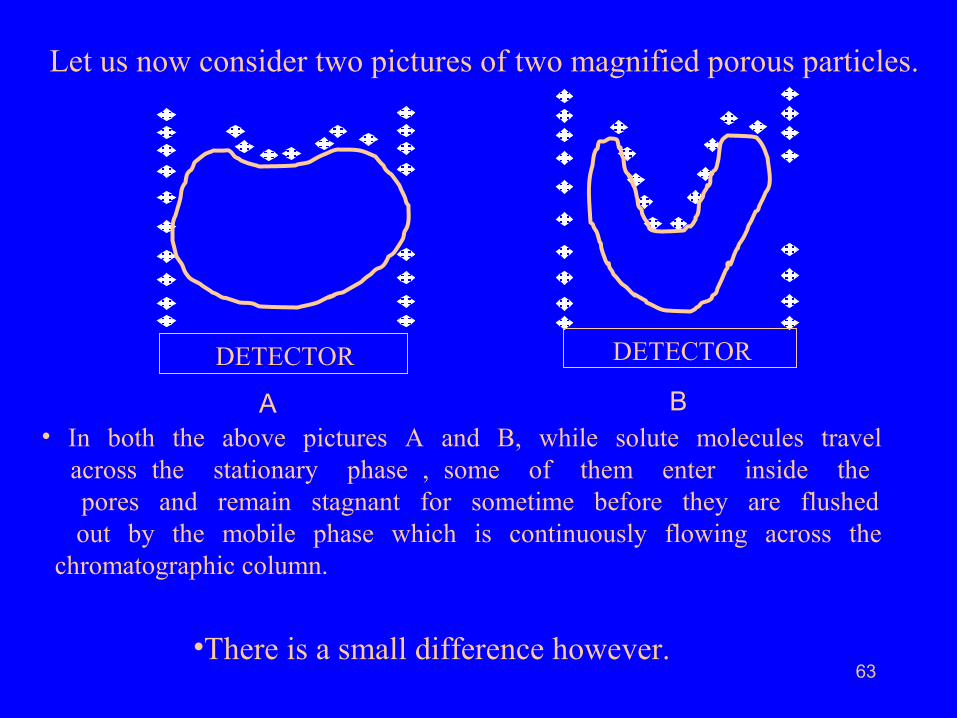
Let us now consider two pictures of two magnified porous particles.
• In both the above pictures A and B, while solute molecules travel across the stationary phase , some of them enter inside the pores and remain stagnant for sometime before they are flushed out by the mobile phase which is continuously flowing across the chromatographic column.
•There is a small difference however.
DETECTOR
A
DETECTOR
B
64
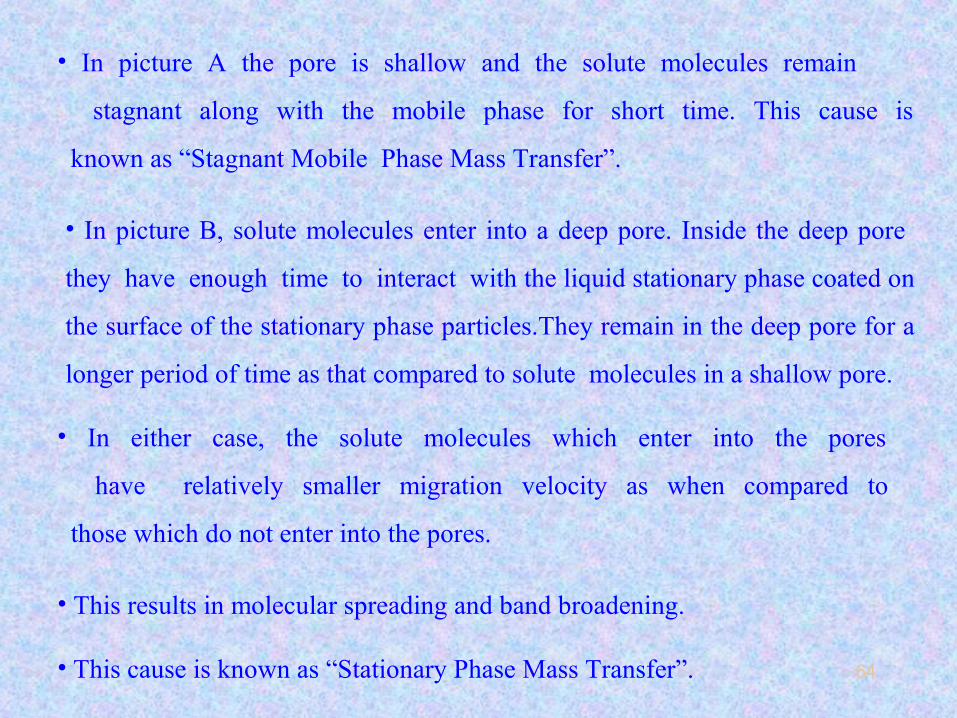
• In picture A the pore is shallow and the solute molecules remain
stagnant along with the mobile phase for short time. This cause is
known as “Stagnant Mobile Phase Mass Transfer”.
• In picture B, solute molecules enter into a deep pore. Inside the deep pore
they have enough time to interact with the liquid stationary phase coated on
the surface of the stationary phase particles.They remain in the deep pore for a
longer period of time as that compared to solute molecules in a shallow pore.
• In either case, the solute molecules which enter into the pores
have relatively smaller migration velocity as when compared to
those which do not enter into the pores.
• This cause is known as “Stationary Phase Mass Transfer”.
• This results in molecular spreading and band broadening.
65
• Eddy diffusion, mobile phase mass transfer, stagnant
mobile phase mass transfer, and stationary phase
mass transfer are the four main causes for molecular
spreading and band broadening.
66
• The causes for molecular spreading leading to
band broadening cannot be eliminated.
• They can be optimized by choosing stationary phase
particles with uniform size having shallow pores and
packing compactly in a chromatographic column.
67
• Let us now consider in quantitative terms what we
have discussed qualitatively about molecular
spreading and band broadening in chromatographic
separations.
68
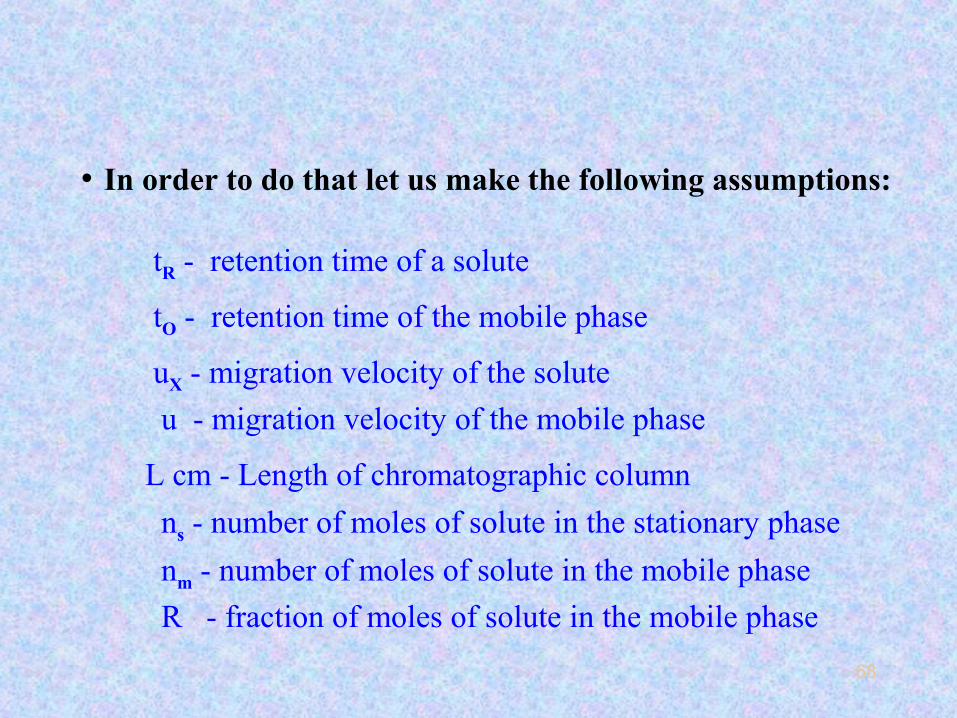
• In order to do that let us make the following assumptions:
tR - retention time of a solute
L cm - Length of chromatographic column
tO - retention time of the mobile phase
u - migration velocity of the mobile phase
uX - migration velocity of the solute
ns - number of moles of solute in the stationary phase
nm - number of moles of solute in the mobile phase
R - fraction of moles of solute in the mobile phase
69
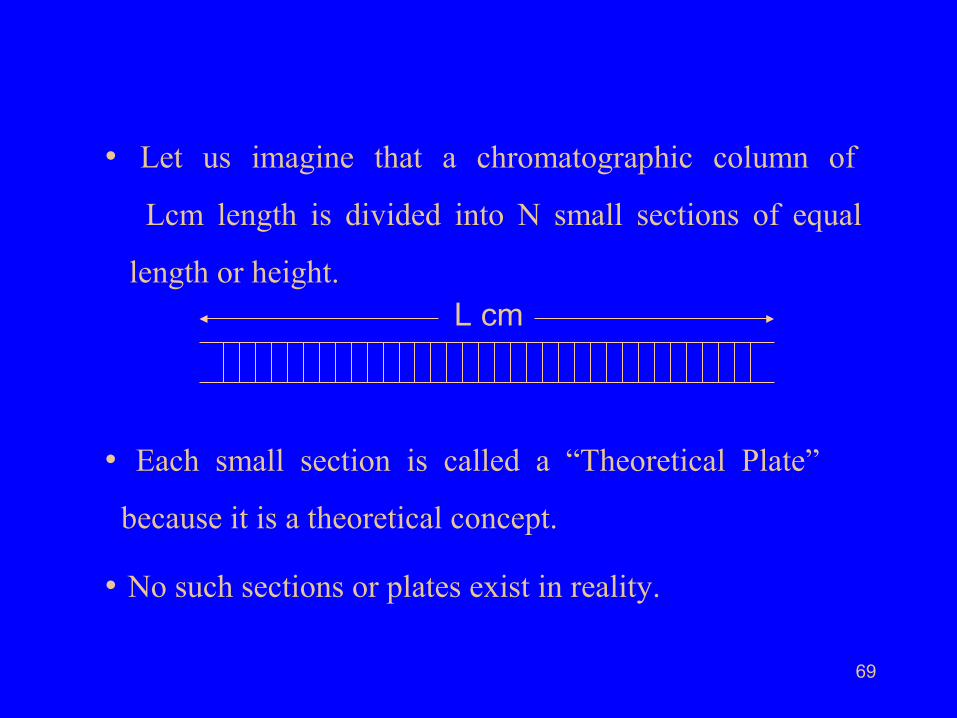
• Let us imagine that a chromatographic column of
Lcm length is divided into N small sections of equal
length or height.L cm
• Each small section is called a “Theoretical Plate”
because it is a theoretical concept.
• No such sections or plates exist in reality.
70
• The solute molecules constantly get exchanged
between the stationary phase and the mobile phase
when they travel across the column.
• The solute molecules travel in the forward direction along
with the mobile phase only when they are in the mobile
phase . They remain stagnant when they are in the
stationary phase.
• The length or height of each theoretical plate is such that
when solute molecules travel that distance a new
equilibrium is established.
• There will be, therefore ‘N’ number of such equilibria
across the length of the column.
71
• It is then easy to imagine that more the number of
theoretical plates associated with the given length of
chromatographic column, more will be such equilibria
and solute molecules will have less time and chances
to spread across the stationary phase.
• It means that more the N (number of theoretical
plates), lesser is the molecular spreading and
sharper will be the resulting bands or peaks.
72
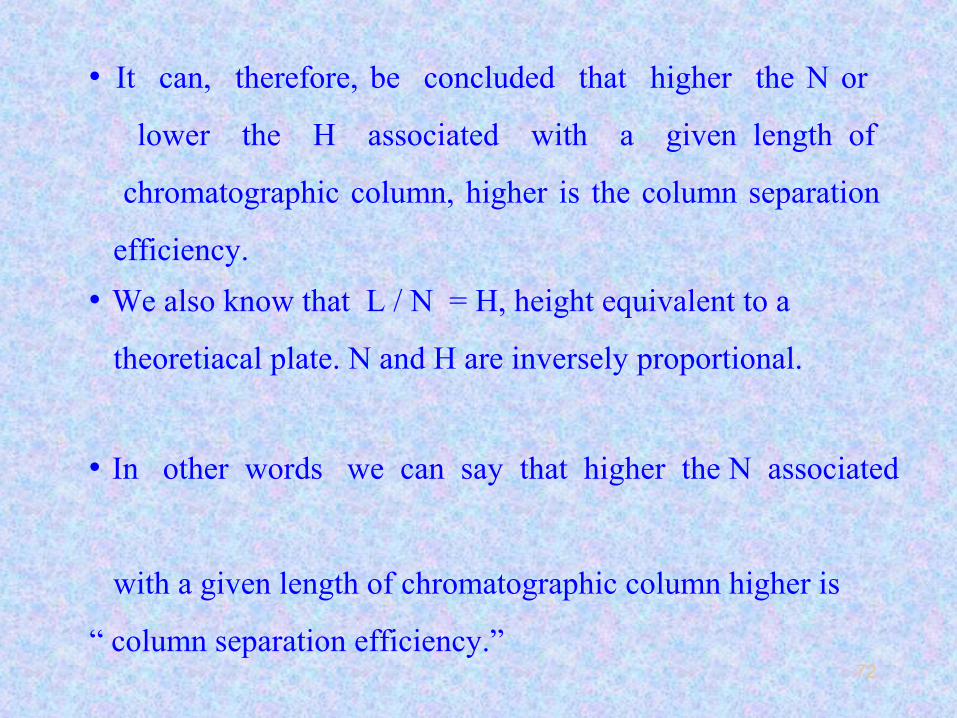
• In other words we can say that higher the N associated
with a given length of chromatographic column higher is
“ column separation efficiency.”
• We also know that L / N = H, height equivalent to a
theoretiacal plate. N and H are inversely proportional.
• It can, therefore, be concluded that higher the N or
lower the H associated with a given length of
chromatographic column, higher is the column separation
efficiency.
73
• The following three factors govern the column separation
efficiency.
1. Particle size of stationary phase.
2. Length of chromatographic column.
3. Mobile phase velocity.
74
Particle size of stationary phase
• We normally assume stationary phase particles to be
spherical in shape.
• If we reduce the particle size diameter from 100µ
to 50µ, 25µ, 10µ, 05µ, the surface area will increase as
follows.
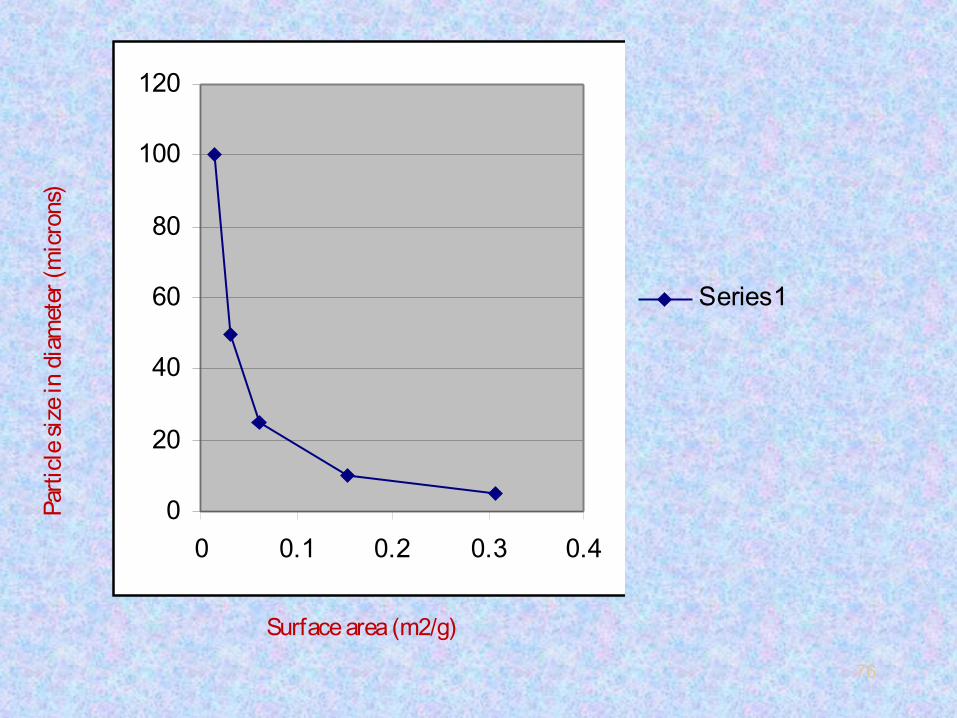
75
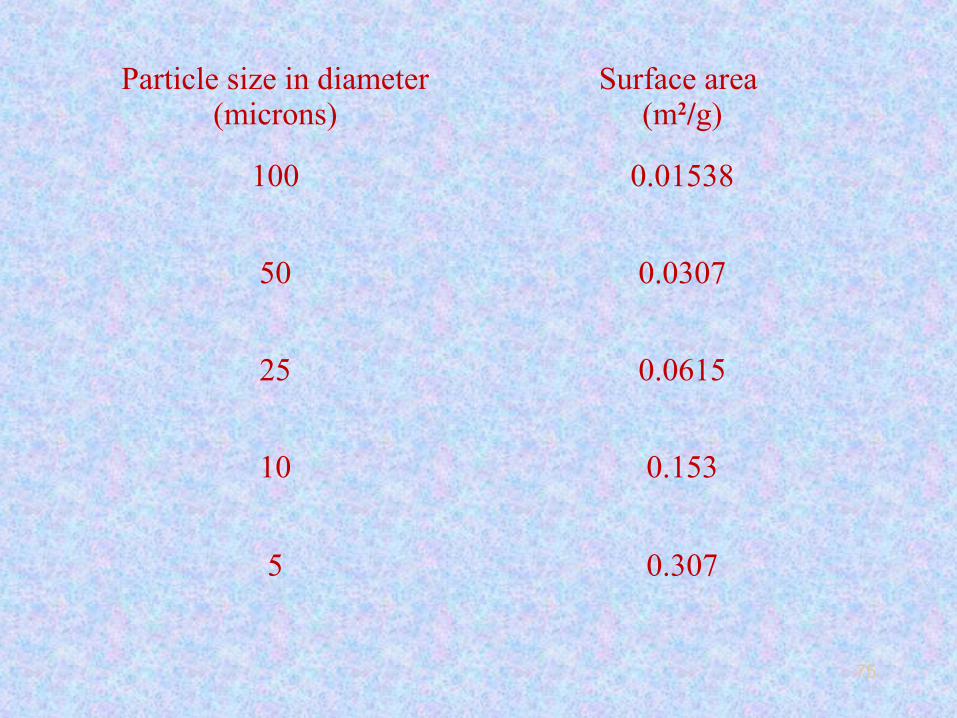
Particle size in diameter (microns)
Surface area (m2/g)
100 0.01538
50 0.0307
25 0.0615
10 0.153
5 0.307
76
0
20
40
60
80
100
120
0 0.1 0.2 0.3 0.4
Series1
Parti
cle
size
in d
iam
eter
(mic
rons
)
Surface area (m2/g)
77
• We can see that as the particle size of spherical particles is
reduced, the surface area increases exponentially.
• When the surface area increases, the amount of the liquid
phase coated also increases proportionately. More the liquid
phase loading more will be the interactions of solute
molecules with the liquid stationery phase, less will be
molecular spreading and band broadening.
• Then we can say that lower the particle size higher will be N
and higher will be the column separation efficiency.
78
• However we have also to remember that as the
stationary phase particles become smaller there is more
resistant to mobile phase flow.
•We have therefore to optimize the particle size without
sacrificing analytical times. Because to achieve good
separation with reasonable analytical time is practically
important and cannot be overlooked.
79
• If with a given length of say 100cm long column,
N = 10,000 then with L = 200cm, N= 20,000, keeping
particle size of stationary phase the same.
• Thus, longer the chromatographic column, higher will be N
and column separation efficiency.
• With longer columns, however, retention time of solutes
will increase and peaks will become broader and analytical time
will increase.
80
• We have to, therefore, optimize the column length just
as we optimized the particle size. Our main aim being
good separation with reasonable analytical time.
81
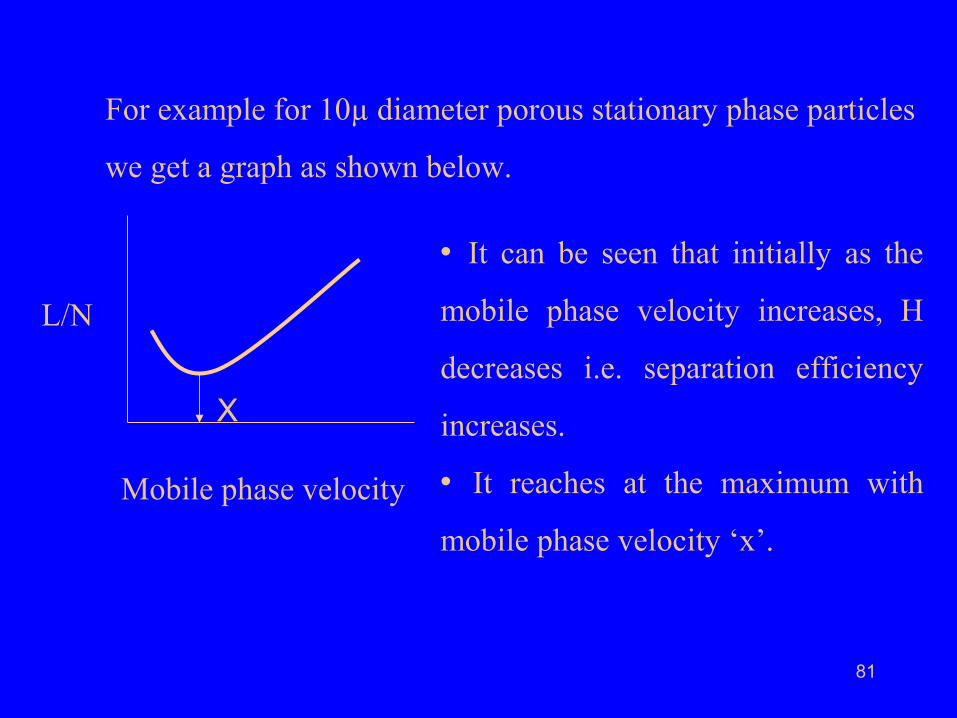
For example for 10µ diameter porous stationary phase particles
we get a graph as shown below.
• It can be seen that initially as the
mobile phase velocity increases, H
decreases i.e. separation efficiency
increases.
• It reaches at the maximum with
mobile phase velocity ‘x’.
Mobile phase velocity
L/N
X
82
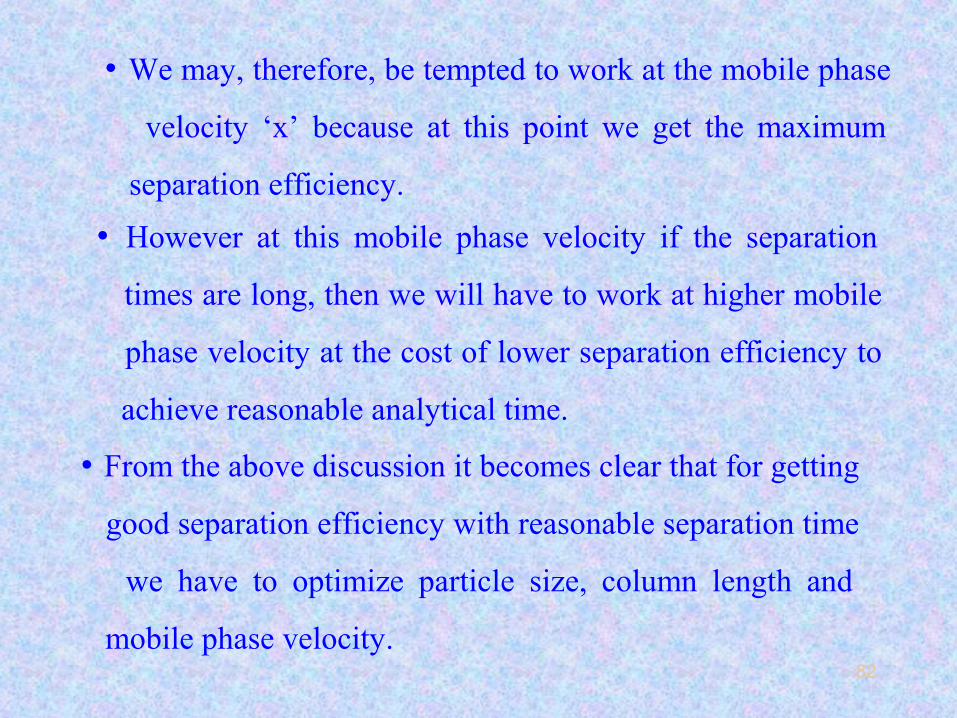
• We may, therefore, be tempted to work at the mobile phase
velocity ‘x’ because at this point we get the maximum
separation efficiency.
• From the above discussion it becomes clear that for getting
good separation efficiency with reasonable separation time
we have to optimize particle size, column length and
mobile phase velocity.
• However at this mobile phase velocity if the separation
times are long, then we will have to work at higher mobile
phase velocity at the cost of lower separation efficiency to
achieve reasonable analytical time.
83
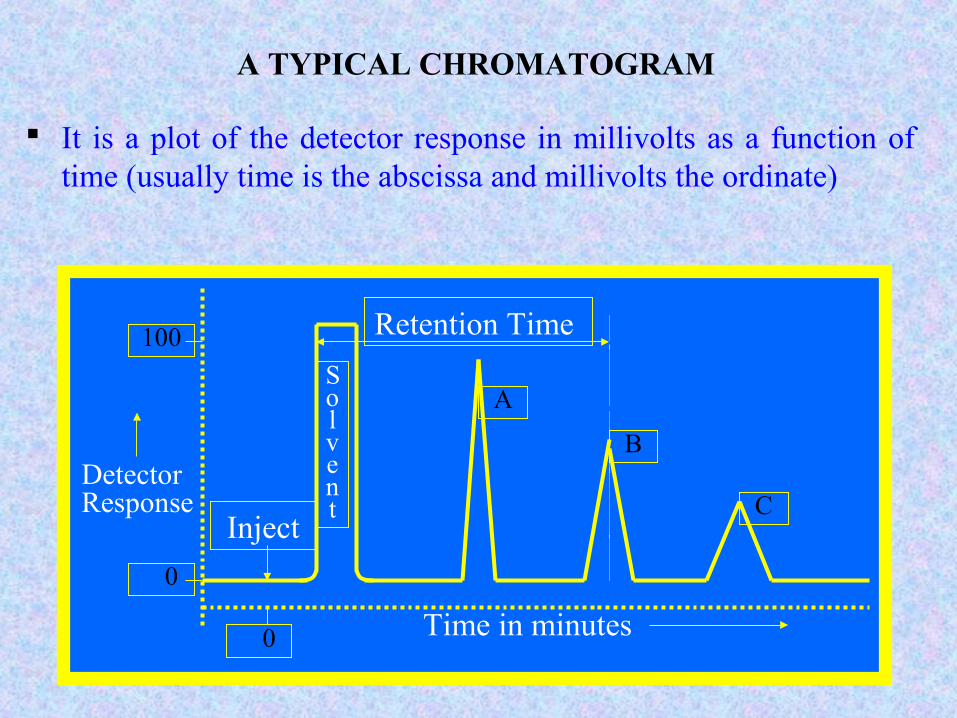
A TYPICAL CHROMATOGRAM
It is a plot of the detector response in millivolts as a function of time (usually time is the abscissa and millivolts the ordinate)
Retention Time
Solvent
A
B
CInject
Detector Response
100
0
Time in minutes 0
84
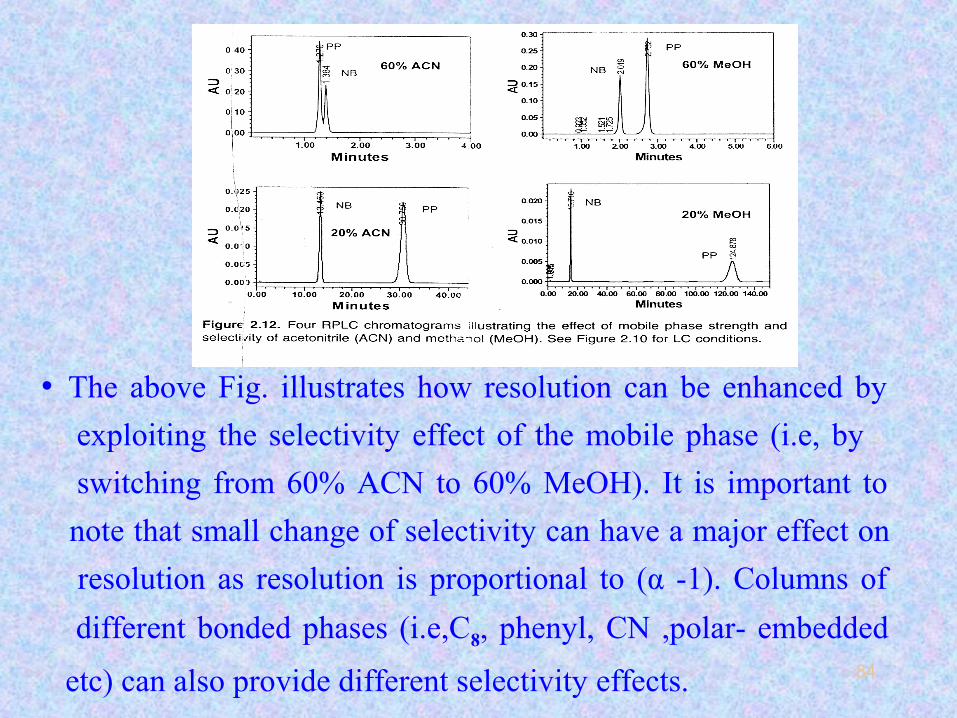
• The above Fig. illustrates how resolution can be enhanced by
exploiting the selectivity effect of the mobile phase (i.e, by
switching from 60% ACN to 60% MeOH). It is important to
note that small change of selectivity can have a major effect on
resolution as resolution is proportional to (α -1). Columns of
different bonded phases (i.e,C8, phenyl, CN ,polar- embedded
etc) can also provide different selectivity effects.
85
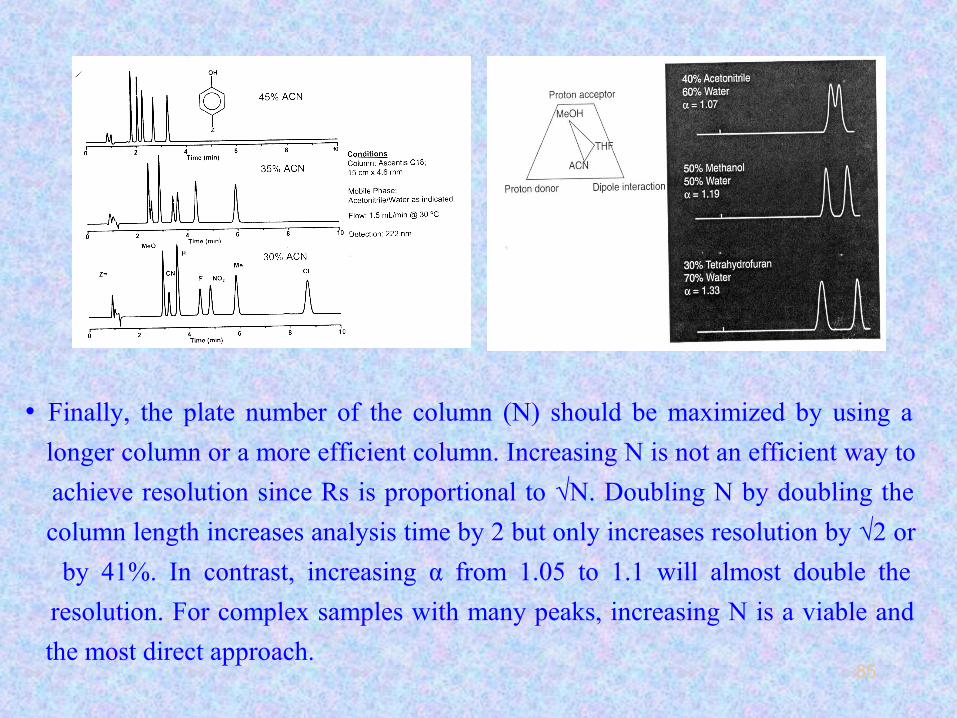
• Finally, the plate number of the column (N) should be maximized by using a
longer column or a more efficient column. Increasing N is not an efficient way to
achieve resolution since Rs is proportional to √N. Doubling N by doubling the
column length increases analysis time by 2 but only increases resolution by √2 or
by 41%. In contrast, increasing α from 1.05 to 1.1 will almost double the
resolution. For complex samples with many peaks, increasing N is a viable and
the most direct approach.
86
Concept of tailing and fronting
Individual solute molecules act independently of one
another during the chromatographic process.
As, a result they produce a randomized aggregation of retention
times after repeated sorptions and desorptions.
The result of a given solute is a distribution, or peak, whose shape
can be approximated as being normal or Gaussian.
Nonsymmetrical peaks usually indicate that some undesirable
interaction has taken place during the chromatographic process.
87
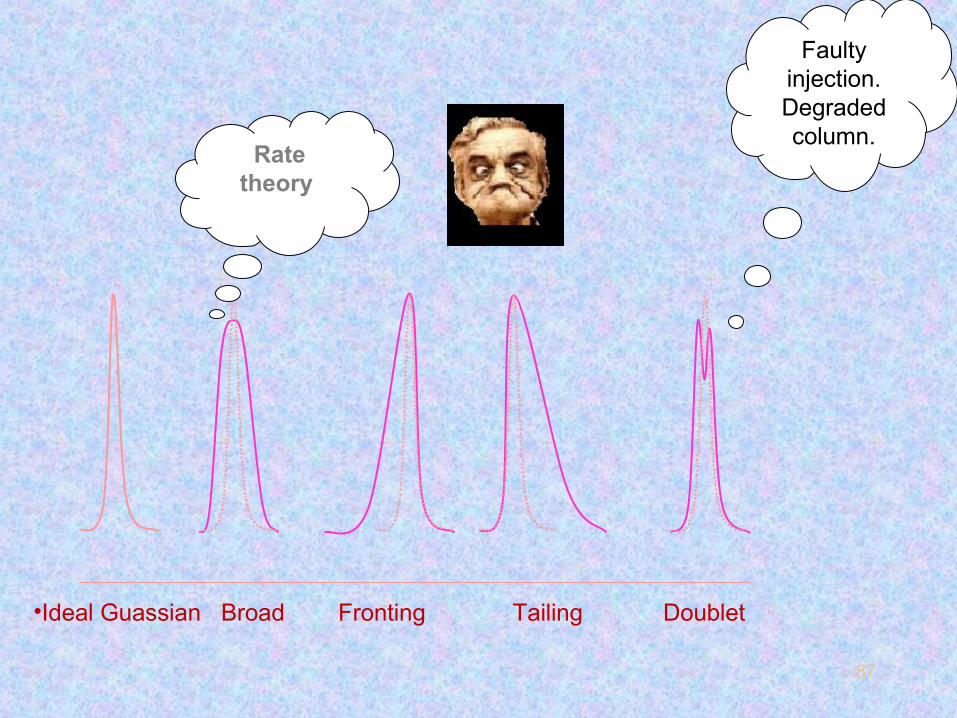
•Ideal Guassian Broad Fronting Tailing Doublet
Rate theory
Faulty injection.Degraded column.
88
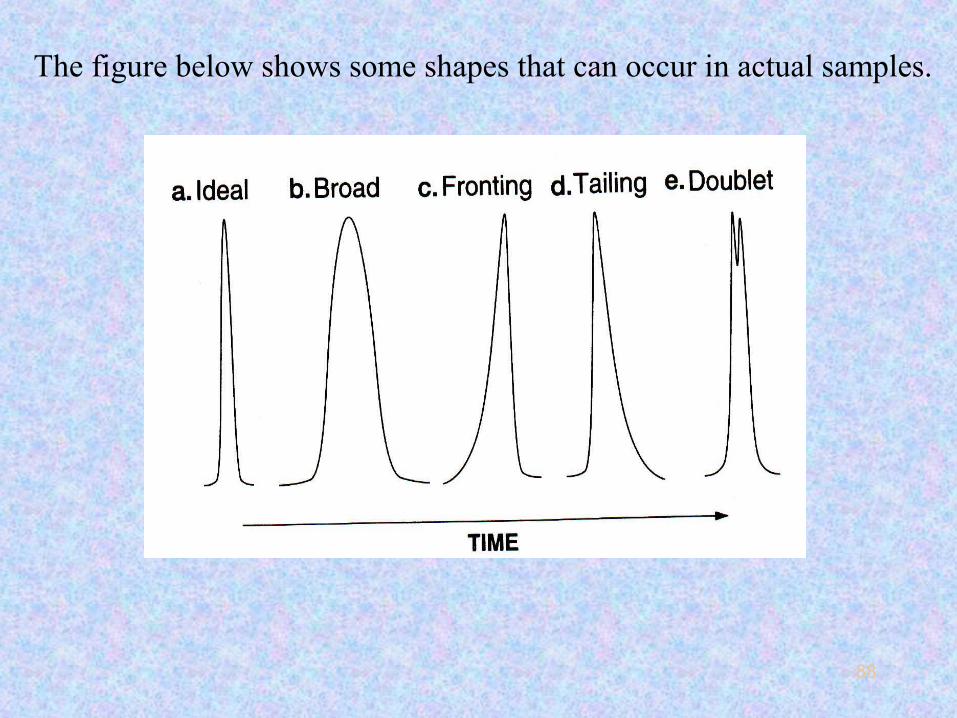
The figure below shows some shapes that can occur in actual samples.
89
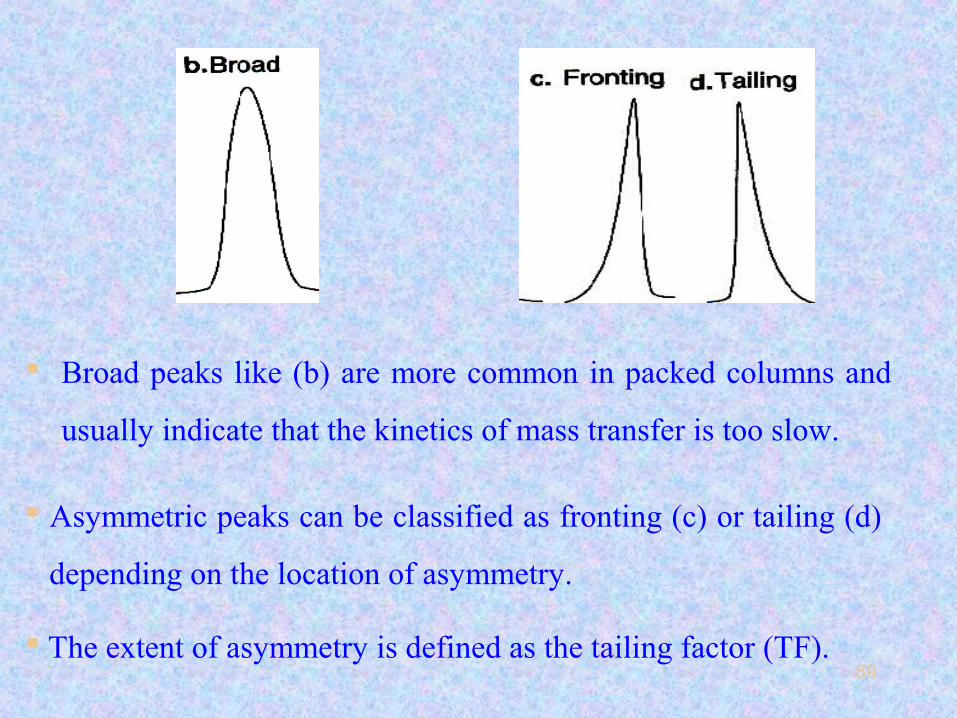
Broad peaks like (b) are more common in packed columns and
usually indicate that the kinetics of mass transfer is too slow.
Asymmetric peaks can be classified as fronting (c) or tailing (d)
depending on the location of asymmetry.
The extent of asymmetry is defined as the tailing factor (TF).
90
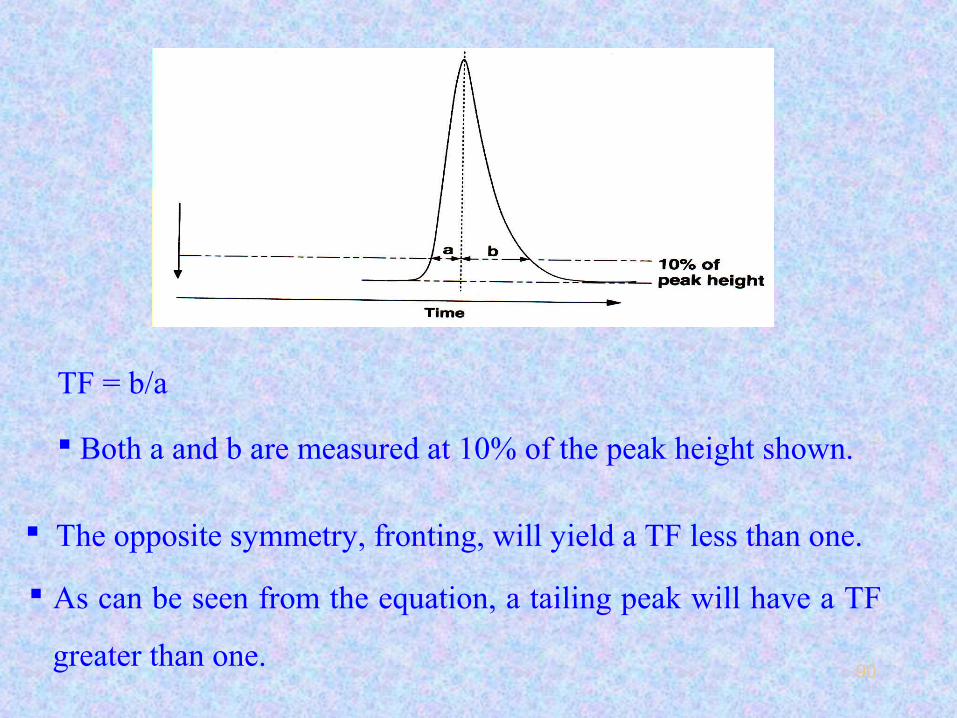
TF = b/a
Both a and b are measured at 10% of the peak height shown.
As can be seen from the equation, a tailing peak will have a TF
greater than one.
The opposite symmetry, fronting, will yield a TF less than one.
91
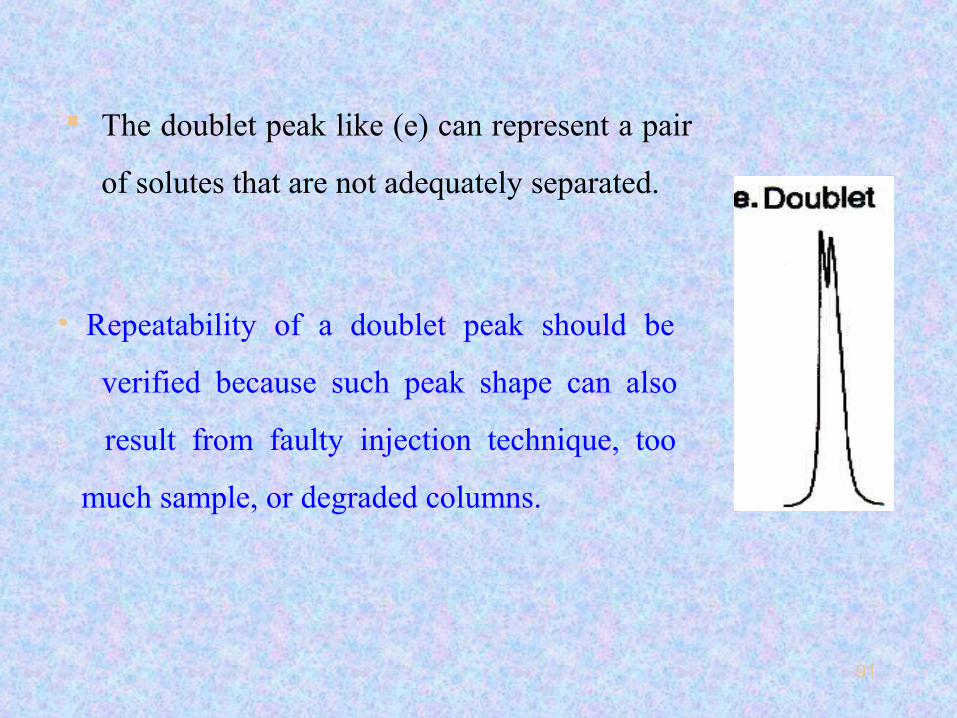
The doublet peak like (e) can represent a pair
of solutes that are not adequately separated.
• Repeatability of a doublet peak should be
verified because such peak shape can also
result from faulty injection technique, too
much sample, or degraded columns.
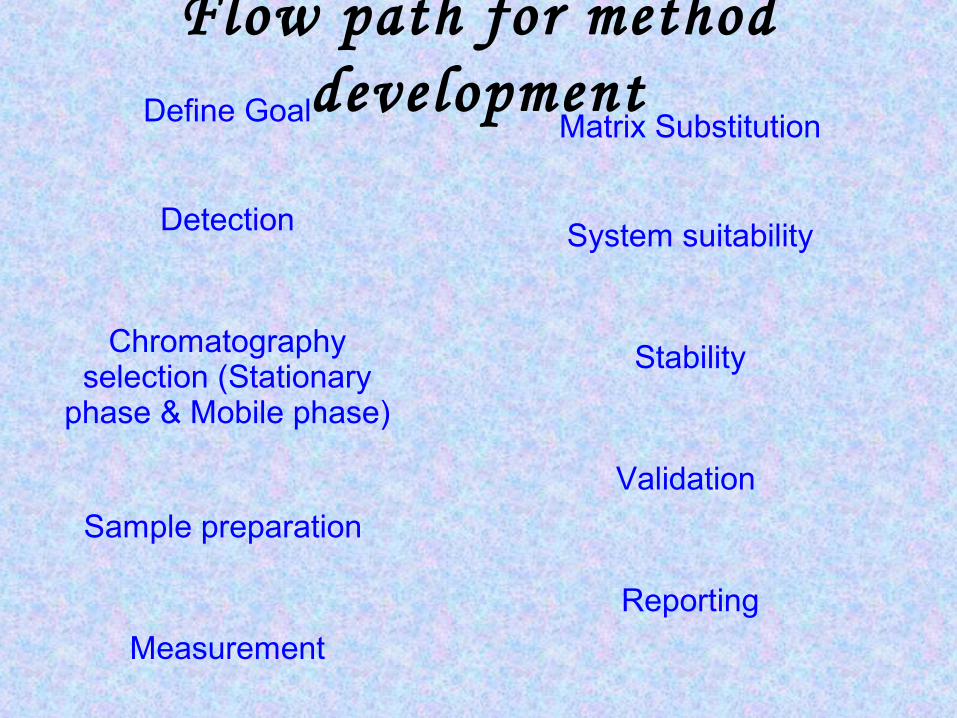
Flow path for method developmentDefine Goal
Detection
Chromatography selection (Stationary
phase & Mobile phase)
Sample preparation
Measurement
Matrix Substitution
System suitability
Stability
Validation
Reporting
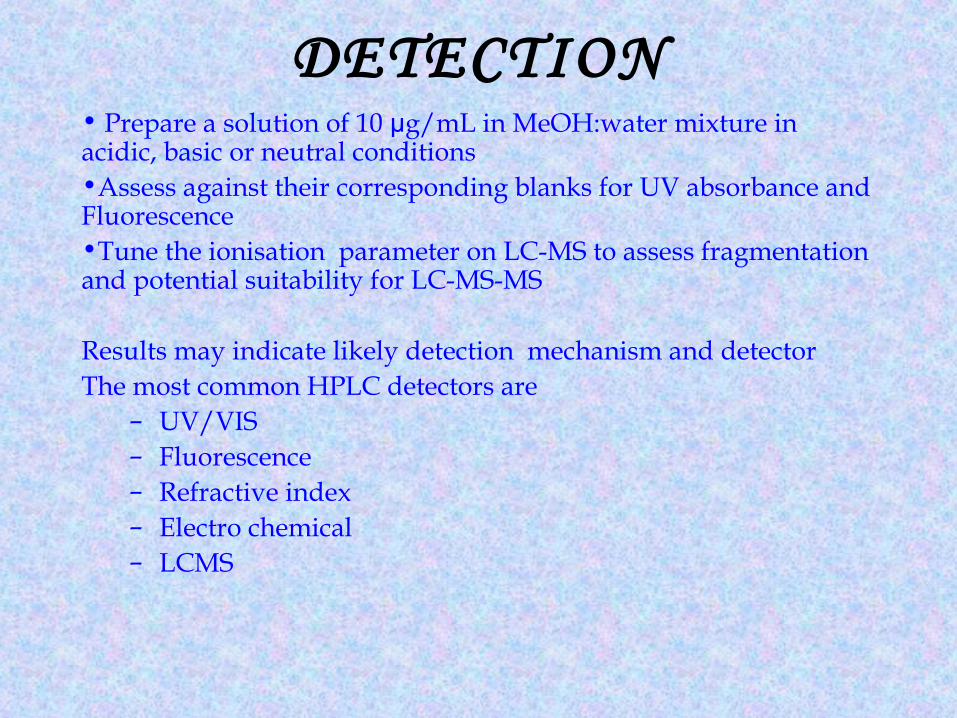
DETECTION• Prepare a solution of 10 µg/mL in MeOH:water mixture in acidic, basic or neutral conditions •Assess against their corresponding blanks for UV absorbance and Fluorescence•Tune the ionisation parameter on LC-MS to assess fragmentation and potential suitability for LC-MS-MS
Results may indicate likely detection mechanism and detectorThe most common HPLC detectors are
– UV/VIS– Fluorescence– Refractive index– Electro chemical– LCMS
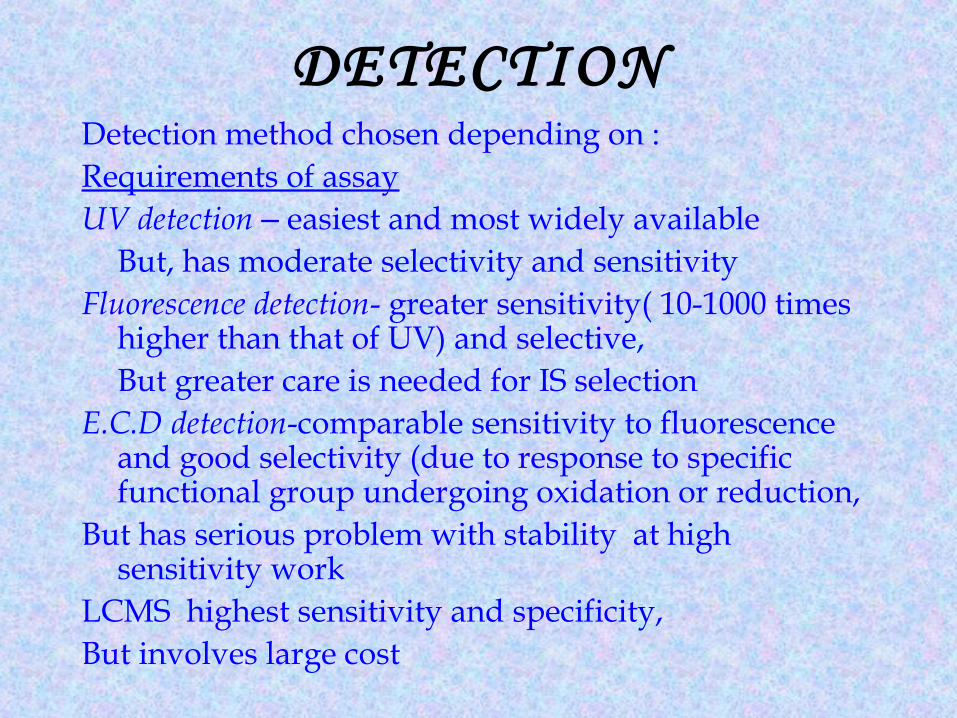
DETECTIONDetection method chosen depending on :Requirements of assayUV detection – easiest and most widely available
But, has moderate selectivity and sensitivityFluorescence detection- greater sensitivity( 10-1000 times
higher than that of UV) and selective,But greater care is needed for IS selection
E.C.D detection-comparable sensitivity to fluorescence and good selectivity (due to response to specific functional group undergoing oxidation or reduction,
But has serious problem with stability at high sensitivity work
LCMS highest sensitivity and specificity,But involves large cost
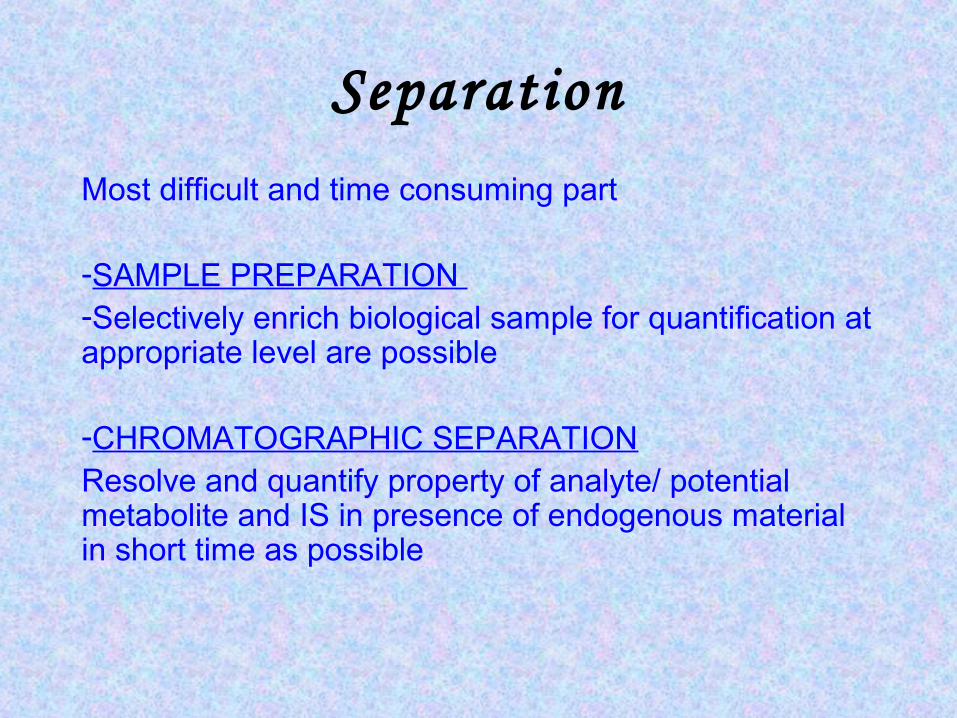
Separation
Most difficult and time consuming part
-SAMPLE PREPARATION -Selectively enrich biological sample for quantification at appropriate level are possible
-CHROMATOGRAPHIC SEPARATIONResolve and quantify property of analyte/ potential metabolite and IS in presence of endogenous material in short time as possible
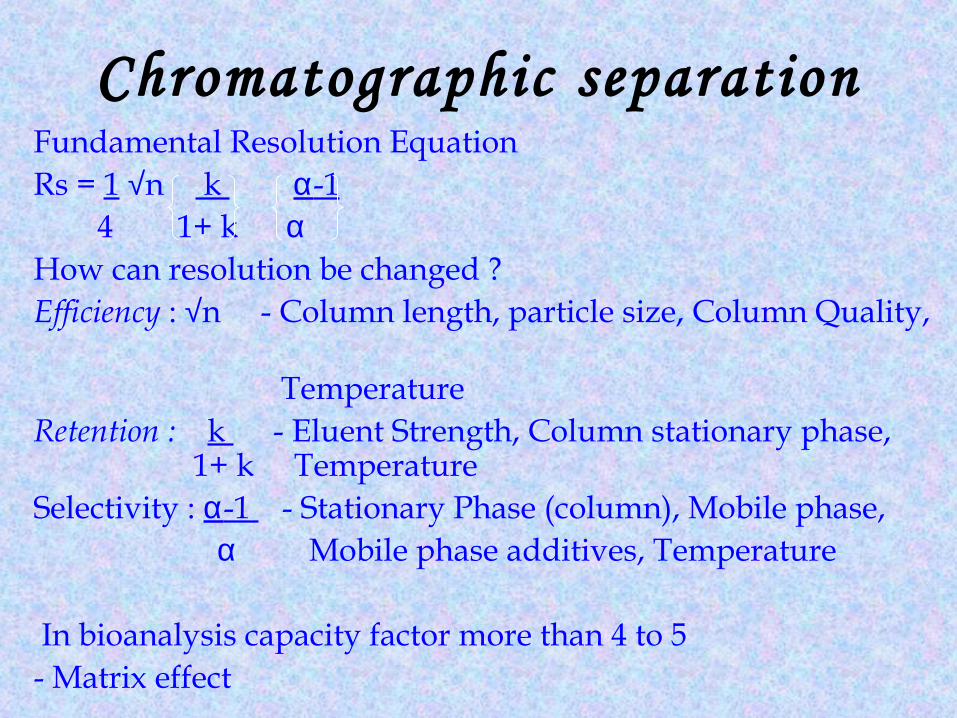
Chromatographic separationFundamental Resolution Equation Rs = 1 √n k α-1 4 1+ k αHow can resolution be changed ?Efficiency : √n - Column length, particle size, Column Quality, TemperatureRetention : k - Eluent Strength, Column stationary phase,
1+ k Temperature Selectivity : α-1 - Stationary Phase (column), Mobile phase, α Mobile phase additives, Temperature
In bioanalysis capacity factor more than 4 to 5 - Matrix effect
Sample preparation • OBJECTIVE • To carry through as high percentage as possible of
the analyte(s) from original sample to the determination steps (good recovery)
• To ensure that the analyte remain in their original state
• To carry through as few of the matrix components from the original sample to the determination step
• Preparation of sample in solution form, compatible for introduction in specific instrument (HPLC, LCMS, GCMS, RIA etc)
Sample preparation
In general there are three different methods of sample preparation prior to assay: -– Protein Precipitation– Liquid - Liquid Extraction– Solid Phase Extraction
Protein Precipitation• Denaturation and precipitation of proteins is done by
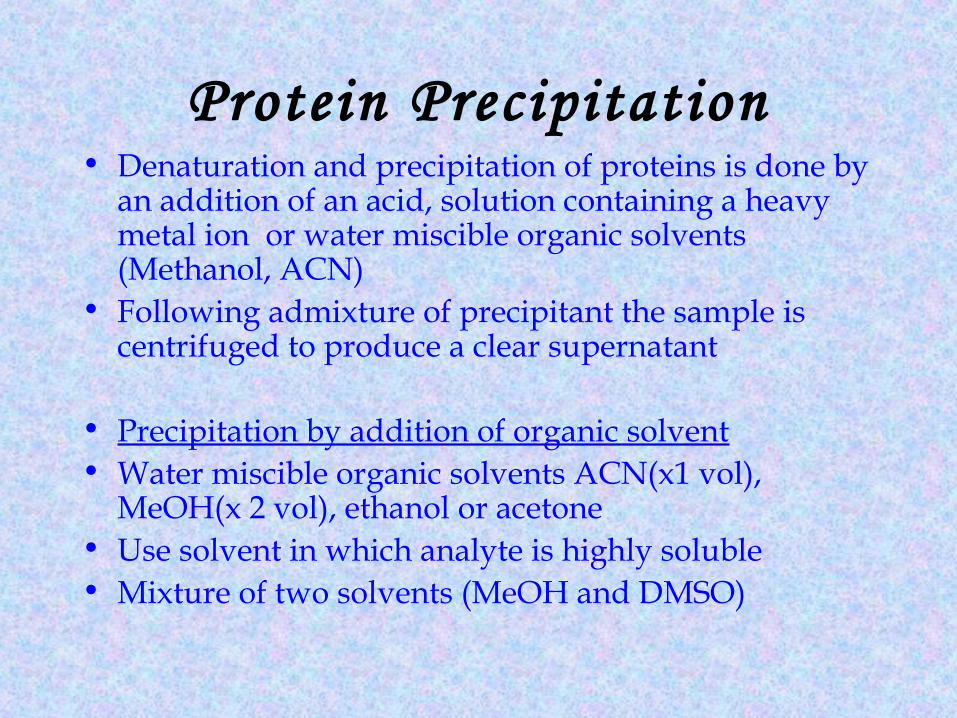
an addition of an acid, solution containing a heavy metal ion or water miscible organic solvents (Methanol, ACN)
• Following admixture of precipitant the sample is centrifuged to produce a clear supernatant
• Precipitation by addition of organic solvent• Water miscible organic solvents ACN(x1 vol),
MeOH(x 2 vol), ethanol or acetone• Use solvent in which analyte is highly soluble• Mixture of two solvents (MeOH and DMSO)
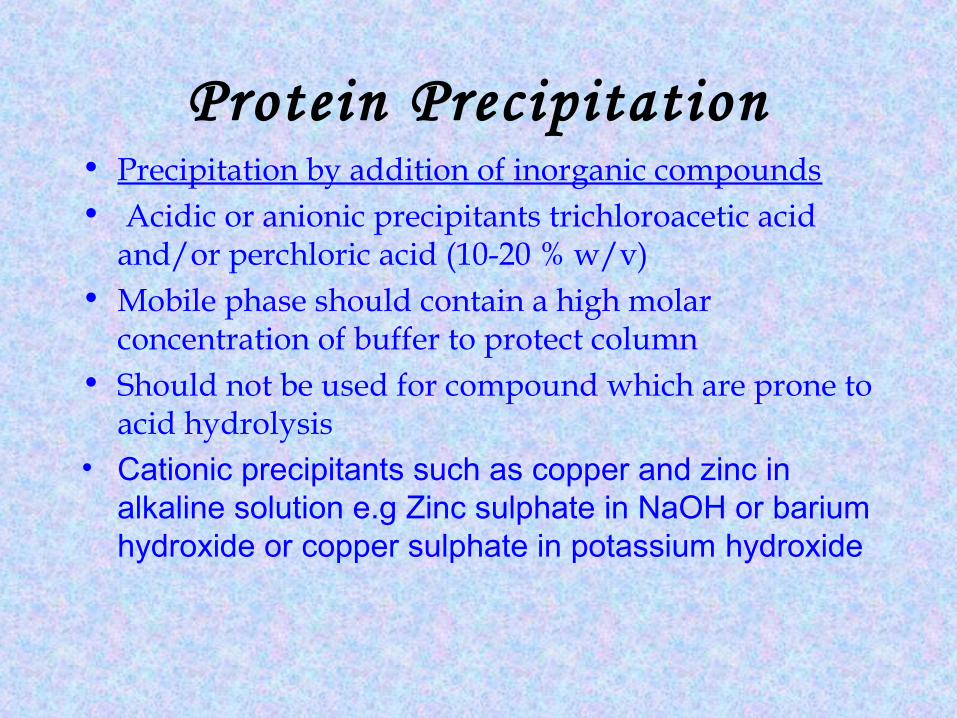
Protein Precipitation• Precipitation by addition of inorganic compounds• Acidic or anionic precipitants trichloroacetic acid
and/or perchloric acid (10-20 % w/v)• Mobile phase should contain a high molar
concentration of buffer to protect column• Should not be used for compound which are prone to
acid hydrolysis • Cationic precipitants such as copper and zinc in
alkaline solution e.g Zinc sulphate in NaOH or barium hydroxide or copper sulphate in potassium hydroxide
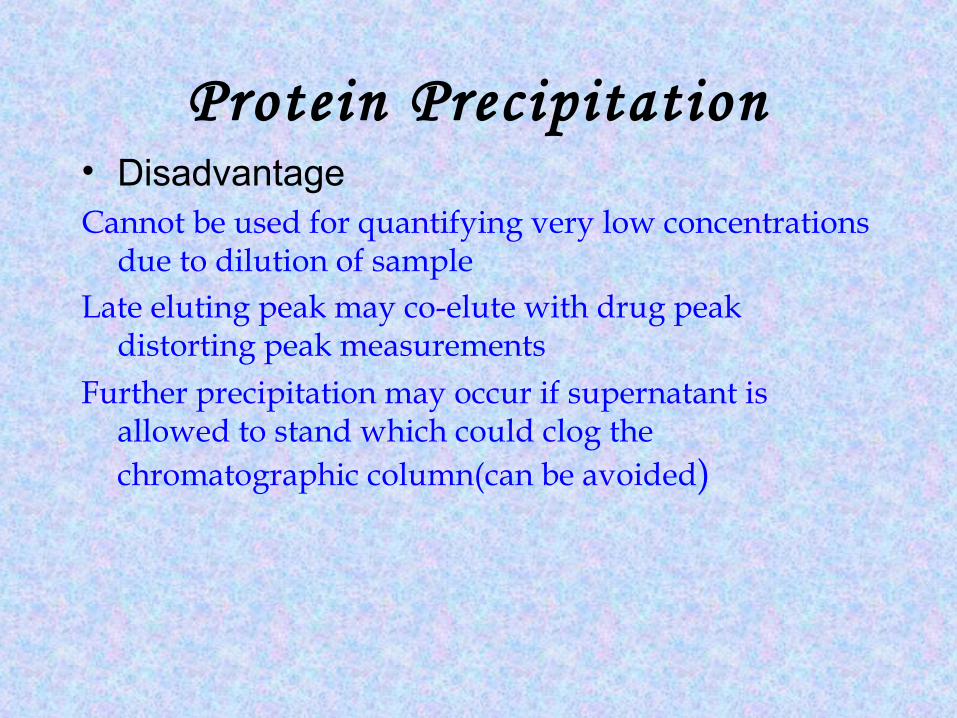
Protein Precipitation• Disadvantage Cannot be used for quantifying very low concentrations
due to dilution of sample Late eluting peak may co-elute with drug peak
distorting peak measurementsFurther precipitation may occur if supernatant is
allowed to stand which could clog the chromatographic column(can be avoided)
Liquid -Liquid Extraction
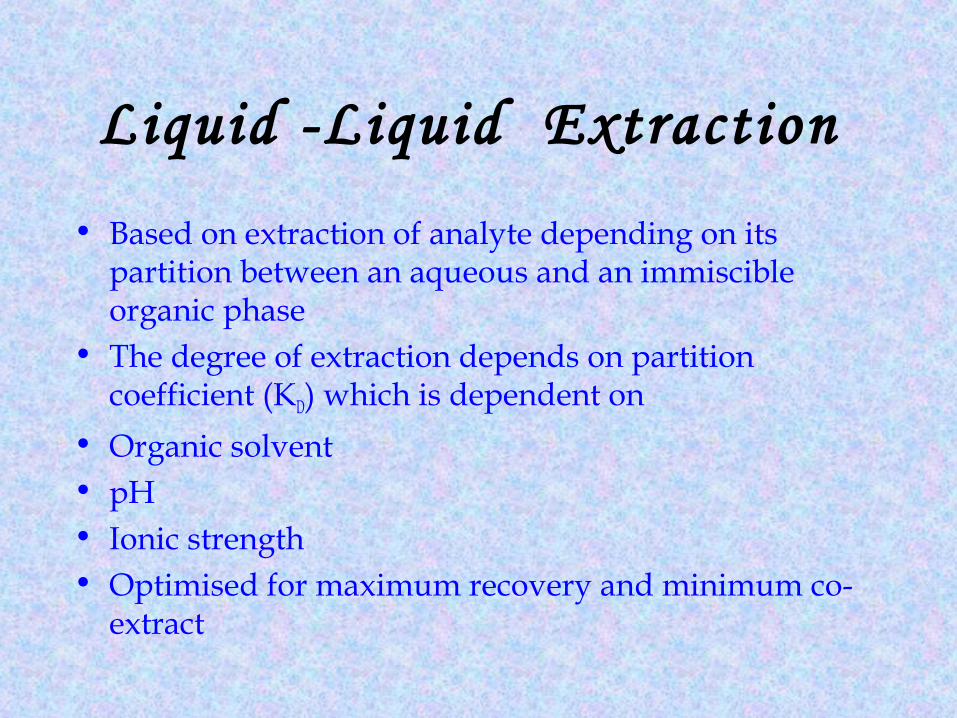
• Based on extraction of analyte depending on its partition between an aqueous and an immiscible organic phase
• The degree of extraction depends on partition coefficient (KD) which is dependent on
• Organic solvent• pH • Ionic strength• Optimised for maximum recovery and minimum co-
extract
Liquid -Liquid Extraction
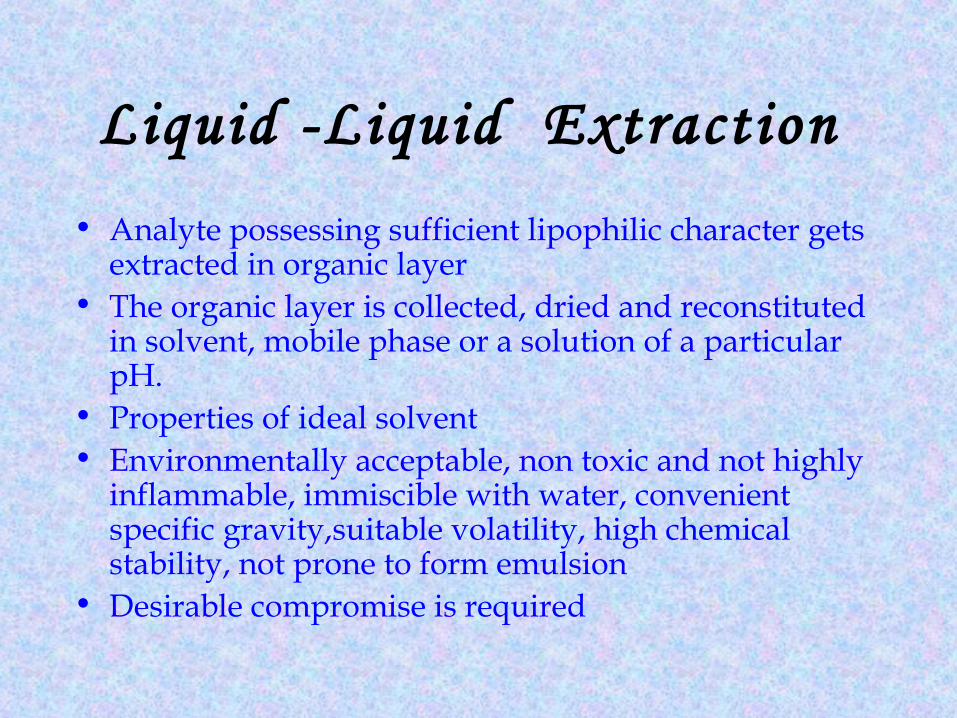
• Analyte possessing sufficient lipophilic character gets extracted in organic layer
• The organic layer is collected, dried and reconstituted in solvent, mobile phase or a solution of a particular pH.
• Properties of ideal solvent • Environmentally acceptable, non toxic and not highly
inflammable, immiscible with water, convenient specific gravity,suitable volatility, high chemical stability, not prone to form emulsion
• Desirable compromise is required
Liquid -Liquid Extraction
• Most popular solvents are heptane, hexane, toluene, diethyl ether , ethyl acetate, dichloromethane and chloroform
• It is best to use least polar solvent that will effectively extract drug.
• No advantage in selecting solvent with too much extracting power it may reduce selectivity of assay
• Acid drugs extracted under acidic condition (pH 2 units below pKa)
• Basic drugs extracted under basic conditions (pH 2 units above pKa)
Liquid -Liquid Extraction
• Wherever possible high pH is desirable to ensure cleaner extract
• To limit the carry-over• Back extraction into aqueous phase with pH adjusted so
that analytes ionize again• Highly polar ionic drug are extracted by formation of
neutral ion pair complex • Addition of ion pairing agents tetralkyammonium salts
for acids and alkyl sulphonates (heptane sulphonic acid for base)
Liquid -Liquid Extraction
Disadvantages- Emulsion Formation- Time consuming- adsorption of analytes on glassware - Require large volume of organic solvent - Ionizable compounds require specific pH
adjustment for extraction
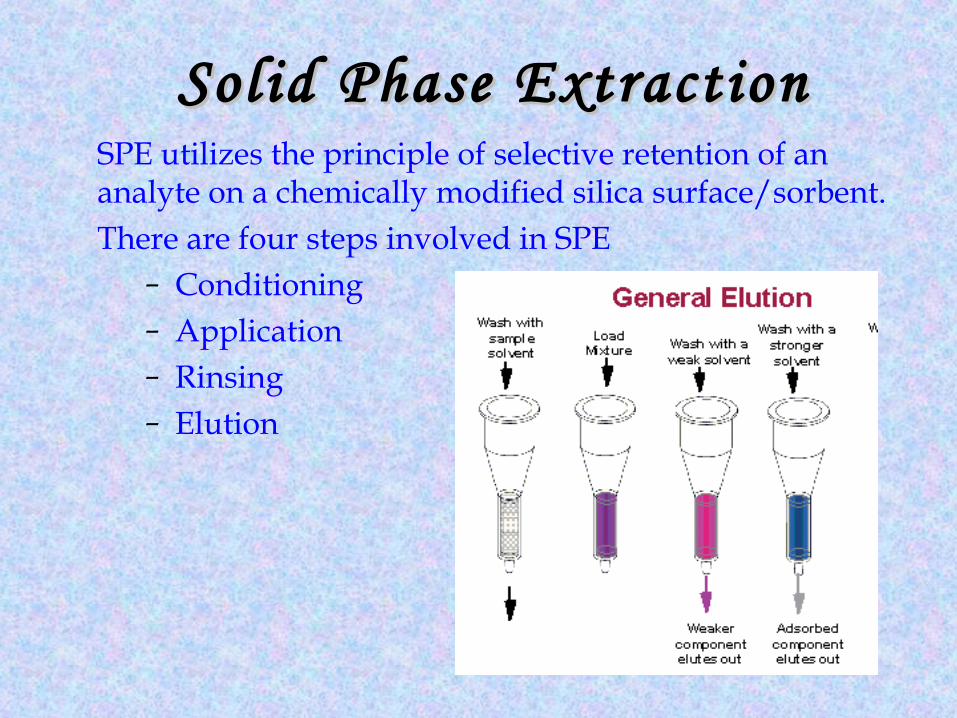
Solid Phase ExtractionSolid Phase ExtractionSPE utilizes the principle of selective retention of an analyte on a chemically modified silica surface/sorbent.There are four steps involved in SPE
– Conditioning– Application– Rinsing– Elution
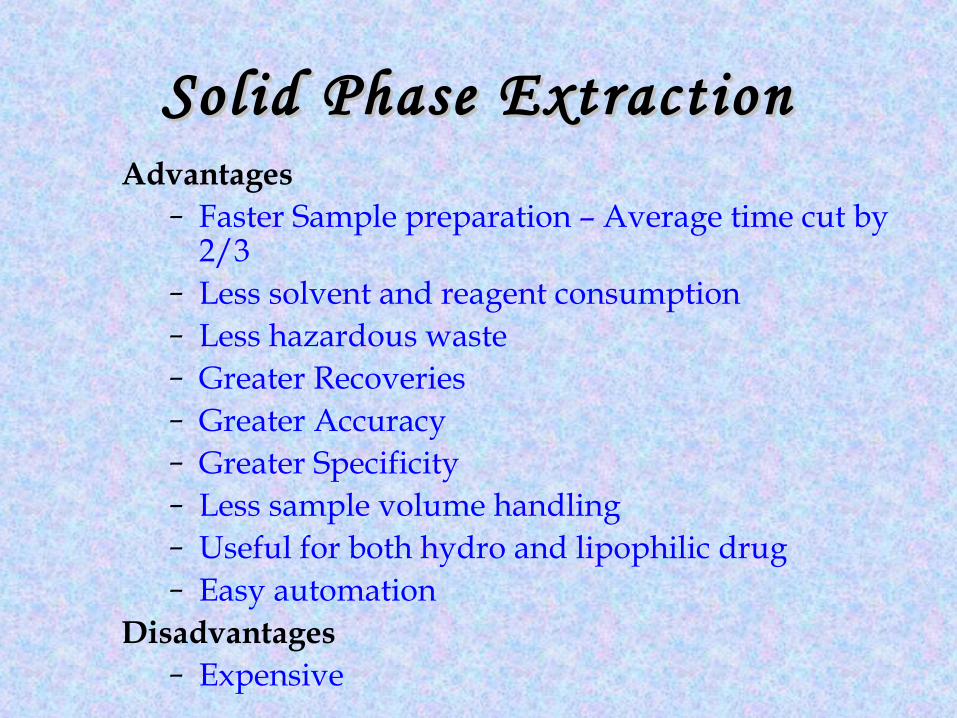
Solid Phase ExtractionSolid Phase ExtractionAdvantages
– Faster Sample preparation – Average time cut by 2/3
– Less solvent and reagent consumption– Less hazardous waste– Greater Recoveries– Greater Accuracy– Greater Specificity– Less sample volume handling– Useful for both hydro and lipophilic drug– Easy automation
Disadvantages– Expensive
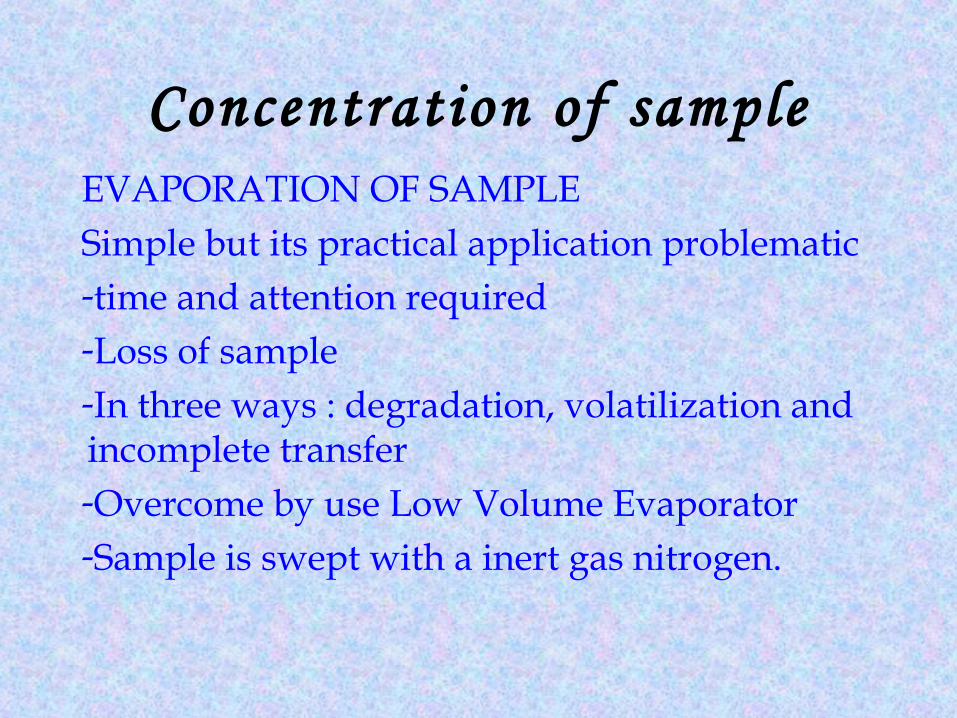
Concentration of sampleEVAPORATION OF SAMPLESimple but its practical application problematic-time and attention required-Loss of sample-In three ways : degradation, volatilization and incomplete transfer-Overcome by use Low Volume Evaporator-Sample is swept with a inert gas nitrogen.
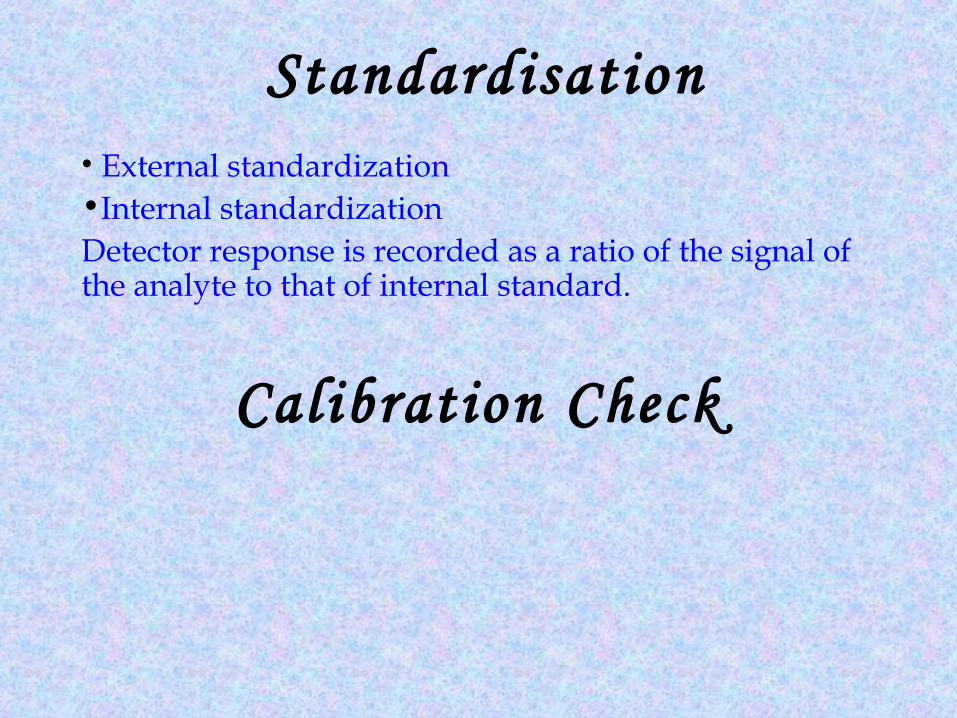
Standardisation• External standardization•Internal standardizationDetector response is recorded as a ratio of the signal of the analyte to that of internal standard.
Calibration Check
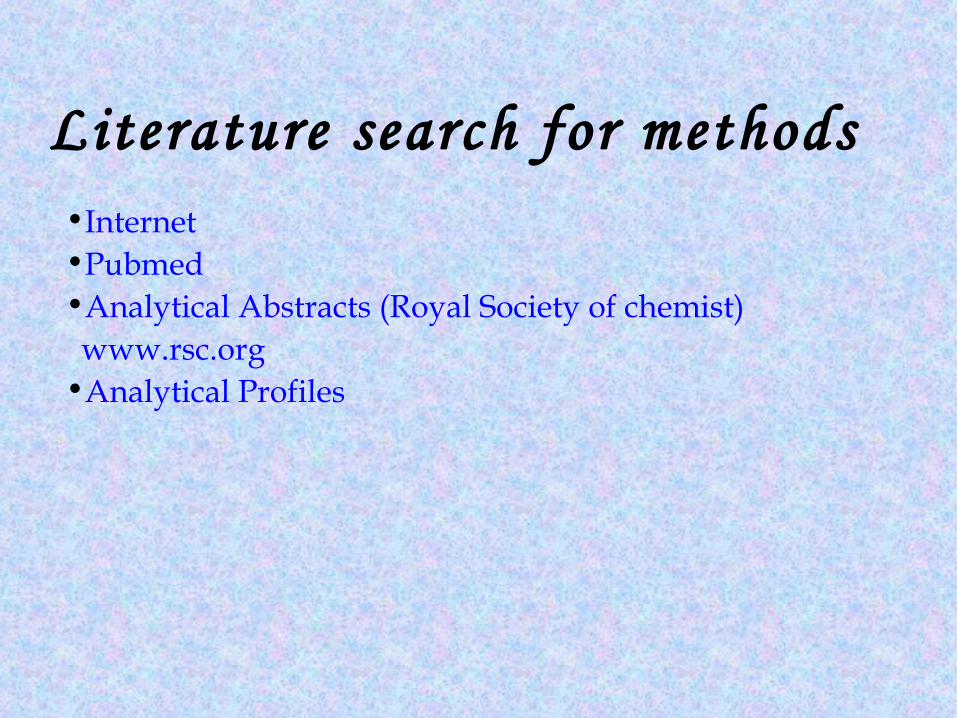
Literature search for methods •Internet •Pubmed•Analytical Abstracts (Royal Society of chemist) www.rsc.org•Analytical Profiles
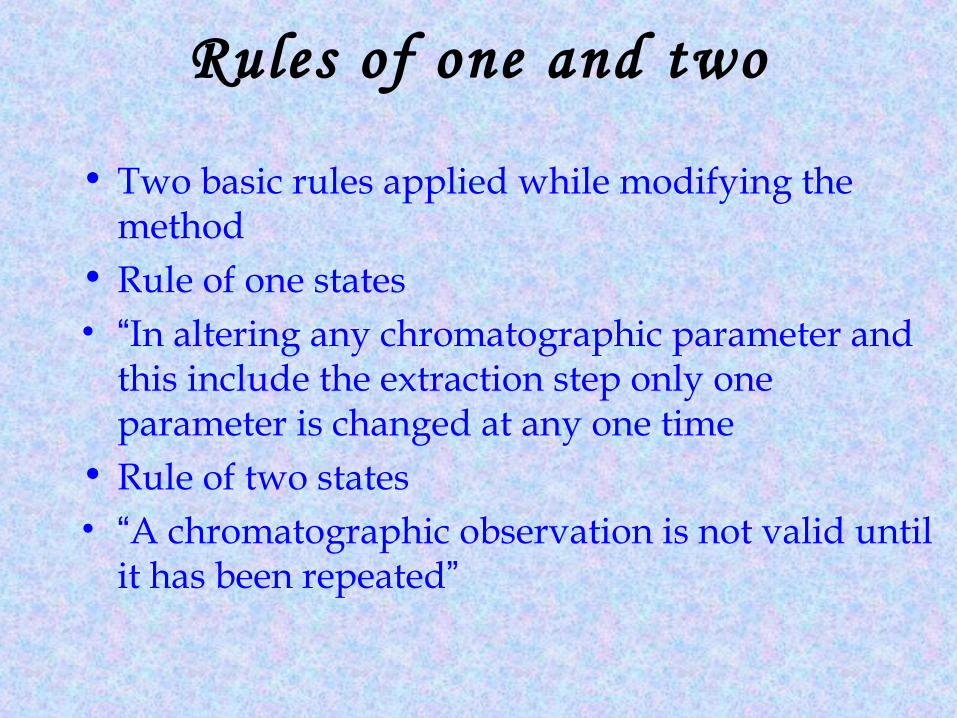
Rules of one and two
• Two basic rules applied while modifying the method
• Rule of one states• “In altering any chromatographic parameter and
this include the extraction step only one parameter is changed at any one time
• Rule of two states• “A chromatographic observation is not valid until
it has been repeated”
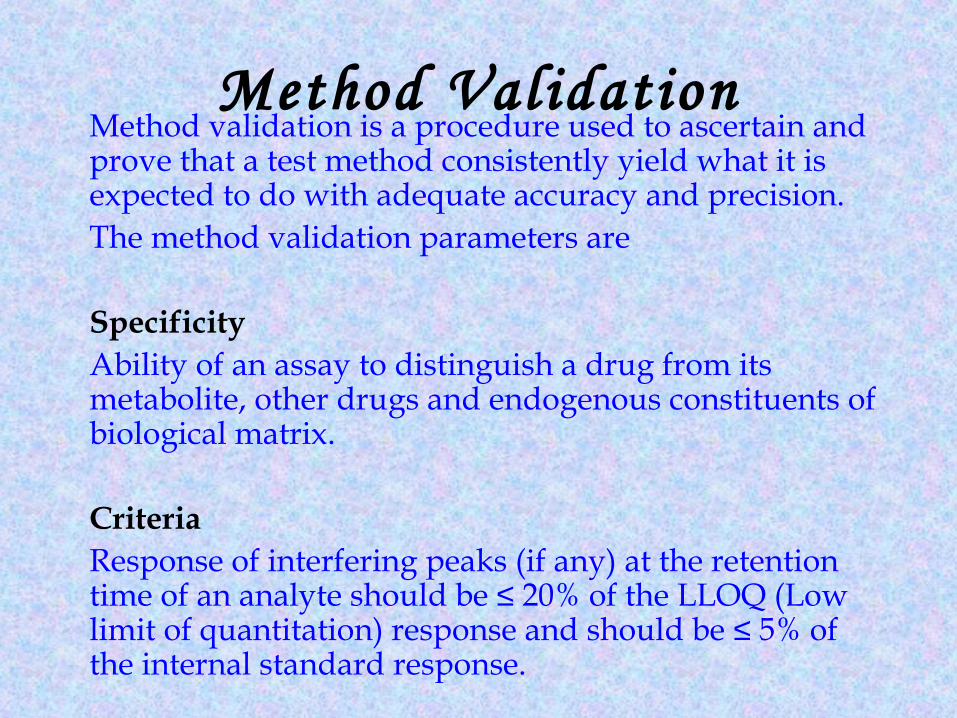
Method ValidationMethod validation is a procedure used to ascertain and prove that a test method consistently yield what it is expected to do with adequate accuracy and precision.The method validation parameters are
SpecificityAbility of an assay to distinguish a drug from its metabolite, other drugs and endogenous constituents of biological matrix.
CriteriaResponse of interfering peaks (if any) at the retention time of an analyte should be ≤ 20% of the LLOQ (Low limit of quantitation) response and should be ≤ 5% of the internal standard response.
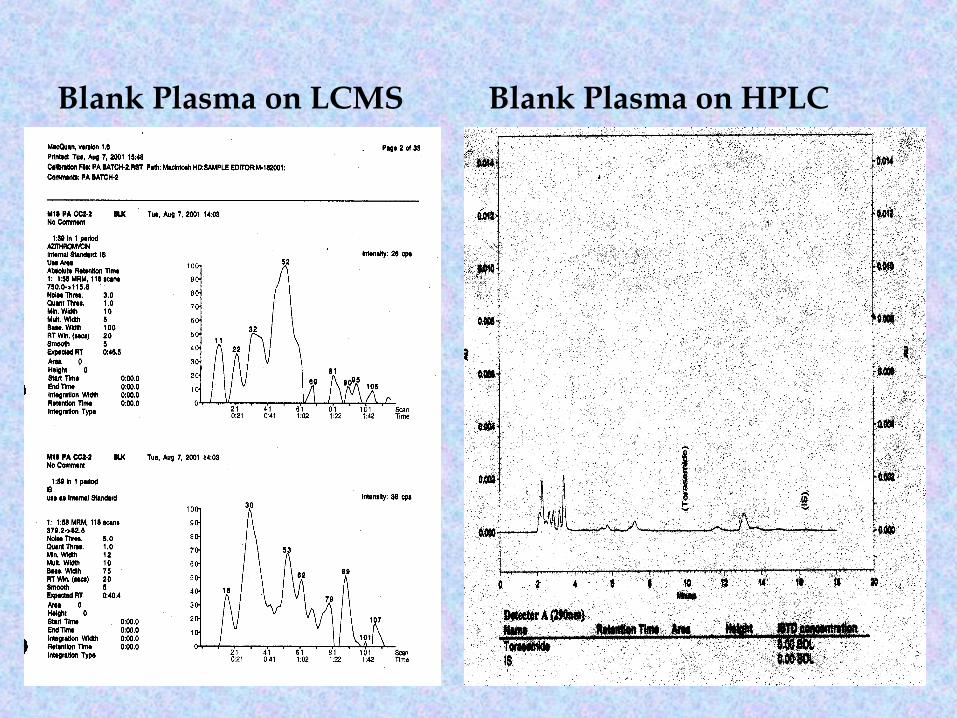
Blank Plasma on LCMS Blank Plasma on HPLC
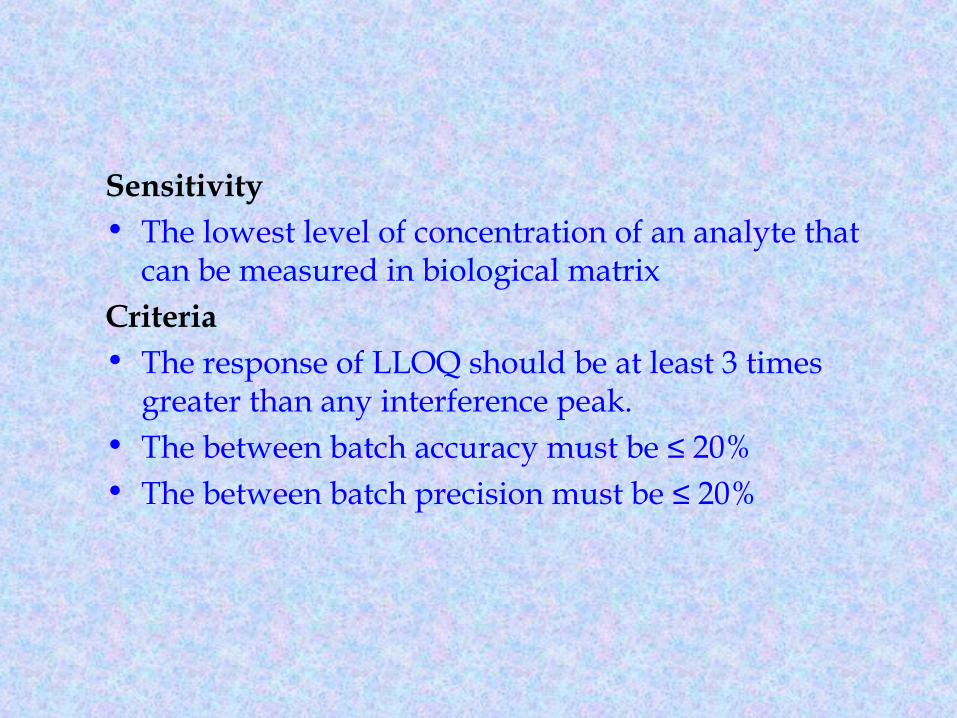
Sensitivity • The lowest level of concentration of an analyte that
can be measured in biological matrixCriteria• The response of LLOQ should be at least 3 times
greater than any interference peak.• The between batch accuracy must be ≤ 20%• The between batch precision must be ≤ 20%
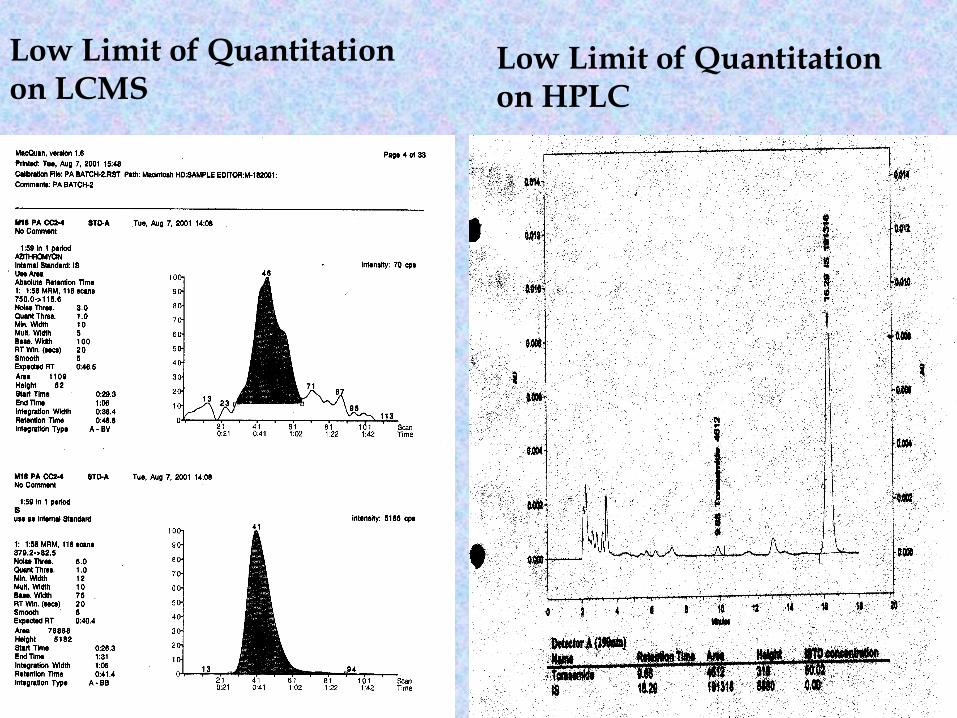
Low Limit of Quantitation on LCMS
Low Limit of Quantitation on HPLC
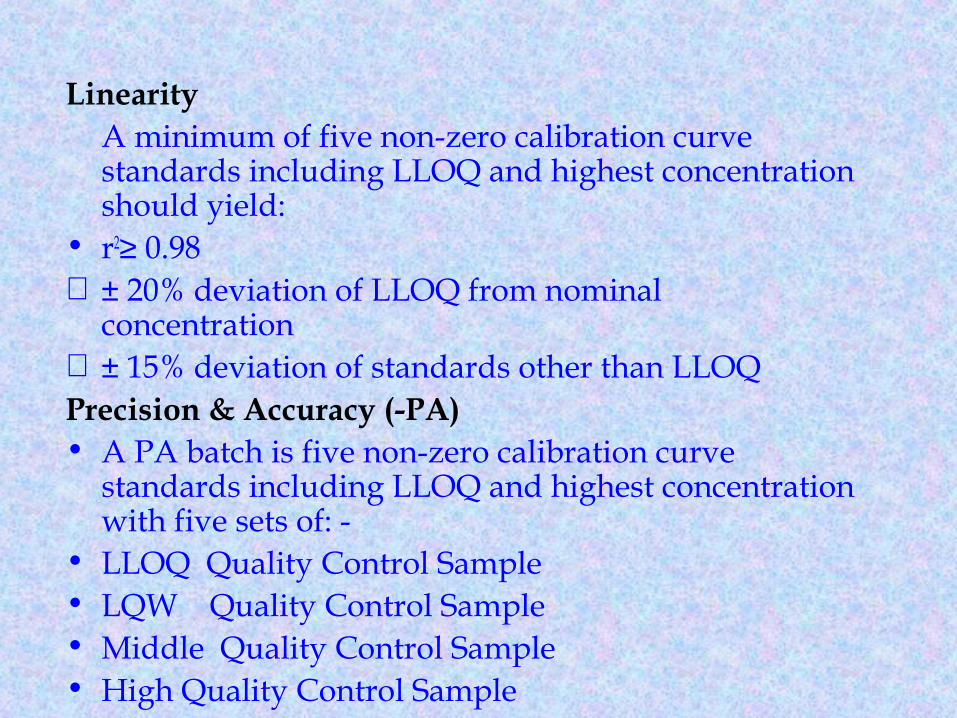
LinearityA minimum of five non-zero calibration curve standards including LLOQ and highest concentration should yield:
• r2≥ 0.98∀ ± 20% deviation of LLOQ from nominal
concentration∀ ± 15% deviation of standards other than LLOQPrecision & Accuracy (-PA)• A PA batch is five non-zero calibration curve
standards including LLOQ and highest concentration with five sets of: -
• LLOQ Quality Control Sample• LQW Quality Control Sample• Middle Quality Control Sample• High Quality Control Sample
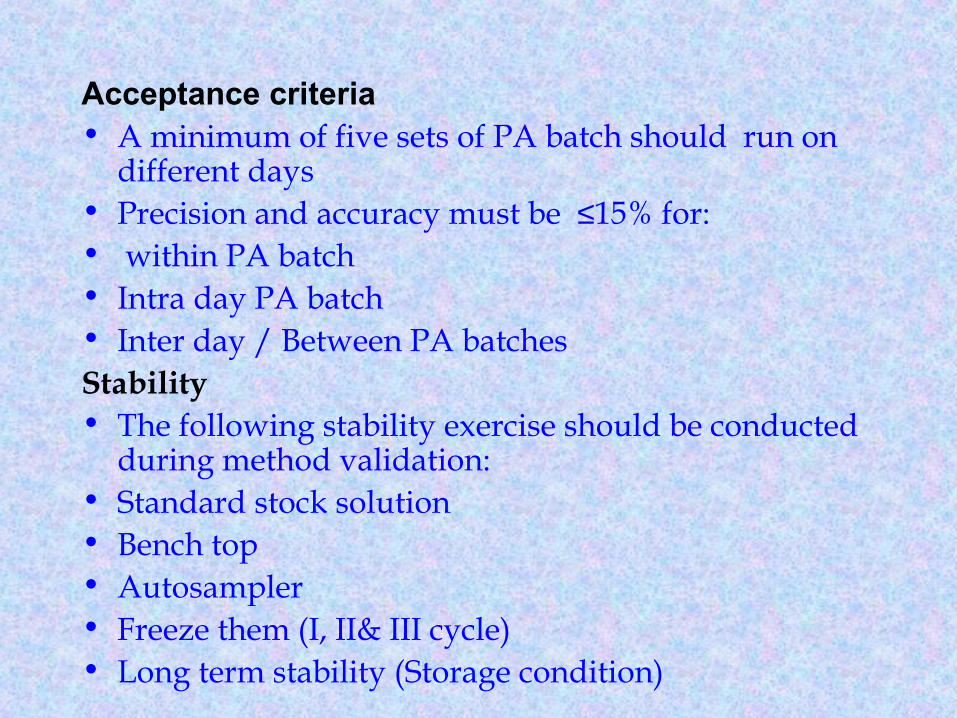
Acceptance criteria• A minimum of five sets of PA batch should run on
different days• Precision and accuracy must be ≤15% for:• within PA batch• Intra day PA batch• Inter day / Between PA batchesStability• The following stability exercise should be conducted
during method validation:• Standard stock solution• Bench top• Autosampler• Freeze them (I, II& III cycle)• Long term stability (Storage condition)
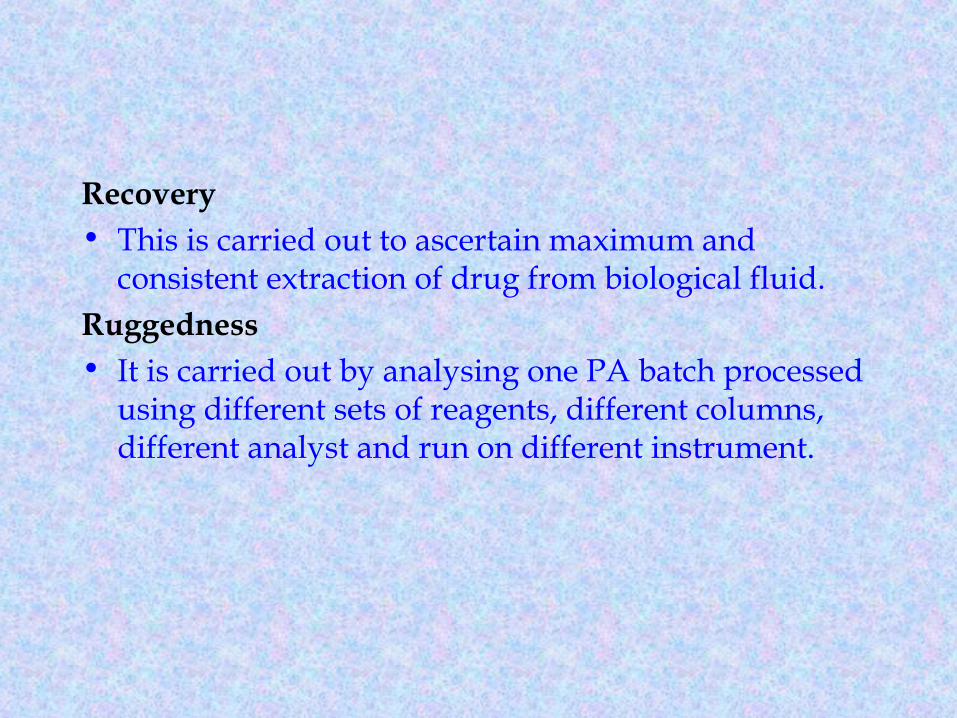
Recovery• This is carried out to ascertain maximum and
consistent extraction of drug from biological fluid.Ruggedness• It is carried out by analysing one PA batch processed
using different sets of reagents, different columns, different analyst and run on different instrument.
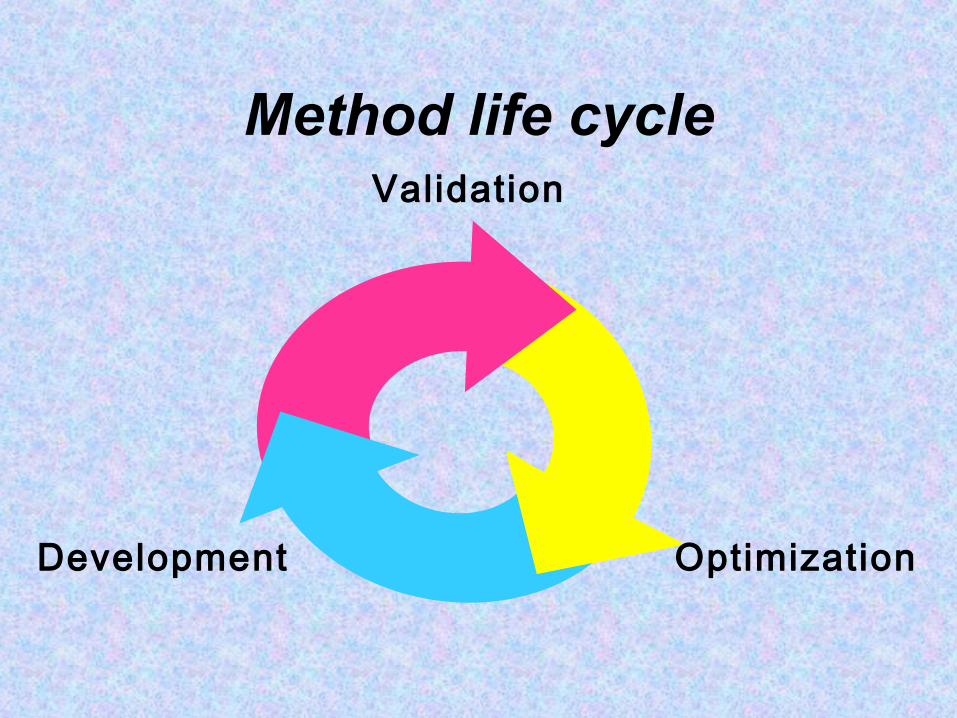
Method life cycleValidation
Development Optimization

As a part of GLP all the exercise carried out during method validation are well documented by competing specific pre-designed form, log books and note books.
The complete method validation should be audited by an independent quality assurance person for• Conduction of activities as per related SOPs• Pre recording and documentation of data• Data Analysis• Accurate reporting
GLP Requirements
References•Hill, H.M. Analysis of drugs in biological fluid, in :
Townshed, A (ed.) Encyclopedia of Analytical sciences, Volume 6, London, Academic Press, 1995
•Smyth, M.R.(ed.0 Chemical Analysis in Complex Matrices, New York, Ellis Harwood Limited, 1992
•Snyder, L.R. Kirkland, J.J. and Glajch, Practical HPLC Method Development, 2nd edition, New York, John Wiley and Sons, Inc., 1997
•Venn, R.F.(ed.) Principle and Practice of bioanalysis, London, Taylor and Francis
123
References
1.Heftmann, Chromatography Part A: Fundamentals and
Techniques, 6th edition, published by Elsevier, 2004.
2.Skoog, Holler, Nieman, Principles of Instrumental Analysis,
5th edition, published by Thomson Brook/Cole, 2005.
3.Mendham, Denny, Barnes, Thomas, Vogel’s text book of
Quantitative Chemical Analysis, 6th edition, published by
Person Education, 2007.
Recommended