
CHITOSAN-TITANIUM DIOXIDE (Cs-TiO2) CATALYST SYNTHESIZED ON GLASS SUBSTRATE FOR
PHOTODEGRADATION
MUHAMMAD NUR IMAN BIN AMIR
INSTITUE OF GRADUATE STUDIES
UNIVERSITY OF MALAYA KUALA LUMPUR
2016
CHITOSAN-TITANIUM DIOXIDE (CS-TIO2)
CATALYST SYNTHESIZED ON GLASS SUBSTRATE
FOR PHOTODEGRADATION
MUHAMMAD NUR IMAN BIN AMIR
DISSERTATION SUBMITTED IN FULFILMENT OF
THE REQUIREMENTS FOR THE DEGREE OF MASTER
OF PHILOSOPHY
INSTITUE OF GRADUATE STUDIES
UNIVERSITY OF MALAYA
KUALA LUMPUR
2016

iii
UNIVERSITY OF MALAYA
ORIGINAL LITERARY WORK DECLARATION
Name of Candidate: MUHAMMAD NUR IMAN BIN AMIR
(I.C/Passport No: 890515085355)
Registration/Matric No: HGA140007
Name of Degree: Master of Philosophy
Title of Project Thesis (“this Work”): Chitosan-Titanium Dioxide (Cs-TiO2) catalyst
synthesized on glass substrate for photodegradation
Field of Study: Environmental Science (Catalysis)
I do solemnly and sincerely declare that:
(1) I am the sole author/writer of this Work;
(2) This Work is original;
(3) Any use of any work in which copyright exists was done by way of fair dealing
and for permitted purposes and any excerpt or extract from, or reference to or
reproduction of any copyright work has been disclosed expressly and
sufficiently and the title of the Work and its authorship have been
acknowledged in this Work;
(4) I do not have any actual knowledge nor do I ought reasonably to know that the
making of this work constitutes an infringement of any copyright work;
(5) I hereby assign all and every rights in the copyright to this Work to the
University of Malaya (“UM”), who henceforth shall be owner of the copyright
in this Work and that any reproduction or use in any form or by any means
whatsoever is prohibited without the written consent of UM having been first
had and obtained;
(6) I am fully aware that if in the course of making this Work I have infringed any
copyright whether intentionally or otherwise, I may be subject to legal action
or any other action as may be determined by UM.
Candidate’s Signature Date:
Subscribed and solemnly declared before,
Witness’s Signature Date:
Name:
Designation:
iv
ABSTRACT
Methyl orange (MO) is one of the azo compounds that is present in the wastewater
mainly from the textile industry. MO is also capable of producing a secondary waste
product, which might become a major pollutant towards the environment and aquatic
organisms. With that in mind, research is focused to look into photodegradation methods
based on the advance oxidation process by Titanium Dioxide (TiO2) semiconductor,
which offers a more effective and highly selective degradation process at minimal
consumption of energy and costs. However, nanosized of TiO2 catalyst are limited by
factors such as dispersion, separation, and adsorption. In this study, Chitosan (Cs)
biopolymer is incorporated into TiO2 nanoparticles as a support and adsorption site,
forming an effective photocatalyst system. It is expected that the -OH and -NH2 functional
groups of Cs would act as active sites, creating excellent interfaces that would attract MO
molecules. Meanwhile, the porous structure of Cs helps adsorb the MO molecules. The
stability and separation ability of the Cs-TiO2 photocatalysts system improved as it is
further immobilized on the surface of the glass substrate. TiO2 was first synthesized using
the sol-gel method (TiO2(SY)), and its phase, particle size, morphology, band gap, and
chemical structure are analyzed and compared to that of TiO2-Commercial Degussa P25
(TiO2(DP25)). Then, TiO2 nanoparticles (both TiO2(SY) and TiO2(DP25)) were incorporated
with Cs solution before being immobilized on glass plates via the dip-coating technique.
The surface interactions and the band gap of Cs-TiO2/Glass photocatalyst was determined
using techniques such as FESEM+EDS, FTIR, and UV-DR analysis, respectively. The
photocatalytic activity of both photocatalysts (Cs-TiO2(DP25)/Glass and Cs-TiO2(SY)/Glass)
was demonstrated on the simulated MO solution (10 ppm) irradiated under UV-light (6
W, λ=312 nm and 365 nm). UV-Vis analysis was conducted to analyze the influence of
adsorption–photodegradation of MO using different photodegradation parameters. The
results reported that the anatase phase, with a particle size of less than 50 nm and
v
homogenous spherical features of TiO2, was successfully produced through the sol-gel
method. The Cs-TiO2/Glass photocatalyst exhibited excellent formation of coordinate
covalent bonding between Ti-O to Si-O, Ti-O-to-NH2, or Ti-O-to-OH groups. The
photocatalytic activities of TiO2 exhibited a promising increment with better adsorptions
under different photocatalytic conditions, including the concentration and pH of MO,
photocatalysts cycles and the weight ratio of the surface of the glass substrate. The
optimum photodegradation recorded for the Cs-TiO2/Glass for TiO2(SY) and TiO2(DP25)
reached 80%, with 10 ppm of MO concentration, at a normal pH and 1 hour of retention
time. Meanwhile, the optimum adsorption process that was recorded for that
photocatalyst is expected to exceed 70%. It was concluded that the combination of the
adsorption and catalytic photodegradation process from Cs-TiO2/Glass photocatalyst has
great potential for treating wastewater for other types of organic/inorganic pollutants.
vi
ABSTRAK
Methyl orange (MO) adalah salah satu sebatian azo yang menghasilkan sisa air
kumbahan daripada industri tekstil. MO menghasilkan bahan buangan sekunder yang
merupakan punca isu pencemaran air yang utama terhadap alam sekitar yang dan toksik
terhadap organisma akuatik. Dengan lebih teliti, para penyelidik berminat kepada kaedah
pemerosotaan cahaya berdasarkan kepada proses pengoksidaan oleh Titanium Dwioksida
(TiO2) semikonduktor yang dipercayai dapat menawarkan proses pemerosotan yang lebih
berkesan dan selektif dengan pengunaan tenaga dan kos yang minimum. Walau
bagaimanapun, terdapat kekangan berkaitan dengan pemangkin TiO2 yang bersaiz nano
dari segi penyebarannya, pemisahannya dan penjerapannya. Dalam kajian ini,
nanopartikel TiO2 telah disokong dengan bahan bio-polimer Chitosan (Cs) sebagai tapak
penjerapan. Dijangkakan bahawa, kumpulan berfungsi Cs iaitu OH dan NH2 telah
bertindak sebagai tapak aktif untuk interaksi yang lebih baik dengan molekul MO.
Sementara itu, struktur berliang Cs membantu pada penjerapan molekul MO yang lebih
berkesan. Kestabilan dan perpisahan keupayaan sistem ini bertambah baik kerana ia terus
bergerak ke permukaan substrat kaca. Pertama sekali TiO2 telah disintesis menggunakan
kaedah sol-gel (TiO2(SY)) mengikut analisa fasa, saiz zarah, morfologi, selar jalur dan
struktur kimia dan dibandingkan dengan TiO2-Komersial Degussa P25 (TiO2(DP25))
sewajarnya. Kemudian, nanopartikel TiO2 (kedua-dua TiO2(SY) dan TiO2(DP25)) telah
digabungkan dengan larutan Cs sebelum pegun di atas plat kaca melalui teknik
penyalutan celup. Interaksi permukaan dan selar jalur untuk pemangkin cahaya Cs-
TiO2/Kaca telah dianalisia melalui analisis FESEM+EDS, FTIR dan UV-DR, masing-
masing. Aktiviti pemangkinan cahaya bagi kedua-dua Cs-TiO2(DP25)/Kaca dan Cs-
TiO2(SY)/Kaca) diuji pada simulasi pemangkinan cahaya di bawah sinaran UV cahaya (6
W, λ = 312 nm dan 365 nm) terhadap larutan MO (10 ppm). Analisa UV-Vis telah
dilakukan untuk mengkaji kesan penjerapan-pemerosotaan terhadap MO dengan
vii
menggunakan parameter pemerosotan yang berbeza. Ia menunjukkan bahawa, fasa
anatase dengan saiz zarah kurang daripada 50nm telah berjaya menghasilkan TiO2 dengan
menggunakan kaedah sol-gel. Pemangkin cahaya Cs-TiO2/Kaca menunjukkan interaksi
yang baik dengan pembentukan ikatan kovalen koordinat antara Ti-O kepada Si-O, Ti-O-
kepada-NH2 atau Ti-O-kepada-OH groups. Aktiviti pemangkinan cahaya oleh TiO2
menunjukkan peningkatan memberangsangkan dengan penjerapan yang lebih baik pada
keadaan proses pemangkinan cahaya yang pelbagai termasuk kepekatan dan pH bagi
larutan MO, serta kitaran dan nisbah berat pemangkin cahaya pada permukaan substrat
kaca. Pemorosotan yang optimum ditunjukkan oleh kedua-dua pemangkin-cahaya Cs-
TiO2/Glass yang berbeza iaitu TiO2(SY) dan TiO2(DP25) yang telah digunakan boleh
memperolehi 80% dengan penggunaan kepekatan MO iaitu 10 ppm dengan pH biasa dan
1 jam masa tahanan. Sementara itu, proses penjerapan yang optimum telah dirakamkan
untuk pemangkin-cahaya tersebut dijangkakan melebihi 70%. Kesimpulannya bahawa,
gabungan proses penjerapan dan pemerosotaan cahaya yang diperolehi oleh pemangkin
cahaya pemangkin cahaya Cs-TiO2/Kaca mempunyai potensi yang tinggi untuk proses
rawatan sisa air yang lebih baik untuk lain-lain jenis bahan pencemar organik/bukan
organik.
viii
ACKNOWLEDGEMENTS
This thesis would not have possible without the efforts and support of people at the
Nanotechnology and Catalysis Research Centre (NANOCAT) and my surrounding
friends.
First of all, I would like to express my deepest gratitude to my supervisors Dr
Nurhidayatullaili Muhd Julkapli and Prof Sharifah Bee Abd Hamid for their source of
guidance, assistance and concern throughout my research project. Their wide knowledge
and valuable comments have provided a good basis for my project and thesis.
Furthermore, I would like to thank to their willingness to spend their valueless time and
help in guiding me through the whole project. I deeply express my thanks to them in
helping me in editing the contents and wording of this thesis.
Besides that, I would like to express a special thanks to all staffs in NANOCAT, faculty
of Physic and chemistry in University Malaya (UM), respectively for their continuous
guidance and assistance during all the samples preparation and testing. Most importantly,
I would like to greatly acknowledge my colleagues in UM and all my dearest friends in
NANOCAT. I deeply appreciated their precious ideas and support throughout the entire
study.
This research was supported by a grant from the Fundamental Research Grant Scheme
(FRGS), University Malaya Research Grant (UMRG) and Postgraduate Research Fund
(PPP) for the sources of funding through this study. I gratefully acknowledge UM for
financial supporting that helping me in this study and MyMaster scholarship from
Kementerian Pendidikan Malaysia (KPM). Lastly, I would like to take this opportunity
to express my deepest gratitude to my beloved parents, wife and all family members
through their encouragement and support me to continue studying.
ix
TABLE OF CONTENTS
Abstract ............................................................................................................................ iv
Abstrak ............................................................................................................................. vi
Acknowledgements ........................................................................................................ viii
Table of Contents ............................................................................................................. ix
List of Figures ................................................................................................................ xiv
List of Tables................................................................................................................. xvii
List of Symbols and Abbreviations ................................................................................ xix
List of Equations ............................................................................................................. xx
CHAPTER 1: INTRODUCTION .................................................................................. 1
1.1 Research background ............................................................................................... 1
1.2 Problem statement ................................................................................................... 2
1.3 Scope of present work ............................................................................................. 3
1.4 Objectives ................................................................................................................ 4
1.5 Organization of Thesis ............................................................................................. 5
CHAPTER 2: LITERATURE REVIEW ...................................................................... 6
2.1 Wastewater .............................................................................................................. 6
2.1.1 Impact synthetic dyes waste on human life and aquatic medium .............. 6
2.1.2 Pollutant: Synthetic dyes ............................................................................ 6
2.2 Wastewater treatment: Conventional method .......................................................... 7
2.2.1 Limitations on conventional wastewater treatment .................................... 8
2.3 Wastewater treatment: Photocatalysis system ....................................................... 10
2.3.1 Photocatalysis system: Introduction and principle ................................... 10
2.4 TiO2 photocatalysis system ................................................................................... 12
x
2.4.1 TiO2 photocatalysis system: Synthesis method and properties ................ 15
2.4.2 TiO2 photocatalysis system: Applications ................................................ 17
2.4.3 TiO2 photocatalysis system: Limitations .................................................. 17
2.4.3.1 Separation process ..................................................................... 18
2.4.3.2 Selectivity .................................................................................. 18
2.4.3.3 Dispersion .................................................................................. 18
2.5 TiO2 support photocatalysis system....................................................................... 19
2.5.1 Cs-TiO2 support photocatalysis system: Principle and advantages .......... 20
2.5.2 Cs-TiO2 support photocatalysis system: Synthesis method and
properties .................................................................................................. 21
2.5.3 Cs-TiO2 support photocatalysis system: Limitations ............................... 22
2.5.4 Cs-TiO2 support photocatalysis system: Applications ............................. 23
2.6 TiO2 immobilized substrate ................................................................................... 24
2.6.1 TiO2 immobilized glass substrate photocatalysis system: Principle and
advantages ................................................................................................ 26
2.6.2 TiO2 immobilized glass substrate photocatalysis system: Synthesis method
and properties ........................................................................................... 26
2.6.3 TiO2 immobilized glass substrate photocatalysis system: Limitations .... 27
2.7 Cs-TiO2 immobilized glass substrate: Theory & Hypothesis ................................ 28
2.8 Photocatalytic activities: Effect on photocatalytic conditions ............................... 29
2.8.1 pH of wastewater medium ........................................................................ 29
2.8.2 Concentration of pollutants ...................................................................... 30
2.8.3 Cycles of photocatalyst on glass substrate ............................................... 32
CHAPTER 3: MATERIALS AND METHODOLOGY ............................................ 33
3.1 Introduction............................................................................................................ 33
3.2 Materials/Chemicals .............................................................................................. 34
xi
3.3 Experimental Methods ........................................................................................... 35
3.3.1 Stage 1: Synthesis of TiO2 catalyst by sol-gel method ............................ 35
3.3.2 Stage 2: Synthesis of Cs-TiO2 catalyst via ex situ preparation ................ 36
3.3.3 Stage 3: Coating of TiO2 and Cs solution with glass substrate
(Cs-TiO2/Glass photocatalysts) ................................................................ 37
3.3.4 Stage 4: Characterization of the Cs-TiO2/Glass catalyst .......................... 38
3.3.4.1 Thermal Gravimetric Analyzer (TGA) ........................................ 38
3.3.4.1 X-ray diffraction (XRD) ............................................................ 39
3.3.4.2 Raman spectroscopy .................................................................. 39
3.3.4.3 Fourier Transform Infrared Spectroscopy (FTIR) .................... 40
3.3.4.4 UV-Vis Diffuse Reflectance Spectroscopy (UV-DR) .............. 41
3.3.4.5 High Resolution Transmission Electron Microscope
(HR-TEM) ................................................................................. 42
3.3.4.6 Field Emission Scanning Electron Microscopy (FESEM) +
Energy Dispersive Spectrometer (EDS) .................................... 42
3.3.5 Stage 5: Photocatalytic activity of catalyst ............................................... 43
CHAPTER 4: RESULTS AND DISCUSSION .......................................................... 45
4.1 Characterization on TiO2(SY) and TiO2(DP25) .......................................................... 45
4.1.1 As-synthesized sample of TiO2 nanoparticles using Thermal Gravimetric
Analyzer Analysis .................................................................................... 45
4.1.2 X-Ray Diffraction Analysis ...................................................................... 46
4.1.3 Raman Spectroscopy Analysis ................................................................. 49
4.1.4 Fourier Transform Infra-Red Analysis ..................................................... 51
4.1.5 UV-Vis-Diffusive Reflectance Analysis .................................................. 53
4.1.6 High Resolution-Transmission Electron Microscopy Analysis ............... 54
xii
4.1.7 Field Emission Scanning Electron Microscopy + Energy Dispersive
Spectrometer Analysis .............................................................................. 58
4.2 Result for Cs-TiO2(SY)/Glass and Cs-TiO2(DP25)/Glass ........................................... 60
4.2.1 Fourier Transform Infra-Red Analysis ..................................................... 60
4.2.2 UV-Vis-Diffusive Reflectance Analysis .................................................. 64
4.2.3 Field Emission Scanning Electron Microscopy and Energy Dispersive
Spectrometer Analysis .............................................................................. 69
4.3 Result for Photocatalytic activity of adsorption-photodegradation MO................ 77
4.3.1 MO Calibration ......................................................................................... 77
4.3.2 Adsorption and photodegradation analysis .............................................. 78
4.3.2.1 Effect of photocatalyst cycles on glass substrate ...................... 78
4.3.2.2 Effect of Photocatalyst (Chitosan to TiO2) weight ratio ........... 83
4.3.2.3 Effect of initial concentration on adsorption and
photodegradation activities ....................................................... 86
4.3.2.4 Effect of initial pH on adsorption and photodegradation
activities .................................................................................... 90
4.3.2.5 Adsorption analysis ................................................................... 94
CHAPTER 5: CONCLUSION ..................................................................................... 98
5.1 Conclusion ............................................................................................................. 98
5.2 Future work .......................................................................................................... 100
References ..................................................................................................................... 102
List of Publications and Papers Presented .................................................................... 112
7.1 Journals publication ............................................................................................. 112
7.1.1 Inorganic Review ................................................................................... 112
7.1.2 International Journal of Environmental Science and Technology ......... 113
7.2 Proceeding Papers ................................................................................................ 114

xiii
7.2.1 18 Malaysian International Chemical Congress ..................................... 114
7.2.2 4th International Scientific Conference on Applied Sciences and
Engineering ............................................................................................ 115
xiv
LIST OF FIGURES
Figure 2.1: Main processes in semiconductor photocatalysis. (i) Photon absorption and
electron–hole pair generation. (ii) Charge separation and migration; (ii) a to surface
reaction sites (ii) b to recombination sites. (iii) Surface chemical reaction at active sites.
Adapted from “Carbonaceous nanomaterials for the enhancement of TiO2
photocatalysis,” by Leary and Westwood (2011). Copyright 2010 by the Elsevier Ltd 13
Figure 2.2: TiO2 sol-gel method process ........................................................................ 15
Figure 2.3: Photocatalytic activity of Cs-TiO2 photocatalyst to dye/MO degradation ... 21
Figure 2.4: Ex situ synthesis schemes for the preparation of nanocomposites. Adapted
from “Comparison of in situ and ex situ Methods for Synthesis of Two-Photon
Polymerization Polymer Nanocomposites,” by Guo et al. (2014). Copyright 2014 by the
authors ............................................................................................................................. 22
Figure 2.5: Mechanism of Cs together with TiO2 ........................................................... 28
Figure 3.1: Schematic diagram on preparation of Cs-TiO2 solution ............................... 36
Figure 3.2: Schematic diagram on preparation of Cs-TiO2/Glass catalyst via the dip
coating method ................................................................................................................ 37
Figure 3.3: The apparatus set up for photodegradation process ..................................... 44
Figure 4.1: The result on TGA (for as-synthesized TiO2(SY) prepared
with sol-gel method) ....................................................................................................... 45
Figure 4.2: The XRD diffraction patterns of TiO2(SY) and TiO2(DP25) .............................. 47
Figure 4.3: The Raman diffraction patterns of TiO2(SY) and TiO2(DP25) ........................... 49
Figure 4.4: FTIR spectra of TiO2(SY) and TiO2(DP25) ........................................................ 51
Figure 4.5: UV-DR spectra of TiO2 nanoparticles which are TiO2(SY) and TiO2(DP25) ..... 53
Figure 4.6: HR-TEM micrographs for both TiO2 of (a) TiO2(SY) and (b) TiO2(DP25))
photocatalysts with magnification of 60,000x ................................................................ 55
Figure 4.7: PSD of TiO2(SY) (Green) and TiO2(DP25) (Red) with inset at 60,000x
magnification................................................................................................................... 56
Figure 4.8: The structure of the octahedrally coordinated of anatase TiO2. Cyan and red
spheres are representing Ti and O atoms, respectively. .................................................. 57
xv
Figure 4.9: FESEM micrographs with magnification of 60,000x include with EDS figures
and tables of TiO2(SY) and TiO2(DP25) photocatalysts, respectively .................................. 58
Figure 4.10: FTIR spectra of different dip-coated cycles for Cs-TiO2/Glass photocatalyst
which are 2, 4, 6 and 8 Cycles by comparing between Cs-TiO2(SY)/Glass with Cs-
TiO2(DP25)/Glass ............................................................................................................... 61
Figure 4.11: FTIR spectra of different weight ratio for Cs-TiO2/Glass photocatalyst by
comparing between Cs-TiO2(SY)/Glass with Cs-TiO2(DP25)/Glass ................................... 63
Figure 4.12: UV-DR spectra of different dip-coated cycles for Cs-TiO2/Glass
photocatalyst which are 2, 4, 6 and 8 Cycles by comparing between Cs-TiO2(SY)/Glass
with Cs-TiO2(DP25)/Glass ................................................................................................. 65
Figure 4.13: UV-DR spectra of different weight ratio for Cs-TiO2/Glass photocatalyst by
comparing between Cs-TiO2(SY)/Glass with Cs-TiO2(DP25)/Glass ................................... 66
Figure 4.14: List of UV-DR spectra together with different dip-coated cycles and weight
ratio for Cs-TiO2/Glass photocatalyst by comparing between TiO2 (TiO2(SY) and
TiO2(DP25)), Cs-TiO2(SY)/Glass and Cs-TiO2(DP25)/Glass .................................................. 68
Figure 4.15(a): FESEM micrographs of dip-coated cycles a) 2 cycles b) 4 cycles c) 6
cycles d) 8 cycles for Cs-TiO2(SY)/Glass photocatalyst with magnification of 50,000x
include with EDS figures and tables ............................................................................... 70
Figure 4.15(b): FESEM micrographs of dip-coated cycles a) 2 cycles b) 4 cycles c) 6
cycles d) 8 cycles for Cs-TiO2(DP25)/Glass photocatalyst with magnification of 50,000x
include with EDS figures and tables ............................................................................. 701
Figure 4.16(a): FESEM micrographs of weight ratio a) 2E1 b) 2E2 c) 2E3 d) 2E4) for Cs-
TiO2(SY)/Glass photocatalyst with magnification of 50,000x include with EDS figures and
tables ............................................................................................................................... 74
Figure 4.16(b): FESEM micrographs of weight ratio a) 2D1 b) 2D2 c) 2D3 d) 2D4) for
Cs-TiO2(DP25)/Glass photocatalyst with magnification of 50,000x include with EDS
figures and tables........................................................................................................... 745
Figure 4.17: Calibration plot of MO with concentration ranging from 1–20 ppm ......... 77
Figure 4.18(a): The adsorption and photodegradation of (i) Cs-TiO2(DP25)/Glass and (ii)
Cs-TiO2(SY)/Glass photocatalysts with different cycles .................................................. 79
Figure 4.18(b): Summary on adsorption and photodegradation of Cs-TiO2/Glass
photocatalyst at different number of cycles .................................................................... 80
Figure 4.19: Interaction of MO adsorption on Cs ........................................................... 82
xvi
Figure 4.20(a): The adsorption and photodegradation of (i) Cs-TiO2(DP25)/Glass and (ii)
Cs-TiO2(SY)/Glass photocatalysts with different weight ratio ......................................... 84
Figure 4.20(b): Summary on adsorption and photodegradation of Cs-TiO2/Glass
photocatalyst at different number of weight ratio ......................................................... 845
Figure 4.21(a): The adsorption and photodegradation of (i) 2D3-Cs-TiO2(DP25)/Glass and
(ii) 2E2-Cs-TiO2(SY)/Glass photocatalysts with different initial concentration ............. 877
Figure 4.21(b): Summary on adsorption and photodegradation of Cs-TiO2/Glass
photocatalyst at different number of initial concentration ............................................ 878
Figure 4.22(a): The adsorption and photodegradation of (i) 2D3-Cs-TiO2(DP25)/Glass and
(ii) 2E2-Cs-TiO2(SY)/Glass photocatalysts with different initial pH ................................ 91
Figure 4.22(b): Summary on adsorption and photodegradation of Cs-TiO2/Glass
photocatalyst at different number of initial pH ............................................................. 912
Figure 4.23: FTIR spectra of optimize Cs-TiO2/Glass photocatalyst related with highest
MO parameters by comparing between Cs-TiO2(SY)/Glass with Cs-TiO2(DP25)/Glass .... 96
xvii
LIST OF TABLES
Table 2.1: List of technologies for conventional wastewater treatment ........................... 7
Table 2.2: Advantages of facilities for conventional wastewater
treatment (USEPA, 1998) ................................................................................................. 8
Table 2.3: Limitations of Conventional Wastewater Treatment Technologies ................ 9
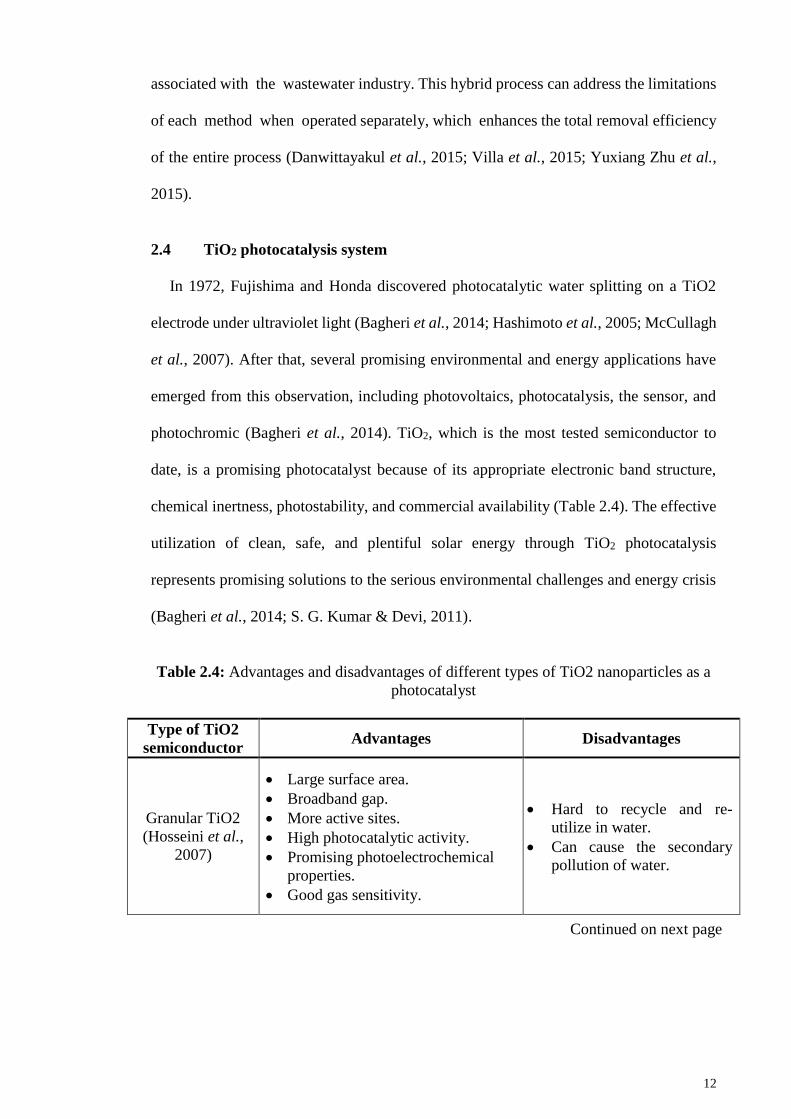
Table 2.4: Advantages and disadvantages of different types of TiO2 nanoparticles as a
photocatalyst ................................................................................................................... 12
Table 2.5: The attributes between TiO2 photocatalyst (photocatalysis process) as
compared to conventional wastewater treatment (J. Kumar & Bansal, 2013) ................ 14
Table 2.6: Advantages and disadvantages of sol-gel method in production of TiO2
nanoparticles ................................................................................................................... 16
Table 2.7: List of TiO2 with support material in photocatalysis system to stimulate
photodegradation process towards different pollutants................................................... 19
Table 2.8: List of TiO2 support with Cs that used for the photocatalysis system .......... 23
Table 2.9: List of TiO2 immobilized substrate system that used for the photocatalysis
system .............................................................................................................................. 25
Table 2.10: List of different photocatalysts used for the photodegradation process with
different MO concentrations (effect of initial concentrations) ....................................... 31
Table 3.1: List of raw materials and chemicals used to fabricate TiO2 nanoparticles and
Cs-TiO2/Glass photocatalysts as well as model pollutant MO used for photocatalytic
activity ............................................................................................................................. 34
Table 4.1: Crystallite size and phase composition of TiO2(SY) and TiO2(DP25) that compare
with previous literature, accordingly............................................................................... 47
Table 4.2: Raman peaks of TiO2(SY) and TiO2(DP25) that compare with previous
literature .......................................................................................................................... 49
Table 4.3: FTIR peaks of TiO2 for both TiO2(SY) and TiO2(DP25) compared with previous
literature .......................................................................................................................... 52
Table 4.4: Band gap energy (eV) of TiO2 nanoparticles for both TiO2(SY) and TiO2(DP25)
which has been compare between previous literature parameters .................................. 54
Table 4.5: Particle size and shape of TiO2(SY) and TiO2(DP25) ......................................... 56

xviii
Table 4.6: EDS photocatalysts of Cs-TiO2(SY)/Glass and Cs-TiO2(DP25)/Glass that are
relatively to cycles formation .......................................................................................... 72
Table 4.7: EDS photocatalysts of Cs-TiO2(SY)/Glass and Cs-TiO2(DP25)/Glass
photocatalysts that are relatively to weight ratio formation ............................................ 76
xix
LIST OF SYMBOLS AND ABBREVIATIONS
Cb : Conduction band
Cs : Chitosan
e- : Electron
DR : Diffusive Reflectance
EDS : Energy Dispersive Spectrometer
FTIR : Fourier Transform Infra-Red Analysis
FESEM : Field Emission Scanning Electron Microscopy
g : Gram
HR : High Resolution
h+ : Positive hole
hv : Energy (photon)
L : Liter
mL : Milliliter
MO : Methyl orange
ppm : Part per million
PVC : Polyvinyl Chloride
TEM : Transmission Electron Microscopy
TGA : Thermal Gravimetric Analyzer
TiO2(DP25) : TiO2 – Commercial Degussa P25
TiO2(SY) : TiO2 – Synthesis via sol-gel
UV : Ultraviolet
UV-Vis : Ultraviolet/visible
µm : Micrometer
Vb : Valence band
XRD : X-ray Diffraction

xx
LIST OF EQUATIONS
Equation 3.1: Scherrer equation……………...………………………………….. 39
Equation 3.2: Kubelka-Munk function……………...…………………………… 41
Equation 3.3: Energy of Wave (Planck relation) ……………...………………… 41
Equation 3.4: Percentage of adsorption photodegradation……………...……….. 44
1
CHAPTER 1: INTRODUCTION
1.1 Research background
It has been verified that many aromatic compounds derived from synthetic dyes could
be successfully degraded and effectively mineralization to end products, which are CO2,
H2O, and nutrient acids (Kijima, 2010). Various environmental applications to remove
synthetic dyes in water and air have been utilized using the photocatalytic properties of
Titanium Dioxide (TiO2) nanoparticles, which is a very well-known semiconductor, used
as a photocatalyst, due to the stability of its chemical structure, biocompatibility, and
physical, optical, and electrical properties (Kijima, 2010). Furthermore, it was reported
that dyes, metal ions, organic acids, and pesticide effectively possess the ability to adsorb
Chitosan (Cs), due to its high adsorption potentials (Benavente, 2008; Zainal et al., 2009).
A variety of useful features of Cs make it a versatile adsorbent, which is evident in the
electrostatic attraction between the –NH2 functional groups and the solutes, both of which
are capable of generating the adsorption of organic substrates by Cs (Benavente, 2008).
The chelating groups (–NH2 and –OH groups assist as coordination and reaction sites,
respectively) on the Cs is attributed to the binding ability of Cs for synthetic dyes (Zainal
et al., 2009), while the adsorption process that is simply mediated by Cs is amongst the
most successful technique that were effectively used against inorganic, organic, and
heavy metal pollutants from polluted water bodies. The combined effects of Cs and TiO2
were known as adsorption–photodegradation that are coated on a glass substrate (Cs–
TiO2/Glass), demonstrate an improvement when used to treat or pre-treat dye-containing
wastewater under visible light. The immobilization of Cs-TiO2 photocatalyst on a glass
substrate also assist in the separation upon the photocatalysis process.
In this study, reactive TiO2 (using TiO2(SY) and TiO2(DP25)) was coated or incorporated
into Cs on the smooth surface of the glass substrate (separately using that different TiO2).
It is expected that this would be incredibly useful in the investigation of the mixed effect
2
of adsorption–photodegradation, mediated by Cs–TiO2 photocatalyst (both Cs-TiO2(SY)
and Cs-TiO2(DP25) photocatalysts are known for this study). The actual photocatalytic
degradation process, which makes use of TiO2, has been shown to be extremely successful
in degrading MO, which is representative of synthetic dye compounds. Furthermore, the
presence of Cs was acknowledged to have a very encouraging effect on the adsorption
capability of the TiO2 nanoparticles. Therefore, it was expected that both TiO2 and Cs
respective advantages are compatible upon the glass substrate, resulting in a diverse
approach in dealing with several wastewater pollutants, especially for the synthetic dyes.
Glass substrates demonstrated distinctive advantage as a photocatalyst support, such as
retaining transparency even after the immobilization of the photocatalyst, which allows
for the penetration of light, improving its photocatalytic activities. A byproduct of this
approach is that the photocatalyst will gain large surface areas. Other benefits of a glass
substrate include superior adsorption properties, higher surface area, and increased
surface or reduced charge recombination.
1.2 Problem statement
Environmental pollution is one of the major and most urgent problems of the modern
world. Industries are the greatest polluters, with the textile industry generating high liquid
effluent pollutants, due to the large quantities of water being used in fabric processing
(Pereira & Alves, 2012). Dyes are an important class of synthetic organic compounds
used in many industries, especially textiles. Consequently, they have become common
industrial environmental pollutants during synthesis, and later during fiber dyeing
(Chequer et al., 2013). The textile industry is facing a challenge in the field of quality and
productivity, due to a globalized market. As the highly competitive atmosphere and the
ecological parameters become more stringent, the prime concern of textile manufacturers
is to be aware of the quality of their products and the effect of the manufacturing process
on the environmental (Pereira & Alves, 2012).
3
The contamination of water stream from industrial wastes containing some hazardous
organic compounds, even at low concentrations, have become a global concern and
subsequently, a potential health hazard. The remediation of the contaminant is
challenging, due to its unique chemical and physical characteristics. To this,
photocatalytic oxidation has been proposed as one of the most effective techniques to
treat the hazardous and toxic organic pollutants from water, using semiconductors as
photocatalysts (Faramarzpour et al., 2009). This system has shown promising results, and
is more environmental friendly, cost effective, and utilizes either UV-light from sunlight.
Therefore, the potential of using the photocatalysis technique as an alternative to degrade
harmful organic pollutants should be looked into.
Studies by Fujishima (1972) discussed the discovery of water photoelectrolysis on
TiO2 with corresponding exceptional chemical and physical properties. To date,
electrochemical oxidation reaction of a Ti substrate under a specific set of environment
conditions have been widely reported by many researchers. However, TiO2 are still far
from becoming a potential candidate for a photocatalytic system. Bundling problems and
weak adherence, due to the multi-phase Ti substrate, remains a great concern. In addition,
poor visible light absorption and the rapid recombination of charge carriers limit its
applicability. Thus, realizing a high efficiency in a photocatalytic system using TiO2 as a
photocatalyst is a complex undertaking, unless several related issues are resolved.
1.3 Scope of present work
The TiO2 was synthesized via the sol-gel method (TiO2(SY)) and the commercialized
one (TiO2(DP25)) was then duly compared to the synthesized sample. The band gap energy,
chemical bonding, and phase and structure property of TiO2 nanoparticles (both TiO2(SY)
and TiO2(DP25)) were characterized using FESEM+EDS, HR-TEM, XRD, Raman and
FTIR, and UV-DR analysis. Both TiO2(SY) and TiO2(DP25) nanoparticles were used as an
4
indicator for the preparation coated Cs on the glass substrate, called Cs-TiO2/Glass
photocatalyst. Subsequently, the photocatalyst was characterized using FESEM+EDS,
FTIR, and UV-DR analysis. Later, the Cs-TiO2/Glass phototcatalyst were tested in the
UV-induced (λ=365 nm) degradation system of MO solution, and the data obtained from
the UV-Vis Spectrophotometer were analyzed for its corresponding photocatalytic
activity. The processes involved in the adsorption-photodegradation of MO was
conducted at room temperature and pressure. The effect of certain parameters, such as the
initial concentrations and pH of the MO model pollutant sample solution. Include, the
cycles structure on the glass substrate, and the weight ratio used between Cs and TiO2 to
prepare these photocatalysts were also studied. In the final stage, the final sample of
photocatalysts with the MO pollutant was obtained post-photocatalytic activity and
analyzed for its adsorption.
1.4 Objectives
The objectives of this study are:-
1. To synthesis and study the surface, physical and morphological characteristic of
anatase TiO2 nanoparticles.
2. To fabricate via dip-coating method and characterize based on functional group
analysis, morphological with elemental analysis and band gap energy of both Cs-
TiO2(SY)/Glass and Cs-TiO2(DP25)/Glass photocatalysts.
3. To study the photocatalytic of Cs-TiO2/Glass towards monoazo dye (MO) by the
process of adsorption and photodegradation.
5
1.5 Organization of Thesis
This thesis has been structured into 5 respective chapters.
Chapter 1- Present a general review of the project including the problem statement,
research motivation and objectives of the study.
Chapter 2- Highlight on the literature review and research background of the wastewater
treatment technology, photocatalysis of synthetic dyes remediation, TiO2
photocatalysis and Cs system, and photocatalytic of Cs-TiO2 at different
wastewater treatments conditions.
Chapter 3- Described on the synthesis of TiO2 and its characterization followed by
preparation of Cs-TiO2/Glass photocatalyst and the application of these
photocatalyst towards MO degradation.
Chapter 4- Presented and discussed on the characterization of synthesized TiO2,
properties of Cs-TiO2 into glass substrate and photocatalytic activities of Cs-
TiO2/Glass starting with photocatalysts optimization that are cycles and
weight ratio and further analysis at initial concentration and different pH
medium used of model pollutant used which is MO.
Chapter 5- Summarizes the overall conclusions and recommendation for future research
proposal of this study.
6
CHAPTER 2: LITERATURE REVIEW
2.1 Wastewater
Water pollution from domestic and industrial sectors continue to be critical towards
environmental problems (H. Liu et al., 2004). Therefore, an effective wastewater
treatment is required to deal with the disposal of human and industrial effluents without
being hazardous to human health or the environment.
The amount of wastewater generated domestically and the industry in developed
countries require slightly advance treatments (Gray, 2004). One of the major sources of
aquatic pollution from the toxic effluents is the result of wastewater damaging untreated
received waters (Ngadi et al., 2014).
2.1.1 Impact synthetic dyes waste on human life and aquatic medium
One of man-made pollutants that are toxic, carcinogenic, and mutagenic to human life
are pollutants containing dyes (Harruddin et al., 2015). The usage of dyes is estimated to
be approximately 40% of the global population, which presents a carcinogenic effect
containing bounded chlorine. The dye components become more dangerous when
released into surface waters, such as rivers, seas, or reservoirs. The problems become
more significant, as the synthesized dyes are mostly stable against the biological,
photochemical, and degradation process.
2.1.2 Pollutant: Synthetic dyes
The azo reactive dye, which includes (–N=N–) groups, are associated with a
substituted aromatic structure of sp2 hybridized C-atoms, also known as Methyl Orange
(MO). The azo groups are mostly bound to benzene or naphthalene rings, aromatic
heterocyclic, or enolizable aliphatic groups. MO is commonly used as an anionic
monoazo dye in laboratory assays and textiles (Zainal et al., 2009). Moreover, MO is
difficult to remove, due to its stability against light, heat, and oxidizing agents. The
7
presence of ionizing groups, known as auxochromes, results in a much stronger alteration
of the maximum absorption of the compound, and provides a bonding affinity.
Legislations have been enacted for the discharge of MO, which consequently makes it
necessary to develop several efficient technologies for the removal of MO from
wastewater (H. Liu et al., 2004).
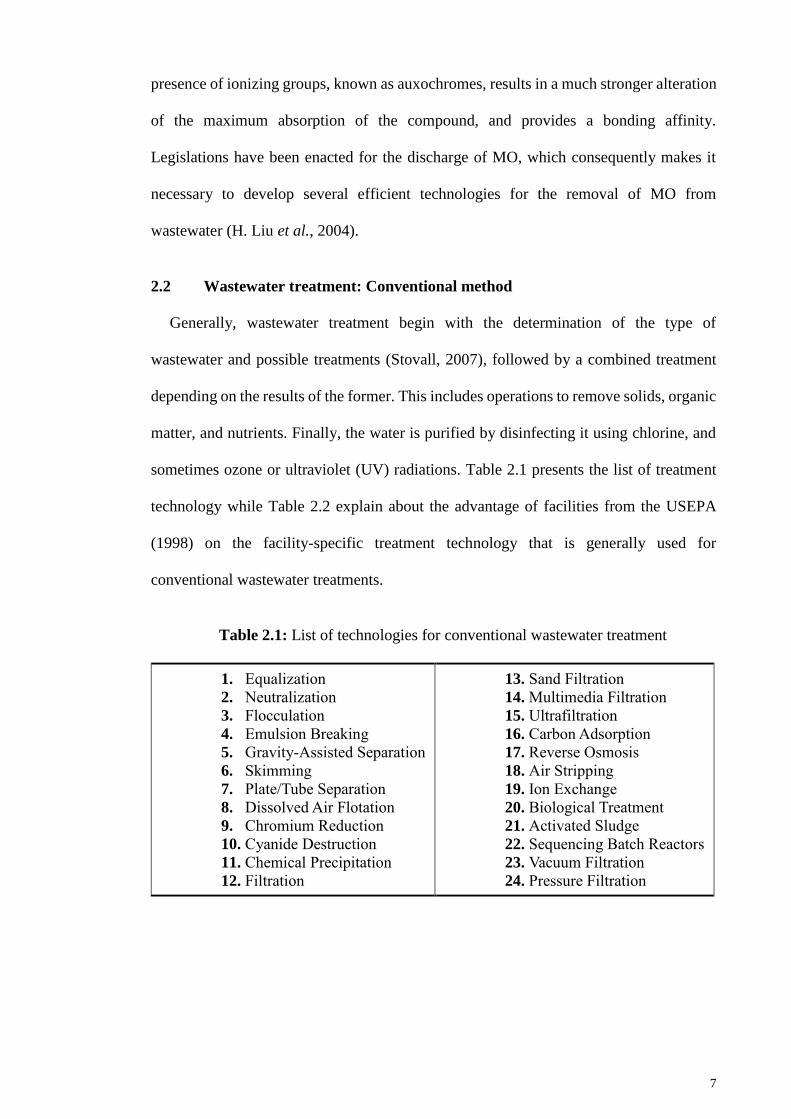
2.2 Wastewater treatment: Conventional method
Generally, wastewater treatment begin with the determination of the type of
wastewater and possible treatments (Stovall, 2007), followed by a combined treatment
depending on the results of the former. This includes operations to remove solids, organic
matter, and nutrients. Finally, the water is purified by disinfecting it using chlorine, and
sometimes ozone or ultraviolet (UV) radiations. Table 2.1 presents the list of treatment
technology while Table 2.2 explain about the advantage of facilities from the USEPA
(1998) on the facility-specific treatment technology that is generally used for
conventional wastewater treatments.
Table 2.1: List of technologies for conventional wastewater treatment
1. Equalization
2. Neutralization
3. Flocculation
4. Emulsion Breaking
5. Gravity-Assisted Separation
6. Skimming
7. Plate/Tube Separation
8. Dissolved Air Flotation
9. Chromium Reduction
10. Cyanide Destruction
11. Chemical Precipitation
12. Filtration
13. Sand Filtration
14. Multimedia Filtration
15. Ultrafiltration
16. Carbon Adsorption
17. Reverse Osmosis
18. Air Stripping
19. Ion Exchange
20. Biological Treatment
21. Activated Sludge
22. Sequencing Batch Reactors
23. Vacuum Filtration
24. Pressure Filtration
8
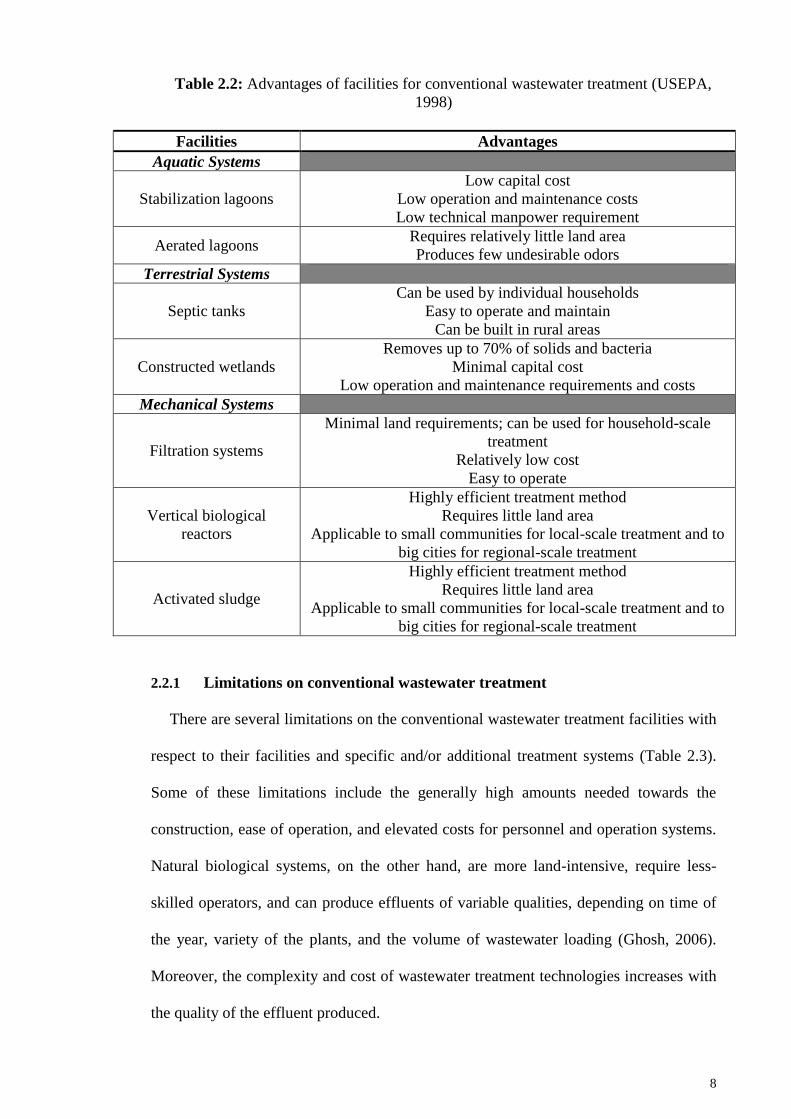
Table 2.2: Advantages of facilities for conventional wastewater treatment (USEPA,
1998)
Facilities Advantages
Aquatic Systems
Stabilization lagoons
Low capital cost
Low operation and maintenance costs
Low technical manpower requirement
Aerated lagoons Requires relatively little land area
Produces few undesirable odors
Terrestrial Systems
Septic tanks
Can be used by individual households
Easy to operate and maintain
Can be built in rural areas
Constructed wetlands
Removes up to 70% of solids and bacteria
Minimal capital cost
Low operation and maintenance requirements and costs
Mechanical Systems
Filtration systems
Minimal land requirements; can be used for household-scale
treatment
Relatively low cost
Easy to operate
Vertical biological
reactors
Highly efficient treatment method
Requires little land area
Applicable to small communities for local-scale treatment and to
big cities for regional-scale treatment
Activated sludge
Highly efficient treatment method
Requires little land area
Applicable to small communities for local-scale treatment and to
big cities for regional-scale treatment
2.2.1 Limitations on conventional wastewater treatment
There are several limitations on the conventional wastewater treatment facilities with
respect to their facilities and specific and/or additional treatment systems (Table 2.3).
Some of these limitations include the generally high amounts needed towards the
construction, ease of operation, and elevated costs for personnel and operation systems.
Natural biological systems, on the other hand, are more land-intensive, require less-
skilled operators, and can produce effluents of variable qualities, depending on time of
the year, variety of the plants, and the volume of wastewater loading (Ghosh, 2006).
Moreover, the complexity and cost of wastewater treatment technologies increases with
the quality of the effluent produced.
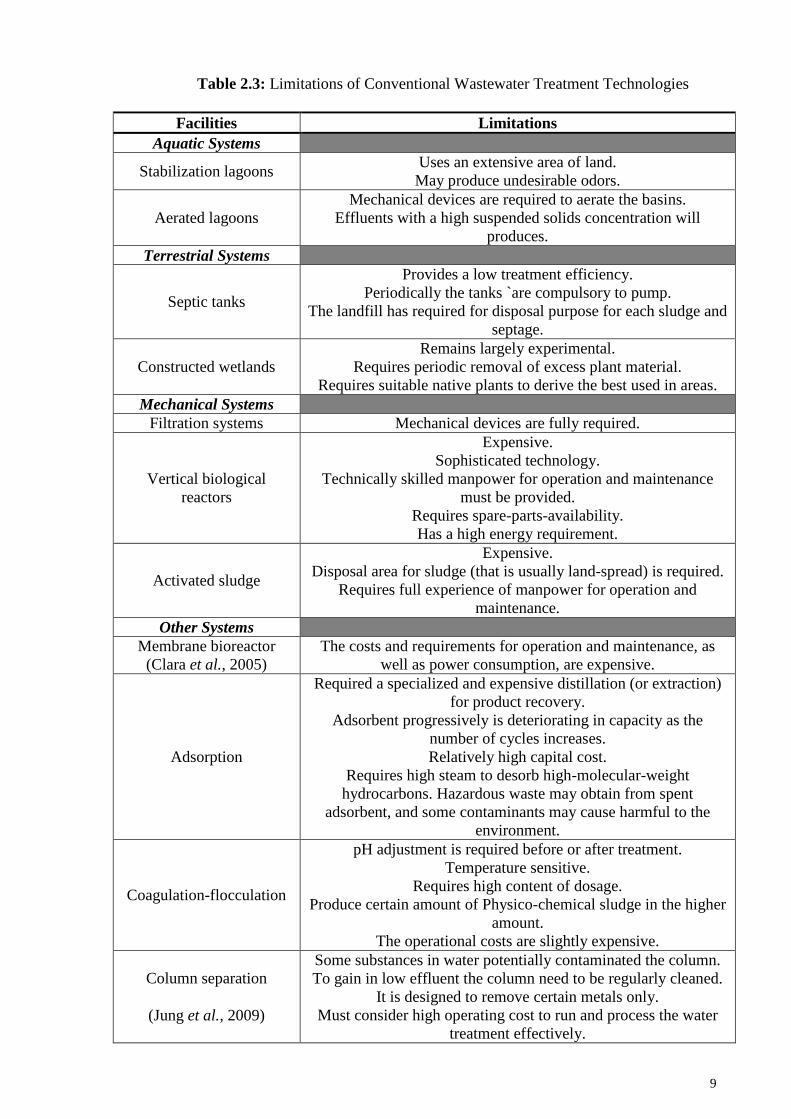
9
Table 2.3: Limitations of Conventional Wastewater Treatment Technologies
Facilities Limitations
Aquatic Systems
Stabilization lagoons Uses an extensive area of land.
May produce undesirable odors.
Aerated lagoons
Mechanical devices are required to aerate the basins.
Effluents with a high suspended solids concentration will
produces.
Terrestrial Systems
Septic tanks
Provides a low treatment efficiency.
Periodically the tanks `are compulsory to pump.
The landfill has required for disposal purpose for each sludge and
septage.
Constructed wetlands
Remains largely experimental.
Requires periodic removal of excess plant material.
Requires suitable native plants to derive the best used in areas.
Mechanical Systems
Filtration systems Mechanical devices are fully required.
Vertical biological
reactors
Expensive.
Sophisticated technology.
Technically skilled manpower for operation and maintenance
must be provided.
Requires spare-parts-availability.
Has a high energy requirement.
Activated sludge
Expensive.
Disposal area for sludge (that is usually land-spread) is required.
Requires full experience of manpower for operation and
maintenance.
Other Systems
Membrane bioreactor (Clara et al., 2005)
The costs and requirements for operation and maintenance, as
well as power consumption, are expensive.
Adsorption
Required a specialized and expensive distillation (or extraction)
for product recovery.
Adsorbent progressively is deteriorating in capacity as the
number of cycles increases.
Relatively high capital cost.
Requires high steam to desorb high-molecular-weight
hydrocarbons. Hazardous waste may obtain from spent
adsorbent, and some contaminants may cause harmful to the
environment.
Coagulation-flocculation
pH adjustment is required before or after treatment.
Temperature sensitive.
Requires high content of dosage.
Produce certain amount of Physico-chemical sludge in the higher
amount.
The operational costs are slightly expensive.
Column separation
(Jung et al., 2009)
Some substances in water potentially contaminated the column.
To gain in low effluent the column need to be regularly cleaned.
It is designed to remove certain metals only.
Must consider high operating cost to run and process the water
treatment effectively.
10
2.3 Wastewater treatment: Photocatalysis system
Heterogeneous catalysis is one of the most common environmental clean-up
techniques used in wastewater treatment. Most of the photodegradation processes are
used for municipal wastewater, cosmetics and pharmaceutical wastewaters, gray water
and paper mill wastewater (Lazar et al., 2012). The photocatalysis process is regarded as
an eco-friendly approach, mainly because it lacks chemical inputs or outputs, with no
sludge residue being generated (Bagheri, Muhd Julkapli, et al., 2015). Simultaneously,
a similar technique is also capable of treating wastewater contaminated by the textile
industry and organic/synthetic dyes.
Nanosized photocatalyst are touted for many potential applications in purifying
polluted water. The photocatalysis oxidation process is a potential replacement for
physical and biological techniques, as it can be carried out under ambient conditions
employing atmospheric oxygen as its oxidant, resulting in the total mineralization of the
contaminants to CO2, mineral acids, or water.
2.3.1 Photocatalysis system: Introduction and principle
Recently, photocatalysis are attracting increased interest because of its chemical
stability, recyclability, low costs, and non-toxic processing routes (Bagheri, Hir, et
al., 2015; Bagheri, Muhd Julkapli, et al., 2015; Muhd Julkapli et al., 2014). Photocatalysis
is a catalytic reaction (oxidation/reduction) that produces a catalyst via the absorption of
either UV light or visible irradiation. The process is initiated with the appropriate
positioning of the valence band (VB) and conduction band (CB) of semiconductors
materials (Lazar et al., 2012).
A sensitized photoreaction is representative of a photocatalysis system; where the light
(photo) adsorbed by the catalyst takes place through energy transfer via the formation of
an activated state of the reactant of interest, which is more easily oxidized than their
11
corresponding ground state, or electron transfer by acting either as an electron acceptor
or donor (Castellote & Bengtsson, 2011). In order to encounter an oxidizer/acceptor
molecule and a reducer/donor molecule for photocatalysis, the photoelectron and
photohole have to reach the surface simultaneously.
The combination between the relevant processes of interest, with high efficiency solar
energy conversion, can generate increased activity that would be ideal for photocatalytic
semiconductors. Moreover, the semiconductor should be non-toxic, biologically and
chemically inert, and stable over long periods, easily processable and readily available
(Leary & Westwood, 2011). Indeed, an even more advanced photocatalytic treatment
technique provides substantial environmental remediation prospects, including water
decontamination and purification, deodorization of air, and others (Bagheri, Hir, et al.,
2015; Bagheri et al., 2012). During the photocatalyst process, the semiconductor
material absorbs the introduced light and promotes the electron from the VB to the CB.
Once they reach excitation, the produced electron- hole pair induces the redox reaction,
which will photocatalytically degrade organic contaminants (Bagheri, Mohd Hir, et al.,
2015; Bagheri, Muhd Julkapli, et al., 2015; Bagheri et al., 2012; Muhd Julkapli et al.,
2014).
One of the drawbacks of using the photocatalysis system is the presence of organic
materials within the system (X. Chen et al., 2015; Pu et al., 2015; J. WANG et al., 2015).
Exces- sive suspended material loading results in light scattering, which reduces the
photocatalytic performance of the process (Muhd Julkapli et al., 2014; Pu et al., 2015).
Therefore, the integration of the photocatalysis procedure with a physicochemical
treatment process, which includes adsorption and coagulation as its pretreatment stages,
is regarded as nec- essary for an effective industrial process (H.-Y. Jiang et al., 2015).
The integration of adsorption and photocatalytic treatment mitigates many problems
12
Continued on next page
associated with the wastewater industry. This hybrid process can address the limitations
of each method when operated separately, which enhances the total removal efficiency
of the entire process (Danwittayakul et al., 2015; Villa et al., 2015; Yuxiang Zhu et al.,
2015).
2.4 TiO2 photocatalysis system
In 1972, Fujishima and Honda discovered photocatalytic water splitting on a TiO2
electrode under ultraviolet light (Bagheri et al., 2014; Hashimoto et al., 2005; McCullagh
et al., 2007). After that, several promising environmental and energy applications have
emerged from this observation, including photovoltaics, photocatalysis, the sensor, and
photochromic (Bagheri et al., 2014). TiO2, which is the most tested semiconductor to
date, is a promising photocatalyst because of its appropriate electronic band structure,
chemical inertness, photostability, and commercial availability (Table 2.4). The effective
utilization of clean, safe, and plentiful solar energy through TiO2 photocatalysis
represents promising solutions to the serious environmental challenges and energy crisis
(Bagheri et al., 2014; S. G. Kumar & Devi, 2011).
Table 2.4: Advantages and disadvantages of different types of TiO2 nanoparticles as a
photocatalyst
Type of TiO2
semiconductor Advantages Disadvantages
Granular TiO2
(Hosseini et al.,
2007)
Large surface area.
Broadband gap.
More active sites.
High photocatalytic activity.
Promising photoelectrochemical
properties.
Good gas sensitivity.
Hard to recycle and re-
utilize in water.
Can cause the secondary
pollution of water.
13
Mesoporous TiO2
(G. Liu et al.,
2008)
Can be utilized as a catalyst
support, ceramic membrane top
cycle, and adsorbent.
Promoting the diffusion of the
reactants and products; facilitating
access to the reactive sites on the
surface of the photocatalyst.
Low separation efficiency of
photogenerated electron-
hole pairs.
Aerogels TiO2
(Popa et al.,
2009)
Higher surface area.
Tailored pore size distribution.
Low crystallinity.
Electron-hole
recombination rate.
TiO2-based photocatalysts has been touted as a potential treatment for full-scale
degradation of organic compounds in wastewaters (Linsebigler et al., 1995). TiO2 is
regarded as a stable photocatalyst, due to its wide band gap (3.0 and 3.2 eV), dependence
on phase transformation, and only active in the UV region, which is less than 10% of the
overall solar intensity (Linsebigler et al., 1995).
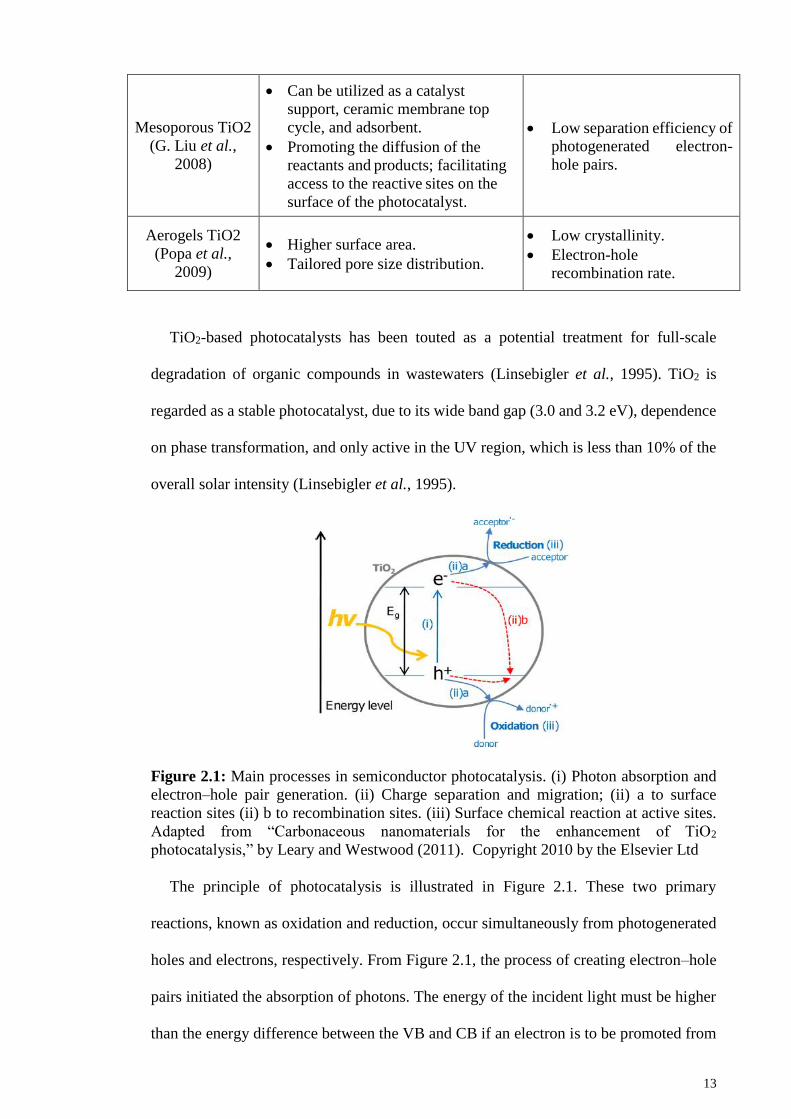
Figure 2.1: Main processes in semiconductor photocatalysis. (i) Photon absorption and
electron–hole pair generation. (ii) Charge separation and migration; (ii) a to surface
reaction sites (ii) b to recombination sites. (iii) Surface chemical reaction at active sites.
Adapted from “Carbonaceous nanomaterials for the enhancement of TiO2
photocatalysis,” by Leary and Westwood (2011). Copyright 2010 by the Elsevier Ltd
The principle of photocatalysis is illustrated in Figure 2.1. These two primary
reactions, known as oxidation and reduction, occur simultaneously from photogenerated
holes and electrons, respectively. From Figure 2.1, the process of creating electron–hole
pairs initiated the absorption of photons. The energy of the incident light must be higher
than the energy difference between the VB and CB if an electron is to be promoted from
14
Continued on next page
the former to the latter (Leary & Westwood, 2011). The exposure of TiO2 nanoparticles
to UV light through an energy that complements or surpasses its band gap energy
(anatase > 3.2 eV; rutile > 3.0 eV) results in an electron excitation from the VB into the
CB, leaving behind a positive hole (S. G. Kumar & Devi, 2011; Tachikawa et al.,
2011). Photogenerated charge carriers are exploited in a different process at the particles’
surface, whereby the holes migrate to the particles’ surface, inducing charge transfer to
the adsorbed molecules (Daimon & Nosaka, 2007; Lukes et al., 2005).
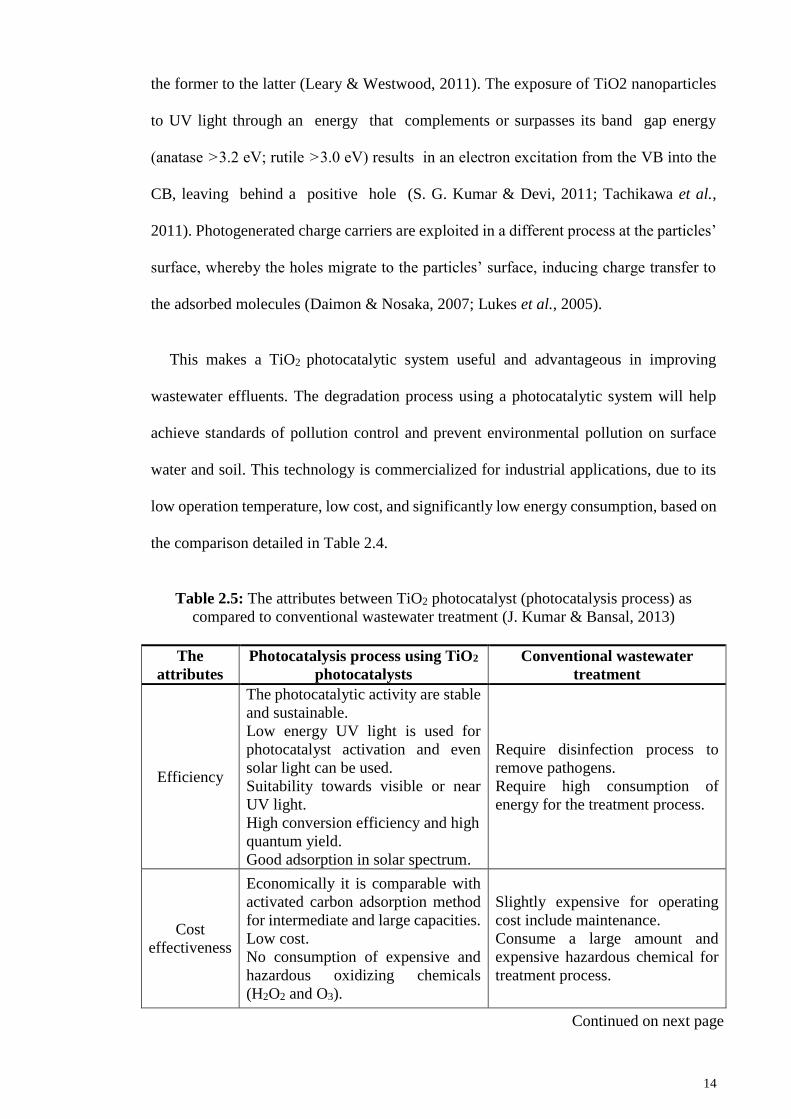
This makes a TiO2 photocatalytic system useful and advantageous in improving
wastewater effluents. The degradation process using a photocatalytic system will help
achieve standards of pollution control and prevent environmental pollution on surface
water and soil. This technology is commercialized for industrial applications, due to its
low operation temperature, low cost, and significantly low energy consumption, based on
the comparison detailed in Table 2.4.
Table 2.5: The attributes between TiO2 photocatalyst (photocatalysis process) as
compared to conventional wastewater treatment (J. Kumar & Bansal, 2013)
The
attributes
Photocatalysis process using TiO2
photocatalysts
Conventional wastewater
treatment
Efficiency
The photocatalytic activity are stable
and sustainable.
Low energy UV light is used for
photocatalyst activation and even
solar light can be used.
Suitability towards visible or near
UV light.
High conversion efficiency and high
quantum yield.
Good adsorption in solar spectrum.
Require disinfection process to
remove pathogens.
Require high consumption of
energy for the treatment process.
Cost
effectiveness
Economically it is comparable with
activated carbon adsorption method
for intermediate and large capacities.
Low cost.
No consumption of expensive and
hazardous oxidizing chemicals
(H2O2 and O3).
Slightly expensive for operating
cost include maintenance.
Consume a large amount and
expensive hazardous chemical for
treatment process.
15
Other
Green technology process because
degradation products (i.e; CO2, H2O)
are environmentally harmless.
Can be react with wide range of
substrate and high adaptability to
various environment.
Almost all organic pollutants can be
mineralized.
Complete mineralization of the
majority of organic pollutant can be
achieved.
Wastewater treatment facilities
containing organic compounds fall
within this 3 given categories:-
- Non-destructive procedures.
- Biological destructive.
- Oxidative destructive processes.
The most common treatment to
remove the contaminants of
wastewater is adsorption process
and produce sludge as the end-
products after treatment.
2.4.1 TiO2 photocatalysis system: Synthesis method and properties
There are a variety of methods and issues related to the process of fabricating a TiO2
photocatalysis system. The most common method that has seen wide usage in ceramic
engineering and materials science is the sol-gel process. It involves a wet-chemical
technique, known as the chemical solution deposition. This approach has seen wide usage
in the fabrication of TiO2 photocatalysts systems (Tseng et al., 2010).
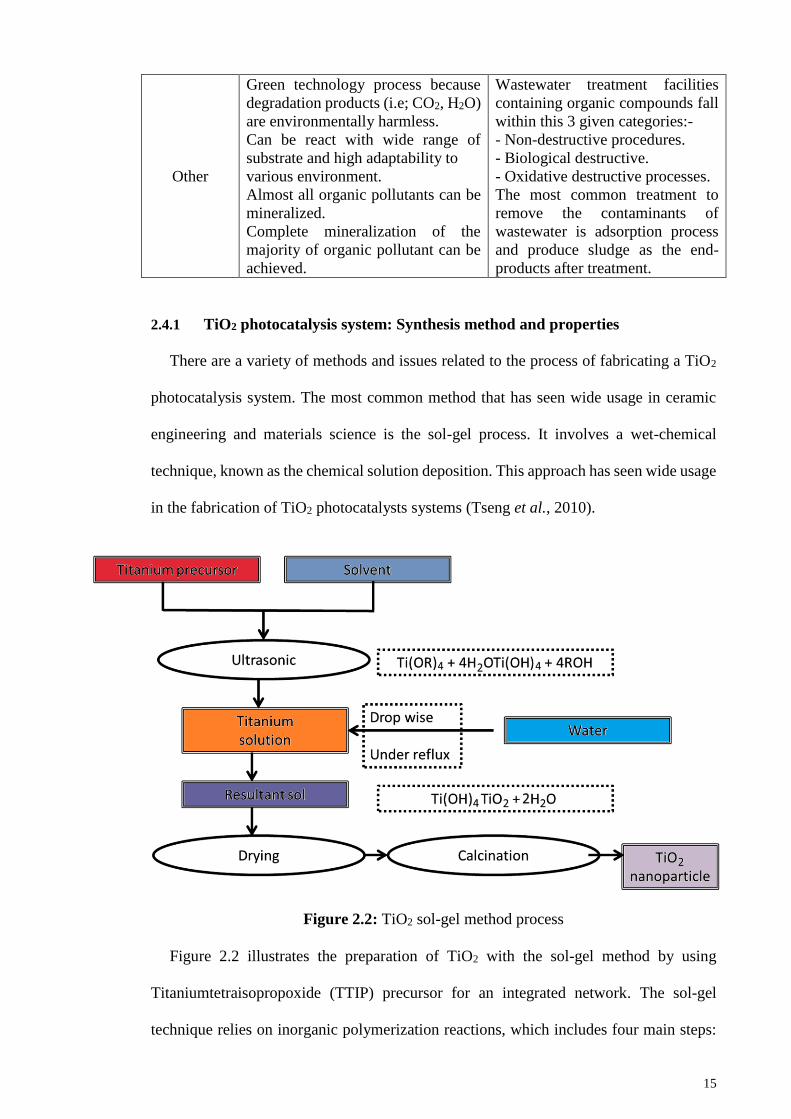
Figure 2.2: TiO2 sol-gel method process
Figure 2.2 illustrates the preparation of TiO2 with the sol-gel method by using
Titaniumtetraisopropoxide (TTIP) precursor for an integrated network. The sol-gel
technique relies on inorganic polymerization reactions, which includes four main steps:
16
hydrolysis, polycondensation, drying, and thermal decomposition (Figure 2.2). The
precursors of the metal or non-metal alkoxide hydrolysis take place with alcohol or water.
On top of alcohol and water, a base or an acid such as Acetic acid also helps precursor
hydrolysis (Chekin et al., 2013; Su et al., 2004; M. Zhang et al., 2001). While, solvent
was subsequently removed postcondensation, leaving behind a gel. Calcination at higher
temperatures is required to decompose the organic precursor (M. Zhang et al., 2001). The
size of the sol-gel particles is based on the solution composition, temperature, and pH
which have their own advantages and disadvantages that have been listed from Table 2.5.
Controlling these parameters allows us to tune the size of the TiO2 particles (Yongfa Zhu
et al., 2000).
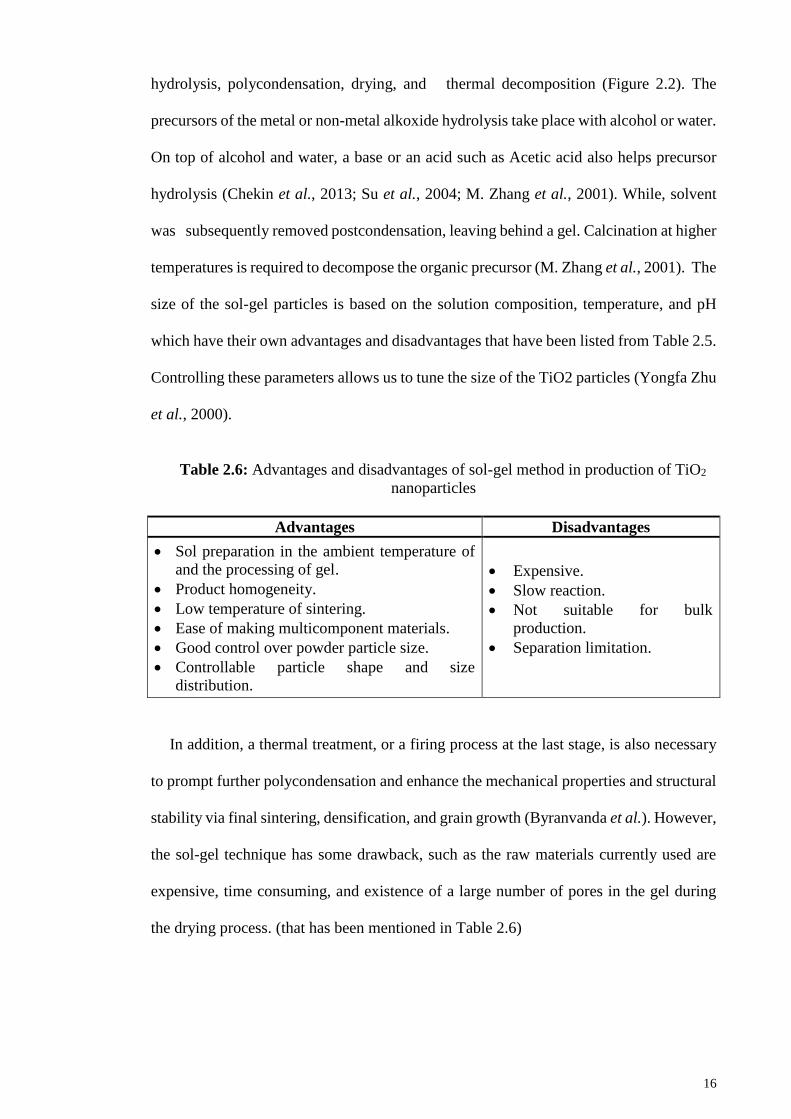
Table 2.6: Advantages and disadvantages of sol-gel method in production of TiO2
nanoparticles
Advantages Disadvantages
Sol preparation in the ambient temperature of
and the processing of gel.
Product homogeneity.
Low temperature of sintering.
Ease of making multicomponent materials.
Good control over powder particle size.
Controllable particle shape and size
distribution.
Expensive.
Slow reaction.
Not suitable for bulk
production.
Separation limitation.
In addition, a thermal treatment, or a firing process at the last stage, is also necessary
to prompt further polycondensation and enhance the mechanical properties and structural
stability via final sintering, densification, and grain growth (Byranvanda et al.). However,
the sol-gel technique has some drawback, such as the raw materials currently used are
expensive, time consuming, and existence of a large number of pores in the gel during
the drying process. (that has been mentioned in Table 2.6)
17
2.4.2 TiO2 photocatalysis system: Applications
Due to its promising photocatalytic activities, TiO2 nanoparticles have been used in
antiseptic and antibacterial compositions, degrading organic contaminants and germs, and
as a UV-resistant material used in the paper industry for improving the opacity of paper.
Indeed, TiO2 nanoparticles is also used as photocatalysis for water splitting to generate
hydrogen, for degrading environmental pollutants in aqueous contamination and for
wastewater treatment, carbon dioxide remediation, self-cleaning activity, and air
purification (Fujishima et al., 2007; Leary & Westwood, 2011).
Oudenhoven et al. (2004) discussed several important properties that are related to
photocatalyst used for water splitting. The properties that are initially determined are the
bandgap of the photocatalyst itself, which should fall between 2.43 eV and 3.2 eV. Both
VB and CB should be lower than the oxygen oxidation potential and higher than the
hydrogen reduction potential, respectively. Assistance from some sort of co-catalyst for
hydrogen generation is necessary. It can initiate the photocatalyst reaction to split water
in the protons and hydroxyl (-OH) anions. The generation of water from molecular
oxygen and hydrogen are reduced due to the transport of the electrons to the surface.
2.4.3 TiO2 photocatalysis system: Limitations
There are some limitations that are inherent in nanosized TiO2 when it’s used as a
photocatalyst. The first is its involvement in the efficiency of particular catalytic
materials, and second, the suitable illumination time that will result in an effective
reaction is difficult to determine. Third, the surface area of the catalyst must be improved
to maximize the mass transfer reaction. Therefore, the donor and acceptor molecules must
reach the catalysts’ surface prior to recombination (Riley, Borja, Williams, Gill, &
Plawsky). TiO2 nanoparticles were easily suspended in water, clog filter membranes, and
18
penetrate filter materials. Practically, there are economic costs to filtering out the slurry
inside the water post-treatment.
In general, catalytic ozonation and photocatalytic oxidation are processed in a
suspension of sub-micrometer-sized particles. Thus, there is a strong necessity for an
extra separation stage to get rid of the photocatalyst from treated water, which contains a
key disadvantage of water treating applications.
2.4.3.1 Separation process
Although several semiconductors have proven to be ideal candidates for the treatment
of water pollution, the efficient separation and recycling of this fine-powdered
photocatalyst is still a scientific problem when applied in practice (Sclafani et al. 1990,
Sato et al. 2004). Moreover, it is still very difficult to separate and recycle these
nanoscaled photocatalysts because of their small size. Thus, a facile and effective
approach to recover suspended semiconductor particles is greatly desirable.
2.4.3.2 Selectivity
Because the selectivity of most photocatalyst semiconductors are not conducive to take
away highly toxic contaminants with the existence of other contaminants (Shengwei et al.
2010).
2.4.3.3 Dispersion
Another significant problem related to photocatalytic efficiency is a limitation on the
dispersion of the photocatalyst throughout the solution. This consequently limits the
interaction between the photocatalyst and the targeted pollutant (Sahar and Masoud
Salavati, 2015).
19
Continued on next page
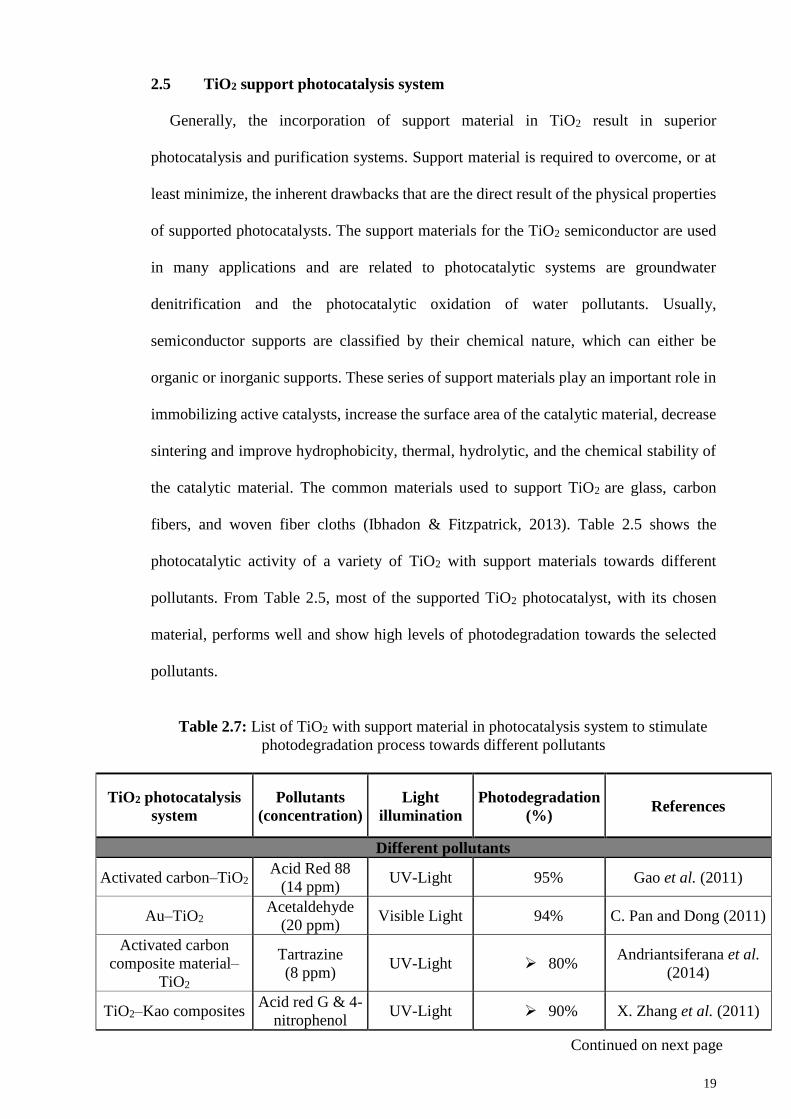
2.5 TiO2 support photocatalysis system
Generally, the incorporation of support material in TiO2 result in superior
photocatalysis and purification systems. Support material is required to overcome, or at
least minimize, the inherent drawbacks that are the direct result of the physical properties
of supported photocatalysts. The support materials for the TiO2 semiconductor are used
in many applications and are related to photocatalytic systems are groundwater
denitrification and the photocatalytic oxidation of water pollutants. Usually,
semiconductor supports are classified by their chemical nature, which can either be
organic or inorganic supports. These series of support materials play an important role in
immobilizing active catalysts, increase the surface area of the catalytic material, decrease
sintering and improve hydrophobicity, thermal, hydrolytic, and the chemical stability of
the catalytic material. The common materials used to support TiO2 are glass, carbon
fibers, and woven fiber cloths (Ibhadon & Fitzpatrick, 2013). Table 2.5 shows the
photocatalytic activity of a variety of TiO2 with support materials towards different
pollutants. From Table 2.5, most of the supported TiO2 photocatalyst, with its chosen
material, performs well and show high levels of photodegradation towards the selected
pollutants.
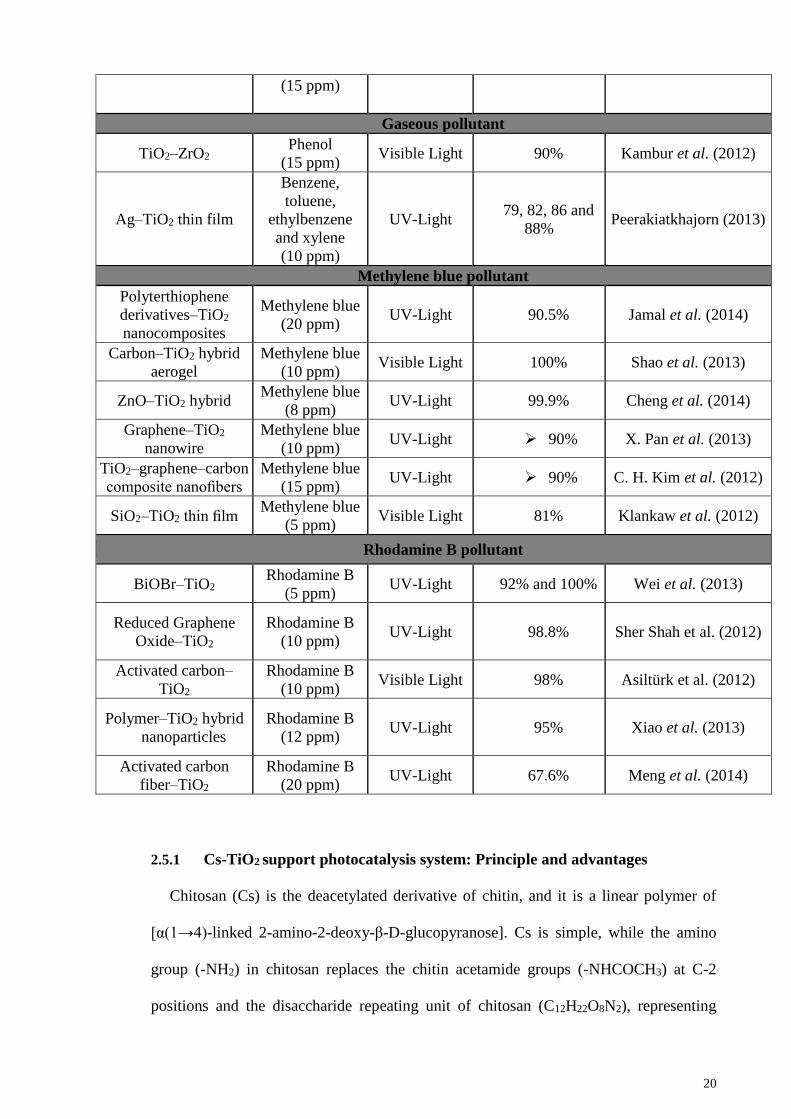
Table 2.7: List of TiO2 with support material in photocatalysis system to stimulate
photodegradation process towards different pollutants
TiO2 photocatalysis
system
Pollutants
(concentration)
Light
illumination
Photodegradation
(%) References
Different pollutants
Activated carbon–TiO2 Acid Red 88
(14 ppm) UV-Light 95% Gao et al. (2011)
Au–TiO2 Acetaldehyde
(20 ppm) Visible Light 94% C. Pan and Dong (2011)
Activated carbon
composite material–
TiO2
Tartrazine
(8 ppm) UV-Light 80%
Andriantsiferana et al.
(2014)
TiO2–Kao composites Acid red G & 4-
nitrophenol UV-Light 90% X. Zhang et al. (2011)
20
(15 ppm)
Gaseous pollutant
TiO2–ZrO2 Phenol
(15 ppm) Visible Light 90% Kambur et al. (2012)
Ag–TiO2 thin film
Benzene,
toluene,
ethylbenzene
and xylene
(10 ppm)
UV-Light 79, 82, 86 and
88% Peerakiatkhajorn (2013)
Methylene blue pollutant
Polyterthiophene
derivatives–TiO2
nanocomposites
Methylene blue
(20 ppm) UV-Light 90.5% Jamal et al. (2014)
Carbon–TiO2 hybrid
aerogel
Methylene blue
(10 ppm) Visible Light 100% Shao et al. (2013)
ZnO–TiO2 hybrid Methylene blue
(8 ppm) UV-Light 99.9% Cheng et al. (2014)
Graphene–TiO2
nanowire
Methylene blue
(10 ppm) UV-Light 90% X. Pan et al. (2013)
TiO2–graphene–carbon
composite nanofibers
Methylene blue
(15 ppm) UV-Light 90% C. H. Kim et al. (2012)
SiO2–TiO2 thin film Methylene blue
(5 ppm) Visible Light 81% Klankaw et al. (2012)
Rhodamine B pollutant
BiOBr–TiO2 Rhodamine B
(5 ppm) UV-Light 92% and 100% Wei et al. (2013)
Reduced Graphene
Oxide–TiO2
Rhodamine B
(10 ppm) UV-Light 98.8% Sher Shah et al. (2012)
Activated carbon–
TiO2
Rhodamine B
(10 ppm) Visible Light 98% Asiltürk et al. (2012)
Polymer–TiO2 hybrid
nanoparticles
Rhodamine B
(12 ppm) UV-Light 95% Xiao et al. (2013)
Activated carbon
fiber–TiO2
Rhodamine B
(20 ppm) UV-Light 67.6% Meng et al. (2014)
2.5.1 Cs-TiO2 support photocatalysis system: Principle and advantages
Chitosan (Cs) is the deacetylated derivative of chitin, and it is a linear polymer of
[α(1→4)-linked 2-amino-2-deoxy-β-D-glucopyranose]. Cs is simple, while the amino
group (-NH2) in chitosan replaces the chitin acetamide groups (-NHCOCH3) at C-2
positions and the disaccharide repeating unit of chitosan (C12H22O8N2), representing
21
idealized structures (Dutta et al., 2004). These features include its abundance,
hydrophilicity, anti-bacterial property, biodegradability, non-toxicity, and
biocompability. Using Cs as a support material for TiO2 photocatalysis requires some
modification due to its thermal stability. It was reported that Cs effectively adsorbs dyes,
metal ions, organic acids, and pesticide, due to its high adsorption potentials. Varieties of
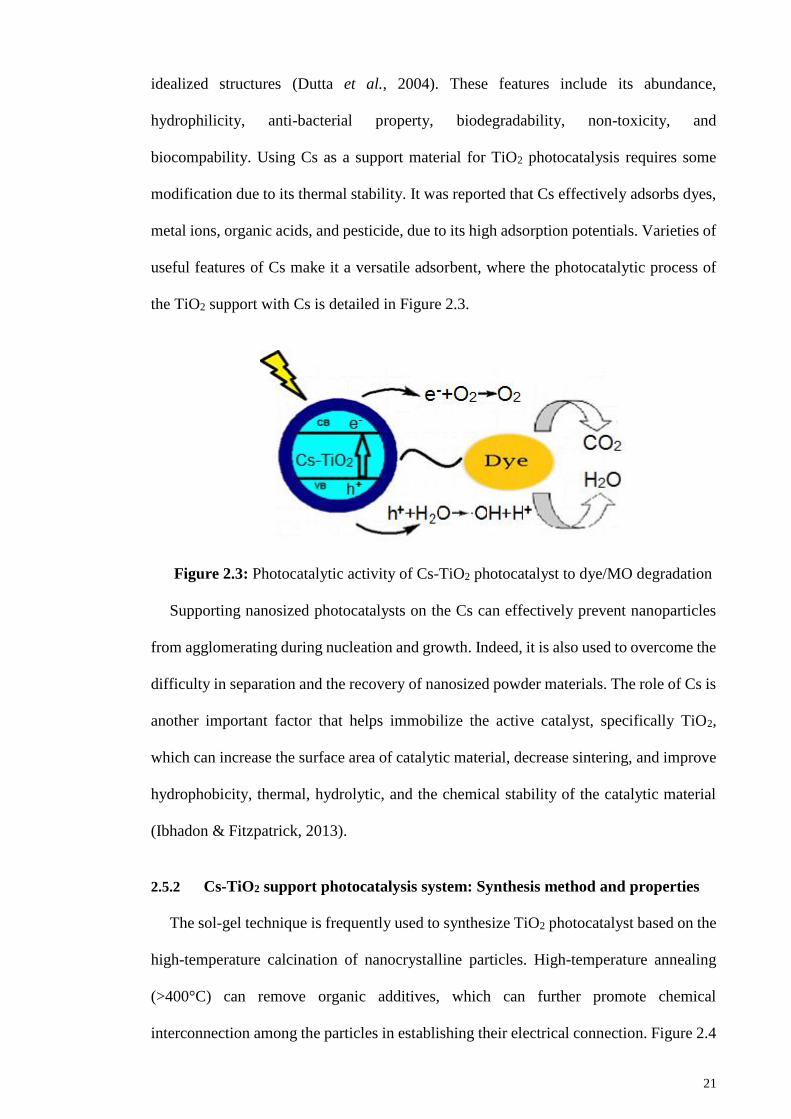
useful features of Cs make it a versatile adsorbent, where the photocatalytic process of
the TiO2 support with Cs is detailed in Figure 2.3.
Figure 2.3: Photocatalytic activity of Cs-TiO2 photocatalyst to dye/MO degradation
Supporting nanosized photocatalysts on the Cs can effectively prevent nanoparticles
from agglomerating during nucleation and growth. Indeed, it is also used to overcome the
difficulty in separation and the recovery of nanosized powder materials. The role of Cs is
another important factor that helps immobilize the active catalyst, specifically TiO2,
which can increase the surface area of catalytic material, decrease sintering, and improve
hydrophobicity, thermal, hydrolytic, and the chemical stability of the catalytic material
(Ibhadon & Fitzpatrick, 2013).
2.5.2 Cs-TiO2 support photocatalysis system: Synthesis method and properties
The sol-gel technique is frequently used to synthesize TiO2 photocatalyst based on the
high-temperature calcination of nanocrystalline particles. High-temperature annealing
(>400°C) can remove organic additives, which can further promote chemical
interconnection among the particles in establishing their electrical connection. Figure 2.4
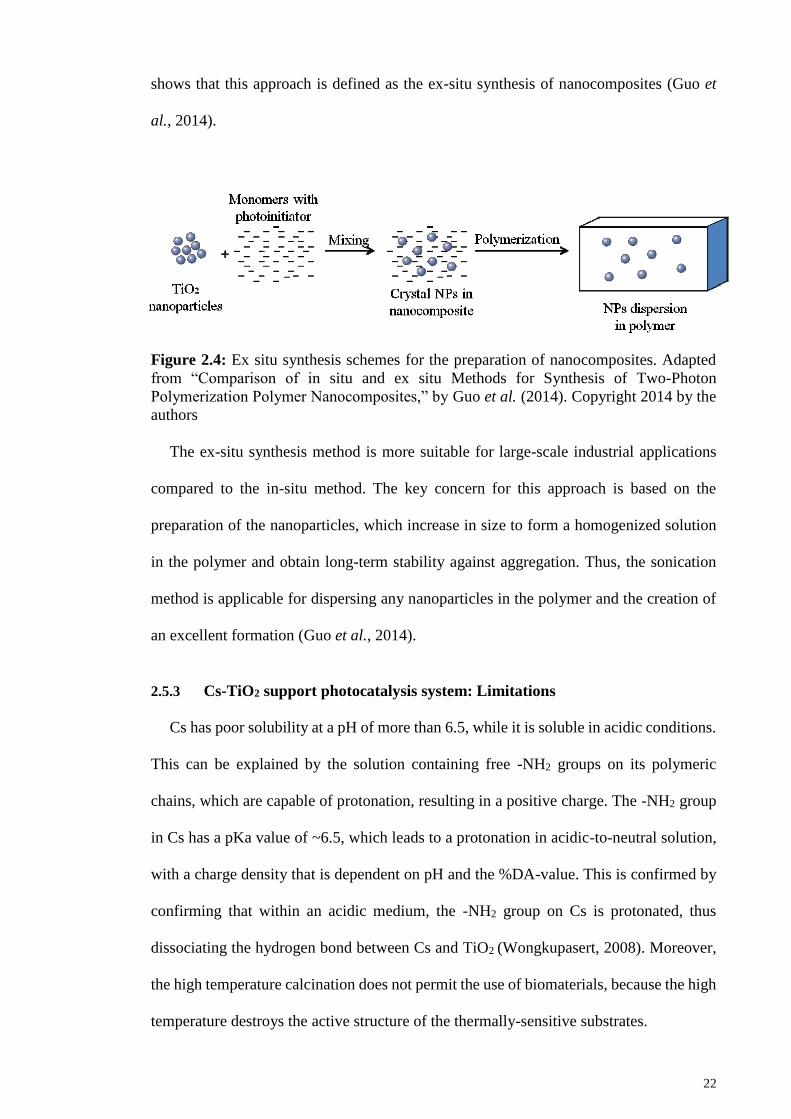
22
shows that this approach is defined as the ex-situ synthesis of nanocomposites (Guo et
al., 2014).
Figure 2.4: Ex situ synthesis schemes for the preparation of nanocomposites. Adapted
from “Comparison of in situ and ex situ Methods for Synthesis of Two-Photon
Polymerization Polymer Nanocomposites,” by Guo et al. (2014). Copyright 2014 by the
authors
The ex-situ synthesis method is more suitable for large-scale industrial applications
compared to the in-situ method. The key concern for this approach is based on the
preparation of the nanoparticles, which increase in size to form a homogenized solution
in the polymer and obtain long-term stability against aggregation. Thus, the sonication
method is applicable for dispersing any nanoparticles in the polymer and the creation of
an excellent formation (Guo et al., 2014).
2.5.3 Cs-TiO2 support photocatalysis system: Limitations
Cs has poor solubility at a pH of more than 6.5, while it is soluble in acidic conditions.
This can be explained by the solution containing free -NH2 groups on its polymeric
chains, which are capable of protonation, resulting in a positive charge. The -NH2 group
in Cs has a pKa value of ~6.5, which leads to a protonation in acidic-to-neutral solution,
with a charge density that is dependent on pH and the %DA-value. This is confirmed by
confirming that within an acidic medium, the -NH2 group on Cs is protonated, thus
dissociating the hydrogen bond between Cs and TiO2 (Wongkupasert, 2008). Moreover,
the high temperature calcination does not permit the use of biomaterials, because the high
temperature destroys the active structure of the thermally-sensitive substrates.
23
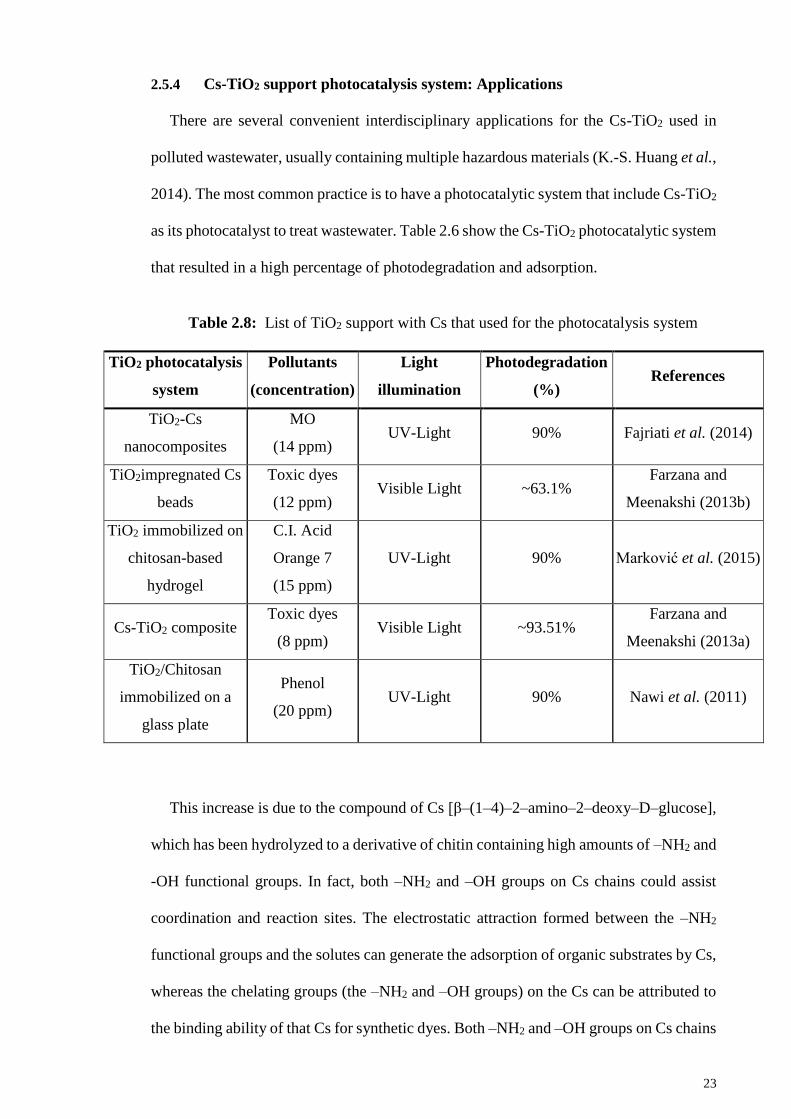
2.5.4 Cs-TiO2 support photocatalysis system: Applications
There are several convenient interdisciplinary applications for the Cs-TiO2 used in
polluted wastewater, usually containing multiple hazardous materials (K.-S. Huang et al.,
2014). The most common practice is to have a photocatalytic system that include Cs-TiO2
as its photocatalyst to treat wastewater. Table 2.6 show the Cs-TiO2 photocatalytic system
that resulted in a high percentage of photodegradation and adsorption.
Table 2.8: List of TiO2 support with Cs that used for the photocatalysis system
TiO2 photocatalysis
system
Pollutants
(concentration)
Light
illumination
Photodegradation
(%) References
TiO2-Cs
nanocomposites
MO
(14 ppm) UV-Light 90% Fajriati et al. (2014)
TiO2impregnated Cs
beads
Toxic dyes
(12 ppm) Visible Light ~63.1%
Farzana and
Meenakshi (2013b)
TiO2 immobilized on
chitosan-based
hydrogel
C.I. Acid
Orange 7
(15 ppm)
UV-Light 90% Marković et al. (2015)
Cs-TiO2 composite Toxic dyes
(8 ppm) Visible Light ~93.51%
Farzana and
Meenakshi (2013a)
TiO2/Chitosan
immobilized on a
glass plate
Phenol
(20 ppm) UV-Light 90% Nawi et al. (2011)
This increase is due to the compound of Cs [β–(1–4)–2–amino–2–deoxy–D–glucose],
which has been hydrolyzed to a derivative of chitin containing high amounts of –NH2 and
-OH functional groups. In fact, both –NH2 and –OH groups on Cs chains could assist
coordination and reaction sites. The electrostatic attraction formed between the –NH2
functional groups and the solutes can generate the adsorption of organic substrates by Cs,
whereas the chelating groups (the –NH2 and –OH groups) on the Cs can be attributed to
the binding ability of that Cs for synthetic dyes. Both –NH2 and –OH groups on Cs chains
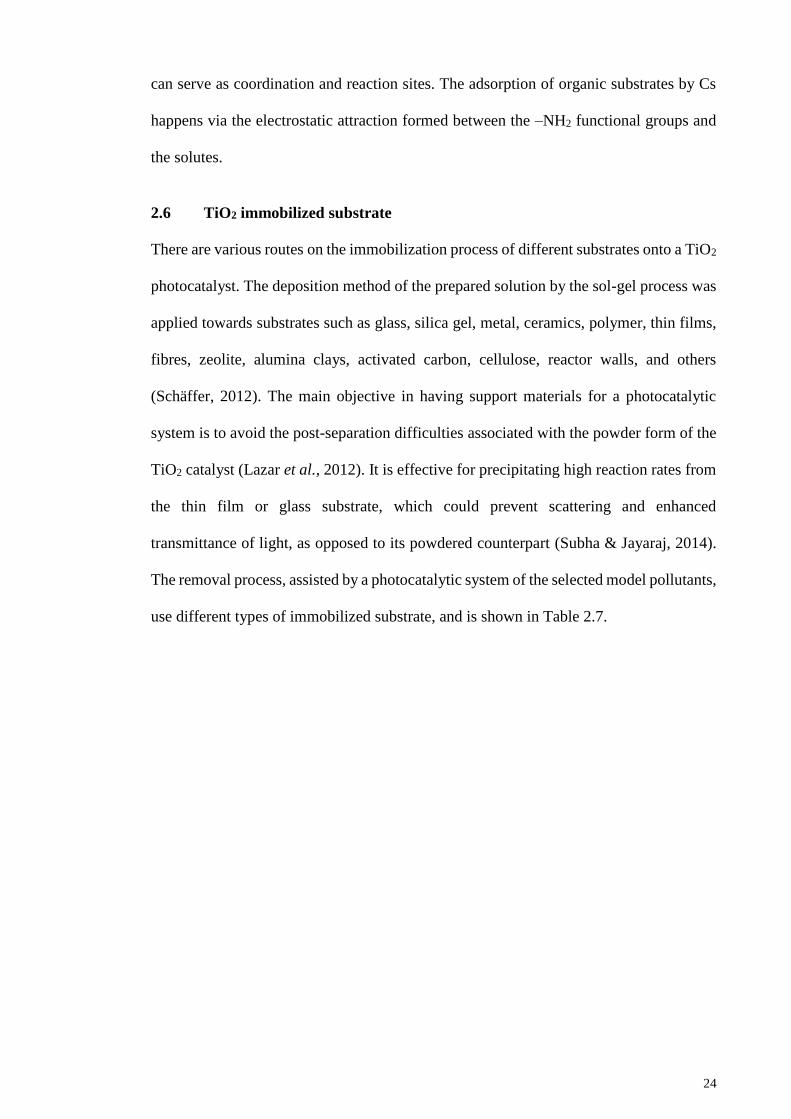
24
can serve as coordination and reaction sites. The adsorption of organic substrates by Cs
happens via the electrostatic attraction formed between the –NH2 functional groups and
the solutes.
2.6 TiO2 immobilized substrate
There are various routes on the immobilization process of different substrates onto a TiO2
photocatalyst. The deposition method of the prepared solution by the sol-gel process was
applied towards substrates such as glass, silica gel, metal, ceramics, polymer, thin films,
fibres, zeolite, alumina clays, activated carbon, cellulose, reactor walls, and others
(Schäffer, 2012). The main objective in having support materials for a photocatalytic
system is to avoid the post-separation difficulties associated with the powder form of the
TiO2 catalyst (Lazar et al., 2012). It is effective for precipitating high reaction rates from
the thin film or glass substrate, which could prevent scattering and enhanced
transmittance of light, as opposed to its powdered counterpart (Subha & Jayaraj, 2014).
The removal process, assisted by a photocatalytic system of the selected model pollutants,
use different types of immobilized substrate, and is shown in Table 2.7.
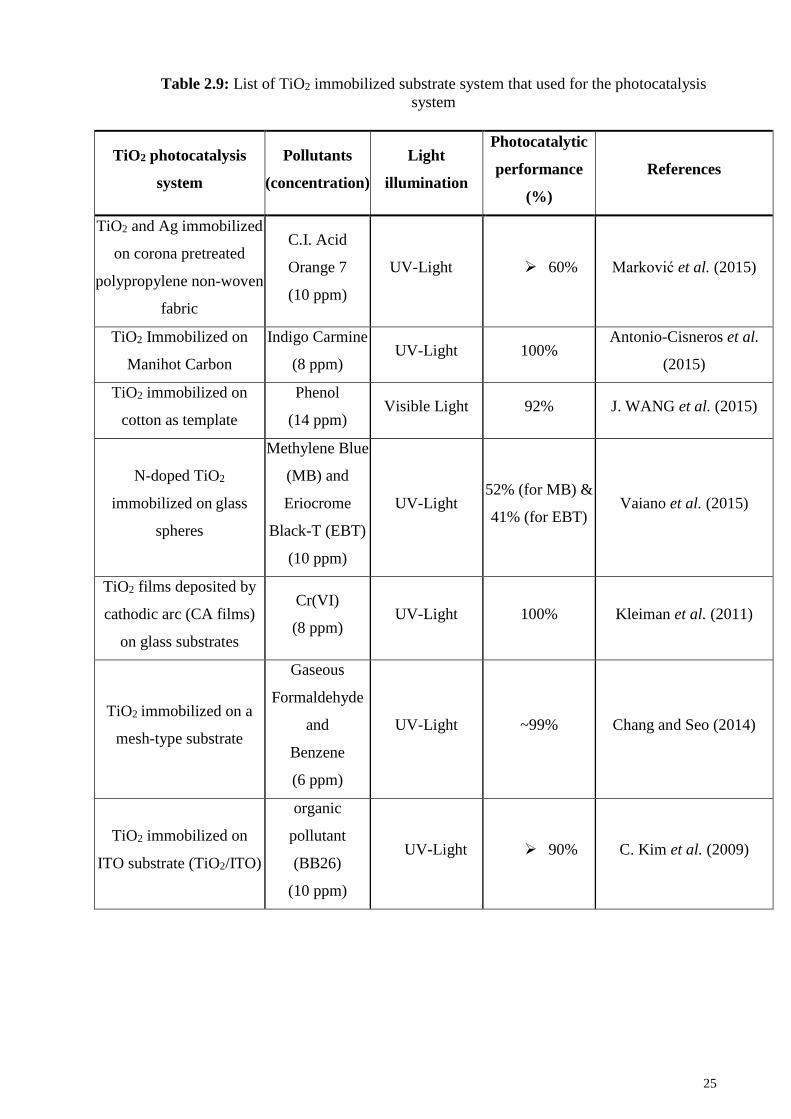
25
Table 2.9: List of TiO2 immobilized substrate system that used for the photocatalysis
system
TiO2 photocatalysis
system
Pollutants
(concentration)
Light
illumination
Photocatalytic
performance
(%)
References
TiO2 and Ag immobilized
on corona pretreated
polypropylene non-woven
fabric
C.I. Acid
Orange 7
(10 ppm)
UV-Light 60% Marković et al. (2015)
TiO2 Immobilized on
Manihot Carbon
Indigo Carmine
(8 ppm) UV-Light 100%
Antonio-Cisneros et al.
(2015)
TiO2 immobilized on
cotton as template
Phenol
(14 ppm) Visible Light 92% J. WANG et al. (2015)
N-doped TiO2
immobilized on glass
spheres
Methylene Blue
(MB) and
Eriocrome
Black-T (EBT)
(10 ppm)
UV-Light 52% (for MB) &
41% (for EBT) Vaiano et al. (2015)
TiO2 films deposited by
cathodic arc (CA films)
on glass substrates
Cr(VI)
(8 ppm) UV-Light 100% Kleiman et al. (2011)
TiO2 immobilized on a
mesh-type substrate
Gaseous
Formaldehyde
and
Benzene
(6 ppm)
UV-Light ~99% Chang and Seo (2014)
TiO2 immobilized on
ITO substrate (TiO2/ITO)
organic
pollutant
(BB26)
(10 ppm)
UV-Light 90% C. Kim et al. (2009)
26
2.6.1 TiO2 immobilized glass substrate photocatalysis system: Principle and
advantages
The glass substrate is suitable as a catalyst support, due to its transparency to UV light
in photocatalytic applications. This can consequently provide a large surface area and
improve the photocatalytic performance of TiO2. The main advantage of a glass substrate
is the transparency of the system, even post-immobilization. This allows for the
penetration of light, and resulted in the improvement of the photocatalytic activities.
There are also several other advantages, including higher surface area, superior
adsorption properties, and increased surface -OH groups or reduced charge recombination
in the process of photocatalysis, all of which are made possible by immobilized systems
(Lazar et al., 2012).
2.6.2 TiO2 immobilized glass substrate photocatalysis system: Synthesis method
and properties
There are various techniques that can be used immobilize TiO2 thin film on
inorganic/organic substrate, including chemical vapor deposition, chemical spray
pyrolysis, electrodeposition, and sol–gel method (Sonawane et al., 2003).
Sol-gel analysis is a prominent process that can be used for multiple dip-coating of
glass substrate immobilization. The immersion of a glass substrate into a solution
containing hydrolyzable metal compounds results in the formation of metal oxide coating
on the glass substrate. This is followed by the formation of gels on the surface of the glass
substrate after withdrawing it at a designated rate into an atmosphere of known humidity
and density. The final step involved heating the substrate to about 450° C to remove any
remaining solvents (Spagnoli, 1992).
27
Sol-gel is a widely used process to design both hydrophobic and hydrophilic coatings
for the selective compounds into a material or a substrate. During the process, a precursor
material is polymerized and further hydrolyzed to obtain a colloidal sol. Next, the sol is
deposited on the substrate, and solid films on a glass substrate, for example, is obtained
via heating. The sol-gel process is used to obtain ultrafine or spherical-shaped powders,
thin film coatings, fibrous, porous or dense materials, and extremely porous aerogel
materials. The prepared sol can be applied on the substrate by spray, dip and spin-coating
methods (S. Wang, 2014).
In dip-coating, the glass substrate is dipped into the tank or glass beaker containing the
colloidal sol. The final coating thickness is determined mainly by the deposition speed
and solution’s viscosity. According to the previous study by S. Wang (2014), there are
several factors that need to be taken into account when dip coating, such as the
functionalization of the initial substrate surface, immersion time, withdrawal speed,
number of cycles dipped, solution composition, concentration and temperature, number
of solutions in each dipping sequence, and environment humidity, all of which influence
the final cycle of coating. Dip coating can be used to coat on complex structures as well
(S. Wang, 2014).
2.6.3 TiO2 immobilized glass substrate photocatalysis system: Limitations
Several study investigated the immobilization techniques that are simple do not need
any expensive equipment. The production of immobilized TiO2 catalysts is regarded as a
low cost technique. Most of the TiO2 immobilized glass substrate was used to treat
wastewater, which consequently improved the photocatalytic activity. Coating the TiO2
catalysts resulted in excellent photocatalytic activities and mechanical stabilities with
efficient long-term stabilities (Doll & Frimmel, 2004; Schäffer, 2012).
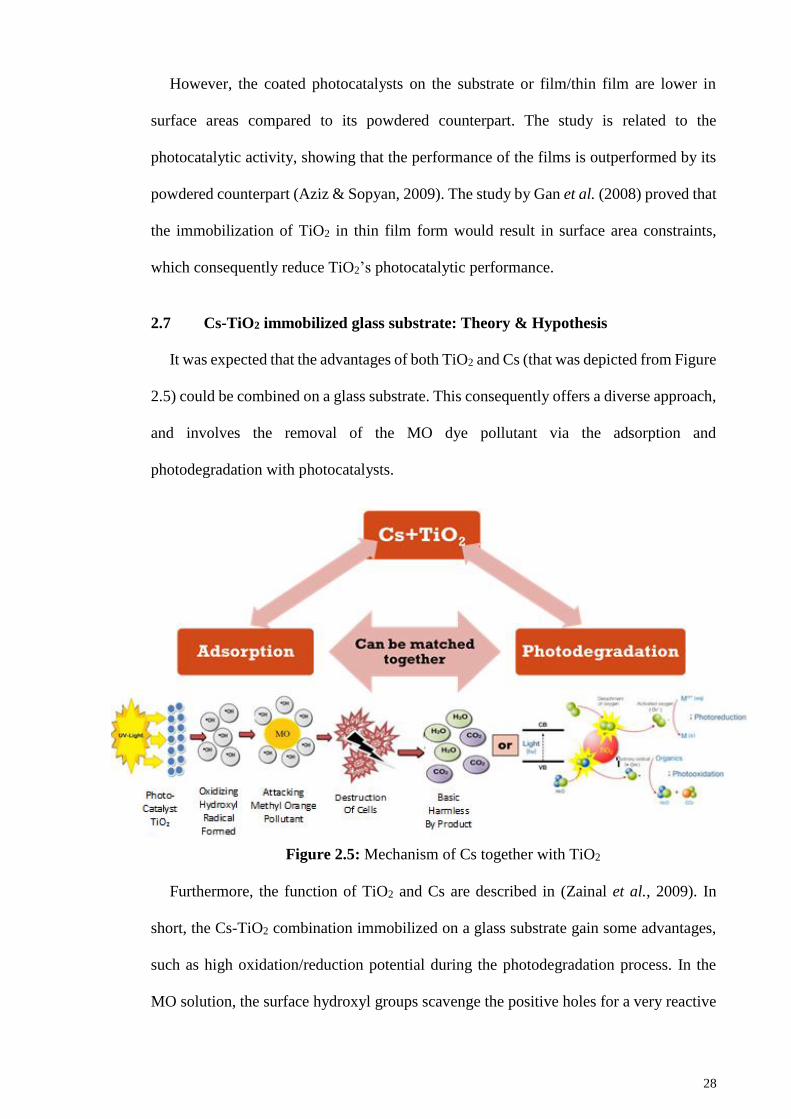
28
However, the coated photocatalysts on the substrate or film/thin film are lower in
surface areas compared to its powdered counterpart. The study is related to the
photocatalytic activity, showing that the performance of the films is outperformed by its
powdered counterpart (Aziz & Sopyan, 2009). The study by Gan et al. (2008) proved that
the immobilization of TiO2 in thin film form would result in surface area constraints,
which consequently reduce TiO2’s photocatalytic performance.
2.7 Cs-TiO2 immobilized glass substrate: Theory & Hypothesis
It was expected that the advantages of both TiO2 and Cs (that was depicted from Figure
2.5) could be combined on a glass substrate. This consequently offers a diverse approach,
and involves the removal of the MO dye pollutant via the adsorption and
photodegradation with photocatalysts.
Figure 2.5: Mechanism of Cs together with TiO2
Furthermore, the function of TiO2 and Cs are described in (Zainal et al., 2009). In
short, the Cs-TiO2 combination immobilized on a glass substrate gain some advantages,
such as high oxidation/reduction potential during the photodegradation process. In the
MO solution, the surface hydroxyl groups scavenge the positive holes for a very reactive
29
oxidization of hydroxyl radicals (•OH), which can promote the degradation process and
subsequently lead to the total mineralization of the organic substrate. In the meantime,
the use of the commercial Cs is known to restrict the movement from the base of the
medium used, resulting in a very encouraging influence on the adsorption capability
towards both TiO2 on the glass substrate, and it also can be used to adsorb the pollutant
compound (MO).
2.8 Photocatalytic activities: Effect on photocatalytic conditions
The applicability of combining Cs and TiO2 to form photocatalysts is indeed promising
for the effective adsorption and photodegradation treatment of dye-containing effluents.
Therefore, in laboratory conditions, the various pH and the concentration of experimental
wastewater model pollutant compound were observed. Furthermore, the consideration of
the operational conditions in the treatment process, which involved the photocatalytic
treatment process, would affect the performance of the photocatalytic degradation
systems.
2.8.1 pH of wastewater medium
Wastewater containing various contaminants, especially dyes, discharges at different
pHs. Generally, the pH that is suitable for water discharge, specifically in Malaysia, is pH
6.0-9.0, as stated in the Environmental Quality (Industrial Effluent) Regulations 2009.
Therefore, it is important to study the role of the pH on the degradation of specific
pollutants. It was reported that the pH of the medium significantly influence the catalysts’
particles, the size of catalyst aggregates, and the positions of conductance and valence
bands, which consequently affect the final performance of the photocatalysis.
Indeed, the performance of TiO2 photocatalysis may differ in different types of pH
medium, due to the amphoteric behavior of the metal oxides. Furthermore, the pH can
influence the surface charge properties of metal oxides during the photocatalytic process.
30
Thus, reactions could take place on the surface of metal oxides via different mechanism
at different pH values. This can be explained by the fact that the surfaces of most metal
oxides are negatively and positively charged, as conditional upon the fluctuations of pH
values. In order to widen the range of pH values, MO molecules save their respective
negative charges. Therefore, the ability of MO to adsorb on the surfaces of metal oxides
is increased once the solution’s pH is acidic (Pakmehr et al., 2014).
2.8.2 Concentration of pollutants
Semiconductor is related to the use of the pollutants’ increasing initial concentrations.
Subsequently, it may significantly influence the photocatalytic activities, due to the fact
that it becomes the path length of the photons entering the solution decreases, while the
reverse is observed when the number of photon absorption is increased by the catalyst at
lower concentrations (Bhalerao et al., 2013). Table 2.8 illustrates the different
concentrations of MO used in the photodegradation process, which results in the reduction
to the photodegradation activity at higher amounts of MO by variety of photocatalysts.
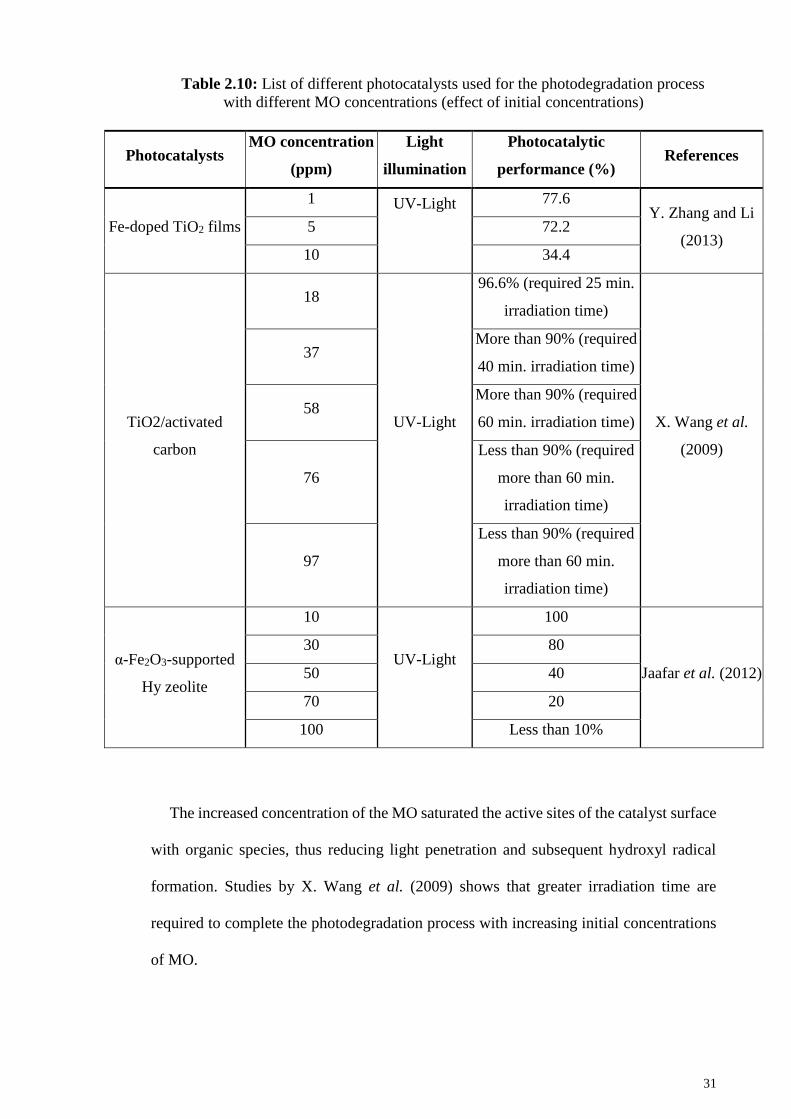
31
Table 2.10: List of different photocatalysts used for the photodegradation process
with different MO concentrations (effect of initial concentrations)
Photocatalysts MO concentration
(ppm)
Light
illumination
Photocatalytic
performance (%) References
Fe-doped TiO2 films
1 UV-Light
77.6 Y. Zhang and Li
(2013) 5 72.2
10 34.4
TiO2/activated
carbon
18
UV-Light
96.6% (required 25 min.
irradiation time)
X. Wang et al.
(2009)
37 More than 90% (required
40 min. irradiation time)
58 More than 90% (required
60 min. irradiation time)
76
Less than 90% (required
more than 60 min.
irradiation time)
97
Less than 90% (required
more than 60 min.
irradiation time)
α-Fe2O3-supported
Hy zeolite
10
UV-Light
100
Jaafar et al. (2012)
30 80
50 40
70 20
100 Less than 10%
The increased concentration of the MO saturated the active sites of the catalyst surface
with organic species, thus reducing light penetration and subsequent hydroxyl radical
formation. Studies by X. Wang et al. (2009) shows that greater irradiation time are
required to complete the photodegradation process with increasing initial concentrations
of MO.
32
2.8.3 Cycles of photocatalyst on glass substrate
Semiconductors catalysts such as TiO2, CaF, MgO, SiC, Ti, ITO and others are used
as heterogeneous buffer cycles by the researchers (Talebian et al., 2013). The
photodegradation process of some organic pollutants need exact dosage of that
photocatalysts use. The presence of sufficient active sites on photocatalysts surface,
optimal dosage of photocatalysts, and high total active surface area are the factors that
influence performance of photocatalyst towards initial solute concentration, which can be
analyzed on the basis of optimum catalyst loading. Simultaneously, it will decrease the
photoactivated volume of suspension together with penetration of UV light caused by
higher of photocatalysts dosage which increase turbidity of the suspension. Therefore,
light scattering can caused aggregation as well as reduced irradiation field due to the
higher photocatalysts dosage (Bhalerao et al., 2013).
33
CHAPTER 3: MATERIALS AND METHODOLOGY
3.1 Introduction
This chapter highlights the 5 different stages of the work; from sample preparation to
photocatalytic activities analyses. At the first stage (Stage 1), the preparation of single
catalyst of the TiO2 (the used of specific commercial and synthesis TiO2 samples
separately for the whole experimentation) using a TTIP precursor was synthesized via the
sol-gel method (it’s also known as TiO2(SY)). Prior to the calcination process, the as-
synthesized TiO2 nanoparticles sample was analyzed using the Thermal Gravimetric
Analyzer (TGA) to determine the exact temperature and the required time for the overall
calcination process (based on previous studied). Furthermore, the TiO2(SY) and TiO2(DP25)
photocatalysts were characterized using Fourier transform infrared spectroscopy (FTIR),
X-ray Diffraction (XRD), Raman spectroscopy, High-resolution transmission electron
microscopy (HR-TEM), FEG-Emission Scanning Electron Microscopy (FESEM) +
Energy Dispersive Spectrometer (EDS), and UV-Vis Diffuse Reflectance Spectroscopy
(UV-DR). In the second stage (Stage 2), both TiO2(SY) and TiO2(DP25) were incorporated
into a Cs matrix which are prepared separately, to produce Cs-TiO2 hybrid catalyst
solution via ex-situ preparation using the dip-coating method. Furthermore, the prepared
TiO2 and Cs solution was coated on a glass substrate (Stage 3), resulting in Cs-
TiO2(DP25)/Glass and Cs-TiO2(SY)/Glass photocatalysts. The next stage (Stage 4), that
involve all prepared samples of Cs-TiO2/Glass photocatalyst being analyzed using the
FE-Emission Scanning Electron Microscopy (FESEM) + Energy Dispersive
Spectrometer (EDS), Fourier transform infrared spectroscopy (FTIR), and UV-Vis
Diffuse Reflectance Spectroscopy (UV-DR) analyses. The final stage (Stage 5), involve
the preparation of the photocatalyst samples under a photocatalytic reactor, while the
adsorption-photodegradation process was conducted in the presence of UV-light lamp to
degrade the simulated organic pollutants and determine the corresponding optimum
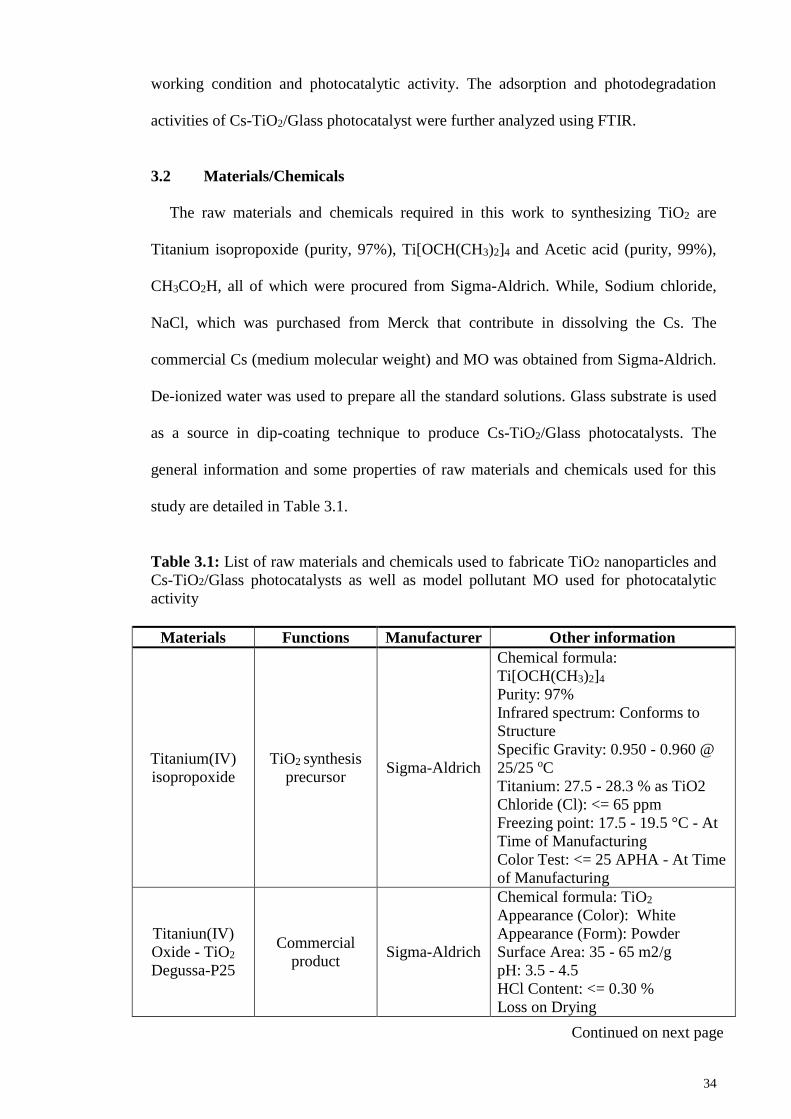
34
Continued on next page
working condition and photocatalytic activity. The adsorption and photodegradation
activities of Cs-TiO2/Glass photocatalyst were further analyzed using FTIR.
3.2 Materials/Chemicals
The raw materials and chemicals required in this work to synthesizing TiO2 are
Titanium isopropoxide (purity, 97%), Ti[OCH(CH3)2]4 and Acetic acid (purity, 99%),
CH3CO2H, all of which were procured from Sigma-Aldrich. While, Sodium chloride,
NaCl, which was purchased from Merck that contribute in dissolving the Cs. The
commercial Cs (medium molecular weight) and MO was obtained from Sigma-Aldrich.
De-ionized water was used to prepare all the standard solutions. Glass substrate is used
as a source in dip-coating technique to produce Cs-TiO2/Glass photocatalysts. The
general information and some properties of raw materials and chemicals used for this
study are detailed in Table 3.1.
Table 3.1: List of raw materials and chemicals used to fabricate TiO2 nanoparticles and
Cs-TiO2/Glass photocatalysts as well as model pollutant MO used for photocatalytic
activity
Materials Functions Manufacturer Other information
Titanium(IV)
isopropoxide
TiO2 synthesis
precursor Sigma-Aldrich
Chemical formula:
Ti[OCH(CH3)2]4
Purity: 97%
Infrared spectrum: Conforms to
Structure
Specific Gravity: 0.950 - 0.960 @
25/25 oC
Titanium: 27.5 - 28.3 % as TiO2
Chloride (Cl): <= 65 ppm
Freezing point: 17.5 - 19.5 °C - At
Time of Manufacturing
Color Test: <= 25 APHA - At Time
of Manufacturing
Titaniun(IV)
Oxide - TiO2
Degussa-P25
Commercial
product Sigma-Aldrich
Chemical formula: TiO2
Appearance (Color): White
Appearance (Form): Powder
Surface Area: 35 - 65 m2/g
pH: 3.5 - 4.5
HCl Content: <= 0.30 %
Loss on Drying
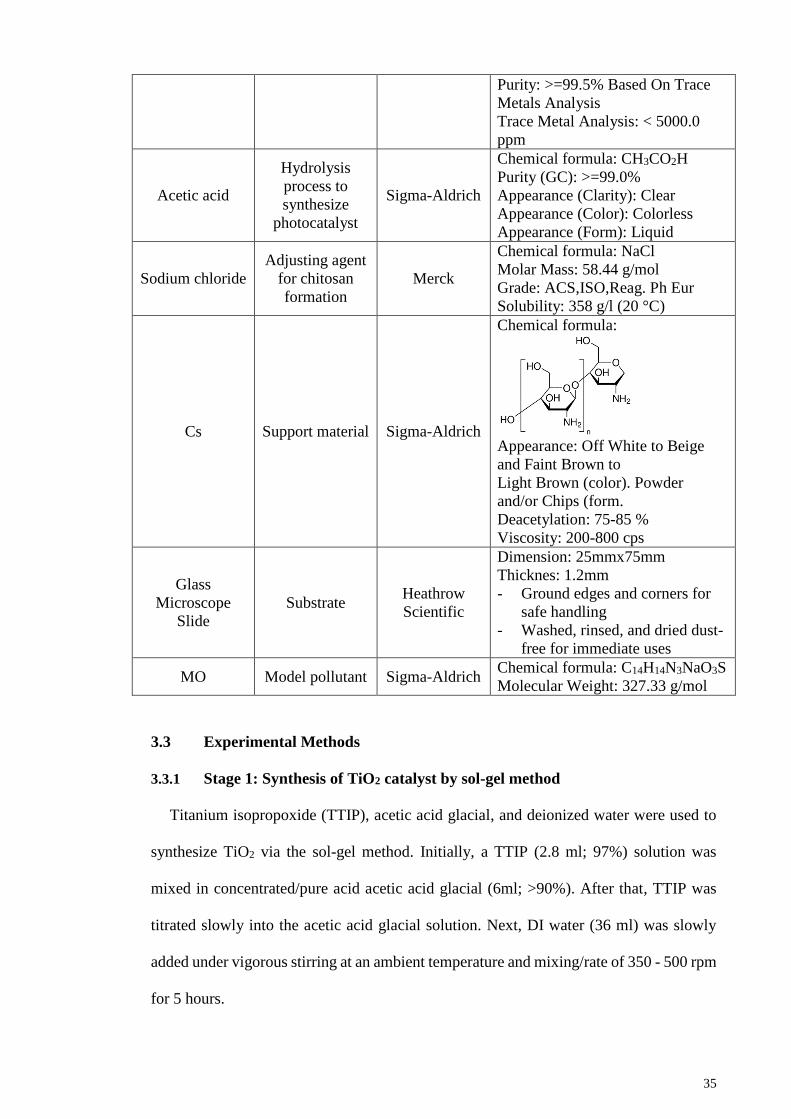
35
Purity: >=99.5% Based On Trace
Metals Analysis
Trace Metal Analysis: < 5000.0
ppm
Acetic acid
Hydrolysis
process to
synthesize
photocatalyst
Sigma-Aldrich
Chemical formula: CH3CO2H
Purity (GC): >=99.0%
Appearance (Clarity): Clear
Appearance (Color): Colorless
Appearance (Form): Liquid
Sodium chloride
Adjusting agent
for chitosan
formation
Merck
Chemical formula: NaCl
Molar Mass: 58.44 g/mol
Grade: ACS,ISO,Reag. Ph Eur
Solubility: 358 g/l (20 °C)
Cs Support material Sigma-Aldrich
Chemical formula:
Appearance: Off White to Beige
and Faint Brown to
Light Brown (color). Powder
and/or Chips (form.
Deacetylation: 75-85 %
Viscosity: 200-800 cps
Glass
Microscope
Slide
Substrate Heathrow
Scientific
Dimension: 25mmx75mm
Thicknes: 1.2mm
- Ground edges and corners for
safe handling
- Washed, rinsed, and dried dust-
free for immediate uses
MO Model pollutant Sigma-Aldrich Chemical formula: C14H14N3NaO3S
Molecular Weight: 327.33 g/mol
3.3 Experimental Methods
3.3.1 Stage 1: Synthesis of TiO2 catalyst by sol-gel method
Titanium isopropoxide (TTIP), acetic acid glacial, and deionized water were used to
synthesize TiO2 via the sol-gel method. Initially, a TTIP (2.8 ml; 97%) solution was
mixed in concentrated/pure acid acetic acid glacial (6ml; >90%). After that, TTIP was
titrated slowly into the acetic acid glacial solution. Next, DI water (36 ml) was slowly
added under vigorous stirring at an ambient temperature and mixing/rate of 350 - 500 rpm
for 5 hours.
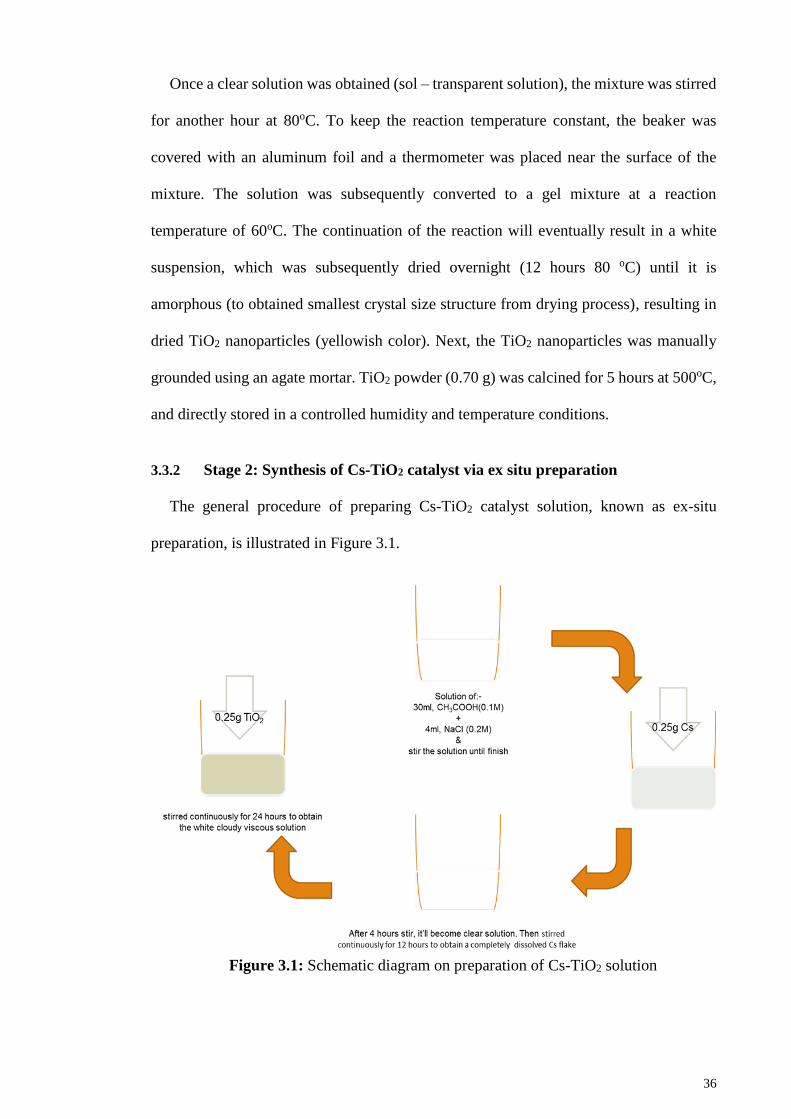
36
Once a clear solution was obtained (sol – transparent solution), the mixture was stirred
for another hour at 80oC. To keep the reaction temperature constant, the beaker was
covered with an aluminum foil and a thermometer was placed near the surface of the
mixture. The solution was subsequently converted to a gel mixture at a reaction
temperature of 60oC. The continuation of the reaction will eventually result in a white
suspension, which was subsequently dried overnight (12 hours 80 oC) until it is
amorphous (to obtained smallest crystal size structure from drying process), resulting in
dried TiO2 nanoparticles (yellowish color). Next, the TiO2 nanoparticles was manually
grounded using an agate mortar. TiO2 powder (0.70 g) was calcined for 5 hours at 500oC,
and directly stored in a controlled humidity and temperature conditions.
3.3.2 Stage 2: Synthesis of Cs-TiO2 catalyst via ex situ preparation
The general procedure of preparing Cs-TiO2 catalyst solution, known as ex-situ
preparation, is illustrated in Figure 3.1.
Figure 3.1: Schematic diagram on preparation of Cs-TiO2 solution
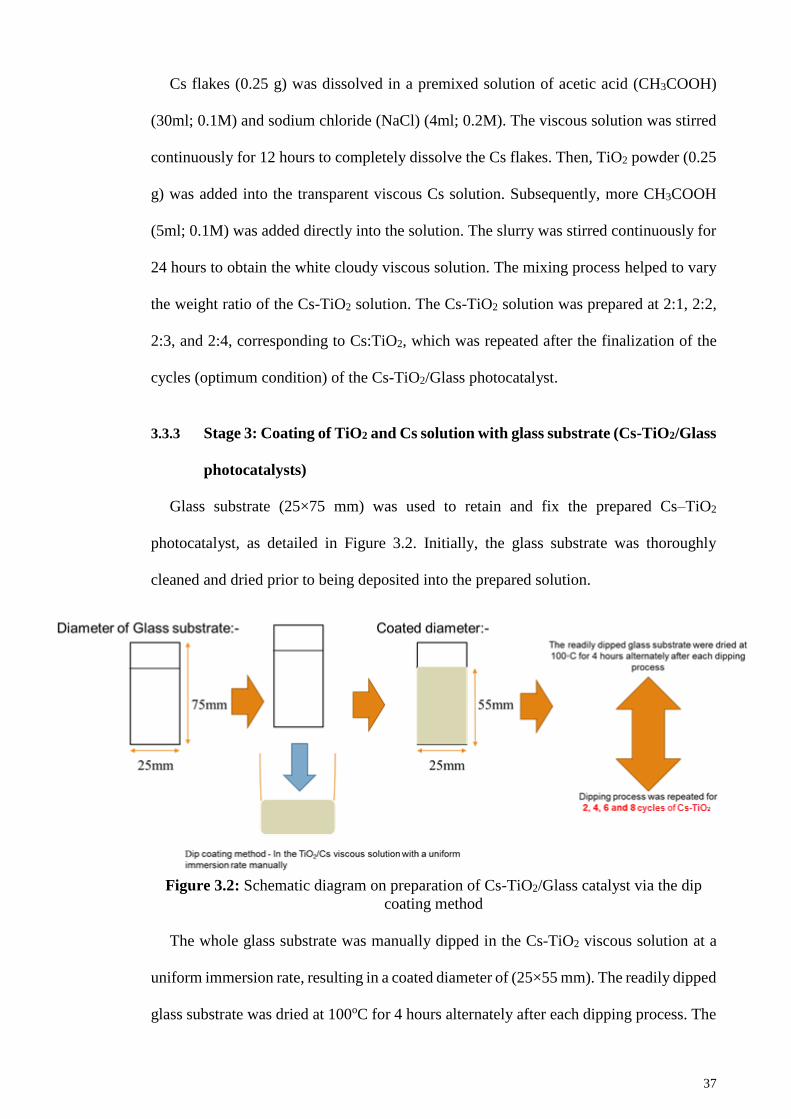
37
Cs flakes (0.25 g) was dissolved in a premixed solution of acetic acid (CH3COOH)
(30ml; 0.1M) and sodium chloride (NaCl) (4ml; 0.2M). The viscous solution was stirred
continuously for 12 hours to completely dissolve the Cs flakes. Then, TiO2 powder (0.25
g) was added into the transparent viscous Cs solution. Subsequently, more CH3COOH
(5ml; 0.1M) was added directly into the solution. The slurry was stirred continuously for
24 hours to obtain the white cloudy viscous solution. The mixing process helped to vary
the weight ratio of the Cs-TiO2 solution. The Cs-TiO2 solution was prepared at 2:1, 2:2,
2:3, and 2:4, corresponding to Cs:TiO2, which was repeated after the finalization of the
cycles (optimum condition) of the Cs-TiO2/Glass photocatalyst.
3.3.3 Stage 3: Coating of TiO2 and Cs solution with glass substrate (Cs-TiO2/Glass
photocatalysts)
Glass substrate (25×75 mm) was used to retain and fix the prepared Cs–TiO2
photocatalyst, as detailed in Figure 3.2. Initially, the glass substrate was thoroughly
cleaned and dried prior to being deposited into the prepared solution.
Figure 3.2: Schematic diagram on preparation of Cs-TiO2/Glass catalyst via the dip
coating method
The whole glass substrate was manually dipped in the Cs-TiO2 viscous solution at a
uniform immersion rate, resulting in a coated diameter of (25×55 mm). The readily dipped
glass substrate was dried at 100oC for 4 hours alternately after each dipping process. The
38
glass substrate itself helps vary the amount (weight ratio) or cycles of Cs-TiO2 that was
coated on glass substrate. The dipping process was repeated for 2, 4, 6, and 8 cycles of
Cs-TiO2 photocatalyst on the glass substrate. Herein, the TiO2 with Cs samples were
called Cs-TiO2/Glass photocatalyst. The photocatalyst of Cs-TiO2 formed on the glass
substrate will be responsible for adsorption and photodegradation reactions. Otherwise, it
was stored in the dark to avoid pre-activation by visible light or sunlight (UV-light).
3.3.4 Stage 4: Characterization of the Cs-TiO2/Glass catalyst
The characteristics of the Cs-TiO2/Glass photocatalyst were analyzed for its binding
abilities and homogeneity. The binding ability of TiO2 nanoparticles for both TiO2(SY) and
TiO2(DP25) were characterized using the TGA (for as-synthesized TiO2), XRD, Raman,
FTIR, HR-TEM, FESEM+EDS, and UV-DR. The prepared TiO2 and Cs on the glass
substrate, called Cs-TiO2(DP25)/Glass and Cs-TiO2(SY)/Glass, was characterized using
FTIR, FESEM+EDS, and UV-DR.
3.3.4.1 Thermal Gravimetric Analyzer (TGA)
TGA is a technique that measures the change in the weight of the sample when it is
heated, cooled, or held at constant temperature(s). In this study, the calcination
temperature for the as-synthesised TiO2 was examined using the TGA method. The
samples (4 mg – 5 mg) were examined using the TGA (Mettler Toledo, TGA/SDTA-
851e) by placing it into a 100-µl open alumina crucible. The experimental temperature
was set from the ambient to 800 oC, at a heating rate of 10 oC min-1 under nitrogen gas at
a flow rate of 50 ml min-1. It was then cooled to room temperature. This technique was
used to identify the composition ratio of as-synthesized TiO2 to ensure that pure TiO2
nanoparticles sample is obtained prior to proceeding into calcination.
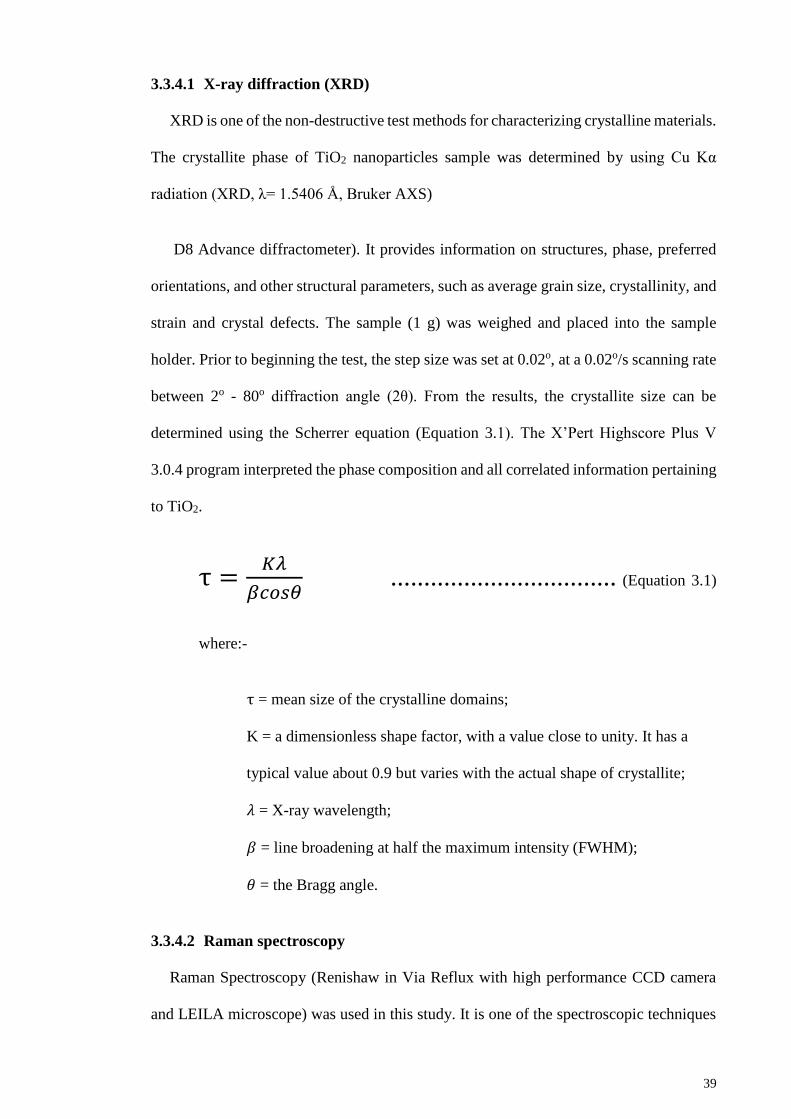
39
3.3.4.1 X-ray diffraction (XRD)
XRD is one of the non-destructive test methods for characterizing crystalline materials.
The crystallite phase of TiO2 nanoparticles sample was determined by using Cu Kα
radiation (XRD, λ= 1.5406 Å, Bruker AXS)
D8 Advance diffractometer). It provides information on structures, phase, preferred
orientations, and other structural parameters, such as average grain size, crystallinity, and
strain and crystal defects. The sample (1 g) was weighed and placed into the sample
holder. Prior to beginning the test, the step size was set at 0.02o, at a 0.02o/s scanning rate
between 2o - 80o diffraction angle (2θ). From the results, the crystallite size can be
determined using the Scherrer equation (Equation 3.1). The X’Pert Highscore Plus V
3.0.4 program interpreted the phase composition and all correlated information pertaining
to TiO2.
τ =𝐾𝜆
𝛽𝑐𝑜𝑠𝜃 .................................. (Equation 3.1)
where:-
τ = mean size of the crystalline domains;
K = a dimensionless shape factor, with a value close to unity. It has a
typical value about 0.9 but varies with the actual shape of crystallite;
𝜆 = X-ray wavelength;
𝛽 = line broadening at half the maximum intensity (FWHM);
𝜃 = the Bragg angle.
3.3.4.2 Raman spectroscopy
Raman Spectroscopy (Renishaw in Via Reflux with high performance CCD camera
and LEILA microscope) was used in this study. It is one of the spectroscopic techniques
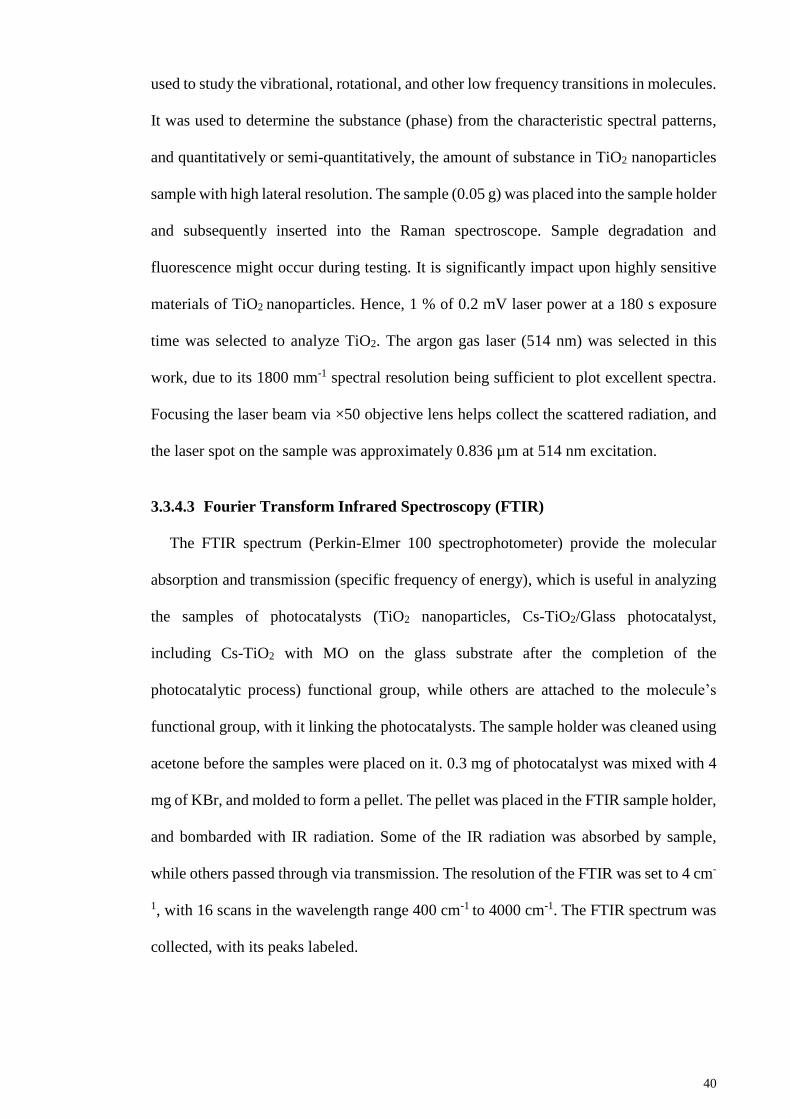
40
used to study the vibrational, rotational, and other low frequency transitions in molecules.
It was used to determine the substance (phase) from the characteristic spectral patterns,
and quantitatively or semi-quantitatively, the amount of substance in TiO2 nanoparticles
sample with high lateral resolution. The sample (0.05 g) was placed into the sample holder
and subsequently inserted into the Raman spectroscope. Sample degradation and
fluorescence might occur during testing. It is significantly impact upon highly sensitive
materials of TiO2 nanoparticles. Hence, 1 % of 0.2 mV laser power at a 180 s exposure
time was selected to analyze TiO2. The argon gas laser (514 nm) was selected in this
work, due to its 1800 mm-1 spectral resolution being sufficient to plot excellent spectra.
Focusing the laser beam via ×50 objective lens helps collect the scattered radiation, and
the laser spot on the sample was approximately 0.836 µm at 514 nm excitation.
3.3.4.3 Fourier Transform Infrared Spectroscopy (FTIR)
The FTIR spectrum (Perkin-Elmer 100 spectrophotometer) provide the molecular
absorption and transmission (specific frequency of energy), which is useful in analyzing
the samples of photocatalysts (TiO2 nanoparticles, Cs-TiO2/Glass photocatalyst,
including Cs-TiO2 with MO on the glass substrate after the completion of the
photocatalytic process) functional group, while others are attached to the molecule’s
functional group, with it linking the photocatalysts. The sample holder was cleaned using
acetone before the samples were placed on it. 0.3 mg of photocatalyst was mixed with 4
mg of KBr, and molded to form a pellet. The pellet was placed in the FTIR sample holder,
and bombarded with IR radiation. Some of the IR radiation was absorbed by sample,
while others passed through via transmission. The resolution of the FTIR was set to 4 cm-
1, with 16 scans in the wavelength range 400 cm-1 to 4000 cm-1. The FTIR spectrum was
collected, with its peaks labeled.
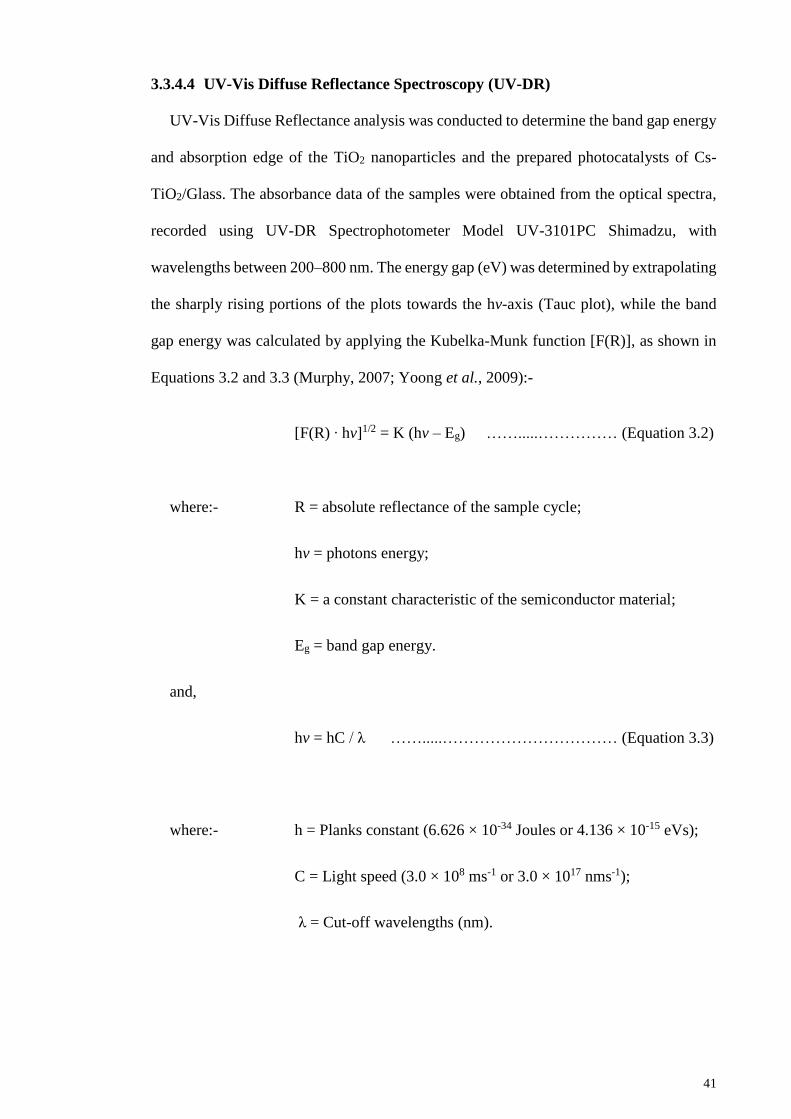
41
3.3.4.4 UV-Vis Diffuse Reflectance Spectroscopy (UV-DR)
UV-Vis Diffuse Reflectance analysis was conducted to determine the band gap energy
and absorption edge of the TiO2 nanoparticles and the prepared photocatalysts of Cs-
TiO2/Glass. The absorbance data of the samples were obtained from the optical spectra,
recorded using UV-DR Spectrophotometer Model UV-3101PC Shimadzu, with
wavelengths between 200–800 nm. The energy gap (eV) was determined by extrapolating
the sharply rising portions of the plots towards the hv-axis (Tauc plot), while the band
gap energy was calculated by applying the Kubelka-Munk function [F(R)], as shown in
Equations 3.2 and 3.3 (Murphy, 2007; Yoong et al., 2009):-
[F(R) ∙ hv]1/2 = K (hv – Eg) …….....…………… (Equation 3.2)
where:- R = absolute reflectance of the sample cycle;
hv = photons energy;
K = a constant characteristic of the semiconductor material;
Eg = band gap energy.
and,
hv = hC / λ …….....…………………………… (Equation 3.3)
where:- h = Planks constant (6.626 × 10⁻³⁴ Joules or 4.136 × 10⁻¹⁵ eVs);
C = Light speed (3.0 × 10⁸ ms-1 or 3.0 × 10¹⁷ nms-1);
λ = Cut-off wavelengths (nm).
42
3.3.4.5 High Resolution Transmission Electron Microscope (HR-TEM)
HR-TEM analysis was conducted using the JEM-2100F instrument at an accelerating
voltage of 200 kV. It has become a major support in the list of characterization techniques
for materials scientists, due to its capability in generating image and diffraction
information from the samples. Furthermore, the specified sample which is TiO2
nanoparticles could be characterized via radiation produced by beams of accelerated
electrons. It offers high magnification of up to 1.6 times, allowing us to observe extremely
small and tiny lattice-fringe spacing. Prior to the HR-TEM characterization, the TiO2
nanoparticles sample was prepared by titrating the dispersed that samples on 300 mesh
copper grids. The samples were prepared and left overnight to dry. The samples were then
placed into the HR-TEM sample holder prior to being inserted into the HR-TEM. Images
of TiO2 nanoparticles sample was selected and taken at 50,000, 100,000, and 500,000 ×
magnification. The size and lattice-fringe spacing was measured using image-J. The
particle size distribution was plotted after 20 particles of TiO2 nanoparticles sample was
measured, and the lattice-fringe spacing was used to support the results from XRD
analysis.
3.3.4.6 Field Emission Scanning Electron Microscopy (FESEM) + Energy
Dispersive Spectrometer (EDS)
The morphology of both TiO2 nanoparticles and Cs-TiO2/Glass photocatalyst were
investigated using Scanning Electron Microscope (JSM-7500F Jeol). First, the samples
of Cs-TiO2/Glass were sprayed with Platinum (Pt) prior to loading into the
instrumentation sample stage. After that, the prepared samples were then mounted on the
sample holder using double-sided electrically conducting carbon adhesive tapes to
prevent surface charge on the specimens when exposed to the electron beam. The fracture
surfaces of the photocatalyst sample on the glass substrate were sputtered with Pt prior to
morphological observation to prevent charging during imaging. However, for TiO2
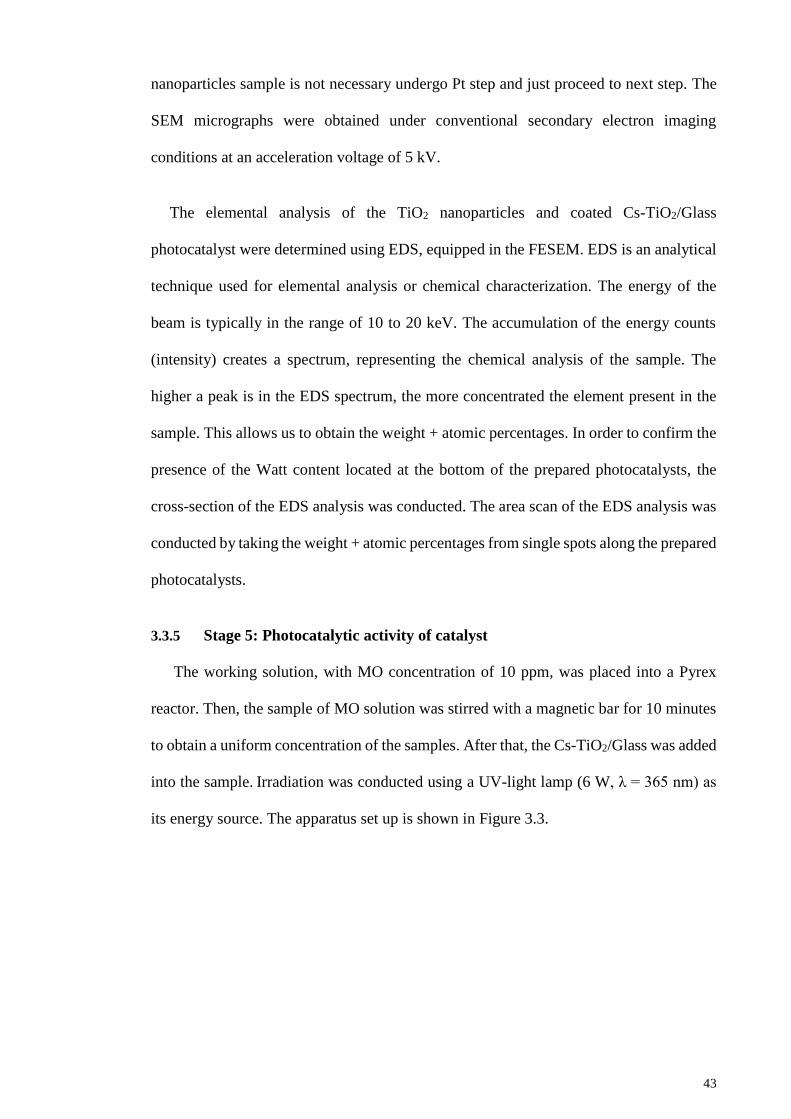
43
nanoparticles sample is not necessary undergo Pt step and just proceed to next step. The
SEM micrographs were obtained under conventional secondary electron imaging
conditions at an acceleration voltage of 5 kV.
The elemental analysis of the TiO2 nanoparticles and coated Cs-TiO2/Glass
photocatalyst were determined using EDS, equipped in the FESEM. EDS is an analytical
technique used for elemental analysis or chemical characterization. The energy of the
beam is typically in the range of 10 to 20 keV. The accumulation of the energy counts
(intensity) creates a spectrum, representing the chemical analysis of the sample. The
higher a peak is in the EDS spectrum, the more concentrated the element present in the
sample. This allows us to obtain the weight + atomic percentages. In order to confirm the
presence of the Watt content located at the bottom of the prepared photocatalysts, the
cross-section of the EDS analysis was conducted. The area scan of the EDS analysis was
conducted by taking the weight + atomic percentages from single spots along the prepared
photocatalysts.
3.3.5 Stage 5: Photocatalytic activity of catalyst
The working solution, with MO concentration of 10 ppm, was placed into a Pyrex
reactor. Then, the sample of MO solution was stirred with a magnetic bar for 10 minutes
to obtain a uniform concentration of the samples. After that, the Cs-TiO2/Glass was added
into the sample. Irradiation was conducted using a UV-light lamp (6 W, λ = 365 nm) as
its energy source. The apparatus set up is shown in Figure 3.3.
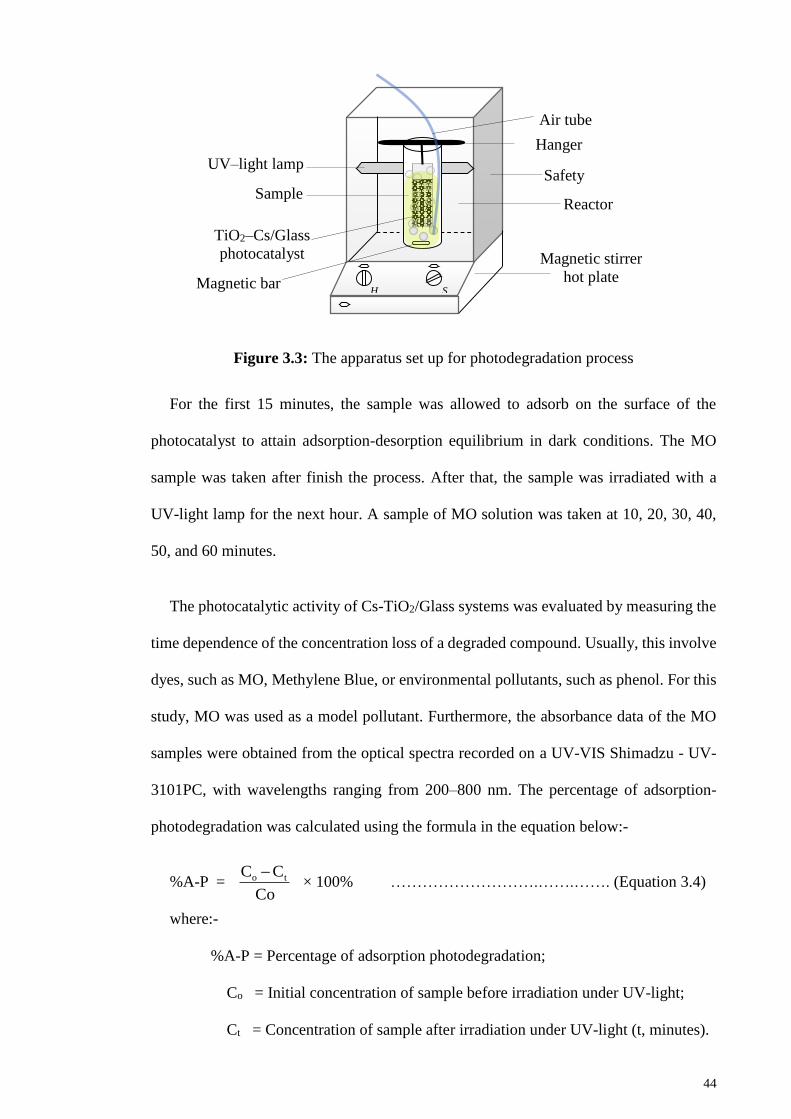
44
Figure 3.3: The apparatus set up for photodegradation process
For the first 15 minutes, the sample was allowed to adsorb on the surface of the
photocatalyst to attain adsorption-desorption equilibrium in dark conditions. The MO
sample was taken after finish the process. After that, the sample was irradiated with a
UV-light lamp for the next hour. A sample of MO solution was taken at 10, 20, 30, 40,
50, and 60 minutes.
The photocatalytic activity of Cs-TiO2/Glass systems was evaluated by measuring the
time dependence of the concentration loss of a degraded compound. Usually, this involve
dyes, such as MO, Methylene Blue, or environmental pollutants, such as phenol. For this
study, MO was used as a model pollutant. Furthermore, the absorbance data of the MO
samples were obtained from the optical spectra recorded on a UV-VIS Shimadzu - UV-
3101PC, with wavelengths ranging from 200–800 nm. The percentage of adsorption-
photodegradation was calculated using the formula in the equation below:-
%A-P = × 100% ……………………….…….……. (Equation 3.4)
where:-
%A-P = Percentage of adsorption photodegradation;
Co = Initial concentration of sample before irradiation under UV-light;
Ct = Concentration of sample after irradiation under UV-light (t, minutes).
Safety
Reactor
Magnetic stirrer
hot plate
UV–light lamp
Sample
Magnetic bar
TiO2–Cs/Glass
photocatalyst
H S
Hanger
Air tube
Co
CC to
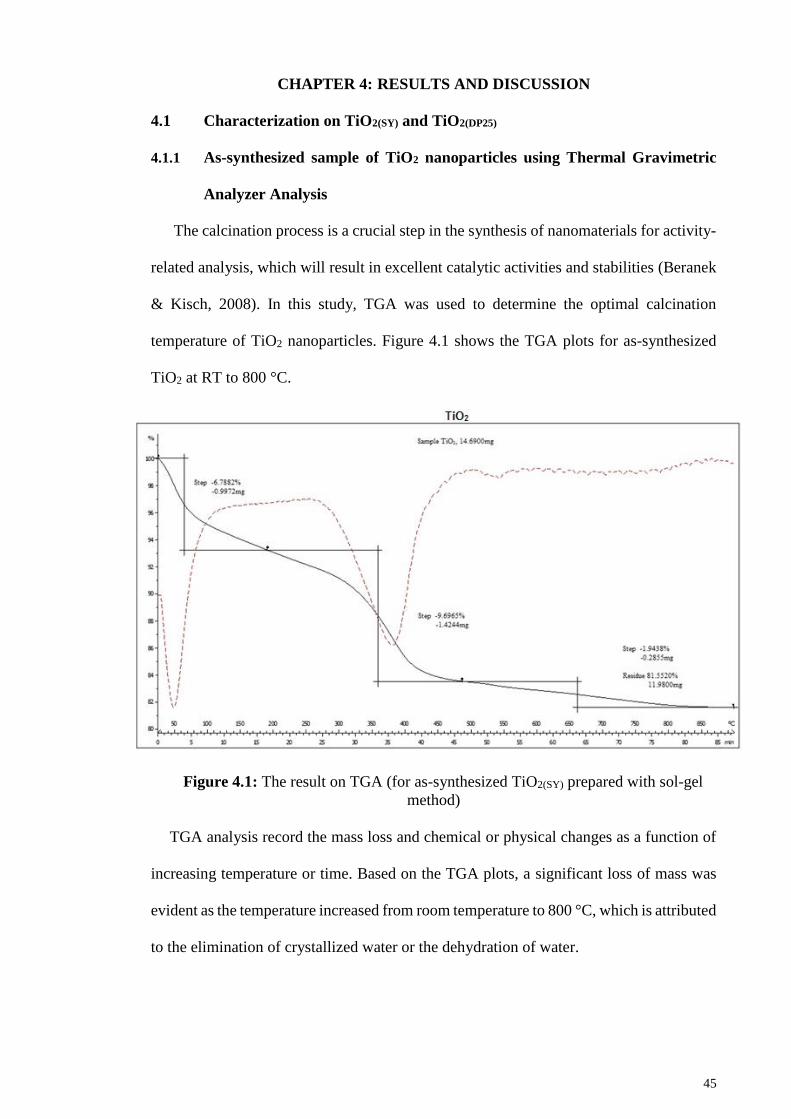
45
CHAPTER 4: RESULTS AND DISCUSSION
4.1 Characterization on TiO2(SY) and TiO2(DP25)
4.1.1 As-synthesized sample of TiO2 nanoparticles using Thermal Gravimetric
Analyzer Analysis
The calcination process is a crucial step in the synthesis of nanomaterials for activity-
related analysis, which will result in excellent catalytic activities and stabilities (Beranek
& Kisch, 2008). In this study, TGA was used to determine the optimal calcination
temperature of TiO2 nanoparticles. Figure 4.1 shows the TGA plots for as-synthesized
TiO2 at RT to 800 °C.
Figure 4.1: The result on TGA (for as-synthesized TiO2(SY) prepared with sol-gel
method)
TGA analysis record the mass loss and chemical or physical changes as a function of
increasing temperature or time. Based on the TGA plots, a significant loss of mass was
evident as the temperature increased from room temperature to 800 °C, which is attributed
to the elimination of crystallized water or the dehydration of water.
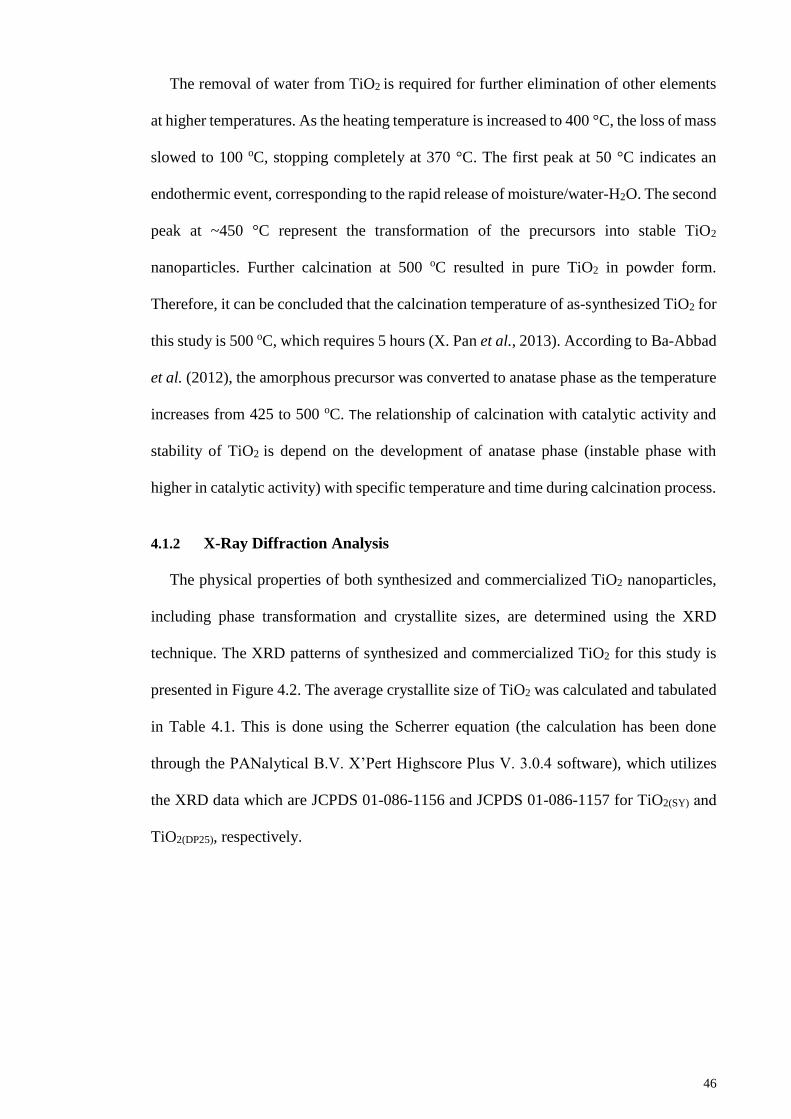
46
The removal of water from TiO2 is required for further elimination of other elements
at higher temperatures. As the heating temperature is increased to 400 °C, the loss of mass
slowed to 100 oC, stopping completely at 370 °C. The first peak at 50 °C indicates an
endothermic event, corresponding to the rapid release of moisture/water-H2O. The second
peak at ~450 °C represent the transformation of the precursors into stable TiO2
nanoparticles. Further calcination at 500 oC resulted in pure TiO2 in powder form.
Therefore, it can be concluded that the calcination temperature of as-synthesized TiO2 for
this study is 500 oC, which requires 5 hours (X. Pan et al., 2013). According to Ba-Abbad
et al. (2012), the amorphous precursor was converted to anatase phase as the temperature
increases from 425 to 500 oC. The relationship of calcination with catalytic activity and
stability of TiO2 is depend on the development of anatase phase (instable phase with
higher in catalytic activity) with specific temperature and time during calcination process.
4.1.2 X-Ray Diffraction Analysis
The physical properties of both synthesized and commercialized TiO2 nanoparticles,
including phase transformation and crystallite sizes, are determined using the XRD
technique. The XRD patterns of synthesized and commercialized TiO2 for this study is
presented in Figure 4.2. The average crystallite size of TiO2 was calculated and tabulated
in Table 4.1. This is done using the Scherrer equation (the calculation has been done
through the PANalytical B.V. X’Pert Highscore Plus V. 3.0.4 software), which utilizes
the XRD data which are JCPDS 01-086-1156 and JCPDS 01-086-1157 for TiO2(SY) and
TiO2(DP25), respectively.
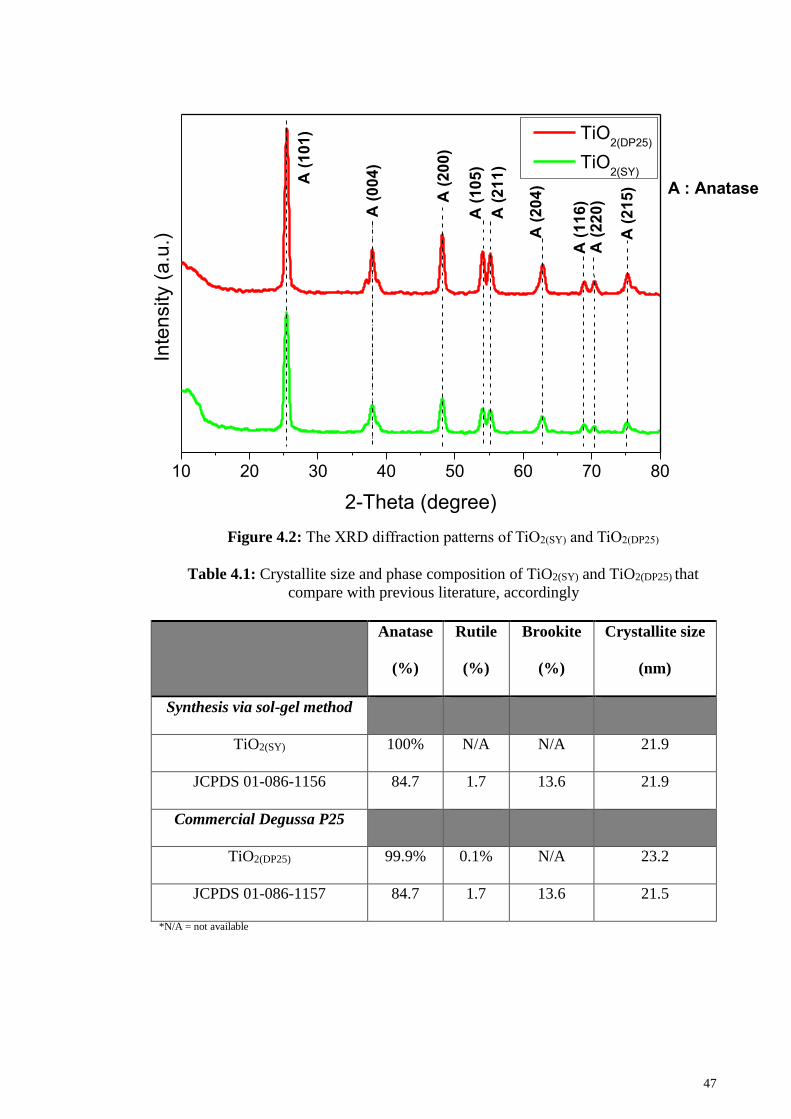
47
Figure 4.2: The XRD diffraction patterns of TiO2(SY) and TiO2(DP25)
Table 4.1: Crystallite size and phase composition of TiO2(SY) and TiO2(DP25) that
compare with previous literature, accordingly
Anatase
(%)
Rutile
(%)
Brookite
(%)
Crystallite size
(nm)
Synthesis via sol-gel method
TiO2(SY) 100% N/A N/A 21.9
JCPDS 01-086-1156 84.7 1.7 13.6 21.9
Commercial Degussa P25
TiO2(DP25) 99.9% 0.1% N/A 23.2
JCPDS 01-086-1157 84.7 1.7 13.6 21.5
*N/A = not available
10 20 30 40 50 60 70 80
A (
21
5)
A (
22
0)
A (
11
6)
A (
20
4)
A (
21
1)
A (
10
5)
A (
10
1)
Inte
nsity (
a.u
.)
2-Theta (degree)
TiO2(DP25)
TiO2(SY)
A (
20
0)
A (
00
4)
A : Anatase
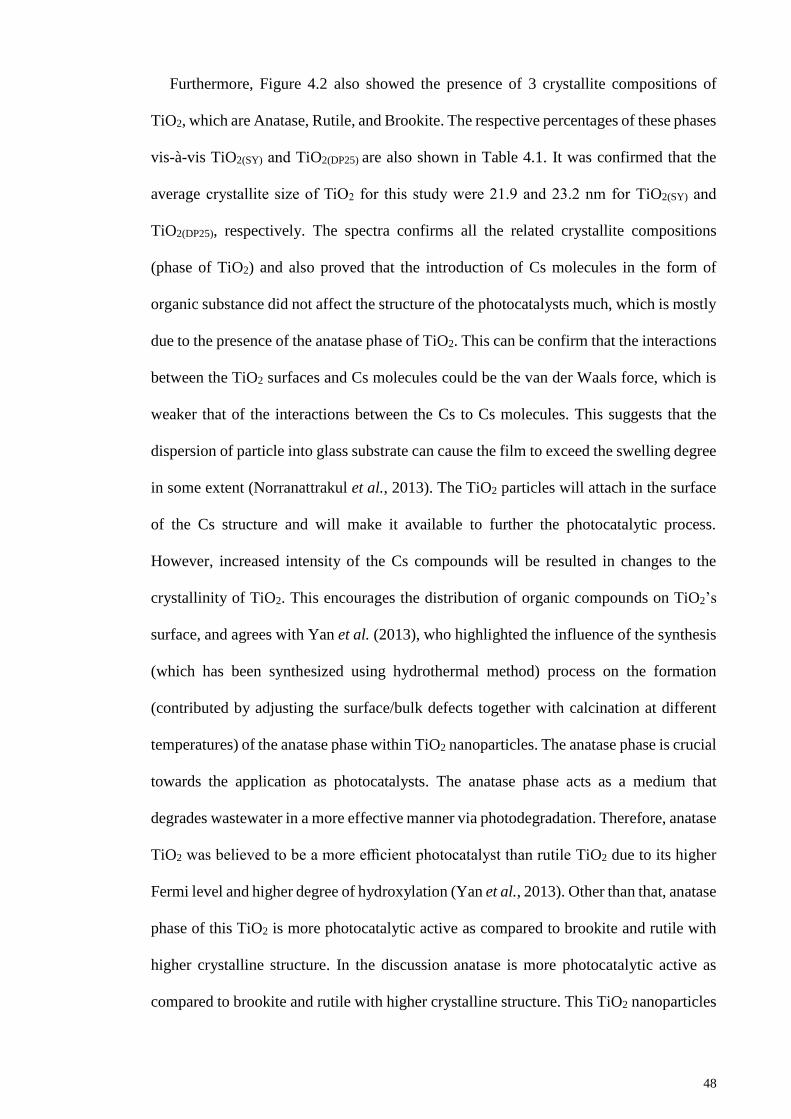
48
Furthermore, Figure 4.2 also showed the presence of 3 crystallite compositions of
TiO2, which are Anatase, Rutile, and Brookite. The respective percentages of these phases
vis-à-vis TiO2(SY) and TiO2(DP25) are also shown in Table 4.1. It was confirmed that the
average crystallite size of TiO2 for this study were 21.9 and 23.2 nm for TiO2(SY) and
TiO2(DP25), respectively. The spectra confirms all the related crystallite compositions
(phase of TiO2) and also proved that the introduction of Cs molecules in the form of
organic substance did not affect the structure of the photocatalysts much, which is mostly
due to the presence of the anatase phase of TiO2. This can be confirm that the interactions
between the TiO2 surfaces and Cs molecules could be the van der Waals force, which is
weaker that of the interactions between the Cs to Cs molecules. This suggests that the
dispersion of particle into glass substrate can cause the film to exceed the swelling degree
in some extent (Norranattrakul et al., 2013). The TiO2 particles will attach in the surface
of the Cs structure and will make it available to further the photocatalytic process.
However, increased intensity of the Cs compounds will be resulted in changes to the
crystallinity of TiO2. This encourages the distribution of organic compounds on TiO2’s
surface, and agrees with Yan et al. (2013), who highlighted the influence of the synthesis
(which has been synthesized using hydrothermal method) process on the formation
(contributed by adjusting the surface/bulk defects together with calcination at different
temperatures) of the anatase phase within TiO2 nanoparticles. The anatase phase is crucial
towards the application as photocatalysts. The anatase phase acts as a medium that
degrades wastewater in a more effective manner via photodegradation. Therefore, anatase
TiO2 was believed to be a more efficient photocatalyst than rutile TiO2 due to its higher
Fermi level and higher degree of hydroxylation (Yan et al., 2013). Other than that, anatase
phase of this TiO2 is more photocatalytic active as compared to brookite and rutile with
higher crystalline structure. In the discussion anatase is more photocatalytic active as
compared to brookite and rutile with higher crystalline structure. This TiO2 nanoparticles
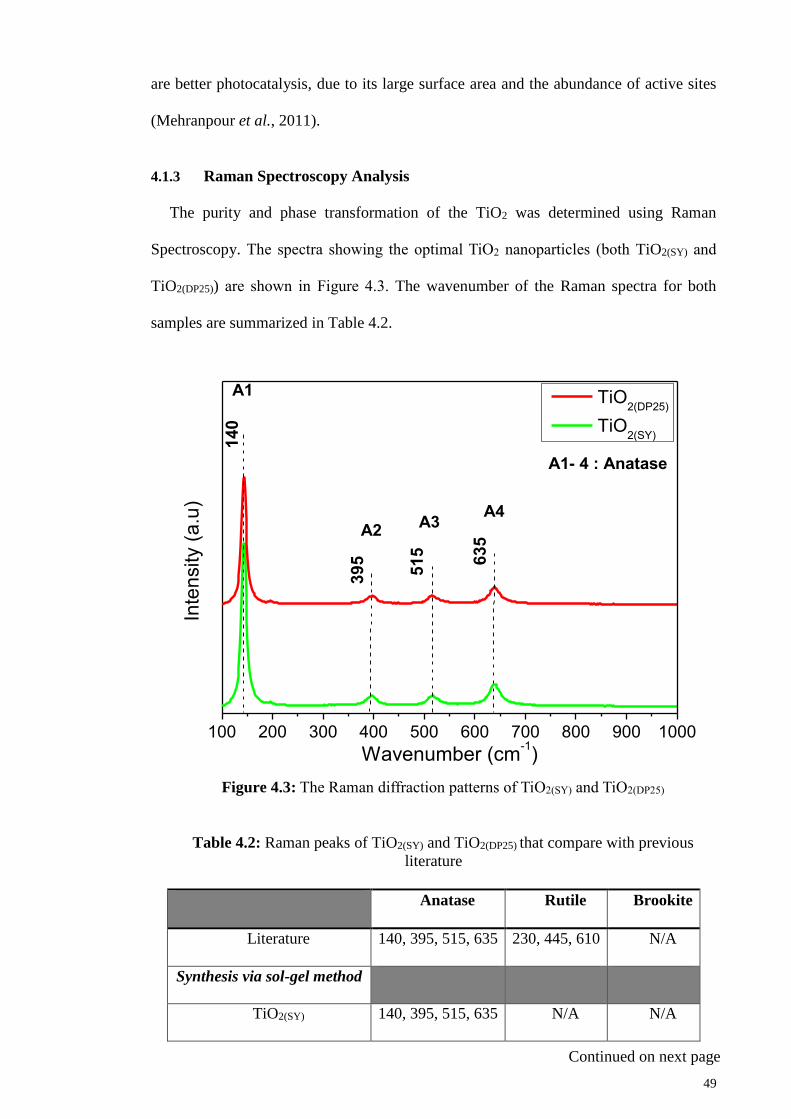
49
Continued on next page
are better photocatalysis, due to its large surface area and the abundance of active sites
(Mehranpour et al., 2011).
4.1.3 Raman Spectroscopy Analysis
The purity and phase transformation of the TiO2 was determined using Raman
Spectroscopy. The spectra showing the optimal TiO2 nanoparticles (both TiO2(SY) and
TiO2(DP25)) are shown in Figure 4.3. The wavenumber of the Raman spectra for both
samples are summarized in Table 4.2.
Figure 4.3: The Raman diffraction patterns of TiO2(SY) and TiO2(DP25)
Table 4.2: Raman peaks of TiO2(SY) and TiO2(DP25) that compare with previous
literature
Anatase Rutile Brookite
Literature 140, 395, 515, 635 230, 445, 610 N/A
Synthesis via sol-gel method
TiO2(SY) 140, 395, 515, 635 N/A N/A
100 200 300 400 500 600 700 800 900 1000
A4A3
A2
635
515
395
140
Inte
nsity (
a.u
)
Wavenumber (cm-1)
TiO2(DP25)
TiO2(SY)
A1
A1- 4 : Anatase
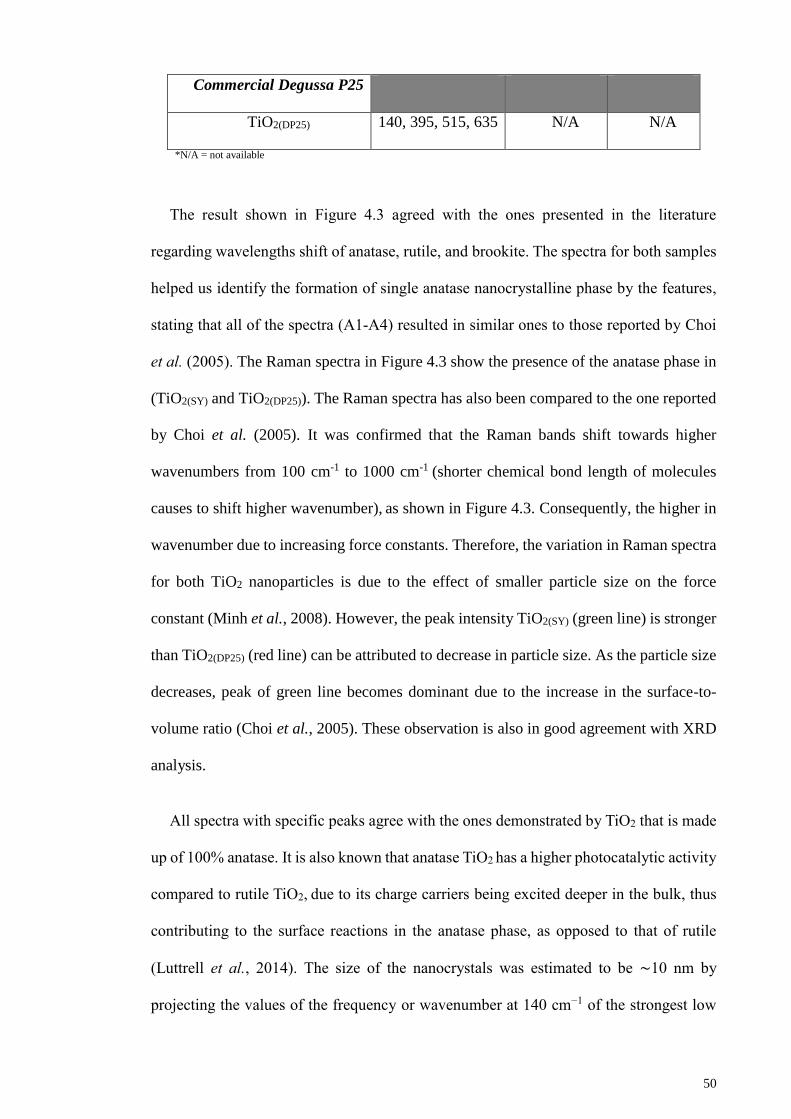
50
Commercial Degussa P25
TiO2(DP25) 140, 395, 515, 635 N/A N/A
*N/A = not available
The result shown in Figure 4.3 agreed with the ones presented in the literature
regarding wavelengths shift of anatase, rutile, and brookite. The spectra for both samples
helped us identify the formation of single anatase nanocrystalline phase by the features,
stating that all of the spectra (A1-A4) resulted in similar ones to those reported by Choi
et al. (2005). The Raman spectra in Figure 4.3 show the presence of the anatase phase in
(TiO2(SY) and TiO2(DP25)). The Raman spectra has also been compared to the one reported
by Choi et al. (2005). It was confirmed that the Raman bands shift towards higher
wavenumbers from 100 cm-1 to 1000 cm-1 (shorter chemical bond length of molecules
causes to shift higher wavenumber), as shown in Figure 4.3. Consequently, the higher in
wavenumber due to increasing force constants. Therefore, the variation in Raman spectra
for both TiO2 nanoparticles is due to the effect of smaller particle size on the force
constant (Minh et al., 2008). However, the peak intensity TiO2(SY) (green line) is stronger
than TiO2(DP25) (red line) can be attributed to decrease in particle size. As the particle size
decreases, peak of green line becomes dominant due to the increase in the surface-to-
volume ratio (Choi et al., 2005). These observation is also in good agreement with XRD
analysis.
All spectra with specific peaks agree with the ones demonstrated by TiO2 that is made
up of 100% anatase. It is also known that anatase TiO2 has a higher photocatalytic activity
compared to rutile TiO2, due to its charge carriers being excited deeper in the bulk, thus
contributing to the surface reactions in the anatase phase, as opposed to that of rutile
(Luttrell et al., 2014). The size of the nanocrystals was estimated to be ∼10 nm by
projecting the values of the frequency or wavenumber at 140 cm−1 of the strongest low
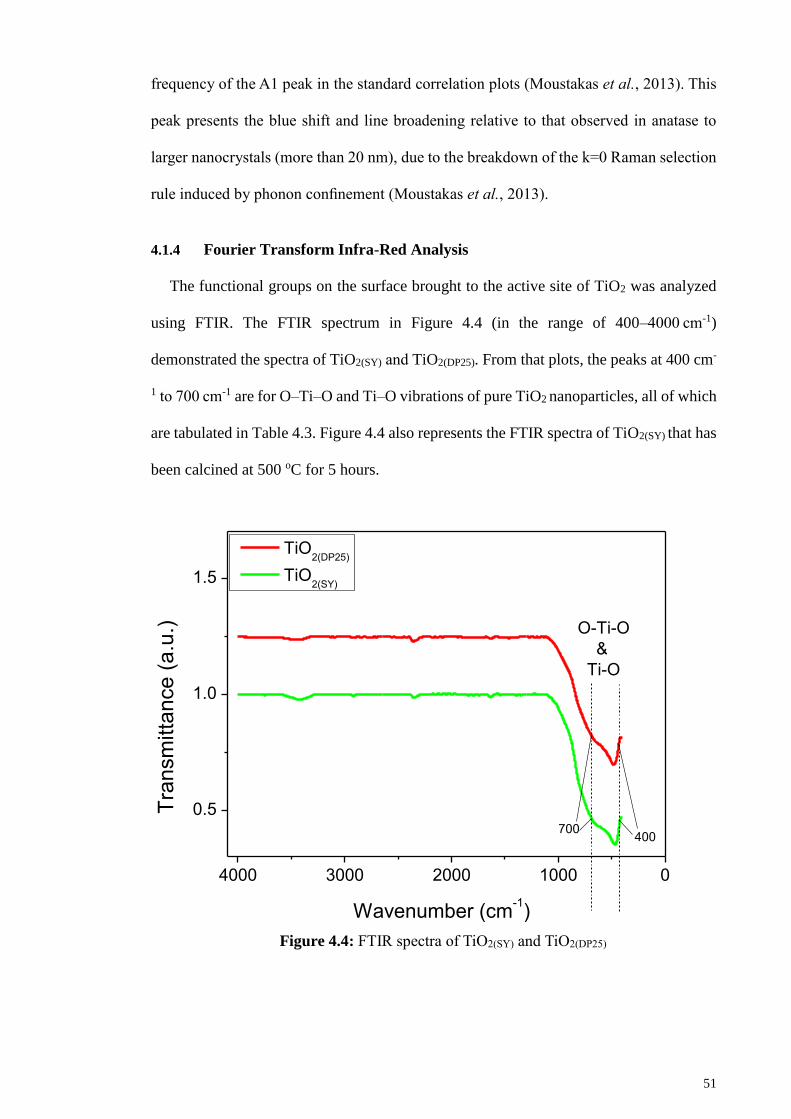
51
frequency of the A1 peak in the standard correlation plots (Moustakas et al., 2013). This
peak presents the blue shift and line broadening relative to that observed in anatase to
larger nanocrystals (more than 20 nm), due to the breakdown of the k=0 Raman selection
rule induced by phonon confinement (Moustakas et al., 2013).
4.1.4 Fourier Transform Infra-Red Analysis
The functional groups on the surface brought to the active site of TiO2 was analyzed
using FTIR. The FTIR spectrum in Figure 4.4 (in the range of 400–4000 cm-1)
demonstrated the spectra of TiO2(SY) and TiO2(DP25). From that plots, the peaks at 400 cm-
1 to 700 cm-1 are for O–Ti–O and Ti–O vibrations of pure TiO2 nanoparticles, all of which
are tabulated in Table 4.3. Figure 4.4 also represents the FTIR spectra of TiO2(SY) that has
been calcined at 500 oC for 5 hours.
Figure 4.4: FTIR spectra of TiO2(SY) and TiO2(DP25)
4000 3000 2000 1000 0
0.5
1.0
1.5
TiO2(DP25)
TiO2(SY)
Tra
nsm
itta
nce
(a
.u.)
Wavenumber (cm-1)
700
O-Ti-O
&
Ti-O
400
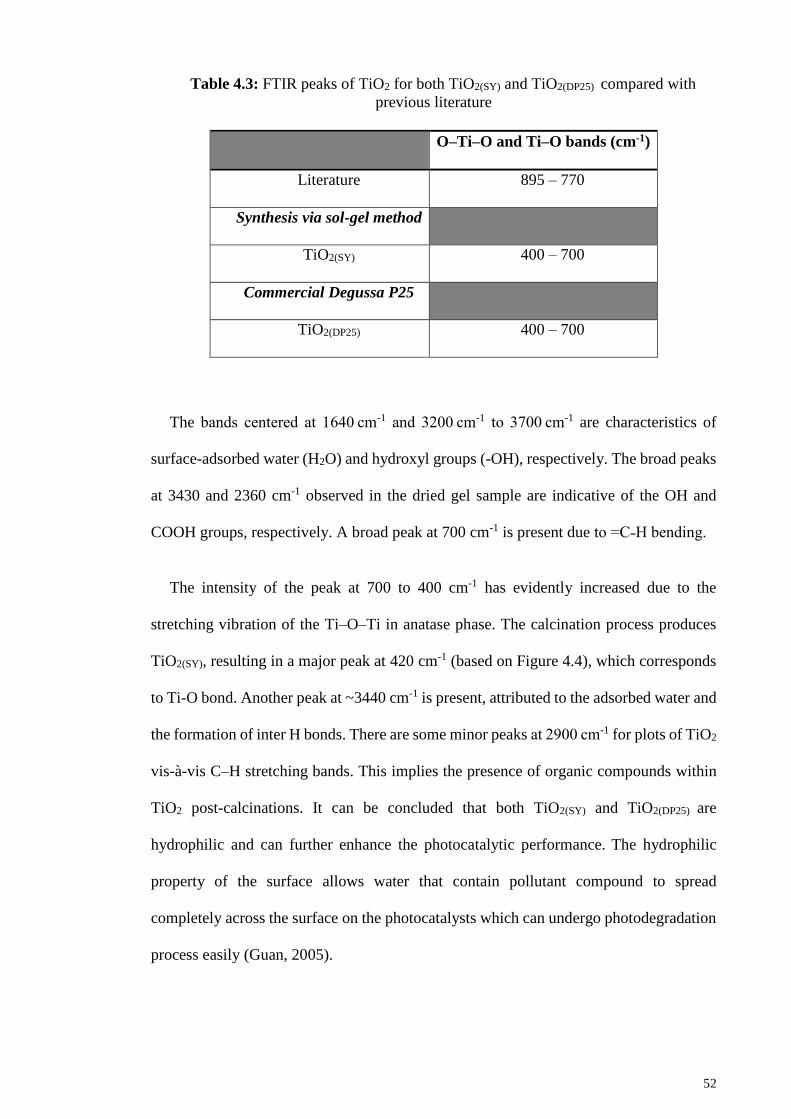
52
Table 4.3: FTIR peaks of TiO2 for both TiO2(SY) and TiO2(DP25) compared with
previous literature
O–Ti–O and Ti–O bands (cm-1)
Literature 895 – 770
Synthesis via sol-gel method
TiO2(SY) 400 – 700
Commercial Degussa P25
TiO2(DP25) 400 – 700
The bands centered at 1640 cm-1 and 3200 cm-1 to 3700 cm-1 are characteristics of
surface-adsorbed water (H2O) and hydroxyl groups (-OH), respectively. The broad peaks
at 3430 and 2360 cm-1 observed in the dried gel sample are indicative of the OH and
COOH groups, respectively. A broad peak at 700 cm-1 is present due to =C˗H bending.
The intensity of the peak at 700 to 400 cm-1 has evidently increased due to the
stretching vibration of the Ti–O–Ti in anatase phase. The calcination process produces
TiO2(SY), resulting in a major peak at 420 cm-1 (based on Figure 4.4), which corresponds
to Ti-O bond. Another peak at ~3440 cm-1 is present, attributed to the adsorbed water and
the formation of inter H bonds. There are some minor peaks at 2900 cm-1 for plots of TiO2
vis-à-vis C–H stretching bands. This implies the presence of organic compounds within
TiO2 post-calcinations. It can be concluded that both TiO2(SY) and TiO2(DP25) are
hydrophilic and can further enhance the photocatalytic performance. The hydrophilic
property of the surface allows water that contain pollutant compound to spread
completely across the surface on the photocatalysts which can undergo photodegradation
process easily (Guan, 2005).
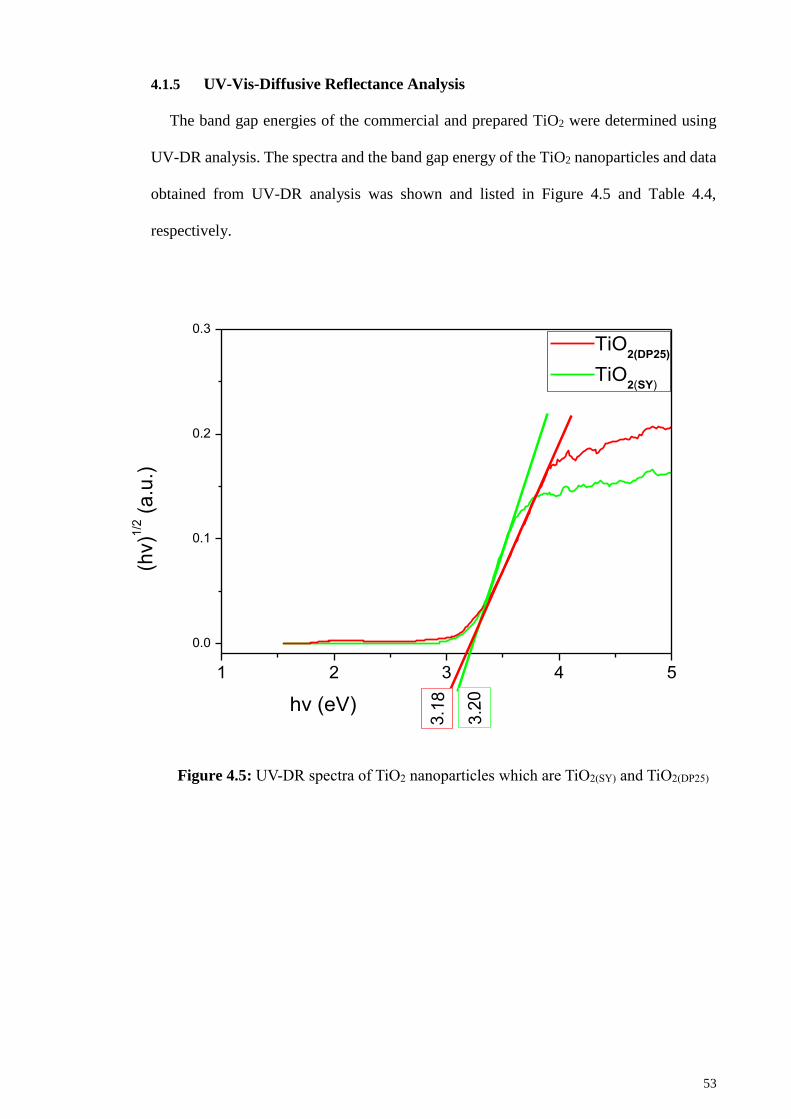
53
4.1.5 UV-Vis-Diffusive Reflectance Analysis
The band gap energies of the commercial and prepared TiO2 were determined using
UV-DR analysis. The spectra and the band gap energy of the TiO2 nanoparticles and data
obtained from UV-DR analysis was shown and listed in Figure 4.5 and Table 4.4,
respectively.
Figure 4.5: UV-DR spectra of TiO2 nanoparticles which are TiO2(SY) and TiO2(DP25)
1 2 3 4 5
0.0
0.1
0.2
0.3
hv (eV)
TiO2(DP25)
TiO2(SY)
3.1
8
3.2
0
(hv)1
/2 (
a.u
.)
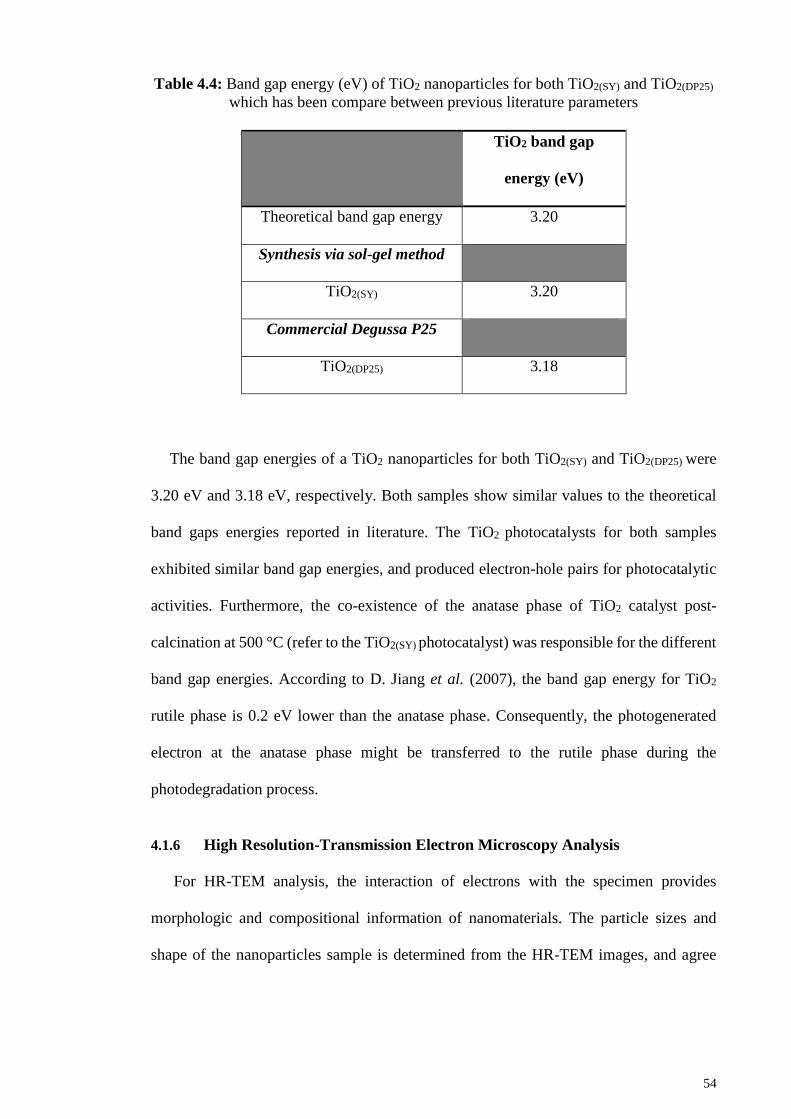
54
Table 4.4: Band gap energy (eV) of TiO2 nanoparticles for both TiO2(SY) and TiO2(DP25)
which has been compare between previous literature parameters
TiO2 band gap
energy (eV)
Theoretical band gap energy 3.20
Synthesis via sol-gel method
TiO2(SY) 3.20
Commercial Degussa P25
TiO2(DP25) 3.18
The band gap energies of a TiO2 nanoparticles for both TiO2(SY) and TiO2(DP25) were
3.20 eV and 3.18 eV, respectively. Both samples show similar values to the theoretical
band gaps energies reported in literature. The TiO2 photocatalysts for both samples
exhibited similar band gap energies, and produced electron-hole pairs for photocatalytic
activities. Furthermore, the co-existence of the anatase phase of TiO2 catalyst post-
calcination at 500 °C (refer to the TiO2(SY) photocatalyst) was responsible for the different
band gap energies. According to D. Jiang et al. (2007), the band gap energy for TiO2
rutile phase is 0.2 eV lower than the anatase phase. Consequently, the photogenerated
electron at the anatase phase might be transferred to the rutile phase during the
photodegradation process.
4.1.6 High Resolution-Transmission Electron Microscopy Analysis
For HR-TEM analysis, the interaction of electrons with the specimen provides
morphologic and compositional information of nanomaterials. The particle sizes and
shape of the nanoparticles sample is determined from the HR-TEM images, and agree
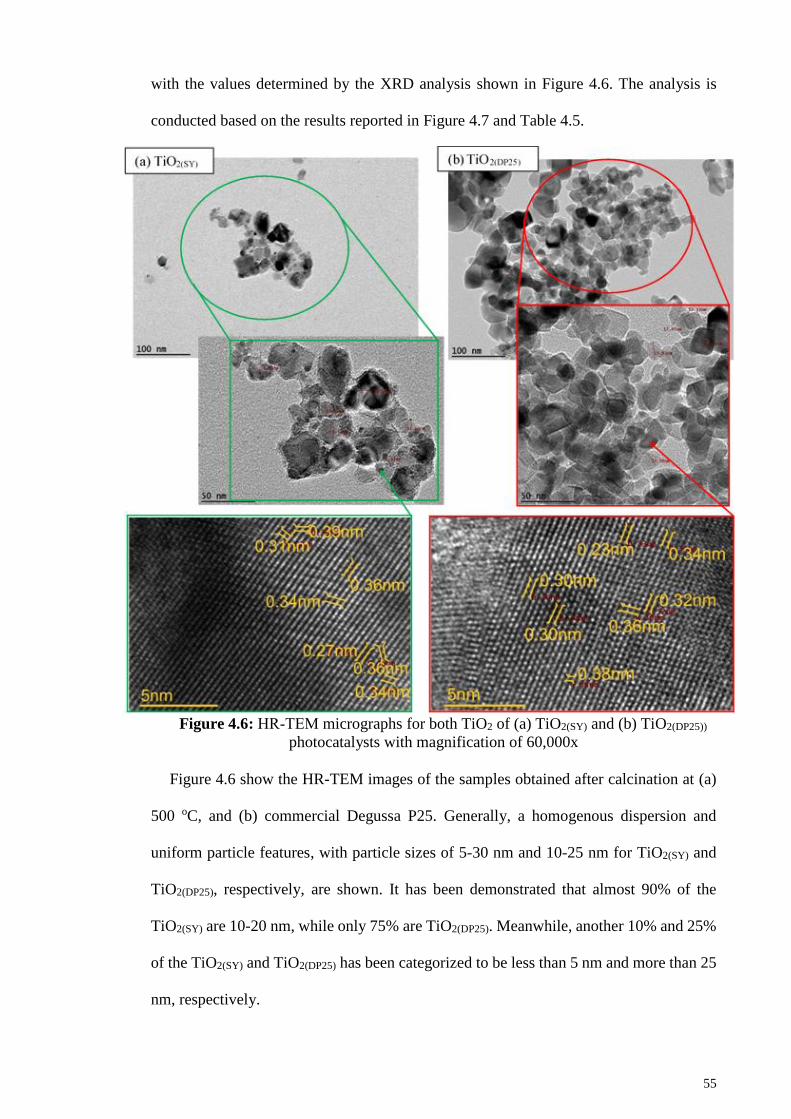
55
with the values determined by the XRD analysis shown in Figure 4.6. The analysis is
conducted based on the results reported in Figure 4.7 and Table 4.5.
Figure 4.6: HR-TEM micrographs for both TiO2 of (a) TiO2(SY) and (b) TiO2(DP25))
photocatalysts with magnification of 60,000x
Figure 4.6 show the HR-TEM images of the samples obtained after calcination at (a)
500 oC, and (b) commercial Degussa P25. Generally, a homogenous dispersion and
uniform particle features, with particle sizes of 5-30 nm and 10-25 nm for TiO2(SY) and
TiO2(DP25), respectively, are shown. It has been demonstrated that almost 90% of the
TiO2(SY) are 10-20 nm, while only 75% are TiO2(DP25). Meanwhile, another 10% and 25%
of the TiO2(SY) and TiO2(DP25) has been categorized to be less than 5 nm and more than 25
nm, respectively.
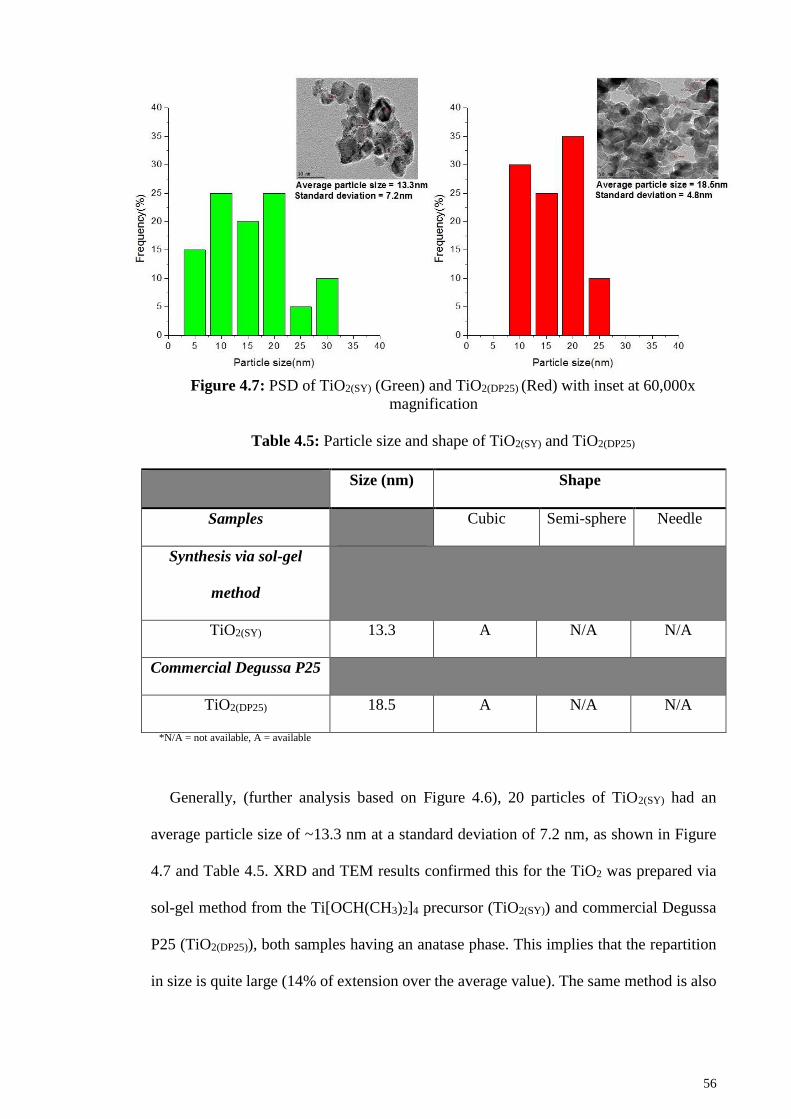
56
Figure 4.7: PSD of TiO2(SY) (Green) and TiO2(DP25) (Red) with inset at 60,000x
magnification
Table 4.5: Particle size and shape of TiO2(SY) and TiO2(DP25)
Size (nm) Shape
Samples Cubic Semi-sphere Needle
Synthesis via sol-gel
method
TiO2(SY) 13.3 A N/A N/A
Commercial Degussa P25
TiO2(DP25) 18.5 A N/A N/A
*N/A = not available, A = available
Generally, (further analysis based on Figure 4.6), 20 particles of TiO2(SY) had an
average particle size of ~13.3 nm at a standard deviation of 7.2 nm, as shown in Figure
4.7 and Table 4.5. XRD and TEM results confirmed this for the TiO2 was prepared via
sol-gel method from the Ti[OCH(CH3)2]4 precursor (TiO2(SY)) and commercial Degussa
P25 (TiO2(DP25)), both samples having an anatase phase. This implies that the repartition
in size is quite large (14% of extension over the average value). The same method is also
57
used for TiO2(DP25), resulting in a Gaussian and the average particle size of ~18.5 nm, with
a standard deviation of 4.8 nm and an extension of 18%.
Figure 4.8: The structure of the octahedrally coordinated of anatase TiO2. Cyan and
red spheres are representing Ti and O atoms, respectively.
However, there might be some aggregation due to the nanosized particles. Allen and
Smith (2001) posited that the Van der Waals forces are not negligible in this case, and the
attraction between particles via their respective polar groups is enough to precipitate
agglomeration, as illustrated in Figure 4.8. This makes it difficult to identify the particles,
and deviate the real size distribution. The accuracy of the values obtained for the
equivalent diameter and from factor is quite considerable. It can therefore be concluded
that TiO2(DP25) have a more homogenous and uniform particle size distribution compared
to TiO2(SY), due to the agglomeration in TiO2(SY), resulting in inhomogeneity of the
particle size and its corresponding distribution. This might be related to the sol-gel
synthesis method being applied, where the nucleation of TiO2 is controlled by increasing
the solutions’ temperature, precursor used during synthesis (TTIP), and pH (that can
excite higher super-saturation), which results in shorter induction time for nucleation and
a faster growth rate (Mehranpour et al., 2011). A homogenous and uniform particle size
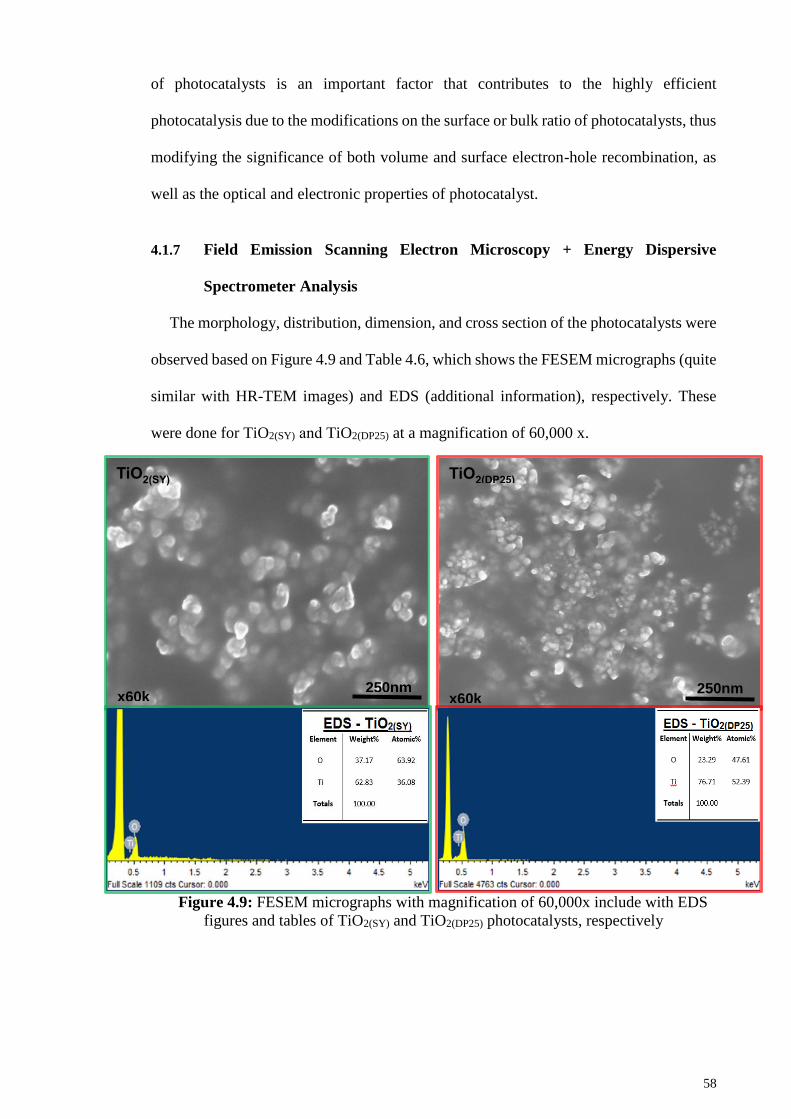
58
of photocatalysts is an important factor that contributes to the highly efficient
photocatalysis due to the modifications on the surface or bulk ratio of photocatalysts, thus
modifying the significance of both volume and surface electron-hole recombination, as
well as the optical and electronic properties of photocatalyst.
4.1.7 Field Emission Scanning Electron Microscopy + Energy Dispersive
Spectrometer Analysis
The morphology, distribution, dimension, and cross section of the photocatalysts were
observed based on Figure 4.9 and Table 4.6, which shows the FESEM micrographs (quite
similar with HR-TEM images) and EDS (additional information), respectively. These
were done for TiO2(SY) and TiO2(DP25) at a magnification of 60,000 x.
Figure 4.9: FESEM micrographs with magnification of 60,000x include with EDS
figures and tables of TiO2(SY) and TiO2(DP25) photocatalysts, respectively
TiO2(SY)
250nm x60k
TiO2(DP25)
250nm x60k
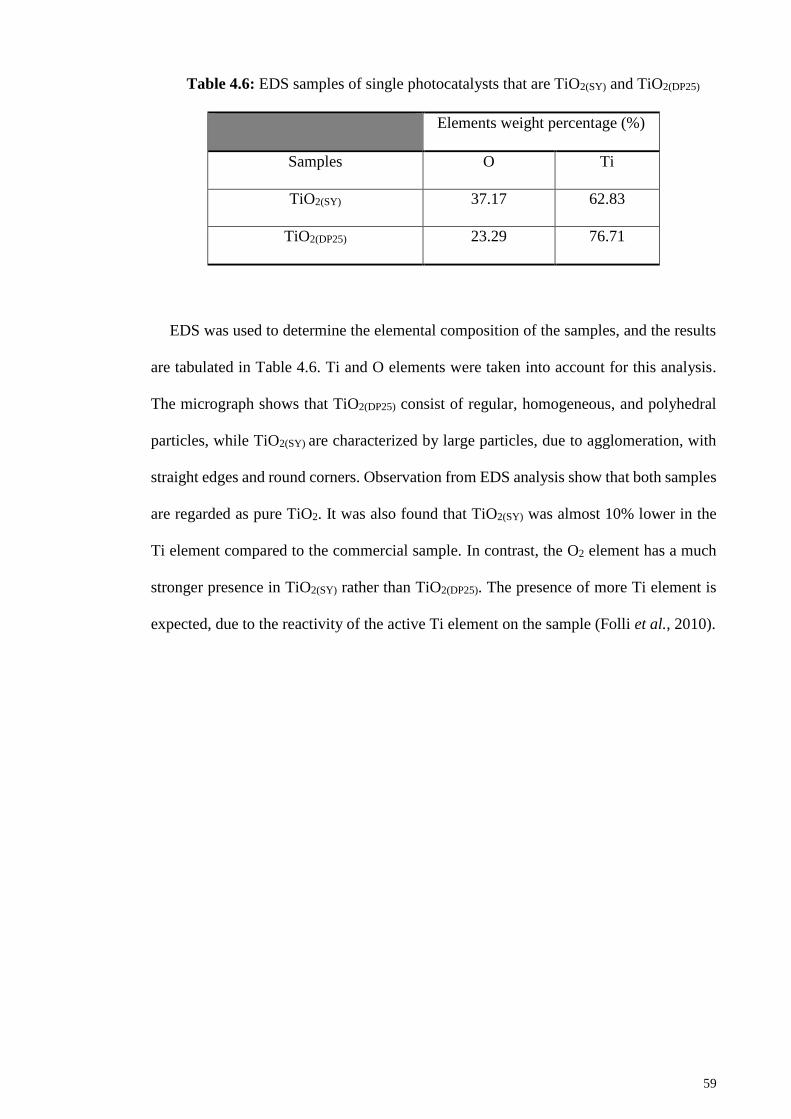
59
Table 4.6: EDS samples of single photocatalysts that are TiO2(SY) and TiO2(DP25)
Elements weight percentage (%)
Samples O Ti
TiO2(SY) 37.17 62.83
TiO2(DP25) 23.29 76.71
EDS was used to determine the elemental composition of the samples, and the results
are tabulated in Table 4.6. Ti and O elements were taken into account for this analysis.
The micrograph shows that TiO2(DP25) consist of regular, homogeneous, and polyhedral
particles, while TiO2(SY) are characterized by large particles, due to agglomeration, with
straight edges and round corners. Observation from EDS analysis show that both samples
are regarded as pure TiO2. It was also found that TiO2(SY) was almost 10% lower in the
Ti element compared to the commercial sample. In contrast, the O2 element has a much
stronger presence in TiO2(SY) rather than TiO2(DP25). The presence of more Ti element is
expected, due to the reactivity of the active Ti element on the sample (Folli et al., 2010).
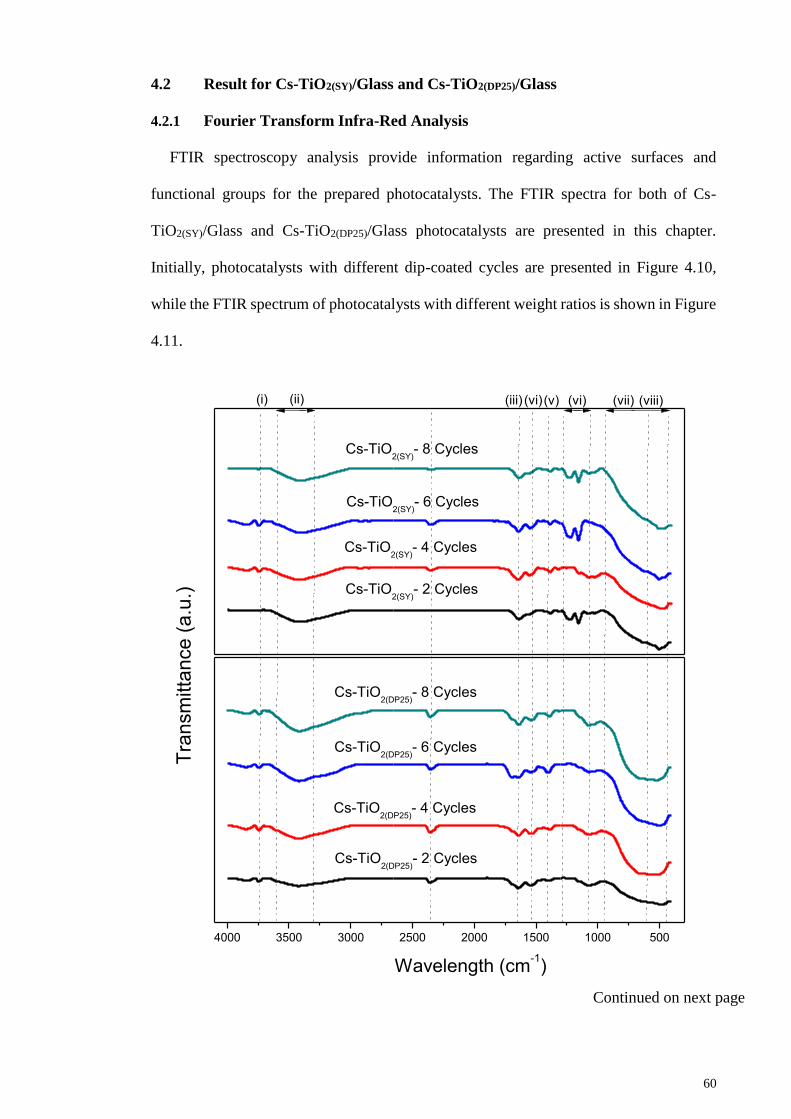
60
4.2 Result for Cs-TiO2(SY)/Glass and Cs-TiO2(DP25)/Glass
4.2.1 Fourier Transform Infra-Red Analysis
FTIR spectroscopy analysis provide information regarding active surfaces and
functional groups for the prepared photocatalysts. The FTIR spectra for both of Cs-
TiO2(SY)/Glass and Cs-TiO2(DP25)/Glass photocatalysts are presented in this chapter.
Initially, photocatalysts with different dip-coated cycles are presented in Figure 4.10,
while the FTIR spectrum of photocatalysts with different weight ratios is shown in Figure
4.11.
Continued on next page
4000 3500 3000 2500 2000 1500 1000 500
(ii)
Cs-TiO2(SY)
- 8 Cycles
Cs-TiO2(SY)
- 4 Cycles
Cs-TiO2(SY)
- 2 Cycles
(i)
Cs-TiO2(DP25)
- 8 Cycles
Cs-TiO2(DP25)
- 6 Cycles
Cs-TiO2(DP25)
- 4 Cycles
Cs-TiO2(DP25)
- 2 Cycles
Wavelength (cm-1)
Tra
nsm
itta
nce
(a
.u.)
(viii)(vii)(vi)(v)(vi)(iii)
Cs-TiO2(SY)
- 6 Cycles
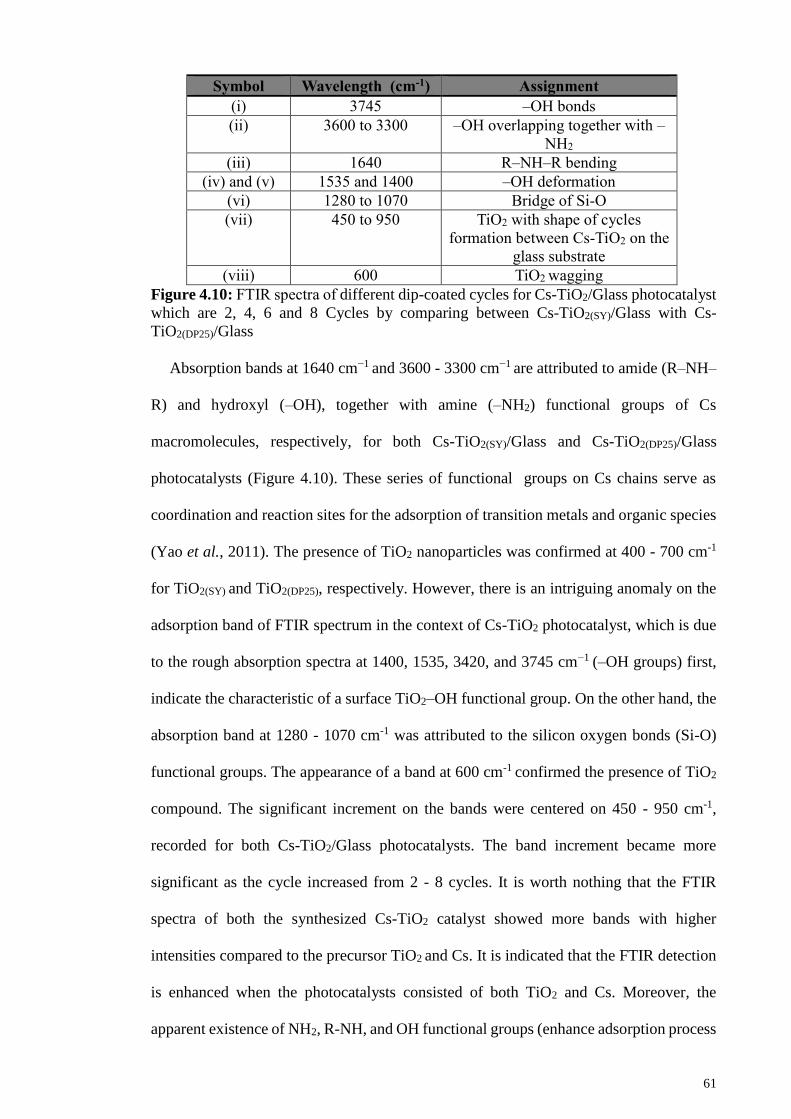
61
Symbol Wavelength (cm-1) Assignment
(i) 3745 –OH bonds
(ii) 3600 to 3300 –OH overlapping together with –
NH2
(iii) 1640 R–NH–R bending
(iv) and (v) 1535 and 1400 –OH deformation
(vi) 1280 to 1070 Bridge of Si-O
(vii) 450 to 950 TiO2 with shape of cycles
formation between Cs-TiO2 on the
glass substrate
(viii) 600 TiO2 wagging
Figure 4.10: FTIR spectra of different dip-coated cycles for Cs-TiO2/Glass photocatalyst
which are 2, 4, 6 and 8 Cycles by comparing between Cs-TiO2(SY)/Glass with Cs-
TiO2(DP25)/Glass
Absorption bands at 1640 cm−1 and 3600 - 3300 cm−1 are attributed to amide (R–NH–
R) and hydroxyl (–OH), together with amine (–NH2) functional groups of Cs
macromolecules, respectively, for both Cs-TiO2(SY)/Glass and Cs-TiO2(DP25)/Glass
photocatalysts (Figure 4.10). These series of functional groups on Cs chains serve as
coordination and reaction sites for the adsorption of transition metals and organic species
(Yao et al., 2011). The presence of TiO2 nanoparticles was confirmed at 400 - 700 cm-1
for TiO2(SY) and TiO2(DP25), respectively. However, there is an intriguing anomaly on the
adsorption band of FTIR spectrum in the context of Cs-TiO2 photocatalyst, which is due
to the rough absorption spectra at 1400, 1535, 3420, and 3745 cm−1 (–OH groups) first,
indicate the characteristic of a surface TiO2–OH functional group. On the other hand, the
absorption band at 1280 - 1070 cm-1 was attributed to the silicon oxygen bonds (Si-O)
functional groups. The appearance of a band at 600 cm-1 confirmed the presence of TiO2
compound. The significant increment on the bands were centered on 450 - 950 cm-1,
recorded for both Cs-TiO2/Glass photocatalysts. The band increment became more
significant as the cycle increased from 2 - 8 cycles. It is worth nothing that the FTIR
spectra of both the synthesized Cs-TiO2 catalyst showed more bands with higher
intensities compared to the precursor TiO2 and Cs. It is indicated that the FTIR detection
is enhanced when the photocatalysts consisted of both TiO2 and Cs. Moreover, the
apparent existence of NH2, R-NH, and OH functional groups (enhance adsorption process
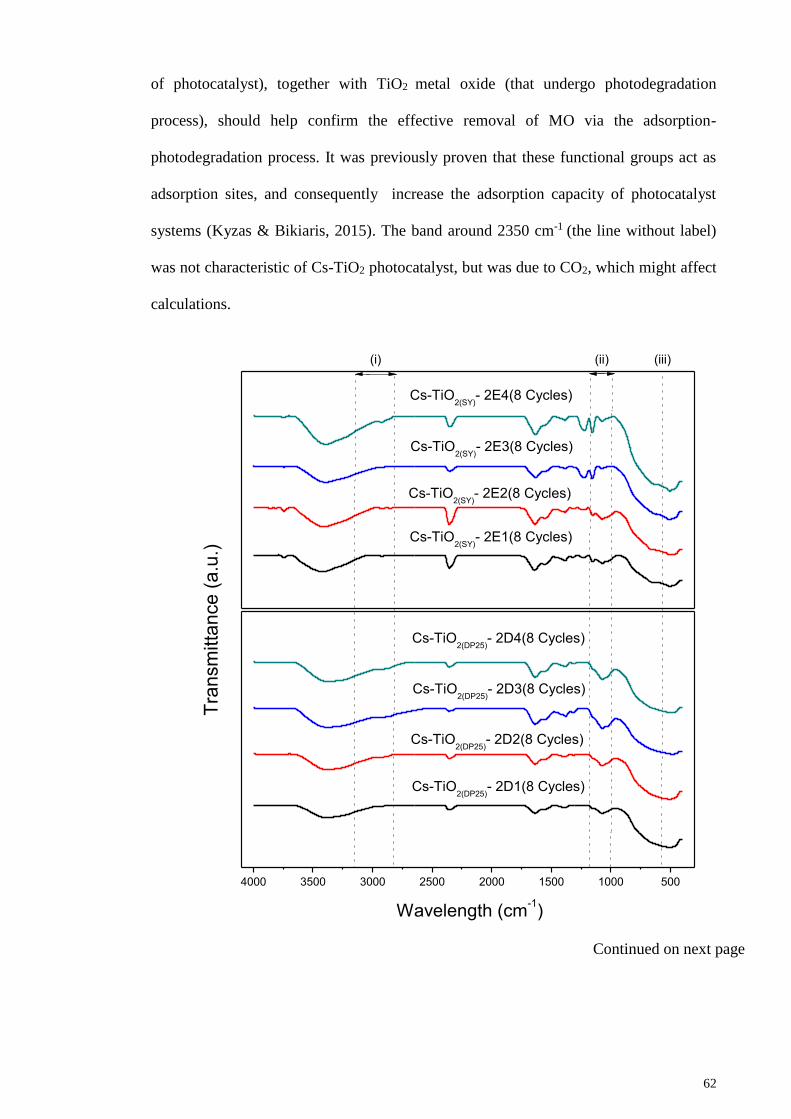
62
of photocatalyst), together with TiO2 metal oxide (that undergo photodegradation
process), should help confirm the effective removal of MO via the adsorption-
photodegradation process. It was previously proven that these functional groups act as
adsorption sites, and consequently increase the adsorption capacity of photocatalyst
systems (Kyzas & Bikiaris, 2015). The band around 2350 cm-1 (the line without label)
was not characteristic of Cs-TiO2 photocatalyst, but was due to CO2, which might affect
calculations.
4000 3500 3000 2500 2000 1500 1000 500
(i) (ii)
(iii)
Wavelength (cm-1)
Tra
nsm
itta
nce (
a.u
.)
Cs-TiO2(SY)
- 2E4(8 Cycles)
Cs-TiO2(SY)
- 2E2(8 Cycles)
Cs-TiO2(SY)
- 2E1(8 Cycles)
Cs-TiO2(SY)
- 2E3(8 Cycles)
Cs-TiO2(DP25)
- 2D4(8 Cycles)
Cs-TiO2(DP25)
- 2D2(8 Cycles)
Cs-TiO2(DP25)
- 2D1(8 Cycles)
Cs-TiO2(DP25)
- 2D3(8 Cycles)
Continued on next page
63
Symbol Wavelength (cm-1) Assignment
(i) 2820 to 3160 Shape of weight ratio formation
between Cs and TiO2
(ii) 1000 to 1200 Bridge of Si-O
(iii) 600 TiO2 wagging
Figure 4.11: FTIR spectra of different weight ratio for Cs-TiO2/Glass photocatalyst by
comparing between Cs-TiO2(SY)/Glass with Cs-TiO2(DP25)/Glass
Figure 4.11 demonstrated an identical FTIR spectra for 8 cycles with different weight
ratios for both Cs-TiO2(SY)/glass and Cs-TiO2(DP25)/glass photocatalysts. To elucidate the
influence of weight ratio, band stretching from 2820 - 3160 cm-1 was included in the
analysis. It was subsequently proven that band stretching and weight ratio of TiO2 is
directly proportional in the range between 0.125 g - 0.5 g. The amount of TiO2 was also
visualized based on the band at 600 cm-1, which indicates that higher band spectra resulted
in a greater amount of TiO2. Finally, the transmitted band of silicon oxygen bonds (Si-
O), in this case a glass substrate, was represented by band stretching within the
wavelength region of 1000 - 1200 cm-1. These series of FTIR spectra confirmed the
excellent dispersion of TiO2 nanoparticles and its subsequent bond formation with the Cs
matrix, of up to 8 cycles of deposition.
64
4.2.2 UV-Vis-Diffusive Reflectance Analysis
The UV-DR spectra of Cs-TiO2(DP25)/Glass and Cs-TiO2(SY)/Glass photocatalysts based
on different dip-coated cycles and weight ratios are shown in Figure 4.12 and 4.13,
respectively. Consequently, the band gap energies of each photocatalysts’ composition is
illustrated in Figure 4.14. The glass substrates’ band gap energies from different dip-
coated cycles and weight ratio for both photocatalysts were also determined by
extrapolating the fittings of the onset light absorption to zero.
Generally, there is less than ~10 % difference of the band gap energy between Cs-
TiO2(DP25)/Glass and Cs-TiO2(SY)/Glass photocatalysts. The band gap energy increased
with the number of cycles, from 2 to 4. These assumptions are valid for both Cs-
TiO2(SY)/Glass and Cs-TiO2(DP25)/Glass photocatalysts. The band gap decreases gradually
from 4 cycles to 8 cycles at up to 0.96 eV and 0.07 eV for Cs-TiO2(SY)/Glass and Cs-
TiO2(DP25)/Glass photocatalysts, respectively. It can be anticipated that the band gap of the
8 cycles photocatalysts for Cs-TiO2(DP25)/Glass (3.13 eV) is 0.29 eV higher than that of
Cs-TiO2(SY)/Glass (2.64 eV). It was also demonstrated that the 8 cycles of Cs-TiO2/Glass
photocatalyst (both photocatalysts) was prepared by successive deposition cycles to
guarantee the excellent distribution of TiO2 nanoparticles. This, in turn, render the Cs-
TiO2/Glass photocatalyst system, with different weight ratio, with the capability of
absorbing photonic energy with wavelengths under 391 nm in the reflectance analysis.
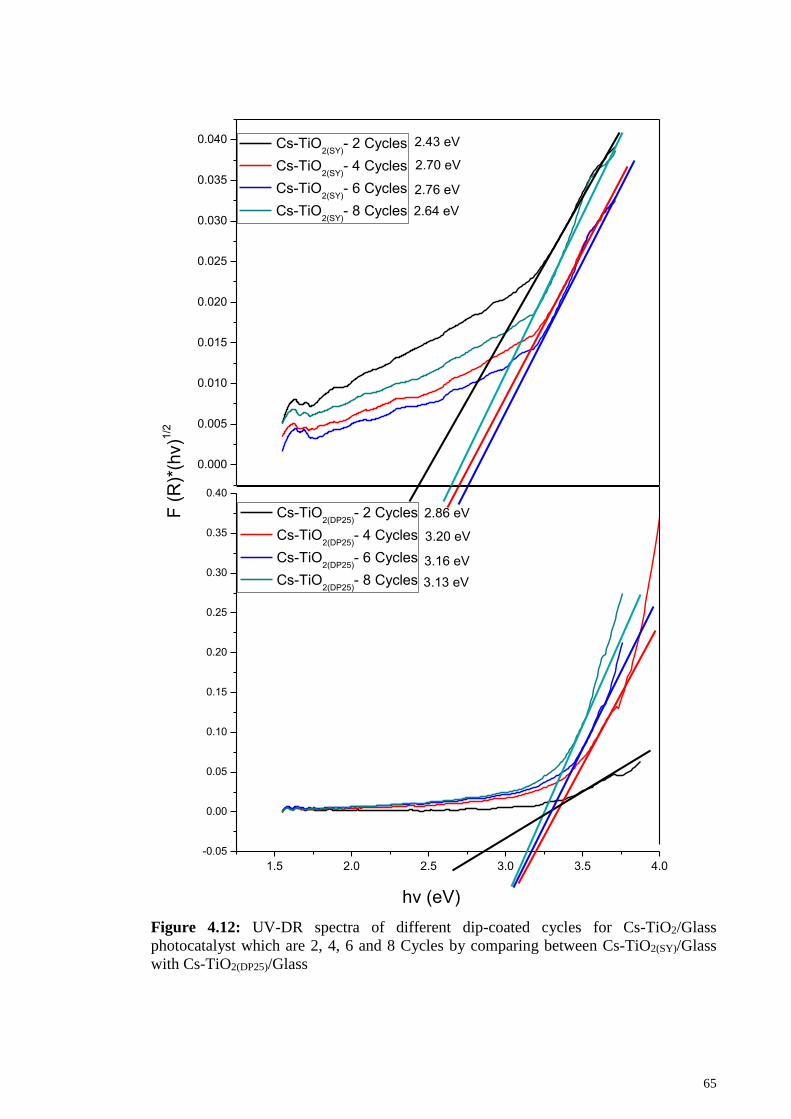
65
Figure 4.12: UV-DR spectra of different dip-coated cycles for Cs-TiO2/Glass
photocatalyst which are 2, 4, 6 and 8 Cycles by comparing between Cs-TiO2(SY)/Glass
with Cs-TiO2(DP25)/Glass
0.000
0.005
0.010
0.015
0.020
0.025
0.030
0.035
0.040
1.5 2.0 2.5 3.0 3.5 4.0
-0.05
0.00
0.05
0.10
0.15
0.20
0.25
0.30
0.35
0.40
2.64 eV
2.76 eV
2.70 eV
Cs-TiO2(SY)
- 2 Cycles
Cs-TiO2(SY)
- 4 Cycles
Cs-TiO2(SY)
- 6 Cycles
Cs-TiO2(SY)
- 8 Cycles
hv (eV)
2.43 eV
3.13 eV
3.16 eV
3.20 eV
2.86 eVF (
R)*
(hv)1
/2
Cs-TiO2(DP25)
- 2 Cycles
Cs-TiO2(DP25)
- 4 Cycles
Cs-TiO2(DP25)
- 6 Cycles
Cs-TiO2(DP25)
- 8 Cycles
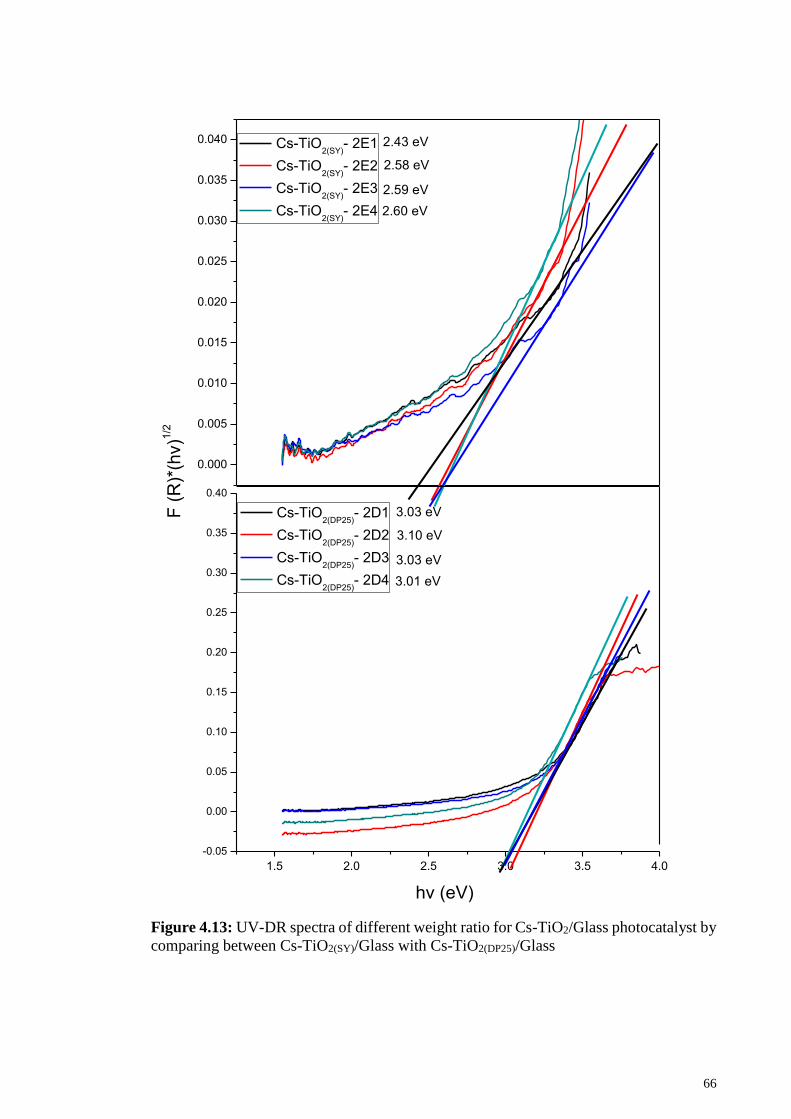
66
Figure 4.13: UV-DR spectra of different weight ratio for Cs-TiO2/Glass photocatalyst by
comparing between Cs-TiO2(SY)/Glass with Cs-TiO2(DP25)/Glass
0.000
0.005
0.010
0.015
0.020
0.025
0.030
0.035
0.040
1.5 2.0 2.5 3.0 3.5 4.0
-0.05
0.00
0.05
0.10
0.15
0.20
0.25
0.30
0.35
0.40
2.60 eV
2.59 eV
2.58 eV
Cs-TiO2(SY)
- 2E1
Cs-TiO2(SY)
- 2E2
Cs-TiO2(SY)
- 2E3
Cs-TiO2(SY)
- 2E4
hv (eV)
2.43 eV
3.01 eV
3.03 eV
3.10 eV
3.03 eVF (
R)*
(hv)1
/2
Cs-TiO2(DP25)
- 2D1
Cs-TiO2(DP25)
- 2D2
Cs-TiO2(DP25)
- 2D3
Cs-TiO2(DP25)
- 2D4
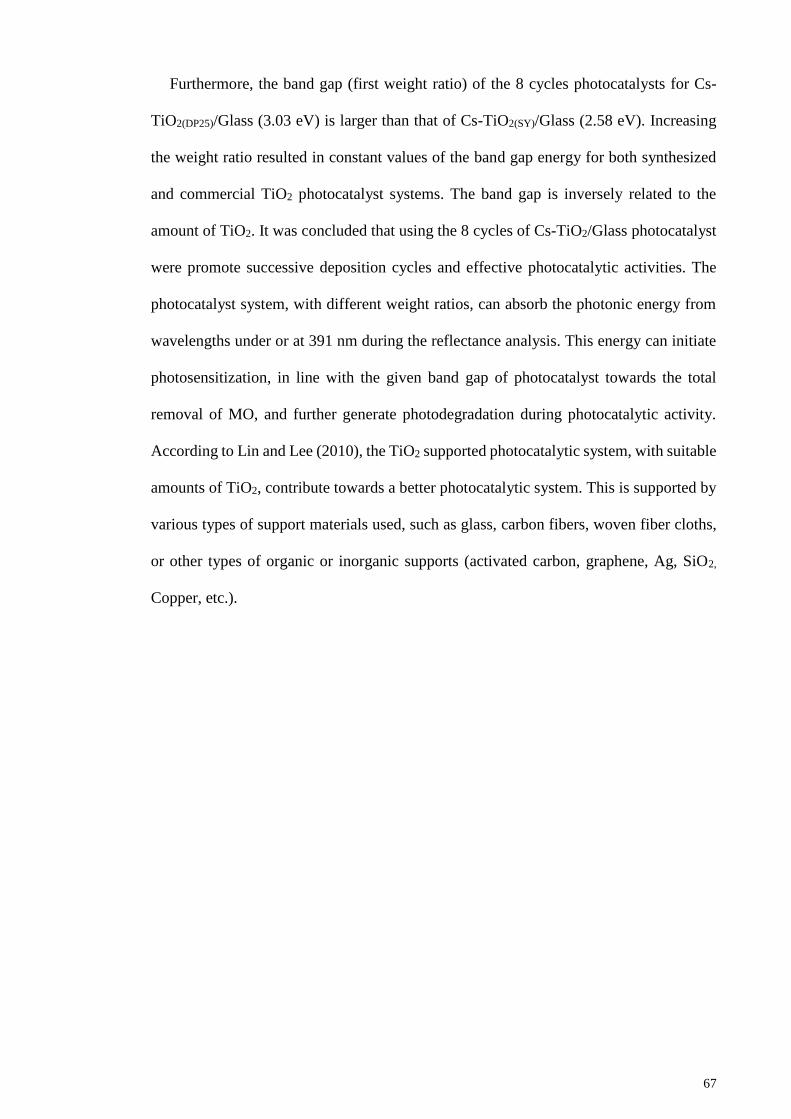
67
Furthermore, the band gap (first weight ratio) of the 8 cycles photocatalysts for Cs-
TiO2(DP25)/Glass (3.03 eV) is larger than that of Cs-TiO2(SY)/Glass (2.58 eV). Increasing
the weight ratio resulted in constant values of the band gap energy for both synthesized
and commercial TiO2 photocatalyst systems. The band gap is inversely related to the
amount of TiO2. It was concluded that using the 8 cycles of Cs-TiO2/Glass photocatalyst
were promote successive deposition cycles and effective photocatalytic activities. The
photocatalyst system, with different weight ratios, can absorb the photonic energy from
wavelengths under or at 391 nm during the reflectance analysis. This energy can initiate
photosensitization, in line with the given band gap of photocatalyst towards the total
removal of MO, and further generate photodegradation during photocatalytic activity.
According to Lin and Lee (2010), the TiO2 supported photocatalytic system, with suitable
amounts of TiO2, contribute towards a better photocatalytic system. This is supported by
various types of support materials used, such as glass, carbon fibers, woven fiber cloths,
or other types of organic or inorganic supports (activated carbon, graphene, Ag, SiO2,
Copper, etc.).
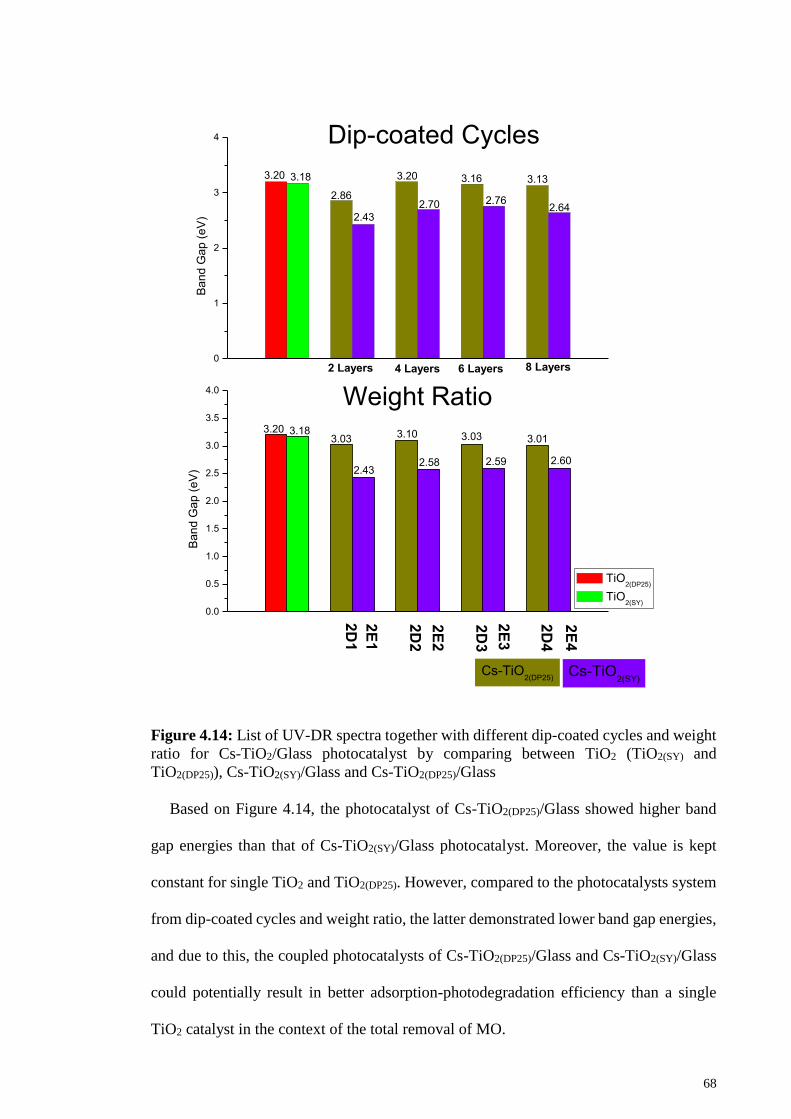
68
0
1
2
3
4
3.20 3.18
2.64
3.13
2.76
3.16
2.70
3.20
2.86
Dip-coated Cycles
Ba
nd
Ga
p (
eV
)
TiO2(DP25)
TiO2(SY)
2.43
0.0
0.5
1.0
1.5
2.0
2.5
3.0
3.5
4.0
8 Layers6 Layers4 Layers
Weight Ratio
Ba
nd
Ga
p (
eV
)
Cs-TiO2(DP25)
Cs-TiO2(SY)
2E
1
2D
1
2E
2
2D
2
2E
3
2D
3
2E
4
2D
4
2 Layers
3.20 3.18
2.60
3.01
2.59
3.03
2.58
3.103.03
2.43
Figure 4.14: List of UV-DR spectra together with different dip-coated cycles and weight
ratio for Cs-TiO2/Glass photocatalyst by comparing between TiO2 (TiO2(SY) and
TiO2(DP25)), Cs-TiO2(SY)/Glass and Cs-TiO2(DP25)/Glass
Based on Figure 4.14, the photocatalyst of Cs-TiO2(DP25)/Glass showed higher band
gap energies than that of Cs-TiO2(SY)/Glass photocatalyst. Moreover, the value is kept
constant for single TiO2 and TiO2(DP25). However, compared to the photocatalysts system
from dip-coated cycles and weight ratio, the latter demonstrated lower band gap energies,
and due to this, the coupled photocatalysts of Cs-TiO2(DP25)/Glass and Cs-TiO2(SY)/Glass
could potentially result in better adsorption-photodegradation efficiency than a single
TiO2 catalyst in the context of the total removal of MO.
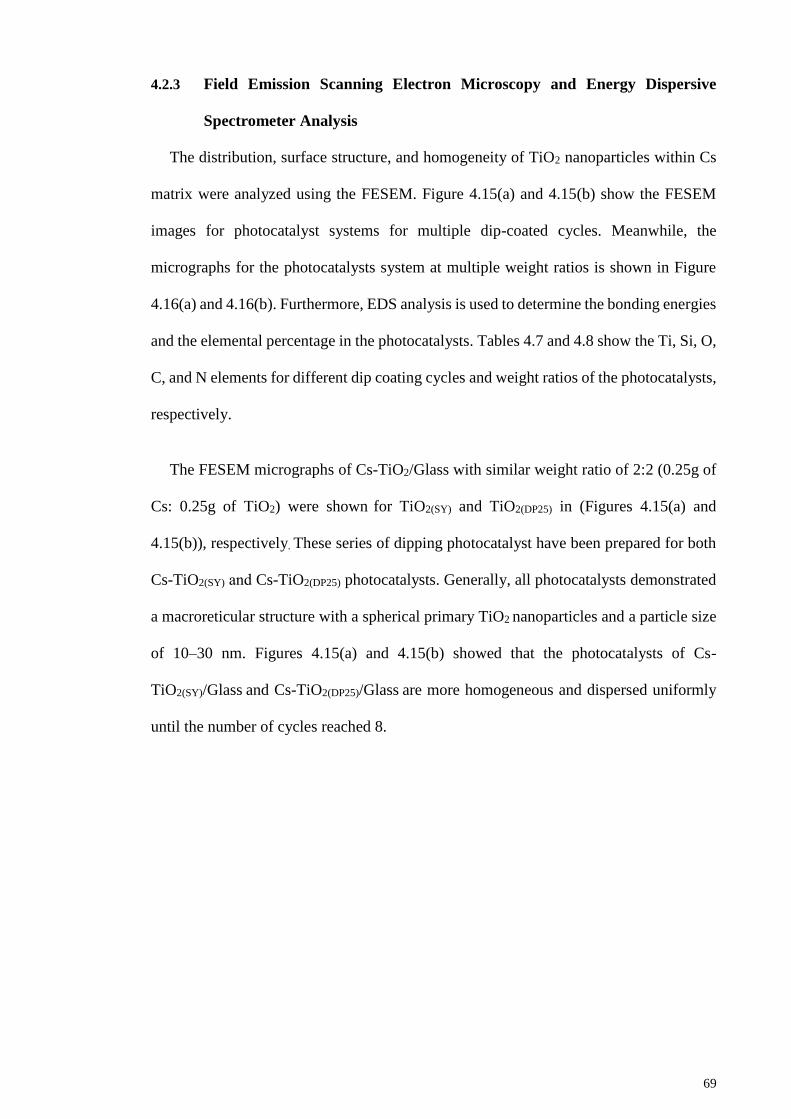
69
4.2.3 Field Emission Scanning Electron Microscopy and Energy Dispersive
Spectrometer Analysis
The distribution, surface structure, and homogeneity of TiO2 nanoparticles within Cs
matrix were analyzed using the FESEM. Figure 4.15(a) and 4.15(b) show the FESEM
images for photocatalyst systems for multiple dip-coated cycles. Meanwhile, the
micrographs for the photocatalysts system at multiple weight ratios is shown in Figure
4.16(a) and 4.16(b). Furthermore, EDS analysis is used to determine the bonding energies
and the elemental percentage in the photocatalysts. Tables 4.7 and 4.8 show the Ti, Si, O,
C, and N elements for different dip coating cycles and weight ratios of the photocatalysts,
respectively.
The FESEM micrographs of Cs-TiO2/Glass with similar weight ratio of 2:2 (0.25g of
Cs: 0.25g of TiO2) were shown for TiO2(SY) and TiO2(DP25) in (Figures 4.15(a) and
4.15(b)), respectively. These series of dipping photocatalyst have been prepared for both
Cs-TiO2(SY) and Cs-TiO2(DP25) photocatalysts. Generally, all photocatalysts demonstrated
a macroreticular structure with a spherical primary TiO2 nanoparticles and a particle size
of 10–30 nm. Figures 4.15(a) and 4.15(b) showed that the photocatalysts of Cs-
TiO2(SY)/Glass and Cs-TiO2(DP25)/Glass are more homogeneous and dispersed uniformly
until the number of cycles reached 8.
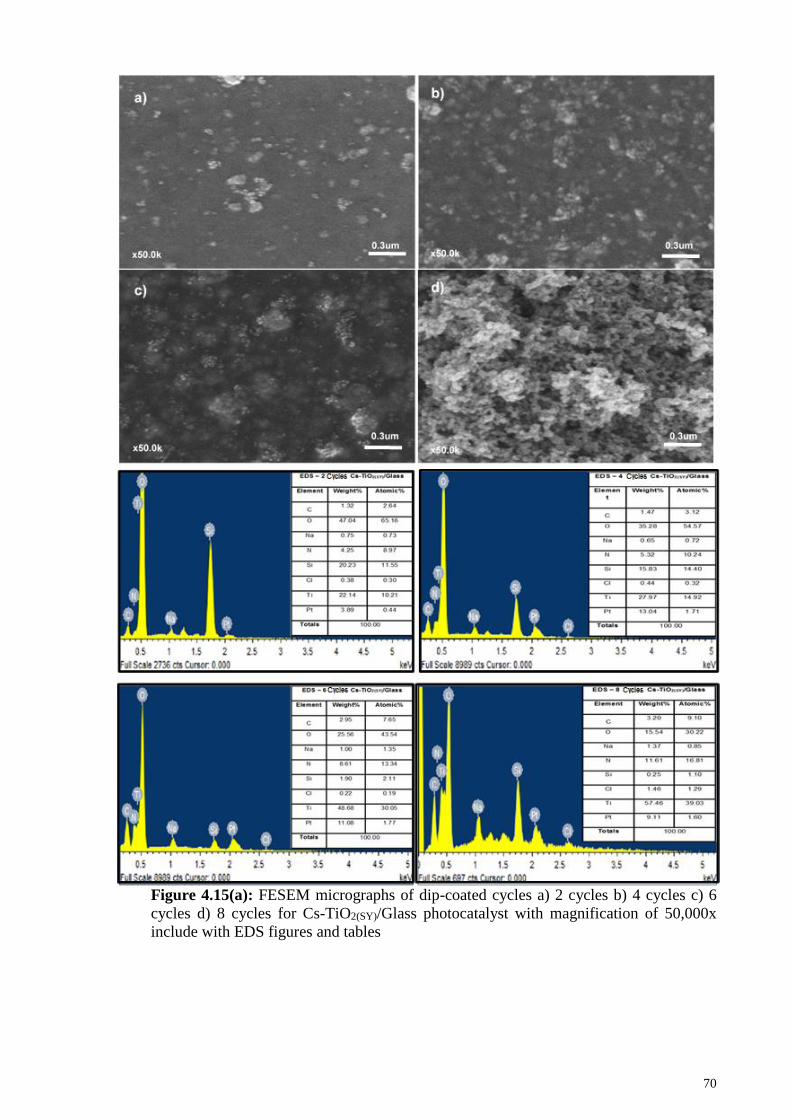
70
Figure 4.15(a): FESEM micrographs of dip-coated cycles a) 2 cycles b) 4 cycles c) 6
cycles d) 8 cycles for Cs-TiO2(SY)/Glass photocatalyst with magnification of 50,000x
include with EDS figures and tables
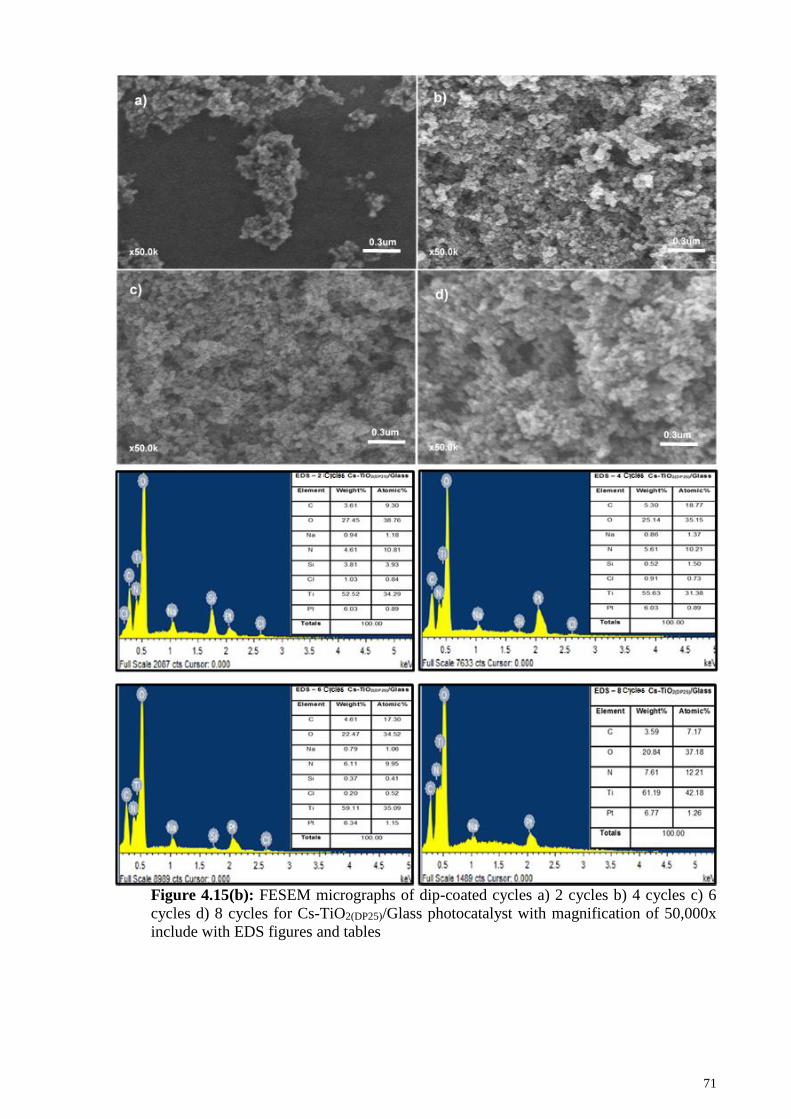
71
Figure 4.15(b): FESEM micrographs of dip-coated cycles a) 2 cycles b) 4 cycles c) 6
cycles d) 8 cycles for Cs-TiO2(DP25)/Glass photocatalyst with magnification of 50,000x
include with EDS figures and tables
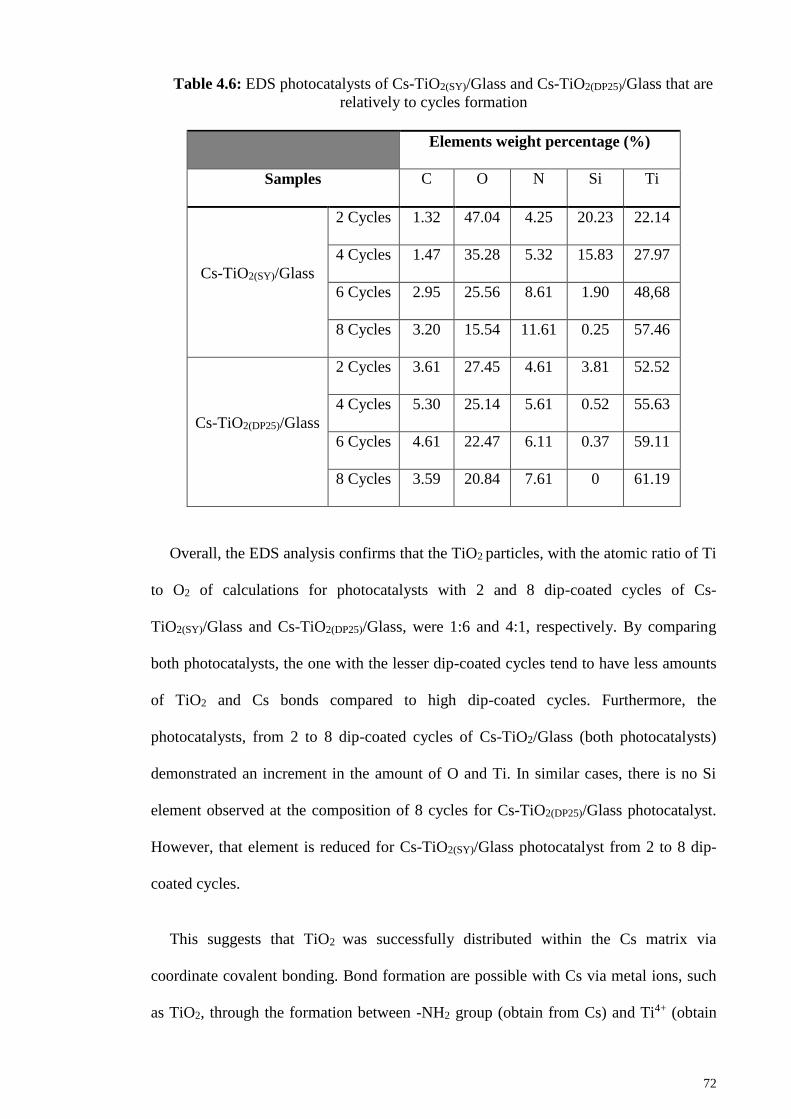
72
Table 4.6: EDS photocatalysts of Cs-TiO2(SY)/Glass and Cs-TiO2(DP25)/Glass that are
relatively to cycles formation
Elements weight percentage (%)
Samples C O N Si Ti
Cs-TiO2(SY)/Glass
2 Cycles 1.32 47.04 4.25 20.23 22.14
4 Cycles 1.47 35.28 5.32 15.83 27.97
6 Cycles 2.95 25.56 8.61 1.90 48,68
8 Cycles 3.20 15.54 11.61 0.25 57.46
Cs-TiO2(DP25)/Glass
2 Cycles 3.61 27.45 4.61 3.81 52.52
4 Cycles 5.30 25.14 5.61 0.52 55.63
6 Cycles 4.61 22.47 6.11 0.37 59.11
8 Cycles 3.59 20.84 7.61 0 61.19
Overall, the EDS analysis confirms that the TiO2 particles, with the atomic ratio of Ti
to O2 of calculations for photocatalysts with 2 and 8 dip-coated cycles of Cs-
TiO2(SY)/Glass and Cs-TiO2(DP25)/Glass, were 1:6 and 4:1, respectively. By comparing
both photocatalysts, the one with the lesser dip-coated cycles tend to have less amounts
of TiO2 and Cs bonds compared to high dip-coated cycles. Furthermore, the
photocatalysts, from 2 to 8 dip-coated cycles of Cs-TiO2/Glass (both photocatalysts)
demonstrated an increment in the amount of O and Ti. In similar cases, there is no Si
element observed at the composition of 8 cycles for Cs-TiO2(DP25)/Glass photocatalyst.
However, that element is reduced for Cs-TiO2(SY)/Glass photocatalyst from 2 to 8 dip-
coated cycles.
This suggests that TiO2 was successfully distributed within the Cs matrix via
coordinate covalent bonding. Bond formation are possible with Cs via metal ions, such
as TiO2, through the formation between -NH2 group (obtain from Cs) and Ti4+ (obtain
73
from TiO2) to produce hydrogels that can be used for attachment to a glass substrate. This
would allow the Cs matrix to function as an adsorption medium, while the surface of TiO2
act as a photoelectron center via promotion and excitation with light illumination of a
suitable wavelength (<390 nm or band gap of 3.20 eV and 3.18 eV for catalysts TiO2(SY)
and TiO2(DP25), respectively). Moreover, TiO2 was completely dispersed as the
nanoparticles were submerged into the coated cycles (Figures 4.15(a) and 4.15(b)).
Further observation leads us to conclude that the surface TiO2 nanoparticles (both TiO2(SY)
and TiO2(DP25)) are directly proportional to the number of dip-coated cycles. Hence, this
confirmed that the photodegradation process plays a major role in 6 to 8 dip-coated cycles
for both photocatalysts of Cs-TiO2/Glass photocatalyst, due to the abundance of TiO2,
whereas the removal of MO would predominantly be attributed to the adsorption process,
with subsequent increase of dip-coating cycles for both photocatalysts of Cs-
TiO2(SY)/Glass and Cs-TiO2(DP25)/Glass.
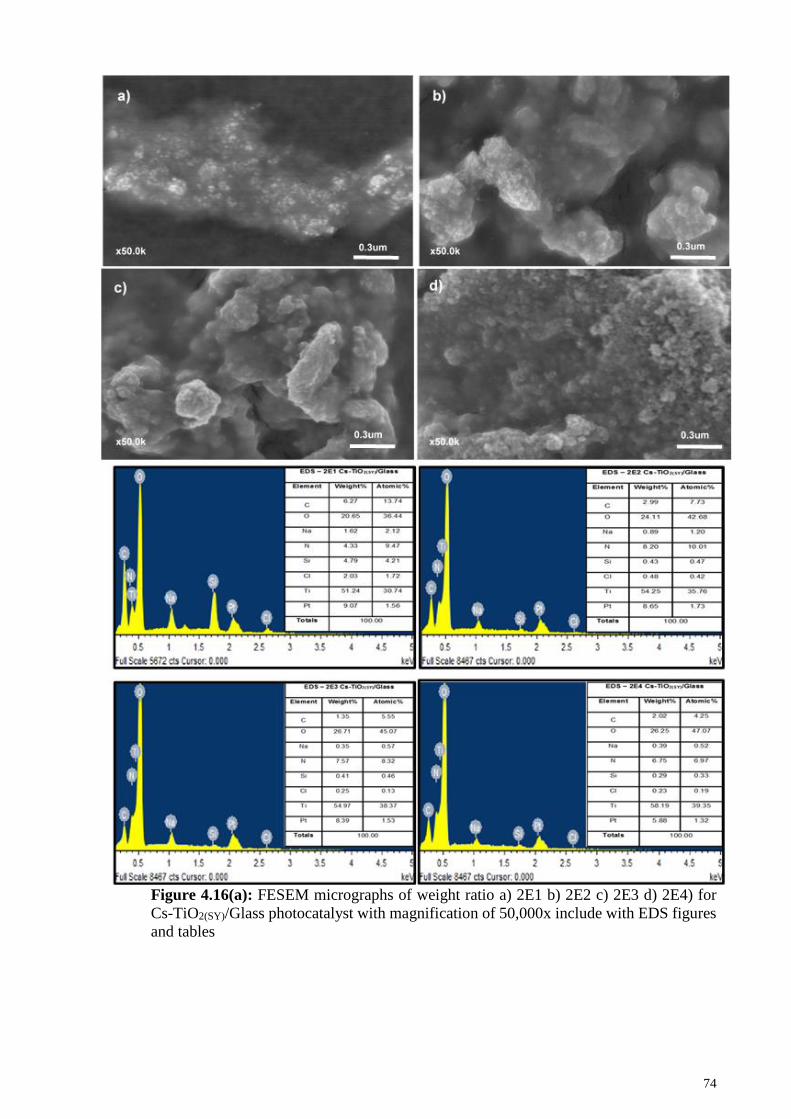
74
Figure 4.16(a): FESEM micrographs of weight ratio a) 2E1 b) 2E2 c) 2E3 d) 2E4) for
Cs-TiO2(SY)/Glass photocatalyst with magnification of 50,000x include with EDS figures
and tables
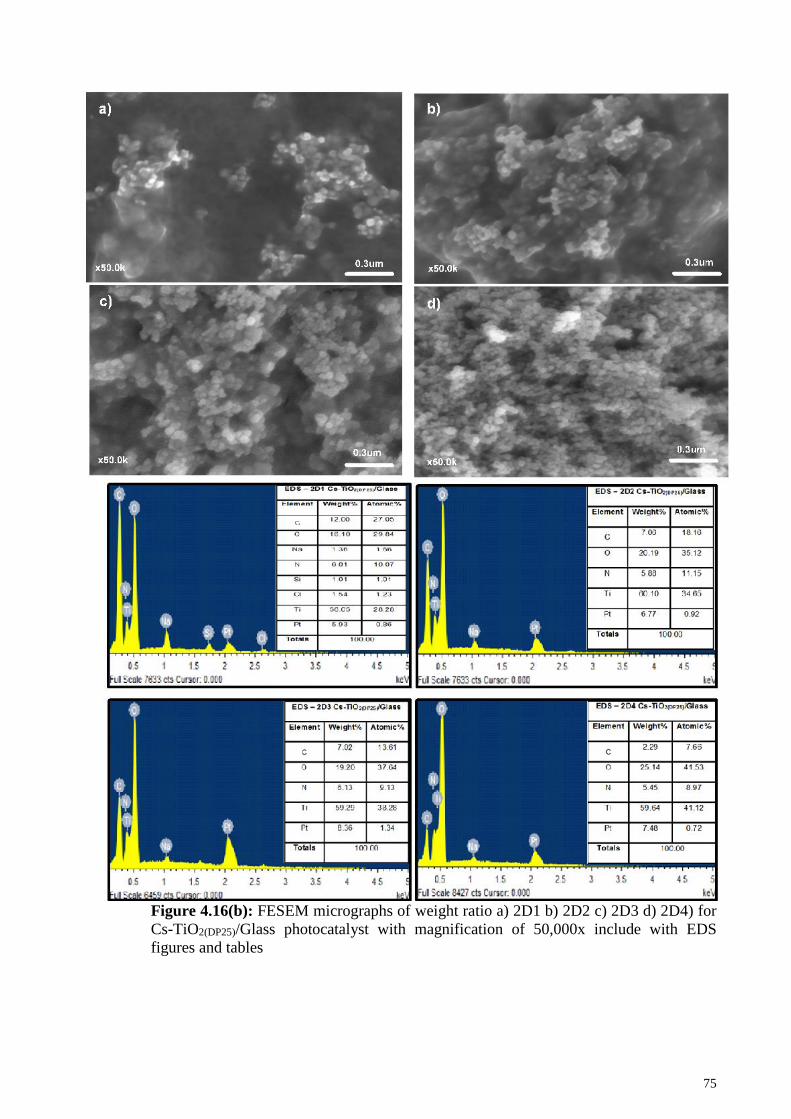
75
Figure 4.16(b): FESEM micrographs of weight ratio a) 2D1 b) 2D2 c) 2D3 d) 2D4) for
Cs-TiO2(DP25)/Glass photocatalyst with magnification of 50,000x include with EDS
figures and tables
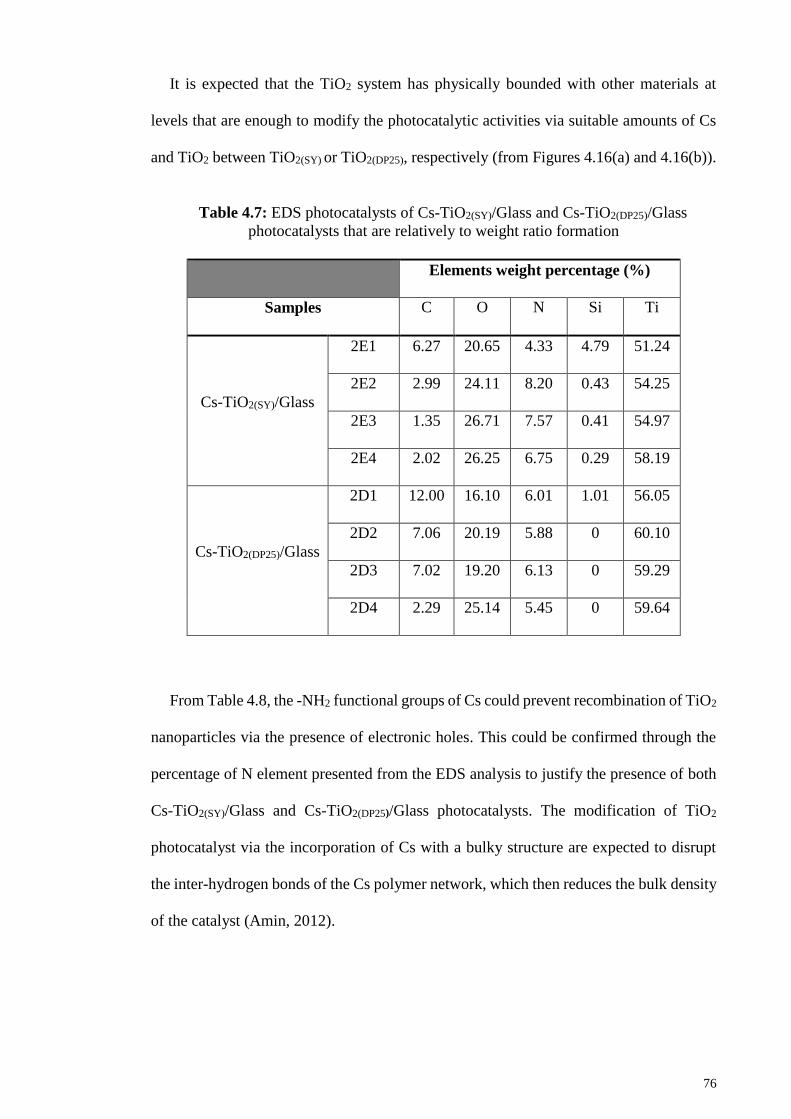
76
It is expected that the TiO2 system has physically bounded with other materials at
levels that are enough to modify the photocatalytic activities via suitable amounts of Cs
and TiO2 between TiO2(SY) or TiO2(DP25), respectively (from Figures 4.16(a) and 4.16(b)).
Table 4.7: EDS photocatalysts of Cs-TiO2(SY)/Glass and Cs-TiO2(DP25)/Glass
photocatalysts that are relatively to weight ratio formation
Elements weight percentage (%)
Samples C O N Si Ti
Cs-TiO2(SY)/Glass
2E1 6.27 20.65 4.33 4.79 51.24
2E2 2.99 24.11 8.20 0.43 54.25
2E3 1.35 26.71 7.57 0.41 54.97
2E4 2.02 26.25 6.75 0.29 58.19
Cs-TiO2(DP25)/Glass
2D1 12.00 16.10 6.01 1.01 56.05
2D2 7.06 20.19 5.88 0 60.10
2D3 7.02 19.20 6.13 0 59.29
2D4 2.29 25.14 5.45 0 59.64
From Table 4.8, the -NH2 functional groups of Cs could prevent recombination of TiO2
nanoparticles via the presence of electronic holes. This could be confirmed through the
percentage of N element presented from the EDS analysis to justify the presence of both
Cs-TiO2(SY)/Glass and Cs-TiO2(DP25)/Glass photocatalysts. The modification of TiO2
photocatalyst via the incorporation of Cs with a bulky structure are expected to disrupt
the inter-hydrogen bonds of the Cs polymer network, which then reduces the bulk density
of the catalyst (Amin, 2012).
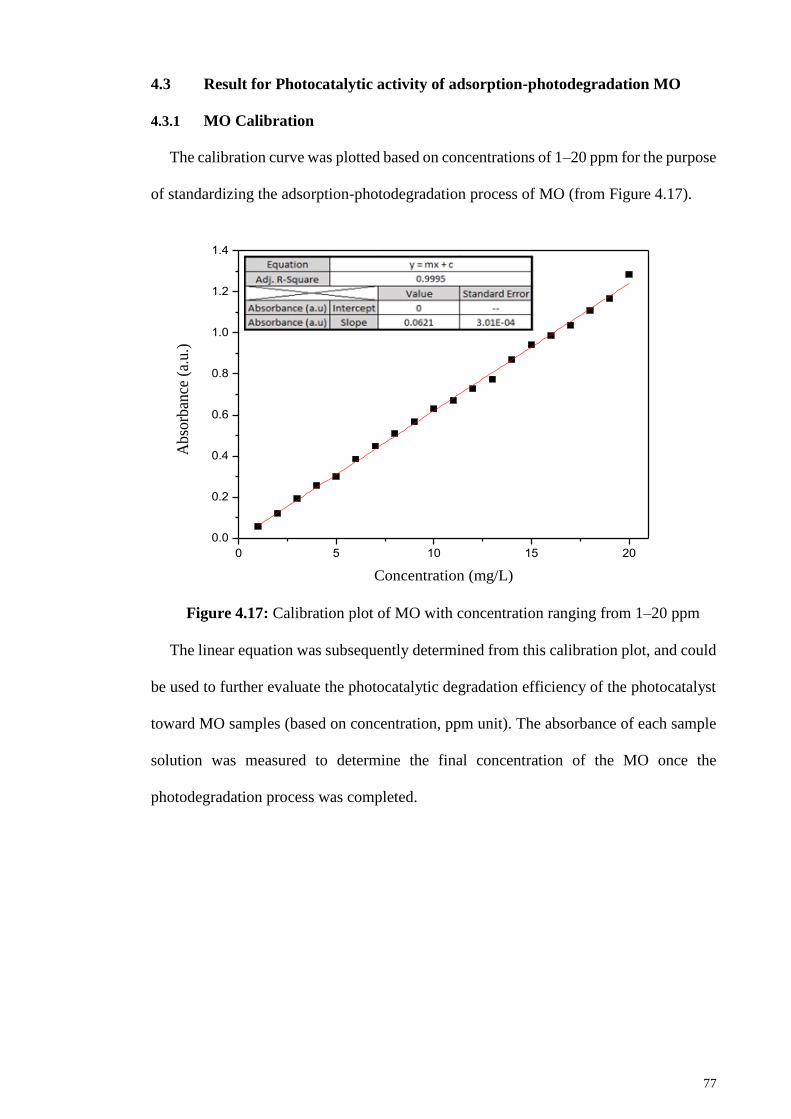
77
4.3 Result for Photocatalytic activity of adsorption-photodegradation MO
4.3.1 MO Calibration
The calibration curve was plotted based on concentrations of 1–20 ppm for the purpose
of standardizing the adsorption-photodegradation process of MO (from Figure 4.17).
0 5 10 15 20
0.0
0.2
0.4
0.6
0.8
1.0
1.2
1.4
Ab
sorb
ance
(a.
u.)
Concentration (mg/L)
Figure 4.17: Calibration plot of MO with concentration ranging from 1–20 ppm
The linear equation was subsequently determined from this calibration plot, and could
be used to further evaluate the photocatalytic degradation efficiency of the photocatalyst
toward MO samples (based on concentration, ppm unit). The absorbance of each sample
solution was measured to determine the final concentration of the MO once the
photodegradation process was completed.
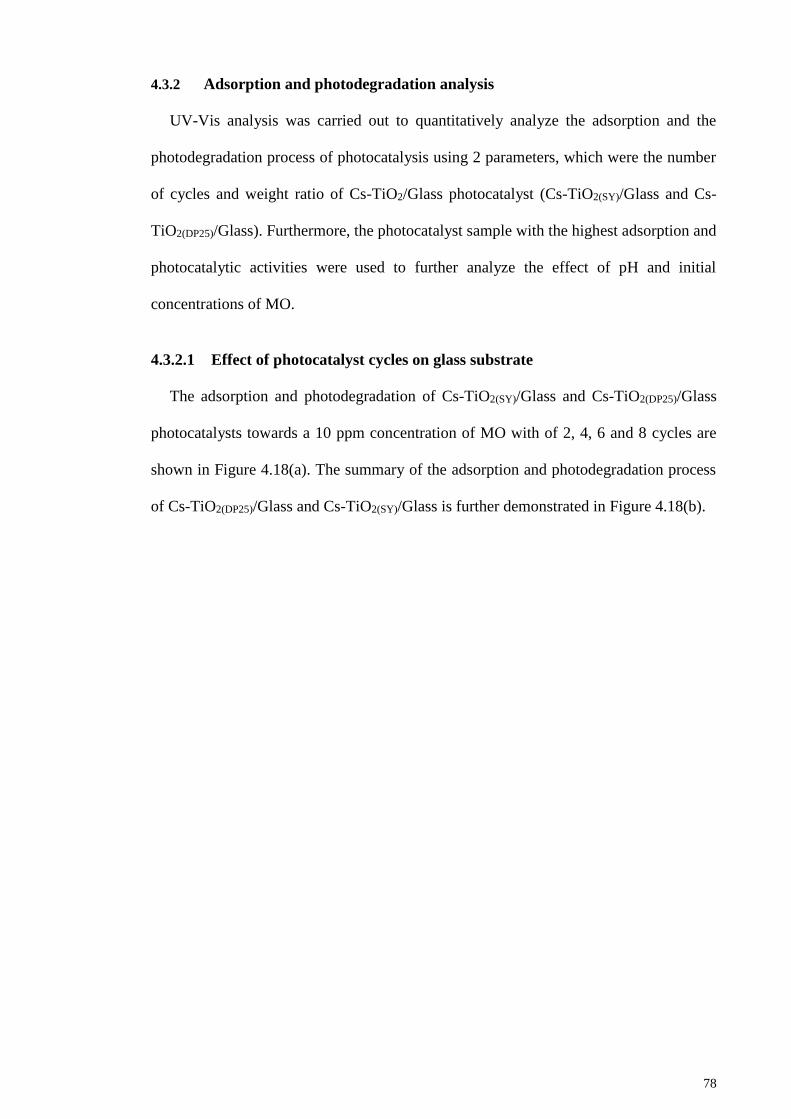
78
4.3.2 Adsorption and photodegradation analysis
UV-Vis analysis was carried out to quantitatively analyze the adsorption and the
photodegradation process of photocatalysis using 2 parameters, which were the number
of cycles and weight ratio of Cs-TiO2/Glass photocatalyst (Cs-TiO2(SY)/Glass and Cs-
TiO2(DP25)/Glass). Furthermore, the photocatalyst sample with the highest adsorption and
photocatalytic activities were used to further analyze the effect of pH and initial
concentrations of MO.
4.3.2.1 Effect of photocatalyst cycles on glass substrate
The adsorption and photodegradation of Cs-TiO2(SY)/Glass and Cs-TiO2(DP25)/Glass
photocatalysts towards a 10 ppm concentration of MO with of 2, 4, 6 and 8 cycles are
shown in Figure 4.18(a). The summary of the adsorption and photodegradation process
of Cs-TiO2(DP25)/Glass and Cs-TiO2(SY)/Glass is further demonstrated in Figure 4.18(b).
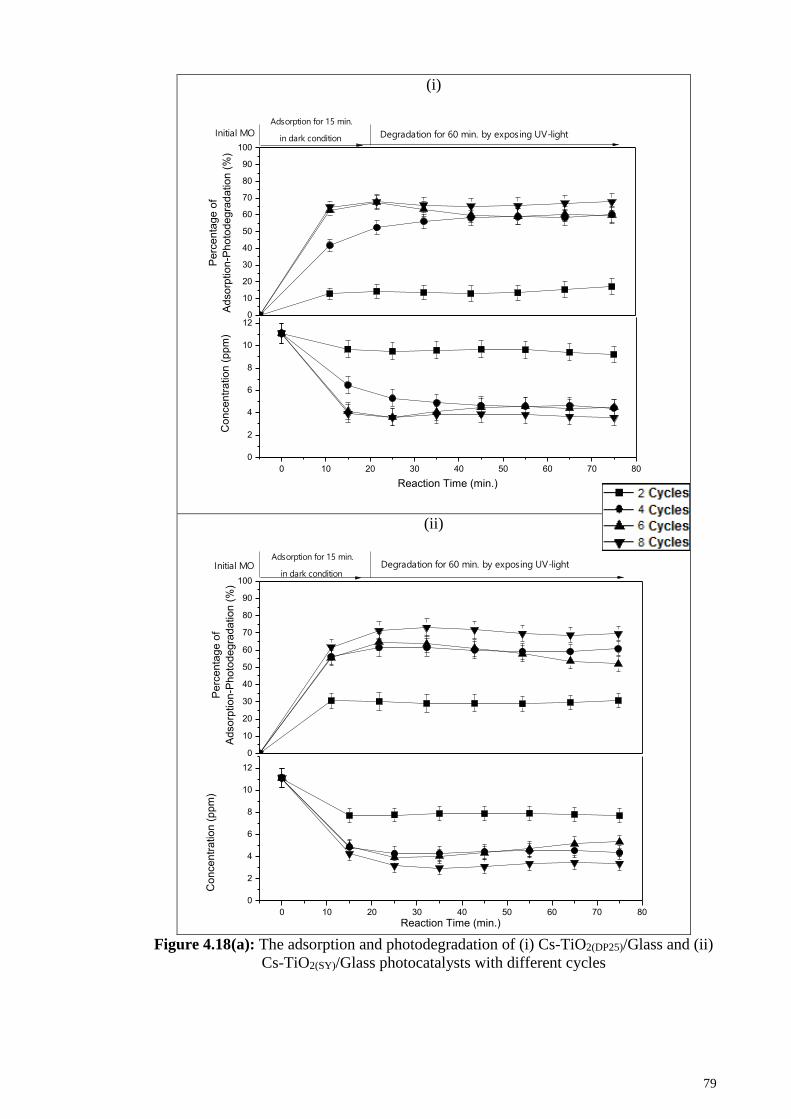
79
(i)
0
10
20
30
40
50
60
70
80
90
100
0 10 20 30 40 50 60 70 80
0
2
4
6
8
10
12
Reaction Time (min.)
Pe
rce
nta
ge
of
Ad
so
rptio
n-P
ho
tod
eg
rad
atio
n (
%)
Co
nce
ntr
atio
n (
pp
m)
Initial MO
Adsorption for 15 min.
in dark condition Degradation for 60 min. by exposing UV-light
(ii)
0
10
20
30
40
50
60
70
80
90
100
0 10 20 30 40 50 60 70 80
0
2
4
6
8
10
12
Initial MOAdsorption for 15 min.
in dark conditionDegradation for 60 min. by exposing UV-light
Pe
rce
nta
ge
of
Ad
so
rptio
n-P
ho
tod
eg
rad
atio
n (
%)
Co
nce
ntr
atio
n (
pp
m)
Reaction Time (min.)
Figure 4.18(a): The adsorption and photodegradation of (i) Cs-TiO2(DP25)/Glass and (ii)
Cs-TiO2(SY)/Glass photocatalysts with different cycles
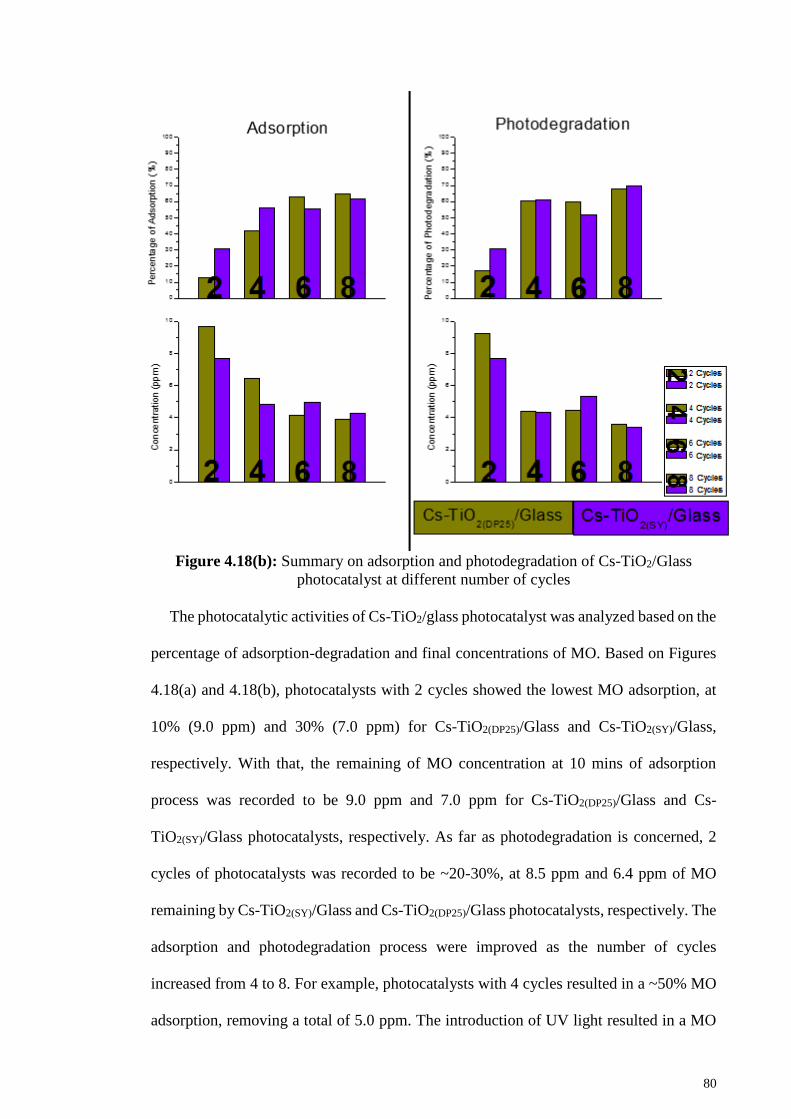
80
Figure 4.18(b): Summary on adsorption and photodegradation of Cs-TiO2/Glass
photocatalyst at different number of cycles
The photocatalytic activities of Cs-TiO2/glass photocatalyst was analyzed based on the
percentage of adsorption-degradation and final concentrations of MO. Based on Figures
4.18(a) and 4.18(b), photocatalysts with 2 cycles showed the lowest MO adsorption, at
10% (9.0 ppm) and 30% (7.0 ppm) for Cs-TiO2(DP25)/Glass and Cs-TiO2(SY)/Glass,
respectively. With that, the remaining of MO concentration at 10 mins of adsorption
process was recorded to be 9.0 ppm and 7.0 ppm for Cs-TiO2(DP25)/Glass and Cs-
TiO2(SY)/Glass photocatalysts, respectively. As far as photodegradation is concerned, 2
cycles of photocatalysts was recorded to be ~20-30%, at 8.5 ppm and 6.4 ppm of MO
remaining by Cs-TiO2(SY)/Glass and Cs-TiO2(DP25)/Glass photocatalysts, respectively. The
adsorption and photodegradation process were improved as the number of cycles
increased from 4 to 8. For example, photocatalysts with 4 cycles resulted in a ~50% MO
adsorption, removing a total of 5.0 ppm. The introduction of UV light resulted in a MO
81
photodegradation of 60% and 61%, at final concentrations of 4.4 ppm and 4.3 ppm of
MO for Cs-TiO2(DP25)/Glass and Cs-TiO2(SY)/Glass photocatalysts, respectively. The MO
adsorption for the photocatalysts sample with 6 cycles was recorded to be 60% and 56%,
at MO concentrations of 4.1 ppm and 4.8 ppm for Cs-TiO2(DP25)/Glass and Cs-
TiO2(SY)/Glass photocatalysts, respectively. However, the photodegradation of both
photocatalysts did not show much difference in terms of percent of degradation and
concentrations of MO.
Furthermore, the 8 cycles of Cs-TiO2(DP25)/Glass and Cs-TiO2(SY)/Glass photocatalysts
demonstrated the highest total removal of the MO. At the adsorption stage, ~62% and
65% of MO removal, with final concentrations of 4.3 ppm and 4.0 ppm for Cs-
TiO2(DP25)/Glass and Cs-TiO2(SY)/Glass photocatalysts, were removed. Then, the
photodegradation process was recorded to be 67% to 70% removal for both
photocatalysts. Once the photocatalysis process was completed, the concentration of the
remaining solution was recorded to be 3.6 ppm and 3.4 ppm, respectively. This can be
explained by the fact that samples with more cycles contain higher percentages of Cs as
its absorbent and TiO2 as its center of photodegradation. Based on Figure 4.19, adsorption
occurred on the inter H-bonds interaction between the -OH and -NH2 groups of Cs, with
the polar groups of MO.
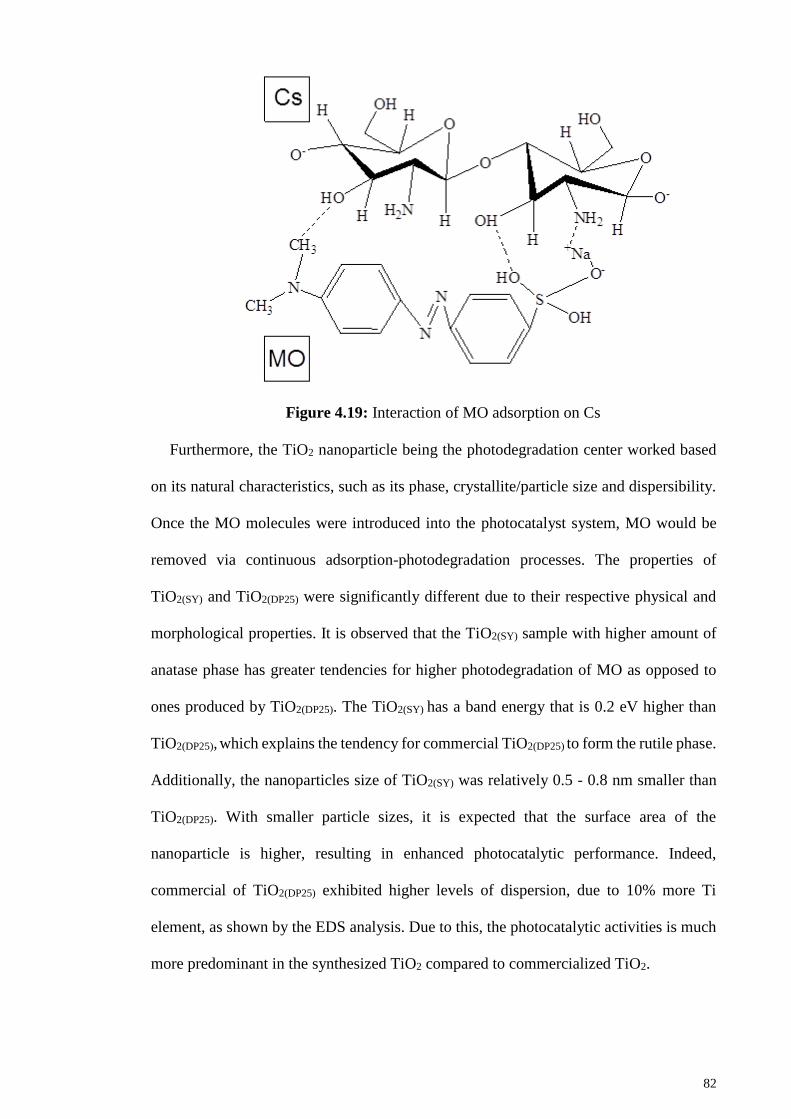
82
Figure 4.19: Interaction of MO adsorption on Cs
Furthermore, the TiO2 nanoparticle being the photodegradation center worked based
on its natural characteristics, such as its phase, crystallite/particle size and dispersibility.
Once the MO molecules were introduced into the photocatalyst system, MO would be
removed via continuous adsorption-photodegradation processes. The properties of
TiO2(SY) and TiO2(DP25) were significantly different due to their respective physical and
morphological properties. It is observed that the TiO2(SY) sample with higher amount of
anatase phase has greater tendencies for higher photodegradation of MO as opposed to
ones produced by TiO2(DP25). The TiO2(SY) has a band energy that is 0.2 eV higher than
TiO2(DP25), which explains the tendency for commercial TiO2(DP25) to form the rutile phase.
Additionally, the nanoparticles size of TiO2(SY) was relatively 0.5 - 0.8 nm smaller than
TiO2(DP25). With smaller particle sizes, it is expected that the surface area of the
nanoparticle is higher, resulting in enhanced photocatalytic performance. Indeed,
commercial of TiO2(DP25) exhibited higher levels of dispersion, due to 10% more Ti
element, as shown by the EDS analysis. Due to this, the photocatalytic activities is much
more predominant in the synthesized TiO2 compared to commercialized TiO2.
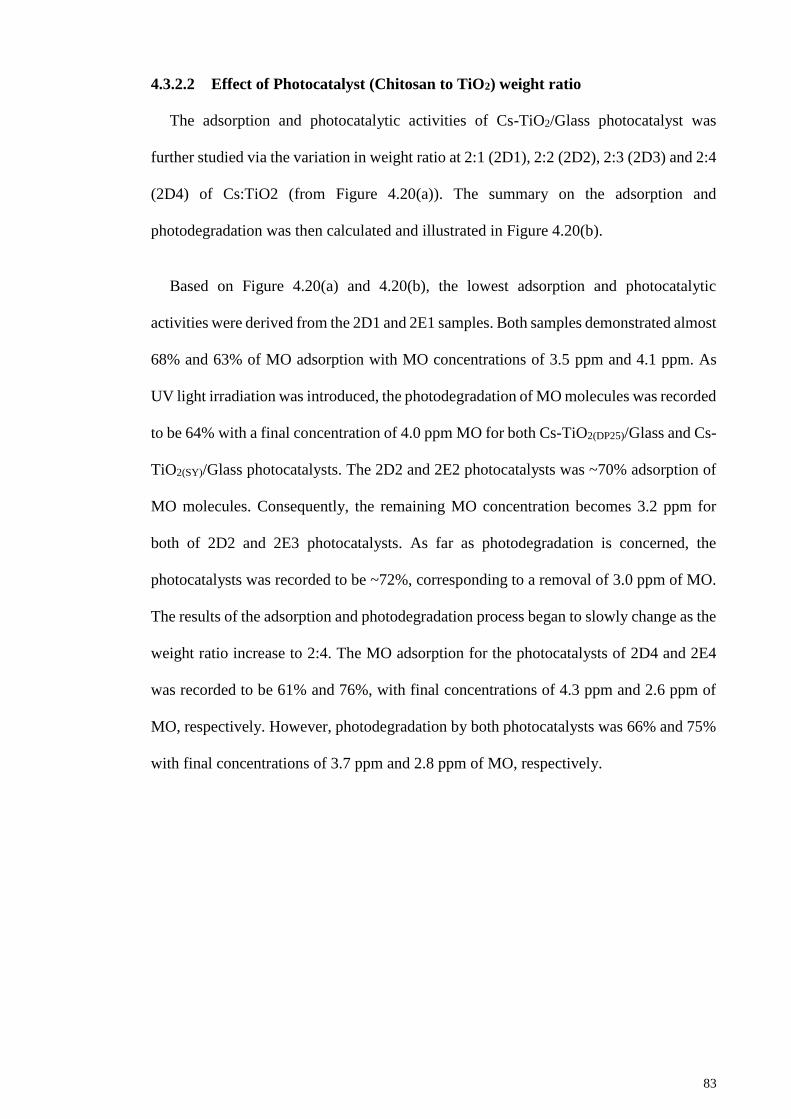
83
4.3.2.2 Effect of Photocatalyst (Chitosan to TiO2) weight ratio
The adsorption and photocatalytic activities of Cs-TiO2/Glass photocatalyst was
further studied via the variation in weight ratio at 2:1 (2D1), 2:2 (2D2), 2:3 (2D3) and 2:4
(2D4) of Cs:TiO2 (from Figure 4.20(a)). The summary on the adsorption and
photodegradation was then calculated and illustrated in Figure 4.20(b).
Based on Figure 4.20(a) and 4.20(b), the lowest adsorption and photocatalytic
activities were derived from the 2D1 and 2E1 samples. Both samples demonstrated almost
68% and 63% of MO adsorption with MO concentrations of 3.5 ppm and 4.1 ppm. As
UV light irradiation was introduced, the photodegradation of MO molecules was recorded
to be 64% with a final concentration of 4.0 ppm MO for both Cs-TiO2(DP25)/Glass and Cs-
TiO2(SY)/Glass photocatalysts. The 2D2 and 2E2 photocatalysts was ~70% adsorption of
MO molecules. Consequently, the remaining MO concentration becomes 3.2 ppm for
both of 2D2 and 2E3 photocatalysts. As far as photodegradation is concerned, the
photocatalysts was recorded to be ~72%, corresponding to a removal of 3.0 ppm of MO.
The results of the adsorption and photodegradation process began to slowly change as the
weight ratio increase to 2:4. The MO adsorption for the photocatalysts of 2D4 and 2E4
was recorded to be 61% and 76%, with final concentrations of 4.3 ppm and 2.6 ppm of
MO, respectively. However, photodegradation by both photocatalysts was 66% and 75%
with final concentrations of 3.7 ppm and 2.8 ppm of MO, respectively.
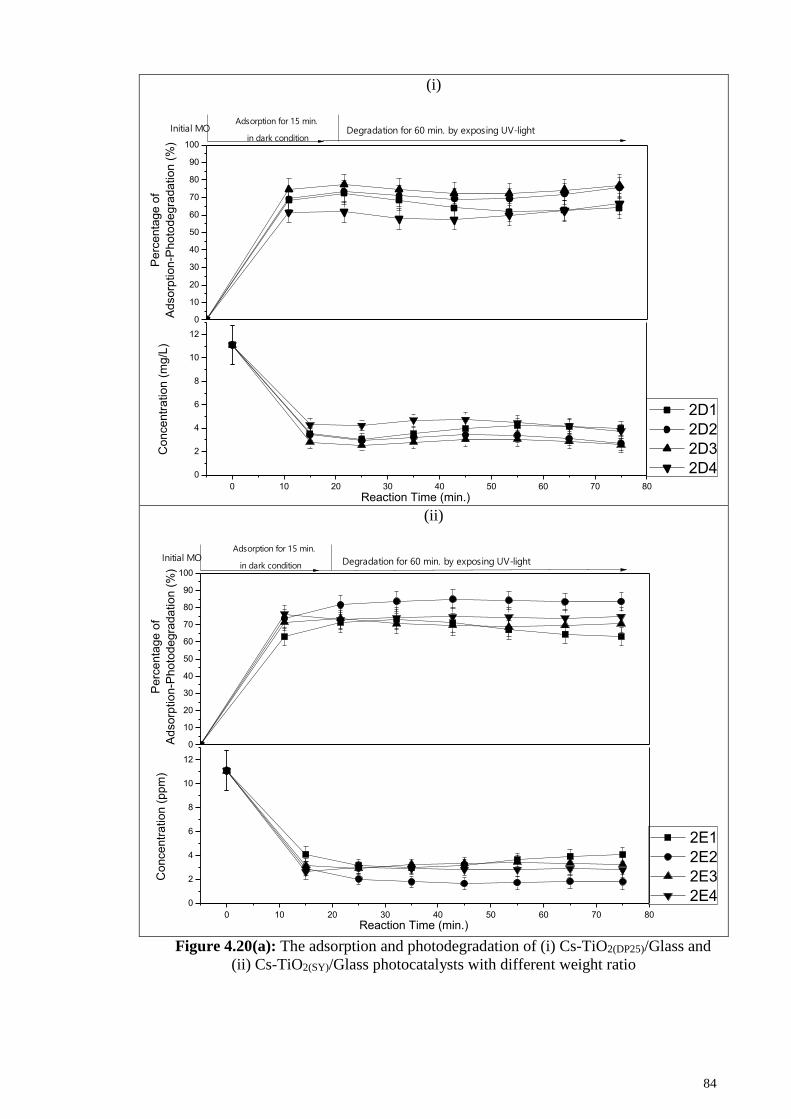
84
(i)
0
10
20
30
40
50
60
70
80
90
100
0 10 20 30 40 50 60 70 80
0
2
4
6
8
10
12
2D1
2D2
2D3
2D4
Perc
en
tag
e o
f
Ad
sorp
tio
n-P
hoto
de
gra
da
tio
n (
%)
Co
nce
ntr
atio
n (
mg
/L)
Initial MOAdsorption for 15 min.
in dark conditionDegradation for 60 min. by exposing UV-light
Reaction Time (min.)
(ii)
0
10
20
30
40
50
60
70
80
90
100
0 10 20 30 40 50 60 70 80
0
2
4
6
8
10
12
2E1
2E2
2E3
2E4
Pe
rcenta
ge o
f
Ad
sorp
tio
n-P
hoto
de
gra
da
tio
n (
%)
Co
nce
ntr
atio
n (
ppm
)
Initial MOAdsorption for 15 min.
in dark condition Degradation for 60 min. by exposing UV-light
Reaction Time (min.)
Figure 4.20(a): The adsorption and photodegradation of (i) Cs-TiO2(DP25)/Glass and
(ii) Cs-TiO2(SY)/Glass photocatalysts with different weight ratio
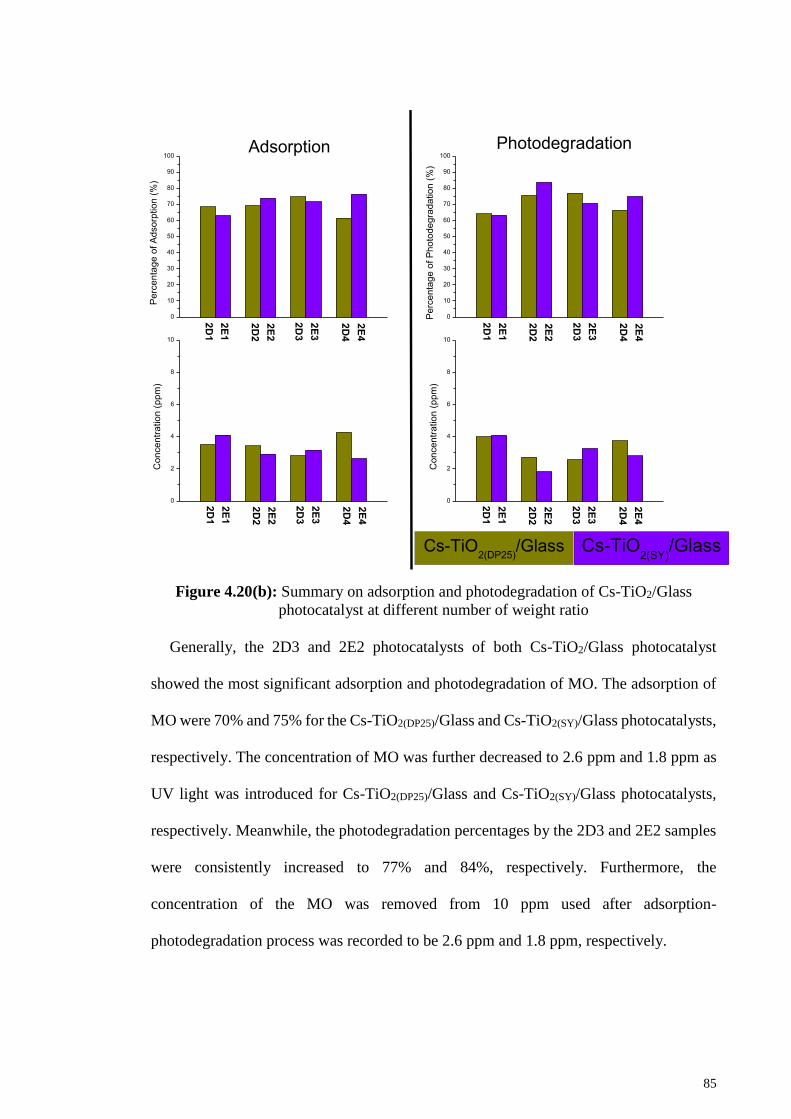
85
Figure 4.20(b): Summary on adsorption and photodegradation of Cs-TiO2/Glass
photocatalyst at different number of weight ratio
Generally, the 2D3 and 2E2 photocatalysts of both Cs-TiO2/Glass photocatalyst
showed the most significant adsorption and photodegradation of MO. The adsorption of
MO were 70% and 75% for the Cs-TiO2(DP25)/Glass and Cs-TiO2(SY)/Glass photocatalysts,
respectively. The concentration of MO was further decreased to 2.6 ppm and 1.8 ppm as
UV light was introduced for Cs-TiO2(DP25)/Glass and Cs-TiO2(SY)/Glass photocatalysts,
respectively. Meanwhile, the photodegradation percentages by the 2D3 and 2E2 samples
were consistently increased to 77% and 84%, respectively. Furthermore, the
concentration of the MO was removed from 10 ppm used after adsorption-
photodegradation process was recorded to be 2.6 ppm and 1.8 ppm, respectively.
0
10
20
30
40
50
60
70
80
90
100
Pe
rce
nta
ge
of
Ad
so
rptio
n (
%)
Adsorption
0
10
20
30
40
50
60
70
80
90
100
Photodegradation
Pe
rce
nta
ge
of
Ph
oto
de
gra
da
tio
n (
%)
2E
1
2D
1
2E
2
2D
2
2E
3
2D
3
2E
4
2D
4
2E
1
2D
1
2E
2
2D
2
2E
3
2D
3
2E
4
2D
4
2E
1
2D
1
2E
2
2D
2
2E
3
2D
3
2E
4
2D
4
0
2
4
6
8
10
Cs-TiO2(DP25)
/Glass
Co
nce
ntr
atio
n (
pp
m)
Cs-TiO2(SY)
/Glass2E
1
2D
1
2E
2
2D
2
2E
3
2D
3
2E
4
2D
4
0
2
4
6
8
10
Co
nce
ntr
atio
n (
pp
m)
86
It is anticipated that photocatalysts with greater amounts of TiO2 nanoparticles resulted
in higher levels of photodegradation. However, it might decrease adsorption, due to the
active surface of Cs being coated with larger amounts of TiO2. This can be further
explained by the fact that the increased weight percentage of TiO2 providing higher
degrees of freedom and distribution within the Cs matrix. Finally, the Cs-TiO2/Glass
photocatalyst with better bonding and distribution of the hybrid component resulted in a
greater degree of adsorption and photodegradation of photocatalytic activities. This is
evident in the FTIR results of photocatalysis, where NH2, R-NH and OH functional
groups on Cs, together with TiO2 metal oxide, was detected, which confirms the effective
removal of MO via the adsorption-photodegradation process.
4.3.2.3 Effect of initial concentration on adsorption and photodegradation activities
Figures 4.21(a) show the adsorption and photodegradation performance of 2D3 (Cs-
TiO2(DP25)/Glass) and 2E2 (Cs-TiO2(SY)/Glass) photocatalysts samples at multiple MO
initial concentrations (5, 10, 15, and 20 ppm). The summary of both adsorption and
photodegradation are illustrated in Figure 4.21(b).
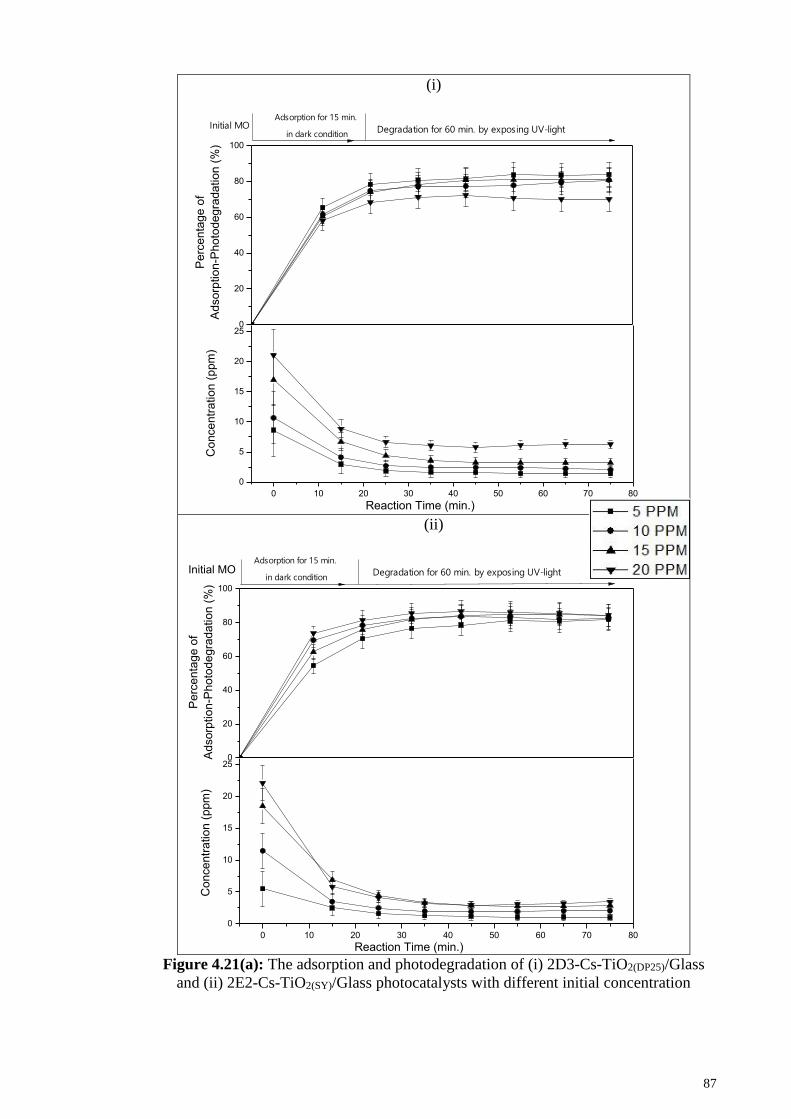
87
(i)
0
20
40
60
80
100
0 10 20 30 40 50 60 70 80
0
5
10
15
20
25
Pe
rce
nta
ge o
f
Ad
sorp
tio
n-P
hoto
de
gra
da
tio
n (
%)
Co
nce
ntr
atio
n (
ppm
)
Initial MOAdsorption for 15 min.
in dark conditionDegradation for 60 min. by exposing UV-light
Reaction Time (min.)
(ii)
0
20
40
60
80
100
0 10 20 30 40 50 60 70 80
0
5
10
15
20
25
Reaction Time (min.)
Pe
rce
nta
ge o
f
Ad
sorp
tio
n-P
hoto
de
gra
da
tio
n (
%)
Co
nce
ntr
atio
n (
ppm
)
Initial MOAdsorption for 15 min.
in dark conditionDegradation for 60 min. by exposing UV-light
Figure 4.21(a): The adsorption and photodegradation of (i) 2D3-Cs-TiO2(DP25)/Glass
and (ii) 2E2-Cs-TiO2(SY)/Glass photocatalysts with different initial concentration
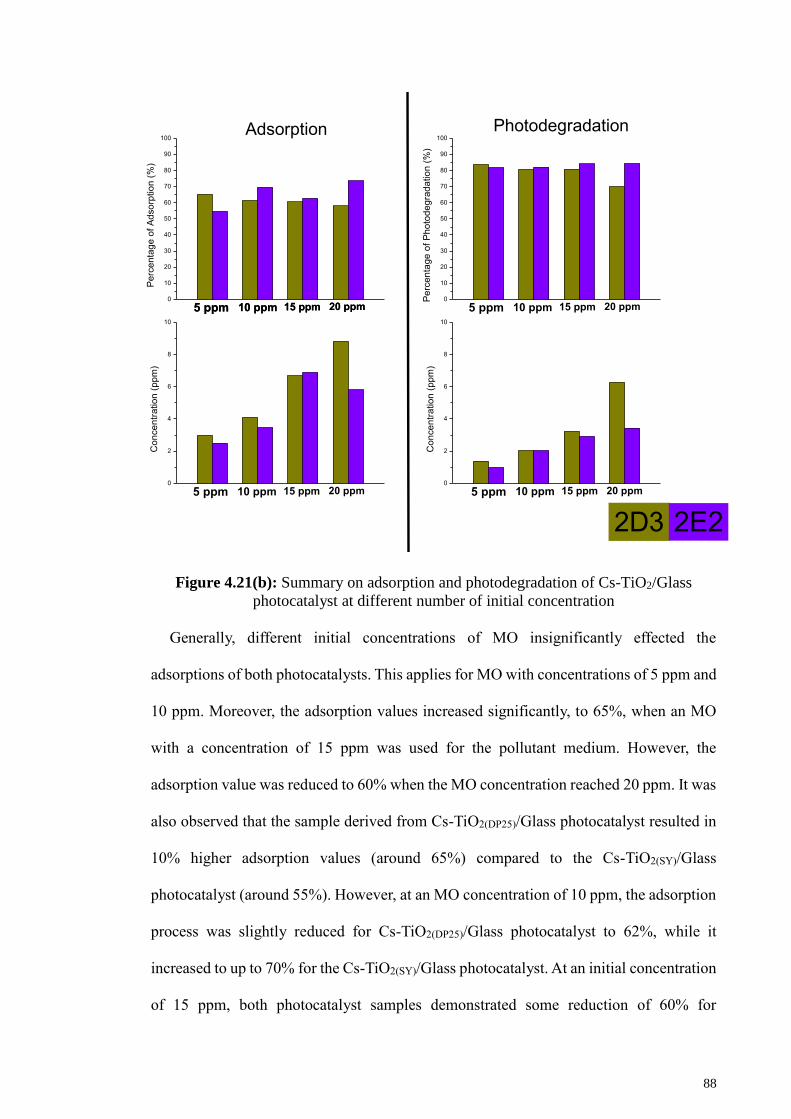
88
Figure 4.21(b): Summary on adsorption and photodegradation of Cs-TiO2/Glass
photocatalyst at different number of initial concentration
Generally, different initial concentrations of MO insignificantly effected the
adsorptions of both photocatalysts. This applies for MO with concentrations of 5 ppm and
10 ppm. Moreover, the adsorption values increased significantly, to 65%, when an MO
with a concentration of 15 ppm was used for the pollutant medium. However, the
adsorption value was reduced to 60% when the MO concentration reached 20 ppm. It was
also observed that the sample derived from Cs-TiO2(DP25)/Glass photocatalyst resulted in
10% higher adsorption values (around 65%) compared to the Cs-TiO2(SY)/Glass
photocatalyst (around 55%). However, at an MO concentration of 10 ppm, the adsorption
process was slightly reduced for Cs-TiO2(DP25)/Glass photocatalyst to 62%, while it
increased to up to 70% for the Cs-TiO2(SY)/Glass photocatalyst. At an initial concentration
of 15 ppm, both photocatalyst samples demonstrated some reduction of 60% for
0
10
20
30
40
50
60
70
80
90
100
Pe
rce
nta
ge
of
Ad
so
rptio
n (
%)
Adsorption
0
10
20
30
40
50
60
70
80
90
100
Photodegradation
Pe
rce
nta
ge
of
Ph
oto
de
gra
da
tio
n (
%)
0
2
4
6
8
10
2D3
Co
nce
ntr
atio
n (
pp
m)
2E2
10 ppm5 ppm 20 ppm15 ppm 10 ppm5 ppm 20 ppm15 ppm
10 ppm5 ppm 20 ppm15 ppm
0
2
4
6
8
10
Co
nce
ntr
atio
n (
pp
m)
10 ppm5 ppm 20 ppm15 ppm 10 ppm5 ppm 20 ppm15 ppm
89
adsorption properties. Finally, using an MO with a concentration of 20 ppm as the
pollutant medium resulted in adsorption values of 75% and 55% for Cs-TiO2(SY)/Glass
and Cs-TiO2(DP25)/Glass photocatalysts, respectively.
It is expected that at higher concentrations, the ratio of the initial number of the
available adsorption sites to the dye molecules was low, thus the number of available
adsorption sites becomes lower, which subsequently reduced the rate of removal of dyes.
Moreover, as higher concentrations of MO were used, the relationship between MO
concentrations of particular obtainable adsorption by the Cs-TiO2/Glass photocatalyst to
the MO pollutant medium is rather minimal. Moreover, the number of obtainable
adsorption by the Cs-TiO2/Glass photocatalyst decreased to the subsequent adsorbed MO
(R. Huang et al., 2013). Under UV light irradiation, the Cs-TiO2(DP25)/Glass photocatalyst
recorded a significant photodegradation of almost 85% when 5 ppm was used as the
starting initial concentration. Next, the photodegradation process decreased to 70% as the
initial concentration used was increased to 20 ppm. Furthermore, the Cs-TiO2(DP25)/Glass
photocatalyst was effectively photodegraded until 15 ppm of the initial concentration,
with 80% of photodegradation percentage. The process decreased the photodegradation
percentage when the initial concentration was 20 ppm. The photocatalytic system become
more saturated at higher concentrations of MO, consequently resulting in lesser
breakthrough and exhaustion time compared to lower initial concentrations. Furthermore,
the photodegradation of Cs-TiO2(SY)/Glass photocatalyst fully functioned and retained the
percentage from 80% to 85% as the initial concentration of MO was increased from 5
ppm to 20 ppm.
The improvement on adsorption, as well as the photodegradation, was brought about
by the saturation of active sites on the catalyst’s surface with the MO molecules can be
determining using FTIR analysis. Moreover, the MO solution was rendered darker at
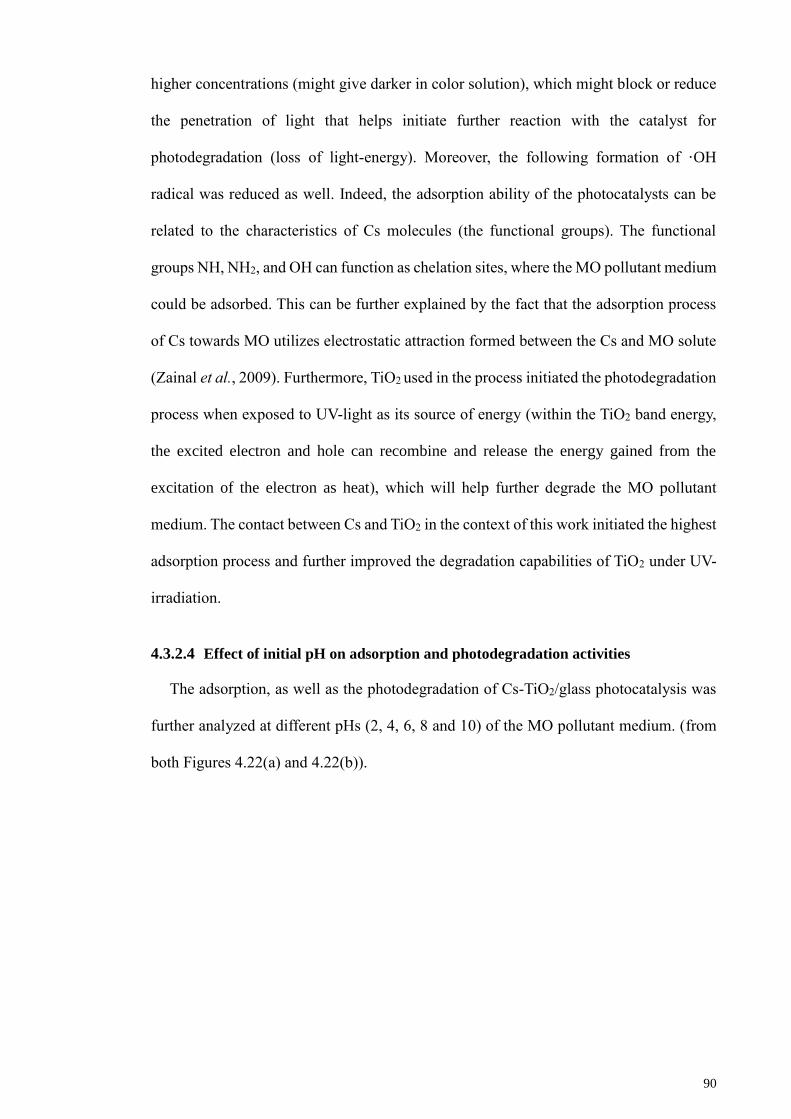
90
higher concentrations (might give darker in color solution), which might block or reduce
the penetration of light that helps initiate further reaction with the catalyst for
photodegradation (loss of light-energy). Moreover, the following formation of ·OH
radical was reduced as well. Indeed, the adsorption ability of the photocatalysts can be
related to the characteristics of Cs molecules (the functional groups). The functional
groups NH, NH2, and OH can function as chelation sites, where the MO pollutant medium
could be adsorbed. This can be further explained by the fact that the adsorption process
of Cs towards MO utilizes electrostatic attraction formed between the Cs and MO solute
(Zainal et al., 2009). Furthermore, TiO2 used in the process initiated the photodegradation
process when exposed to UV-light as its source of energy (within the TiO2 band energy,
the excited electron and hole can recombine and release the energy gained from the
excitation of the electron as heat), which will help further degrade the MO pollutant
medium. The contact between Cs and TiO2 in the context of this work initiated the highest
adsorption process and further improved the degradation capabilities of TiO2 under UV-
irradiation.
4.3.2.4 Effect of initial pH on adsorption and photodegradation activities
The adsorption, as well as the photodegradation of Cs-TiO2/glass photocatalysis was
further analyzed at different pHs (2, 4, 6, 8 and 10) of the MO pollutant medium. (from
both Figures 4.22(a) and 4.22(b)).
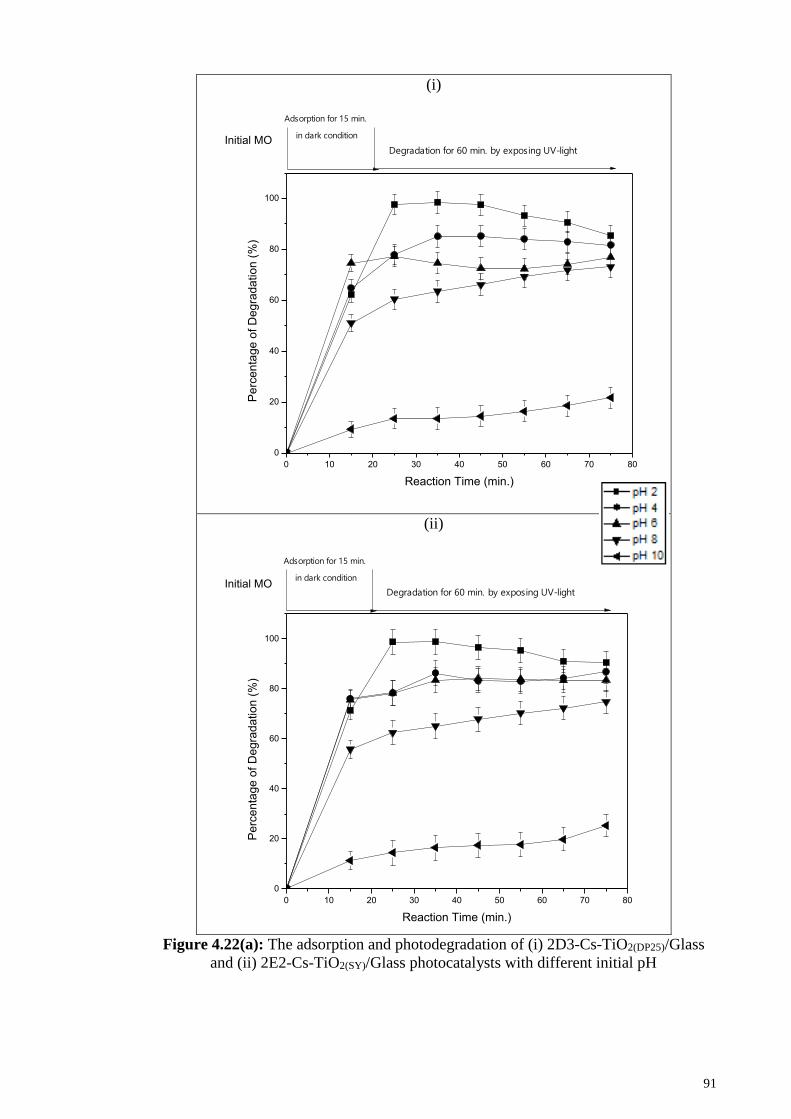
91
(i)
0 10 20 30 40 50 60 70 80
0
20
40
60
80
100
Pe
rce
nta
ge o
f D
egra
da
tio
n (
%)
Reaction Time (min.)
Initial MO
Adsorption for 15 min.
in dark condition
Degradation for 60 min. by exposing UV-light
(ii)
0 10 20 30 40 50 60 70 80
0
20
40
60
80
100
Pe
rce
nta
ge o
f D
egra
da
tio
n (
%)
Reaction Time (min.)
Initial MO
Adsorption for 15 min.
in dark condition
Degradation for 60 min. by exposing UV-light
Figure 4.22(a): The adsorption and photodegradation of (i) 2D3-Cs-TiO2(DP25)/Glass
and (ii) 2E2-Cs-TiO2(SY)/Glass photocatalysts with different initial pH
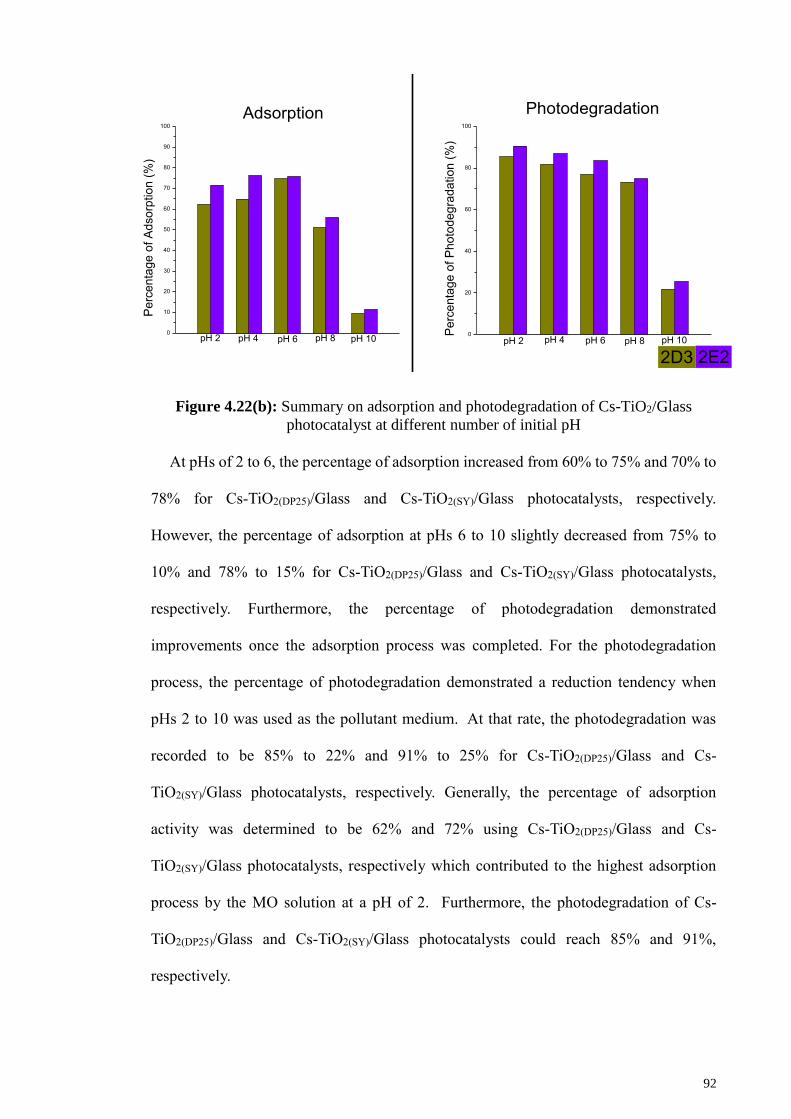
92
Figure 4.22(b): Summary on adsorption and photodegradation of Cs-TiO2/Glass
photocatalyst at different number of initial pH
At pHs of 2 to 6, the percentage of adsorption increased from 60% to 75% and 70% to
78% for Cs-TiO2(DP25)/Glass and Cs-TiO2(SY)/Glass photocatalysts, respectively.
However, the percentage of adsorption at pHs 6 to 10 slightly decreased from 75% to
10% and 78% to 15% for Cs-TiO2(DP25)/Glass and Cs-TiO2(SY)/Glass photocatalysts,
respectively. Furthermore, the percentage of photodegradation demonstrated
improvements once the adsorption process was completed. For the photodegradation
process, the percentage of photodegradation demonstrated a reduction tendency when
pHs 2 to 10 was used as the pollutant medium. At that rate, the photodegradation was
recorded to be 85% to 22% and 91% to 25% for Cs-TiO2(DP25)/Glass and Cs-
TiO2(SY)/Glass photocatalysts, respectively. Generally, the percentage of adsorption
activity was determined to be 62% and 72% using Cs-TiO2(DP25)/Glass and Cs-
TiO2(SY)/Glass photocatalysts, respectively which contributed to the highest adsorption
process by the MO solution at a pH of 2. Furthermore, the photodegradation of Cs-
TiO2(DP25)/Glass and Cs-TiO2(SY)/Glass photocatalysts could reach 85% and 91%,
respectively.
0
10
20
30
40
50
60
70
80
90
100
pH 2 pH 10pH 8pH 6pH 4
Adsorption
Pe
rcenta
ge o
f A
dsorp
tion
(%
)
2D3 2E2pH 2 pH 10pH 8pH 6pH 4
0
20
40
60
80
100
Photodegradation
Pe
rcenta
ge o
f P
hoto
degra
dation (
%)
93
The mechanism between the activity of adsorption-photodegradation by Cs-
TiO2/Glass photocatalyst and initial pH of MO can be explain based on the concentration
of H+ and OH- ions present in the MO medium. It depends on the nature of the MO being
used to adsorb and degrade. Furthermore, most industrial effluents contributing to dye
waste will not usually be generated at neutral pH. According to Akpan and Hameed
(2009), most study confirmed that the use of catalysts such as TiO2 is effective for
degradation at lower pHs, similar to the ones reported elsewhere, which is attributed to
the strong electrostatic field of the Cs-TiO2/Glass photocatalyst enhancing photocatalytic
performance between the surface of TiO2 catalyst with positive charges, and the charges
from solution, which is mostly negative. However, lower pHs could adversely affect the
catalyst during the photocatalytic process (Akpan & Hameed, 2009), making it necessary
that the adsorption characteristics of MO on the surface of Cs-TiO2/Glass photocatalyst
is investigated prior to the extended photodegradation process. According to R. Huang et
al. (2013), Cs could be used as an adsorbent at an optimal pH of between 3-6. For the Cs-
TiO2/Glass photocatalyst, high adsorption was obtained at a pH of 2 due to the protonation
of the –NH3 groups in Cs prior to adsorption. The process can be explained by the fact
that the MO can be contained within an aqueous solution, after which the sulfonate groups
(R–SO3Na) of the absorbed MO are dissociated, rendering them anionic for absorption to
the MO ions. At this point, the adsorption process is completed, due to the electrostatic
attractions between the adsorbent surface, as well as the MO anions. However, the
decrease of MO adsorption can be explained by the competition of the abundant presence
of OH− ions in the basic solution for the adsorption sites with MO anions (R. Huang et
al., 2013). The recombination of holes and photoelectrons can be avoided when the MO
pollutant medium was adsorbed by the photocatalyst media. This can be explained by the
fact that the MO molecules can only be degraded near the surface of the Cs-TiO2/Glass
photocatalyst by the ·OH free radical. Furthermore, superoxide free radicals are generated
94
by irradiating the Cs-TiO2/Glass photocatalyst. This basically means that higher
percentages of MO molecules was adsorbed on the surface of Cs-TiO2/Glass
photocatalyst, which translate into extended degradation time for the MO molecules (Xu
et al., 2010).
4.3.2.5 Adsorption analysis
The adsorption and photodegradation of MO molecules have been further analyzed
with FTIR analysis. (Figure 4.23) Apparently, the presence on funtional groups of
adsorption site could be realize by NH2, NH, and OH functional groups together with
TiO2 metal oxide. These series of functional groups help to confirm the effective removal
of MO through adsorption-photodegradation process. After adsorption-photodegradation
process, it has been observed that some changes occured as a result of the interaction
between the photocatalysts system toward MO solution. First of all, the presence of TiO2
molecule recorded with strong absorbance bands at 498 cm-1 with shoulder at 680 cm-1.
In the peak of 3745 cm-1, the spectral transmittance also appeared as sharper bands for
Cs-TiO2, indicating that –OH groups of Cs has been attached to TiO2 network (Fajriati et
al., 2014). Furthermore, the adsorption bands of Cs were measuring to the peaks of 3420
and 1660 cm-1 which is assigned to –OH (mostly adsorption toward TiO2) and –NH2
(mostly adsorption toward MO) functional groups, respectively. Furthermore, the mode
of the Cs can be also confirmed by peaks of 1535 cm-1 which is identified the functional
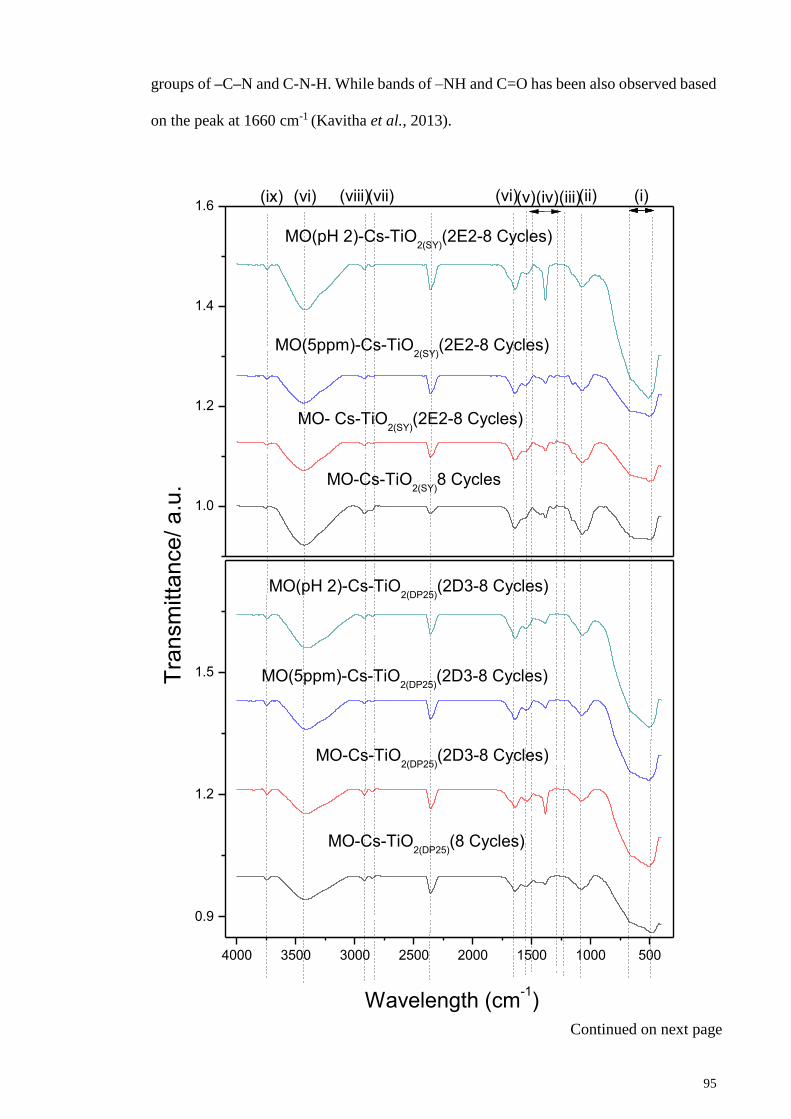
95
groups of –C–N and C-N-H. While bands of –NH and C=O has been also observed based
on the peak at 1660 cm-1 (Kavitha et al., 2013).
Continued on next page
1.0
1.2
1.4
1.6
4000 3500 3000 2500 2000 1500 1000 500
0.9
1.2
1.5
MO(pH 2)-Cs-TiO2(SY)
(2E2-8 Cycles)
MO(5ppm)-Cs-TiO2(SY)
(2E2-8 Cycles)
MO- Cs-TiO2(SY)
(2E2-8 Cycles)
MO-Cs-TiO2(SY)
8 Cycles
MO(pH 2)-Cs-TiO2(DP25)
(2D3-8 Cycles)
MO(5ppm)-Cs-TiO2(DP25)
(2D3-8 Cycles)
MO-Cs-TiO2(DP25)
(2D3-8 Cycles)
MO-Cs-TiO2(DP25)
(8 Cycles)
Wavelength (cm-1)
Tra
nsm
itta
nce
/ a
.u.
(ix)
(ii) (i)(vi) (viii)(vii) (vi)(v)(iv)(iii)
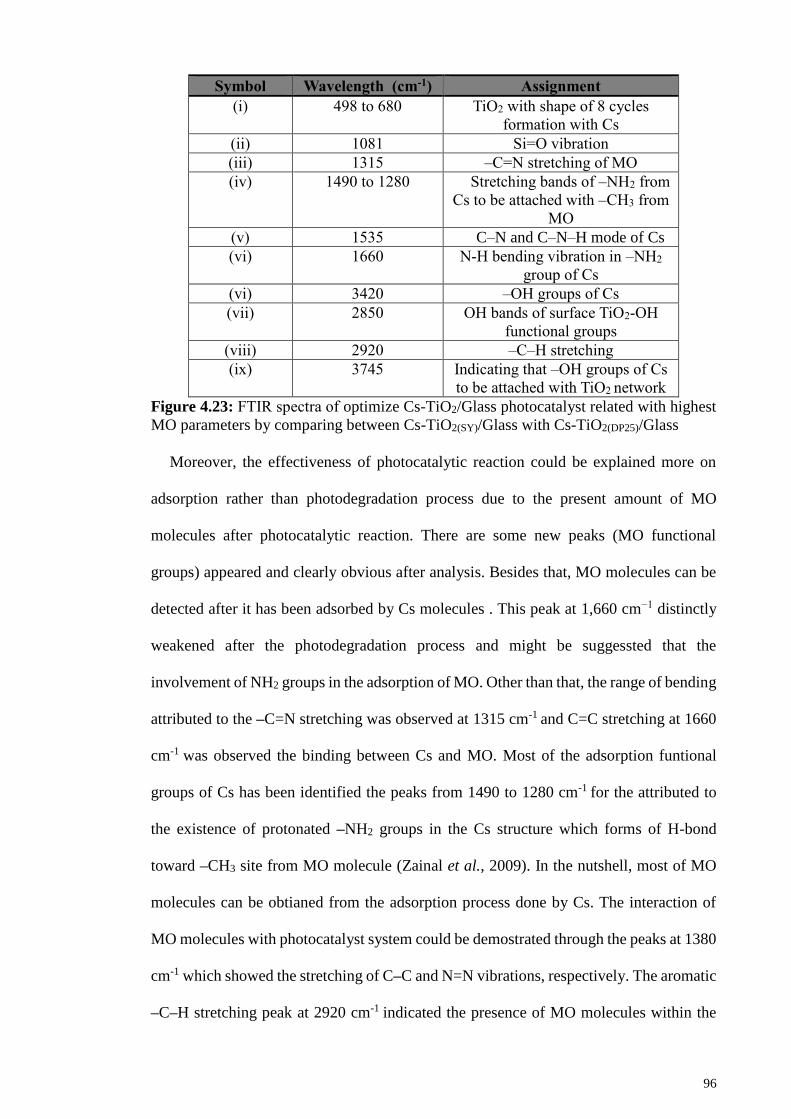
96
Symbol Wavelength (cm-1) Assignment
(i) 498 to 680 TiO2 with shape of 8 cycles
formation with Cs
(ii) 1081 Si=O vibration
(iii) 1315 –C=N stretching of MO
(iv) 1490 to 1280 Stretching bands of –NH2 from
Cs to be attached with –CH3 from
MO
(v) 1535 C–N and C–N–H mode of Cs
(vi) 1660 N-H bending vibration in –NH2
group of Cs
(vi) 3420 –OH groups of Cs
(vii) 2850 OH bands of surface TiO2-OH
functional groups
(viii) 2920 –C–H stretching
(ix) 3745 Indicating that –OH groups of Cs
to be attached with TiO2 network
Figure 4.23: FTIR spectra of optimize Cs-TiO2/Glass photocatalyst related with highest
MO parameters by comparing between Cs-TiO2(SY)/Glass with Cs-TiO2(DP25)/Glass
Moreover, the effectiveness of photocatalytic reaction could be explained more on
adsorption rather than photodegradation process due to the present amount of MO
molecules after photocatalytic reaction. There are some new peaks (MO functional
groups) appeared and clearly obvious after analysis. Besides that, MO molecules can be
detected after it has been adsorbed by Cs molecules . This peak at 1,660 cm−1 distinctly
weakened after the photodegradation process and might be suggessted that the
involvement of NH2 groups in the adsorption of MO. Other than that, the range of bending
attributed to the –C=N stretching was observed at 1315 cm-1 and C=C stretching at 1660
cm-1 was observed the binding between Cs and MO. Most of the adsorption funtional
groups of Cs has been identified the peaks from 1490 to 1280 cm-1 for the attributed to
the existence of protonated –NH2 groups in the Cs structure which forms of H-bond
toward –CH3 site from MO molecule (Zainal et al., 2009). In the nutshell, most of MO
molecules can be obtianed from the adsorption process done by Cs. The interaction of
MO molecules with photocatalyst system could be demostrated through the peaks at 1380
cm-1 which showed the stretching of C–C and N=N vibrations, respectively. The aromatic
–C–H stretching peak at 2920 cm-1 indicated the presence of MO molecules within the
97
photocatalyst system. Furthermore, the spectra was recorded in the form of a strong
increase of absorbance below 1081 cm-1 represented by the stretching of –S=O
functhional groups. Confirmation with the characteristics of MO molecules were
exhibited from the peaks at 1081 cm-1 –S=O stretching vibrations; 2920 cm-1 –CH
stretching; 1315 cm-1 –C=N stretching were recorded accordingly (Nandini &
Vishalakshi, 2012). For confirmation, peak around 2360 cm-1 was not a characteristic
peaks of Cs-TiO2 photocatalyst or even MO but was due to CO2 that may effects through
calculating circumstances. Other than that, comparing with single TiO2 photocatalyst on
the glass substrate by studies done by R. F. Chen and Zhang (2008); Ganesh et al. (2012);
Serpone et al. (1986), it may have high surface area and some modification with TiO2
morphological structure. Furthermore, the photocatalytic activity was highly enhance in
performing degradation with dyes pollutant by comparing in using single TiO2.
98
CHAPTER 5: CONCLUSION
5.1 Conclusion
TiO2 nanoparticles have been successfully synthesized via the sol-gel method, with
crystalline and particle sizes of 10 and 20 nm, respectively. It can also be confirmed from
the XRD and Raman Spectroscopy results the anatase phase for TiO2 nanoparticle
(TiO2(SY)) was successfully formed. The morphology analysis of TiO2 showed
agglomerated small and large particles, composed of 63% of the Ti-element. Finally, the
band gap energy of TiO2 was recorded to be 3.20 eV, proving that the nanoparticles are
applicable within the UV-light region.
Cs-TiO2/Glass photocatalyst were formed via the dip coating method. FTIR analysis
confirmed that the photocatalysts with 2, 4, 6 and 8 cycles between Cs and TiO2 on the
glass substrate of Cs-TiO2(SY)/Glass and Cs-TiO2(DP25)/Glass photocatalysts has NH2, R-
NH and OH functional groups, alongside TiO2. Indeed, a good and homogenous
distribution of TiO2 within the Cs matrix was evident in the FESEM images. Generally,
the TiO2 nanoparticles were spherical and measures between 10-30 nm. EDS analysis
revealed that both photocatalysts are equally dominated by TiO2. The band gap energy of
each photocatalysts, determined by UV-DR, proved that the band gap energy was
influenced by the change in cycles and weight ratio of the TiO2 nanoparticles.
Finally, the adsorption and photocatalytic activities were conducted at two different
parameters, which are number of cycle and weight ratio. It was determined that the
photocatalyst with 8 cycles resulted in the highest adsorption and photocatalytic activities,
at 68% and 70% for Cs-TiO2(DP25)/Glass and Cs-TiO2(SY)/Glass photocatalysts,
respectively. It is expected that higher numbers of photocatalysts cycles results in
increased adsorption and photodegradation active centers. In terms of weight ratio, it was
determined that the sample with weight ratios of 2D3 and 2E2 photocatalysts (most
99
optimized Cs-TiO2/Glass) demonstrated ~75% adsorption and 80% of photodegradation.
This was due to the fact that the photocatalyst, with certain ratios of Cs and TiO2, resulted
in satisfactory bonding, which consequently enhances adsorption and photodegradation.
Furthermore, the highest adsorption and photodegradation was achieved at a
concentration of 15 ppm MO. This was so since increased concentration of MO contribute
to the reduction of light penetration during photocatalytic activity, slowing the
adsorption-photodegradation process. The effect on pH was quite significant, where the
adsorption and photodegradation process is significantly more effective at a pH of 2. This
was due to the electrostatic field between the photocatalyst and MO being affected.
In a nutshell, combined Cs and TiO2 results in an advanced and highly efficient
adsorption and photodegradation for MO synthetic dye purification. The Cs functions as
the host material for the adsorption site of TiO2, which consequently results in better
dispersion and separation of photocatalyst in a pollutant medium. Cs provides the unique
components related to the presence of polar groups (OH and NH2), while TiO2 could help
by further degrading the MO by being supported by the UV-light as its energy source to
influence photodegradation. Moreover, Cs, along with TiO2, would transform their
respective chains by being stretched on glass surfaces. Furthermore, it will also straighten
itself on the smooth glass surfaces, or form hydrophobic minuscule domains via the dip-
coating method. It can also be used on compact glass substrates, which also helps curtail
movements.
100
5.2 Future work
This thesis presented a number of advances for Cs-TiO2/Glass based photocatalysis
system and its application for the adsorption-photodegradation of synthetic dyes in
wastewaters. Furthermore, several future directions related to this research were
identified, and listed as follows:-
The efficiency of any Cs-TiO2/Glass photocatalyst is on par with the standard
TiO2 nanoparticle set, and this study has proven that the adsorption process of the
Cs-TiO2/Glass photocatalyst is much greater than that of TiO2 nanoparticles.
However, 8 cycles of Cs-TiO2/Glass photocatalyst resulted in high photocatalytic
reaction up till 75 minutes. However, the exact time needed to complete the
photodegradation process was not accurately determined. This could be addressed
by increasing the irradiation time to exceed 75 minutes up till the point where the
solution will be fully degraded.
Other different adsorbent materials, such as activated carbon, cellulose, silica gel,
or clay for example, can be combined with the photocatalyst system to increase
adsorption and photodegradation activity. Furthermore, the physical, chemical,
interfacial, and semiconductive properties of the composite can be further
analyzed as well.
The effect of visible light was not investigated in this work; additional
investigative focus on the different irradiation intensity inside the photoreactor
include a good evaluation of the impact of irradiation effect for the reactor’s
performance. Additionally, the alternative light transmitting material could be
investigated for the construction of the reaction vessel (e.g. borosilicate glass)
cylinders. Solar irradiation could also be investigated using a novel reactor
configuration.

101
More reaction with different types of pollutants, including metal ions, chemical
compounds, herbicides, pesticides, hormones, and others could be degraded using
the photocatalysts system. Indeed, many synthetic dyes, such as different azo dyes
including Methylene Blue, Malachite Green, Crocein Orange, Methyl Red, or
Congo Red can also be the subject or model of pollutant compounds.
102
REFERENCES
Akpan, U., & Hameed, B. (2009). Parameters affecting the photocatalytic degradation of
dyes using TiO 2-based photocatalysts: a review. Journal of hazardous materials,
170(2), 520-529.
Allen, E., & Smith, P. (2001). A review of particle agglomeration. Surfaces, 85(86), 87.
Amin, K. A. M. (2012). Reinforced materials based on chitosan, TiO2 and Ag
composites. Polymers, 4(1), 590-599.
Andriantsiferana, C., Mohamed, E. F., & Delmas, H. (2014). Photocatalytic degradation
of an azo-dye on TiO2/activated carbon composite material. Environ Technol,
35(1-4), 355-363.
Antonio-Cisneros, C. M., Davila-Jimenez, M. M., Elizalde-Gonzalez, M. P., & Garcia-
Diaz, E. (2015). TiO2 immobilized on Manihot carbon: optimal preparation and
evaluation of its activity in the decomposition of indigo carmine. Int J Mol Sci,
16(1), 1590-1612.
Aziz, R. A., & Sopyan, I. (2009). Synthesis of TiO2-SiO2 powder and thin film
photocatalysts by sol-gel method. Indian journal of chemistry. Section A,
Inorganic, bio-inorganic, physical, theoretical & analytical chemistry, 48(7),
951.
Ba-Abbad, M. M., Kadhum, A. A. H., Mohamad, A. B., Takriff, M. S., & Sopian, K.
(2012). Synthesis and catalytic activity of TiO2 nanoparticles for photochemical
oxidation of concentrated chlorophenols under direct solar radiation. Int. J.
Electrochem. Sci, 7, 4871-4888.
Bagheri, S., Hir, Z. A. M., Yousefi, A. T., & Hamid, S. B. A. (2015). Progress on
mesoporous titanium dioxide: synthesis, modification and applications.
Microporous and Mesoporous Materials, 218, 206-222.
Bagheri, S., Mohd Hir, Z. A., Termeh Yousefi, A., & Abd Hamid, S. B. (2015).
Photocatalytic performance of activated carbon-supported mesoporous titanium
dioxide. Desalination and Water Treatment, 1-7.
Bagheri, S., Muhd Julkapli, N., & Bee Abd Hamid, S. (2014). Titanium dioxide as a
catalyst support in heterogeneous catalysis. The Scientific World Journal, 2014.
Bagheri, S., Muhd Julkapli, N., & Bee Abd Hamid, S. (2015). Functionalized activated
carbon derived from biomass for photocatalysis applications perspective.
International Journal of Photoenergy, 2015.
Bagheri, S., Shameli, K., & Abd Hamid, S. B. (2012). Synthesis and characterization of
anatase titanium dioxide nanoparticles using egg white solution via Sol-Gel
method. Journal of Chemistry, 2013.
Benavente, M. (2008). Adsorption of metallic ions onto chitosan: equilibrium and kinetic
studies.
103
Beranek, R., & Kisch, H. (2008). Tuning the optical and photoelectrochemical properties
of surface-modified TiO 2. Photochemical & Photobiological Sciences, 7(1), 40-
48.
Bhalerao, N., Ishita, V. V., Patil, K., & Topare, N. (2013). A review on Parameters
Affecting the Photocatalytic Degradation of Dyes using Photocatalysts.
Byranvanda, M. M., Kharata, A. N., Fatholahib, L., & Beiranvandc, Z. M. A Review on
Synthesis of Nano-TiO2 via Different Methods.
Castellote, M., & Bengtsson, N. (2011). Principles of TiO2 Photocatalysis. In
Applications of Titanium Dioxide Photocatalysis to Construction Materials (pp.
5-10). Springer Netherlands.
Chang, H., & Seo, M. (2014). Photocatalytic Degradation of Gaseous Formaldehyde and
Benzene using TiO2 Particulate Films Prepared by the Flame Aerosol Reactor.
Environmental Engineering Research, 19(3), 215-221.
Chekin, F., Bagheri, S., & Hamid, S. B. A. (2013). Synthesis of Pt doped TiO 2
nanoparticles: characterization and application for electrocatalytic oxidation of l-
methionine. Sensors and Actuators B: Chemical, 177, 898-903.
Chen, R. F., & Zhang, C. X. (2008). Preparation and Photocatalytic Activity of TiO2
Films on Silica Glass Substrates by Assembly Technique. Journal of the Chinese
Chemical Society, 55(5), 1055-1061.
Chen, X., Liu, F., Liu, B., Tian, L., Hu, W., & Xia, Q. (2015). A novel route to graphite-
like carbon supporting SnO2 with high electron transfer and photocatalytic
activity. J Hazard Mater, 287, 126-132.
Cheng, C., Amini, A., Zhu, C., Xu, Z., Song, H., & Wang, N. (2014). Enhanced
photocatalytic performance of TiO2-ZnO hybrid nanostructures. Sci Rep, 4, 4181.
Chequer, F. M. D., de Oliveira, D. P., Ferraz, E. R. A., de Oliveira, G. A. R., Cardoso, J.
C., & Zanoni, M. V. B. (2013). Textile dyes: dyeing process and environmental
impact: INTECH Open Access Publisher.
Choi, H. C., Jung, Y. M., & Kim, S. B. (2005). Size effects in the Raman spectra of TiO
2 nanoparticles. Vibrational Spectroscopy, 37(1), 33-38.
Clara, M., Strenn, B., Gans, O., Martinez, E., Kreuzinger, N., & Kroiss, H. (2005).
Removal of selected pharmaceuticals, fragrances and endocrine disrupting
compounds in a membrane bioreactor and conventional wastewater treatment
plants. Water Res, 39(19), 4797-4807.
Daimon, T., & Nosaka, Y. (2007). Formation and behavior of singlet molecular oxygen
in TiO2 photocatalysis studied by detection of near-infrared phosphorescence.
The Journal of Physical Chemistry C, 111(11), 4420-4424.
Danwittayakul, S., Jaisai, M., & Dutta, J. (2015). Efficient solar photocatalytic
degradation of textile wastewater using ZnO/ZTO composites. Applied Catalysis
B: Environmental, 163, 1-8.
104
Doll, T. E., & Frimmel, F. H. (2004). Development of easy and reproducible
immobilization techniques using TiO2 for photocatalytic degradation of aquatic
pollutants. Acta hydrochimica et hydrobiologica, 32(3), 201-213.
Dutta, P. K., Dutta, J., & Tripathi, V. (2004). Chitin and chitosan: Chemistry, properties
and applications. Journal of Scientific and Industrial Research, 63(1), 20-31.
Fajriati, I., Mudasir, M., & Wahyuni, E. T. (2014). Photocatalytic Decolorization Study
of Methyl Orange by TiO 2–Chitosan Nanocomposites. Indonesian Journal of
Chemistry, 14(3), 209-218.
Faramarzpour, M., Vossoughi, M., & Borghei, M. (2009). Photocatalytic degradation of
furfural by titania nanoparticles in a floating-bed photoreactor. Chemical
Engineering Journal, 146(1), 79-85.
Farzana, M. H., & Meenakshi, S. (2013a). Enhanced photocatalytic degradation of
chromium (VI) under UV light on chitosan/TiO2 composite. Journal of Chitin
and Chitosan Science, 1(1), 42-49.
Farzana, M. H., & Meenakshi, S. (2013b). Synergistic effect of chitosan and titanium
dioxide on the removal of toxic dyes by the photodegradation technique.
Industrial & Engineering Chemistry Research, 53(1), 55-63.
Folli, A., Pochard, I., Nonat, A., Jakobsen, U. H., Shepherd, A. M., & Macphee, D. E.
(2010). Engineering photocatalytic cements: understanding TiO2 surface
chemistry to control and modulate photocatalytic performances. Journal of the
American Ceramic Society, 93(10), 3360-3369.
Fujishima, A. (1972). Electrochemical photolysis of water at a semiconductor electrode.
nature, 238, 37-38.
Fujishima, A., Zhang, X., & Tryk, D. A. (2007). Heterogeneous photocatalysis: from
water photolysis to applications in environmental cleanup. International journal
of hydrogen energy, 32(14), 2664-2672.
Gan, W., Lee, M., Amal, R., Zhao, H., & Chiang, K. (2008). Photoelectrocatalytic activity
of mesoporous TiO2 films prepared using the sol–gel method with tri-block
copolymer as structure directing agent. Journal of Applied Electrochemistry,
38(5), 703-712.
Ganesh, V. A., Nair, A. S., Raut, H. K., Walsh, T. M., & Ramakrishna, S. (2012).
Photocatalytic superhydrophilic TiO 2 coating on glass by electrospinning. Rsc
Advances, 2(5), 2067-2072.
Gao, B., Yap, P. S., Lim, T. M., & Lim, T.-T. (2011). Adsorption-photocatalytic
degradation of Acid Red 88 by supported TiO 2: effect of activated carbon support
and aqueous anions. Chemical Engineering Journal, 171(3), 1098-1107.
Ghosh, S. N. (2006). Environmental hydrology and hydraulics: eco-technological
practices for sustainable development: CRC Press.
105
Gray, N. (2004). Biology of wastewater treatment. Series on environmental science and
management: Imperial College Press, London.
Guan, K. (2005). Relationship between photocatalytic activity, hydrophilicity and self-
cleaning effect of TiO 2/SiO 2 films. Surface and Coatings Technology, 191(2),
155-160.
Guo, Q., Ghadiri, R., Weigel, T., Aumann, A., Gurevich, E. L., Esen, C., . . . Ostendorf,
A. (2014). Comparison of in Situ and ex Situ Methods for Synthesis of Two-
Photon Polymerization Polymer Nanocomposites. Polymers, 6(7), 2037-2050.
Harruddin, N., Othman, N., Lim Ee Sin, A., & Raja Sulaiman, R. N. (2015). Selective
removal and recovery of Black B reactive dye from simulated textile wastewater
using the supported liquid membrane process. Environmental technology, 36(3),
271-280.
Hashimoto, K., Irie, H., & Fujishima, A. (2005). TiO2 photocatalysis: a historical
overview and future prospects. Japanese journal of applied physics, 44(12R),
8269.
Hosseini, S., Borghei, S., Vossoughi, M., & Taghavinia, N. (2007). Immobilization of
TiO 2 on perlite granules for photocatalytic degradation of phenol. Applied
Catalysis B: Environmental, 74(1), 53-62.
Huang, K.-S., Grumezescu, A. M., Chang, C.-Y., Yang, C.-H., & Wang, C.-Y. (2014).
Immobilization and stabilization of TiO2 Nanoparticles in alkaline-solidificated
chitosan spheres without cross-linking agent. International Journal of Latest
Research in Science and Technology, 3(2), 174-178.
Huang, R., Liu, Q., Huo, J., & Yang, B. (2013). Adsorption of methyl orange onto
protonated cross-linked chitosan. Arabian Journal of Chemistry.
Ibhadon, A. O., & Fitzpatrick, P. (2013). Heterogeneous photocatalysis: recent advances
and applications. Catalysts, 3(1), 189-218.
Jaafar, N. F., Jalil, A. A., Triwahyono, S., Muhid, M. N. M., Sapawe, N., Satar, M. A. H.,
& Asaari, H. (2012). Photodecolorization of methyl orange over α-Fe 2 O 3-
supported HY catalysts: The effects of catalyst preparation and dealumination.
Chemical Engineering Journal, 191, 112-122.
Jamal, R., Osman, Y., Rahman, A., Ali, A., Zhang, Y., & Abdiryim, T. (2014). Solid-
State Synthesis and Photocatalytic Activity of Polyterthiophene Derivatives/TiO2
Nanocomposites. Materials, 7(5), 3786-3801.
Jiang, D., Zhang, S., & Zhao, H. (2007). Photocatalytic degradation characteristics of
different organic compounds at TiO2 nanoporous film electrodes with mixed
anatase/rutile phases. Environmental science & technology, 41(1), 303-308.
Jiang, H.-Y., Liu, G., Li, M., Liu, J., Sun, W., Ye, J., & Lin, J. (2015). Efficient organic
degradation under visible light by α-Bi 2 O 3 with a CuO x-assistant electron
transfer process. Applied Catalysis B: Environmental, 163, 267-276.
106
Jung, B. S., Boulos, P. F., Wood, D. J., & Bros, C. M. (2009). A Lagrangian wave
characteristic method for simulating transient water column separation. Journal
AWWA, 101(6), 64-73.
Kambur, A., Pozan, G. S., & Boz, I. (2012). Preparation, characterization and
photocatalytic activity of TiO 2–ZrO 2 binary oxide nanoparticles. Applied
Catalysis B: Environmental, 115, 149-158.
Kavitha, K., Sutha, S., Prabhu, M., Rajendran, V., & Jayakumar, T. (2013). In situ
synthesized novel biocompatible titania–chitosan nanocomposites with high
surface area and antibacterial activity. Carbohydrate Polymers, 93(2), 731-739.
Kijima, T. (2010). Inorganic and Metallic Nanotubular Materials: Recent Technologies
and Applications (Vol. 117): Springer Science & Business Media.
Kim, C., Kim, J. T., Kim, K. S., Jeong, S., Kim, H. Y., & Han, Y. S. (2009).
Immobilization of TiO 2 on an ITO substrate to facilitate the
photoelectrochemical degradation of an organic dye pollutant. Electrochimica
Acta, 54(24), 5715-5720.
Kim, C. H., Kim, B.-H., & Yang, K. S. (2012). TiO 2 nanoparticles loaded on
graphene/carbon composite nanofibers by electrospinning for increased
photocatalysis. Carbon, 50(7), 2472-2481.
Klankaw, P., Chawengkijwanich, C., Grisdanurak, N., & Chiarakorn, S. (2012). The
hybrid photocatalyst of TiO 2–SiO 2 thin film prepared from rice husk silica.
Superlattices and Microstructures, 51(3), 343-352.
Kleiman, A., Márquez, A., Vera, M., Meichtry, J., & Litter, M. (2011). Photocatalytic
activity of TiO 2 thin films deposited by cathodic arc. Applied Catalysis B:
Environmental, 101(3), 676-681.
Kumar, J., & Bansal, A. (2013). Photocatalysis by nanoparticles of titanium dioxide for
drinking water purification: a conceptual and state-of-art review. Paper presented
at the Materials Science Forum.
Kumar, S. G., & Devi, L. G. (2011). Review on modified TiO2 photocatalysis under
UV/visible light: selected results and related mechanisms on interfacial charge
carrier transfer dynamics. J Phys Chem A, 115(46), 13211-13241.
Kyzas, G. Z., & Bikiaris, D. N. (2015). Recent modifications of chitosan for adsorption
applications: a critical and systematic review. Mar Drugs, 13(1), 312-337.
Lazar, M. A., Varghese, S., & Nair, S. S. (2012). Photocatalytic water treatment by
titanium dioxide: recent updates. Catalysts, 2(4), 572-601.
Leary, R., & Westwood, A. (2011). Carbonaceous nanomaterials for the enhancement of
TiO 2 photocatalysis. Carbon, 49(3), 741-772.
Lin, Y.-C., & Lee, H.-S. (2010). Effects of TiO 2 coating dosage and operational
parameters on a TiO 2/Ag photocatalysis system for decolorizing Procion red
MX-5B. Journal of hazardous materials, 179(1), 462-470.
107
Linsebigler, A. L., Lu, G., & Yates Jr, J. T. (1995). Photocatalysis on TiO2 surfaces:
principles, mechanisms, and selected results. Chemical reviews, 95(3), 735-758.
Liu, G., Zhao, Y., Sun, C., Li, F., Lu, G. Q., & Cheng, H. M. (2008). Synergistic effects
of B/N doping on the visible-light photocatalytic activity of mesoporous TiO2.
Angew Chem Int Ed Engl, 47(24), 4516-4520.
Liu, H., Ramnarayanan, R., & Logan, B. E. (2004). Production of electricity during
wastewater treatment using a single chamber microbial fuel cell. Environmental
science & technology, 38(7), 2281-2285.
Lukes, P., Clupek, M., Sunka, P., Peterka, F., Sano, T., Negishi, N., . . . Takeuchi, K.
(2005). Degradation of phenol by underwater pulsed corona discharge in
combination with TiO 2 photocatalysis. Research on Chemical Intermediates,
31(4), 285-294.
Luttrell, T., Halpegamage, S., Tao, J., Kramer, A., Sutter, E., & Batzill, M. (2014). Why
is anatase a better photocatalyst than rutile?-Model studies on epitaxial TiO2
films. Scientific reports, 4.
Marković, D., Šaponjić, Z., Radoičić, M., Radetić, T., Vodnik, V., Potkonjak, B., &
Radetić, M. (2015). Sonophotocatalytic degradation of dye CI Acid Orange 7 by
TiO 2 and Ag nanoparticles immobilized on corona pretreated polypropylene non-
woven fabric. Ultrasonics sonochemistry, 24, 221-229.
McCullagh, C., Robertson, J. M., Bahnemann, D. W., & Robertson, P. K. (2007). The
application of TiO2 photocatalysis for disinfection of water contaminated with
pathogenic micro-organisms: a review. Research on Chemical Intermediates,
33(3-5), 359-375.
Mehranpour, H., Ghamsari, M. S., & Askari, M. (2011). Nucleation and Growth of TiO2
Nanoparticles: INTECH Open Access Publisher.
Meng, H., Hou, W., Xu, X., Xu, J., & Zhang, X. (2014). TiO 2-loaded activated carbon
fiber: Hydrothermal synthesis, adsorption properties and photo catalytic activity
under visible light irradiation. Particuology, 14, 38-43.
Minh, N., Hien, N., Vien, V., Kim, S., Noh, W., Yang, I., . . . Khoi, N. (2008). Nano-
Particles of Co Doped TiO~ 2 Anatase: Raman Spectroscopy and Structural
Studies. JOURNAL-KOREAN PHYSICAL SOCIETY, 52(5), 1629.
Moustakas, N., Kontos, A., Likodimos, V., Katsaros, F., Boukos, N., Tsoutsou, D., . . .
Falaras, P. (2013). Inorganic–organic core–shell titania nanoparticles for efficient
visible light activated photocatalysis. Applied Catalysis B: Environmental, 130,
14-24.
Muhd Julkapli, N., Bagheri, S., & Bee Abd Hamid, S. (2014). Recent advances in
heterogeneous photocatalytic decolorization of synthetic dyes.
ScientificWorldJournal, 2014, 692307.

108
Murphy, A. (2007). Band-gap determination from diffuse reflectance measurements of
semiconductor films, and application to photoelectrochemical water-splitting.
Solar Energy Materials and Solar Cells, 91(14), 1326-1337.
Nandini, R., & Vishalakshi, B. (2012). A study of interaction of Methyl Orange with
some polycations. Journal of Chemistry, 9(1), 1-14.
Nawi, M., Jawad, A. H., Sabar, S., & Ngah, W. W. (2011). Immobilized bilayer TiO
2/chitosan system for the removal of phenol under irradiation by a 45watt compact
fluorescent lamp. Desalination, 280(1), 288-296.
Ngadi, N., Mahmud, M. A., Jusoh, M., Rahman, R. A., & Alias, H. (2014). Removal of
ethyl orange dye using hybrid chitosan and zinc oxide. Jurnal Teknologi, 67(1).
Norranattrakul, P., Siralertmukul, K., & Nuisin, R. (2013). Fabrication of
chitosan/titanium dioxide composites film for the photocatalytic degradation of
dye. Journal of Metals, Materials and Minerals, 23(2).
Oudenhoven, J., Scheijen, F., & Wollfs, M. (2004). Fundamental of photocatalytic water
splitting by visible light. Chemistry of Catalytic System 2: Photocatalysis, 1-22.
Pan, C., & Dong, L. (2011). Au/TiO2 Hierarchical Nanofibers Heterostructure:
Controllable Synthesis and Enhanced Photocatalytic Performances. Nanofibers–
Production, Properties and Functional Applications, 449.
Pan, X., Zhao, Y., Wang, S., & Fan, Z. (2013). TiO2/graphene nanocomposite for
photocatalytic application Materials and Processes for Energy: Communicating
Current Research and Technological Developments (pp. 913-920): Formatex.
Pereira, L., & Alves, M. (2012). Dyes—Environmental Impact and Remediation
Environmental protection strategies for sustainable development (pp. 111-162):
Springer.
Popa, M., Diamandescu, L., Vasiliu, F., Teodorescu, C., Cosoveanu, V., Baia, M., . . .
Danciu, V. (2009). Synthesis, structural characterization, and photocatalytic
properties of iron-doped TiO2 aerogels. Journal of Materials Science, 44(2), 358-
364.
Pu, Y.-C., Lin, W.-H., & Hsu, Y.-J. (2015). Modulation of charge carrier dynamics of Na
x H 2− x Ti 3 O 7-Au-Cu 2 O Z-scheme nanoheterostructures through size effect.
Applied Catalysis B: Environmental, 163, 343-351.
Schäffer, J. (2012). Immobilization of TiO2: via different routes for photocatalytic
reactions in a PDMS based microreactor.
Serpone, N., Borgarello, E., Harris, R., Cahill, P., Borgarello, M., & Pelizzetti, E. (1986).
Photocatalysis over TiO2 supported on a glass substrate. Solar Energy Materials,
14(2), 121-127.
Shao, X., Lu, W., Zhang, R., & Pan, F. (2013). Enhanced photocatalytic activity of TiO2-
C hybrid aerogels for methylene blue degradation. Scientific reports, 3.
109
Sonawane, R., Hegde, S., & Dongare, M. (2003). Preparation of titanium (IV) oxide thin
film photocatalyst by sol–gel dip coating. Materials chemistry and physics, 77(3),
744-750.
Spagnoli, R. A. (1992). Preparation of differential thickness coatings by dip coating
where the substrate is pivoted: Google Patents.
Stovall, H. (2007). Natural Alternatives to Conventional Wastewater Treatment: Jun.
Su, C., Hong, B.-Y., & Tseng, C.-M. (2004). Sol–gel preparation and photocatalysis of
titanium dioxide. Catalysis Today, 96(3), 119-126.
Subha, P., & Jayaraj, M. (2014). Solar photocatalytic degradation of methyl orange dye
using TiO2 nanoparticles synthesised by sol–gel method in neutral medium.
Journal of Experimental Nanoscience(ahead-of-print), 1-10.
Tachikawa, T., Yamashita, S., & Majima, T. (2011). Evidence for crystal-face-dependent
TiO2 photocatalysis from single-molecule imaging and kinetic analysis. J Am
Chem Soc, 133(18), 7197-7204.
Talebian, N., Nilforoushan, M. R., & Memarnezhad, P. (2013). Photocatalytic activities
of multilayered ZnO-based thin films prepared by sol–gel route: effect of SnO2
heterojunction layer. Journal of sol-gel science and technology, 65(2), 178-188.
Tseng, T. K., Lin, Y. S., Chen, Y. J., & Chu, H. (2010). A review of photocatalysts
prepared by sol-gel method for VOCs removal. Int J Mol Sci, 11(6), 2336-2361.
United States Environmental Protection Agency (USEPA), Office of Water, Development
Document for Proposed Effluent Limitations Guidelines and Standards for the
Centralized Waste Treatment Industry, Volume I, Chapter 8-Wastewater
Treatment Technologies, 1998.Vaiano, V., Sacco, O., Sannino, D., & Ciambelli,
P. (2015). Nanostructured N-doped TiO 2 coated on glass spheres for the
photocatalytic removal of organic dyes under UV or visible light irradiation.
Applied Catalysis B: Environmental, 170, 153-161.
Vaiano, V., Sacco, O., Sannino, D., & Ciambelli, P. (2015). Nanostructured N-doped TiO
2 coated on glass spheres for the photocatalytic removal of organic dyes under
UV or visible light irradiation. Applied Catalysis B: Environmental, 170, 153-161.
Villa, K., Murcia-López, S., Andreu, T., & Morante, J. R. (2015). Mesoporous WO 3
photocatalyst for the partial oxidation of methane to methanol using electron
scavengers. Applied Catalysis B: Environmental, 163, 150-155.
WANG, J., HUANG, D., LI, Z., LIU, G., & MIN, Y. (2015). Synthesis of TiO 2 with
Cotton as Template and Its Applications as Photocatalysis. Asian Journal of
Chemistry, 27(1).
Wang, S. (2014). 3 Stress on anti-abrasive performance of sol-gel derived nanocoatings.
Anti-Abrasive Nanocoatings: Current and Future Applications, 57.
110
Wang, X., Hu, Z., Chen, Y., Zhao, G., Liu, Y., & Wen, Z. (2009). A novel approach
towards high-performance composite photocatalyst of TiO 2 deposited on
activated carbon. Applied Surface Science, 255(7), 3953-3958.
Wei, X.-X., Cui, H., Guo, S., Zhao, L., & Li, W. (2013). Hybrid BiOBr–TiO 2
nanocomposites with high visible light photocatalytic activity for water treatment.
Journal of hazardous materials, 263, 650-658.
Wongkupasert, S. (2008). The effect of salt form and molecular weight of chitosan for
efficiency on sirna delivery into cell. Silpakorn University.
Xiao, J., Chen, W., Wang, F., & Du, J. (2013). Polymer/TiO2 hybrid nanoparticles with
highly effective UV-screening but eliminated photocatalytic activity.
Macromolecules, 46(2), 375-383.
Xu, S., Zhu, Y., Jiang, L., & Dan, Y. (2010). Visible light induced photocatalytic
degradation of methyl orange by polythiophene/TiO2 composite particles. Water,
Air, & Soil Pollution, 213(1-4), 151-159.
Yan, J., Wu, G., Guan, N., Li, L., Li, Z., & Cao, X. (2013). Understanding the effect of
surface/bulk defects on the photocatalytic activity of TiO 2: anatase versus rutile.
Physical Chemistry Chemical Physics, 15(26), 10978-10988.
Yao, K., Li, J., Yao, F., & Yin, Y. (2011). Chitosan-based hydrogels: functions and
applications: CRC Press.
Yoong, L., Chong, F. K., & Dutta, B. K. (2009). Development of copper-doped TiO 2
photocatalyst for hydrogen production under visible light. Energy, 34(10), 1652-
1661.
Zainal, Z., Hui, L. K., Hussein, M. Z., & Abdullah, A. H. (2009). Characterization of TiO
2–Chitosan/Glass photocatalyst for the removal of a monoazo dye via
photodegradation–adsorption process. Journal of hazardous materials, 164(1),
138-145.
Zhang, M., Bando, Y., & Wada, K. (2001). Sol-gel template preparation of TiO2
nanotubes and nanorods. Journal of materials science letters, 20(2), 167-170.
Zhang, X., Zhao, X., & Su, H. (2011). Degradation characteristic of TiO2-chitosan
adsorbent on Rhodamine B and purification of industrial wastewater. Korean
Journal of Chemical Engineering, 28(5), 1241-1246.
Zhang, Y., & Li, Q. (2013). Synthesis and characterization of Fe-doped TiO 2 films by
electrophoretic method and its photocatalytic activity toward methyl orange. Solid
State Sciences, 16, 16-20.
Zhu, Y., Chen, Z., Gao, T., Huang, Q., Niu, F., Qin, L., . . . Wang, Y. (2015). Construction
of hybrid Z-scheme Pt/CdS–TNTAs with enhanced visible-light photocatalytic
performance. Applied Catalysis B: Environmental, 163, 16-22.

111
Zhu, Y., Zhang, L., Gao, C., & Cao, L. (2000). The synthesis of nanosized TiO2 powder
using a sol-gel method with TiCl4 as a precursor. Journal of Materials Science,
35(16), 4049-4054.
112
LIST OF PUBLICATIONS AND PAPERS PRESENTED
7.1 Journals publication
7.1.1 Inorganic Review
113
7.1.2 International Journal of Environmental Science and Technology
114
7.2 Proceeding Papers
7.2.1 18 Malaysian International Chemical Congress
Location: PWTC, Kuala Lumpur
Date: Nov 2014
115
7.2.2 4th International Scientific Conference on Applied Sciences and Engineering
Location: Langkawi Lagoon Resort, Malaysia
Date: Oct 2015
Recommended